Abstract
Misfolding and aggregation of amyloid β1–42 peptide (Aβ1–42) play a central role in the pathogenesis of Alzheimer's disease (AD). Targeting the highly cytotoxic oligomeric species formed during the early stages of the aggregation process represents a promising therapeutic strategy to reduce the toxicity associated with Aβ1–42. Currently, the thioflavin T (ThT) assay is the only established spectrofluorometric method to screen aggregation inhibitors. The success of the ThT assay is that it can detect Aβ1–42 aggregates with high β‐sheet content, such as protofibrils or fibrils, which appear in the late aggregation steps. Unfortunately, by using the ThT assay, the detection of inhibitors of early soluble oligomers that present a low β‐sheet character is challenging. Herein, a new, facile, and robust boron‐dipyrromethene (BODIPY) real‐time assay suitable for 96‐well plate format, which allows screening of compounds as selective inhibitors of the formation of Aβ1–42 oligomers, is reported. These inhibitors decrease the cellular toxicity of Aβ1–42, although they fail in the ThT assay. The findings have been confirmed and validated by structural analysis and cell viability assays under comparable experimental conditions. It is demonstrated that the BODIPY assay is a convenient method to screen and discover new candidate compounds that slow down or stop the pathological early oligomerization process and are active in the cellular assay. Therefore, it is a suitable complementary screening method of the current ThT assay.
Keywords: Alzheimer's disease, amyloid beta-peptides, fluorescence, inhibitors, oligomerization
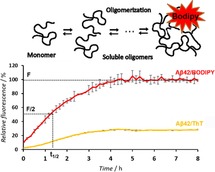
The sooner the better: Early amyloid beta (Aβ42) oligomers are known to be cytotoxic species in Alzheimer's disease. A real‐time boron‐dipyrromethene (BODIPY) fluorescence assay can be used to monitor the time course of the early stages of aggregation to provide valuable information on potential inhibitors of early Aβ42 oligomerization.
Alzheimer's disease (AD) is a devastating neurodegenerative disease that leads to progressive cognitive decline, functional impairment, and loss of independence.1 The number of people worldwide suffering from AD is expected to reach 75 million by 2030,2 but no causative treatment exists for AD. The search for small molecules that inhibit the aggregation of the 42‐residue amyloid β protein fragment (Aβ1–42; Figure 1 A) is still ongoing to find a therapy for AD. Aβ1–42 spontaneously self‐associates into soluble oligomers and insoluble aggregates, such as protofibrils and fibrils with high β‐sheet content. It has been recognized that small and soluble Aβ1–42 oligomers are particularly cytotoxic.3, 4, 5, 6, 7 Thus, therapeutic strategies that intervene in the early oligomerization process, rather than in the later fibril formation step, have recently attracted attention.8 However, despite its therapeutic significance, the screening of potential inhibitors of the early oligomerization process is still challenging. The thioflavin T (ThT) fluorescence assay is used routinely to determine the influence of compounds on amyloid aggregation kinetics.9, 10 However, ThT only exhibits a substantial fluorescence increase upon binding to β‐sheet‐rich amyloid protofilaments and fibrils, but has low sensitivity to soluble early‐stage oligomers.11, 12, 13, 14 Molecules that do not show any apparent inhibition of amyloid aggregation, according to the ThT assay, are usually not considered for any subsequent testing. It may be presumed that several lead compounds have been discarded, although they would be capable of preventing the formation of small cytotoxic oligomers. Conversely, a variety of compounds that were effective inhibitors in the ThT assay might have been evaluated for further preclinical trials, but later were discontinued because they interfered with fibril formation, but were ineffective at preventing the formation of cytotoxic oligomeric species.15 Consequently, the improvement of fluorescent probes to specifically detect oligomers is highly relevant and, in particular, the development of new screening assays specific for the early oligomerization process is of high current interest.16, 17, 18, 19, 20
Figure 1.
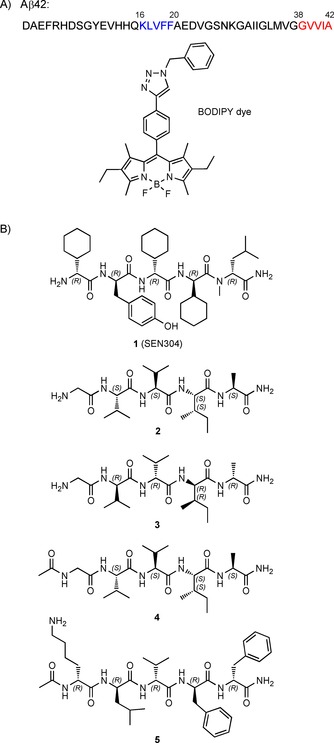
A) Primary sequence of Aβ1–42 peptide: in color, the two “hot spot” aggregation fragments; chemical structure of the boron‐dipyrromethene (BODIPY) dye employed in this study. B) Molecular structures of inhibitors of the Aβ1–42 aggregation process: SEN304 (1)1 and the four newly designed peptides, 2–5, employed in this study.
Herein, we report the development of a new real‐time 96‐well plate assay based on a BODIPY dye that is applicable to screen and discover new inhibitors of early Aβ1–42 oligomerization, which fail to be discovered in the typical ThT assay. The employed BODIPY dye, containing a triazole moiety (Figure 1 A), is a suitable probe for protein hydrophobicity and amyloid conformational transitions, even at a low dye concentration (0.53 μm).16 The BODIPY real‐time 96‐well plate assay combines high sensitivity towards Aβ1–42 soluble oligomers and statistical robustness of the kinetics curve obtained under oligomerization conditions. By testing five designed inhibitors, we were able to prove that the inhibitory activity detected by the BODIPY assay perfectly correlated with reduced Aβ1–42 toxicity on neuroblastoma cells. Furthermore, functional information provided by the novel BODIPY assay could be correlated with structural information of the inhibition process.
As a benchmark to compare BODIPY and ThT assays, we tested 1 (Figure 1 B); this is an established potent inhibitor of Aβ cytotoxicity able to perturb Aβ oligomer and fibril formation.21 Furthermore, four newly designed peptides, 2–5 (Figure 1 B), were investigated as inhibitors of the formation of toxic Aβ1–42 oligomers by targeting the two Aβ1–42 aggregation hot spots: KLVFF and GVVIA (Figure 1 A, in blue and red, respectively). Our selection was based on previous evidence that tetrapeptide derivatives of the C‐terminal part of Aβ (39–42) acted as suitable inhibitors of Aβ‐induced toxicity, but were poor inhibitors of fibril formation.22, 23, 24 Three new pentapeptide analogues of Aβ (38–42) were synthesized (2–4) to study whether the elongation of the sequence and/or the stereochemistry of the amino acids could influence the inhibitory activity. A glycine residue was additionally introduced to impart flexibility and to generate an anchor site for conjugation. Furthermore, the peptide Aβ (16–20), which corresponds to the hydrophobic central region of Aβ, plays an essential role in Aβ–Aβ interactions because it binds to β sheets and nucleates aggregation.25, 26, 27, 28 Therefore, the all‐d‐configured acetylated analogue, 5,29 was also tested.
In general, reproducibility is difficult to achieve when measuring and characterizing protein aggregation kinetics, mainly due to the existence of different species whose composition highly depends on the experimentally handling of amyloid peptides.30, 31
The ThT assay of Aβ1–42 routinely requires fast aggregation conditions mainly allowing for the detection of fibrils, named here as Protocol A (see the Supporting Information for experimental details).14 Under the same conditions, BODIPY detects both soluble oligomers and protofibrils (Figure 2 A and Figure S1 A in the Supporting Information). BODIPY fluorescence intensity already increases from the beginning of the kinetics, whereas the ThT fluorescence is maintained stably low up to 8 h (known as lag phase). As shown previously,32, 33, 34 under fast aggregation conditions, reproducibility is still a challenge; this is directly related to the difficulty of having Aβ1–42 in a monomeric form at the beginning of the aggregation, the formation of different species with different binding affinities for the dye, and the precipitation of insoluble fibrils.31
Figure 2.
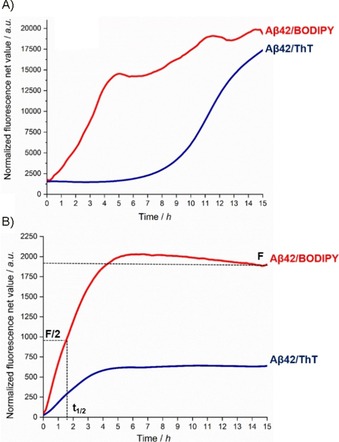
A comparison of BODIPY (red) and ThT (blue) fluorescence intensity over time in 96‐well plate format in the presence of Aβ1–42 (10 μm) during either A) fibril formation (Protocol A) or B) oligomerization (Protocol B).The data are presented as normalized fluorescence net values. The curves are represent the average of measurements made in triplicate from two different experiments (for error bars, see Figure S1 A and B). For details, see the Supporting Information.
In this context, a reconstitution protocol of Aβ1–42 that slows down the aggregation kinetics was developed, which is referred to herein as Protocol B (see the Supporting Information for experimental details). Under these slow aggregation conditions, time‐dependent Aβ1–42 oligomerization was followed by BODIPY or ThT dye in a 96‐well plate setup and compared. As expected, in the absence of fibrils, ThT fluorescence remained low during this experimental phase (Figures 2 B and S1 B, blue curve). Although both dyes showed an exponential kinetic curve, the increase in the fluorescence in the case of ThT was considerably lower than that of BODIPY (Figures 2 B and S1 B, red curve). Thus, by using only the ThT assay, it is challenging to compare between weak and potent inhibitors of oligomerization. The small increase in the signal could be associated to the fact that ThT fails to detect all types of oligomers, especially those with low amounts of β sheets, as described recently by Sang et al.12 On the other hand, the fluorescence intensity of BODIPY (Figures 2 B and S1 B, red curve) showed a pronounced exponential kinetic curve, as characterized by an elongation slope between 0 and 4 h and a steady state between 5 and 15 h (Figures 2 B and S1 B), followed by a slight increase at 24 h (Figure S1 C). The higher detection sensitivity of BODIPY is correlated not only to its higher receptiveness to hydrophobicity, but also to the β‐sheet structure, as described previously.16 Three parameters can be derived from the ThT and BODIPY fluorescence kinetic curves: t 1/2, which is defined as the time at which the fluorescence has reached 50 % of its maximum (as a measure of the process rate), the slope of the elongation phase of the curve (as a measure of the process rate), and F, which is the fluorescence value of the final plateau and is assumed to depend on the number of aggregates formed.
The presence of Aβ1–42 oligomers up to 8 h was confirmed by means of TEM analysis (Figure 3 A). The stability of oligomers under the oligomerization protocol was also observed by means of SDS‐PAGE analysis,21 even after heating in reducing Laemmli buffer (Figures 3 B and S2). At the early time points (0 and 2 h), bands corresponding to residual tri‐ (≈13.5 kDa), tetra‐ (≈18 kDa), and pentamers (≈22.5 kDa) were still observed, even under denaturing conditions. At the same time, deca‐ (≈45 kDa) and dodecamers (≈54 kDa), which are important in the etiology of AD,35 were fainter than that of the small, soluble oligomers, but, due to oligomerization, became slightly stronger at 4 and 8 h (Figures 3 B and S2). Moreover, time‐dependent CD experiments confirmed the slow transition from unordered to ordered oligomers in the first 3 h (Figure 3 C), as evident by the slow increase of the minima at λ≈215 nm and the maxima at λ=195 nm until 7 h. An isodichroic point was observed at λ=208 nm, which suggested a two‐state transition from random coil to β‐sheet conformation (Figure 3 C).36 CD deconvolution with the algorithm BeStSel37, 38 revealed an increase in the amount of β sheets within 1 h (Figures 3 D and S3). The ratio between β‐sheet structure and unordered conformation increased by 84 % for 5 h. The antiparallel β‐sheet structure, formed in the early oligomerization phase, is the major component that tends to increase during the first hour. Successively, the decrease in the antiparallel component is compensated for by an increase in the parallel one (Figure 3 D).
Figure 3.
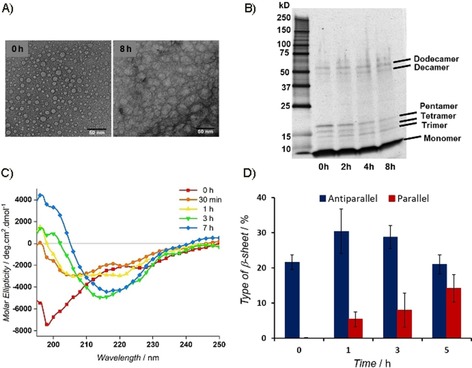
Time course of Aβ1–42 (10 μm) oligomerization in 20 mm phosphate‐buffered saline (PBS) at pH 7.4 (Protocol B). A) TEM images of Aβ1–42 at initial and final time points (8 h). B) SDS‐PAGE results showing the presence of monomeric and different small oligomeric species of Aβ1–42. C) Secondary structure of Aβ1–42 (25 μm) monitored by means of circular dichroism (CD). D) Estimated type of β‐sheet structure content, by deconvolution of CD results with the algorithm BeStSel.
Based on the abovementioned results, we screened compounds 2–5 as potential inhibitors of Aβ1–42 aggregation under the optimized experimental conditions in a 96‐well format (Figures 4 and S4). Protocol A, with the ThT assay, was employed to screen the inhibition of fibril formation (Figures 4 A, C, and S4). On the other hand, to screen oligomerization inhibitors, Protocol B and the BODIPY dye were used (Figures 4 B, D, and S5–S9). Each compound was tested at tenfold excess (100 μm) and at a 1:1 ratio (10 μm). For both experiments, the three valuable parameters (t 1/2, the slope of the curve, and F) for high‐throughput screening were obtained from the fluorescence curves and are compiled in Table 1. In Figure 4, we present the two time‐course fluorescence experiments for compounds 1 and 2 with either ThT or BODIPY. As expected, positive control 1 was active at both 10:1 and 1:1 ratios under both experimental conditions (Figures 4 A, B, S4, and S5 A). For screening with the ThT assay (Protocol A), no significant activity was observed for the C‐terminal analogues 2 (Figure 4 C and Table 1) and 4 at both ratios (Figure S4), whereas a slight delay of the aggregation in a concentration‐dependent manner was shown for the all‐d‐configured peptide 3 kinetic curve (Figure S4). Compound 5 proved to be a full inhibitor of fibril formation at a 10:1 ratio, whereas only a slight delay of the kinetics was observed at a 1:1 ratio (Figure S4). According to the ThT assay, the C‐terminal fragments (2, 3, and 4) are not inhibitors, whereas compounds 1 and 5 are efficient inhibitors of the fibril formation process (Table 1).
Figure 4.
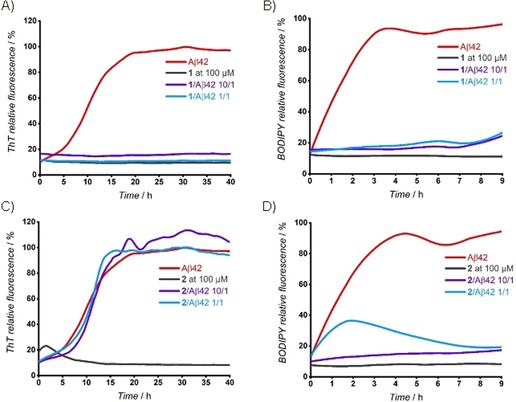
Time‐course fluorescence experiments with ThT (A and C; Protocol A: fibril formation) and BODIPY (B and D; Protocol B: oligomerization). Aβ1–42 (10 μm) without inhibitors (red) and in the presence of compounds 1 or 2 at compound/Aβ42 ratios of 10:1 (purple curve) and 1:1 (light blue curve). In all experiments, the interactions of 1 or 2 with the fluorescent dyes in the absence of Aβ42 are represented by a gray line. For experimental details and statistical analysis, see the Supporting Information.
Table 1.
Effects of compounds 1–5 on 10 μm Aβ42 fibril formation and oligomerization, as assessed by ThT‐ and BODIPY‐fluorescence spectroscopy, respectively. Compounds were tested at compound/Aβ42 ratios of 10:1 and 1:1 and compared with the values obtained for Aβ1–42 alone (t 1/2, F, and slope).
|
Fibril formation: Protocol A |
Oligomerization: Protocol B |
|||||
|---|---|---|---|---|---|---|
|
Compound |
t 1/2 extension/ |
F reduction |
Compound |
t 1/2 extension/ |
F reduction |
Slope |
|
(compound/Aβ ratio) |
reduction[a] |
[%][b] |
(compound/Aβ ratio) |
reduction[a] |
[%][b] |
reduction [%][c] |
|
1 (10:1) |
n.a.[c] |
−85±2 |
1 (10:1) |
n.a. |
−75 |
−99 |
|
1 (1:1) |
n.a. |
−89±2 |
1 (1:1) |
n.a. |
−73 |
−95 |
|
2 (10:1) |
n.e.[d] |
n.e. |
2 (10:1) |
n.a.[d] |
−81 |
−94 |
|
|
|
|
2 (5:1) |
n.a.[d] |
−82 |
−100 |
|
2 (1:1) |
n.e. |
n.e. |
2 (1:1) |
r.a.[e] (from 110 min) |
−80 |
−9 (110 min) |
|
3 (10:1) |
+77±15 |
n.e. |
3 (10:1) |
n.a. |
−78 |
−91 |
|
3 (1:1) |
+39±36 |
n.e. |
3 (1:1) |
r.a. (from 120 min) |
−47 |
+8 |
|
4 (10:1) |
−16±8 |
−14±4 |
4 (10:1) |
n.a. |
−78 |
−95 |
|
4 (1:1) |
−15±10 |
−15±5 |
4 (1:1) |
n.e. |
−8 |
−15 |
|
5 (10:1) |
n.a. |
−85±2 |
5 (10:1) |
n.a. |
−86 |
−93 |
|
5 (1:1) |
+154±23 |
n.e. |
5 (1:1) |
n.a. |
−84 |
−94 |
See the Supporting Information for details of the calculation of [a] t 1/2 extension, [b] F reduction, and [c] slope reduction. [d] n.a.: no aggregation. [e] r.a.: reduction of aggregation. [f] n.e.: no effect. Parameters are calculated from the mean curves, as derived by statistical analysis of data after triplicate measurements for each condition and at least two independent experiments.
On the other hand, the BODIPY fluorescence assay revealed that all designed peptides (2–5) interfered with early oligomer formation, as summarized in Table 1. Compounds 2 (Figures 4 D and S5 B, Table 1) and 4 (Figure S6) are both able to significantly reduce the BODIPY slope and fluorescence at 10:1 ratio, which indicates an inhibitory effect on the early oligomerization process. Importantly, only non‐acetylated analogue 2 still showed a substantial reduction of the fluorescence intensity at 1:1 ratio (Figures 4 D and S5 B). An additional experiment showed that the full inhibitory activity of 2 on the oligomerization process was maintained at a 5:1 ratio (Figure S7). Pentapeptide 3, which is the mirror image of 2, also suppressed oligomer formation at a 10:1 ratio, but at a 1:1 ratio only a slight inhibitory effect was observed (Figure S8). Non‐acetylated derivative 2 was more effective than that of its mirror image, 3, and its acetylated analogue, 4. This differs from the ThT test, in which compound 3 was more active than that of the other two. In summary, these results provide strong evidence that the C‐terminal fragments (2, 3, and 4) can inhibit and disrupt the early oligomerization process of Aβ1–42, but are not adequate at reducing late fibril formation. A promising effect was also observed for pentapeptide 5, which was revealed to be a very potent inhibitor of the oligomerization process and of the fibril formation. Compound 5 was able to almost fully suppress BODIPY fluorescence intensity, and thus, to dramatically decrease early oligomerization at both 10:1 and 1:1 ratios (Figure S9).
To validate the screening results obtained by the BODIPY assay, we tested the effective rescue of SH‐SY5Y neuroblastoma cells by using lead compounds 2, 4, and 5 in a 3‐(4,5‐dimethylthiazol‐2‐yl)‐5‐(3‐carboxymethoxyphenyl)‐2‐(4‐sulfophenyl)‐2H‐tetrazolium (MTS) viability assay (Figure 5). Positive controls 1 and resveratrol were included because of their known ability to rescue neuroblastoma cells from cytotoxic Aβ1–42. The addition of compound 2 showed a protective effect on the cells from cytotoxic Aβ1–42 oligomers at both 5:1 and 1:1 ratios (2/Aβ1–42). The N‐acetylated compound, 4, was active only at a 5:1 ratio, but the protective effect was lost at 1:1 ratio; this indicated that 4 was less efficient than that of 2 at reducing Aβ1–42 toxicity. This result is in accordance with the BODIPY assay, which shows the superiority of 2 over 4 at reducing the formation of toxic early oligomers. Neither compound, if incubated alone with cells at high concentration, showed any toxicity. The activity of 2 was very similar to that observed for compounds 1 and 5, which were inhibitors of both oligomerization and fibril formation (Figure 4). This demonstrates that the BODIPY assay is a valuable method for screening compounds that are either specific inhibitors of the oligomerization process or mixed inhibitors of both processes. Compound 1 was toxic itself to the SH‐SY5Y neuroblastoma cells, although this was not observed if Aβ was present, which suggested that its toxicity decreased upon interaction with Aβ1–42. On the contrary, compounds 2 and 5 did not show any toxicity if incubated alone with cells. The protective effect of 2 was also comparable to that of resveratrol, which currently is in clinical trials.39, 40
Figure 5.
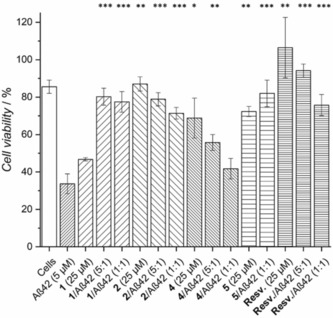
Cell viability assay results, representing the percentage of survival observed for cells incubated without Aβ42, with only inhibitors, and with 5 μm Aβ1–42 with or without the different inhibitors. A statistically significant difference between Aβ42‐treated cells with and without inhibitor is indicated by * p<0.05, ** p<0.01, and *** p<0.001; n=6 for each condition.
Finally, the behavior of lead compound 2 during the early stages of Aβ1–42 oligomerization was further investigated by means of SDS‐PAGE and CD spectroscopy analyses. In the SDS‐PAGE experiment, at a 5:1 ratio (compound 2/Aβ1–42), a change of the residual Aβ1–42 oligomer distribution was observed. It seems that 2 can reduce the formation of early oligomers, such as tri‐, tetra‐, and pentamers, but promotes the formation of species with a high molecular weight that, according to cell viability experiments, are not toxic to the cell (t=0; Figure 6 A). The change in the oligomerization pathway, compared to that of Aβ1–42 alone (Figure 3 B), might be responsible for the reduction of Aβ1–42 toxicity. CD spectroscopy of Aβ1–42 in the presence of 2 (Figure 6 B) indicates that 2 considerably increases the ordered state of Aβ1–42 from the early stages by increasing, in particular, the β‐sheet percentage (Figure S11). This suggests that a subtle change in Aβ1–42 conformation may reduce its toxicity, as shown in the cellular experiments. Further experiments will be performed to understand the exact mechanism of inhibition.41
Figure 6.
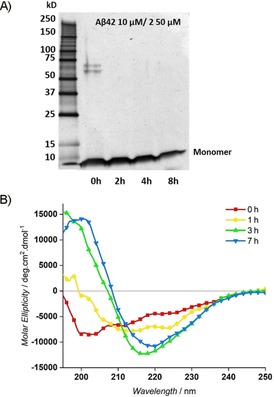
The Aβ42 oligomerization pathway in the presence of compound 2 in 20 mm PBS buffer at pH 7.4. A) SDS‐PAGE and silver‐stained glycine gel, showing the Aβ42 (10 μm) oligomeric species at 0, 2, 4, and 8 h in the presence of 50 μm 2 (2/Aβ42, 5:1); B) CD time‐dependent experiment of Aβ42 (20 μm) in the presence of 100 μm 2 (2/Aβ42, 5:1). Deconvolution was performed on the results of CD measurements, after subtraction of the corresponding buffer or the solution containing a 5:1 concentration of inhibitor.
In conclusion, the real‐time BODIPY assay is an efficient method to monitor the early stages of Aβ1–42 peptide oligomerization and to evaluate in vitro small peptide inhibitors of the toxic Aβ1–42 oligomerization pathway. In this regard, the BODIPY assay proved suitable for the discovery of new, active inhibitors of early oligomerization of Aβ1–42, such as compound 2, which did not interfere with the fibril formation process, and thus, was missed in the routine ThT screening assay. Importantly, the real‐time BODIPY‐binding 96‐well assay is suitable for the routine screening of larger compound libraries because of the reproducibility and statistical robustness, as demonstrated herein. Finally, our findings reveal that both screening methods are complementary to allow a more efficient screening of inhibitors that actively interfere in Aβ1–42 fibril formation and/or oligomerization and are active in the subsequent cellular assay. Therefore, the implementation of the real‐time BODIPY assay may facilitate the discovery of lead compounds that can selectively inhibit the early oligomerization of Aβ1–42.
Conflict of interest
The authors declare no conflict of interest.
Supporting information
As a service to our authors and readers, this journal provides supporting information supplied by the authors. Such materials are peer reviewed and may be re‐organized for online delivery, but are not copy‐edited or typeset. Technical support issues arising from supporting information (other than missing files) should be addressed to the authors.
Supplementary
Acknowledgements
We acknowledge Dr. Yvonne Hannappel for the acquisition of TEM images and Dr. Sarah Bregant for fruitful discussions.
N. Tonali, V. I. Dodero, J. Kaffy, L. Hericks, S. Ongeri, N. Sewald, ChemBioChem 2020, 21, 1129.
Contributor Information
Dr. Nicolo Tonali, Email: nicolo.tonali@u-psud.fr.
Prof. Dr. Norbert Sewald, Email: norbert.sewald@uni-bielefeld.de.
References
- 1. Panza F., Solfrizzi V., Imbimbo B. P., Tortelli R., Santamato A., Logroscino G., Rev. Clin. Immunol. 2014, 10, 405–419. [DOI] [PubMed] [Google Scholar]
- 2.M. Prince, A. Comas-Herrera, M. Knapp, M. Guerchet, M. Karagiannidou, World Alzheimer Report 2016, Alzheimer's Disease International, London, 2016, https://www.alz.co.uk/research/WorldAlzheimerReport2016.pdf.
- 3. Teplow D. B., Alzheimers Res. Ther. 2013, 5, 39–50. [DOI] [PMC free article] [PubMed] [Google Scholar]
- 4. Teplow D. B., Lazo N. D., Bitan G., Bernstein S., Wyttenbach T., Bowers M. T., Baumketner A., Shea J. E., Urbanc B., Cruz L., Borreguero J., Stanley H. E., Acc. Chem. Res. 2006, 39, 635–645. [DOI] [PubMed] [Google Scholar]
- 5. Prangkio P., Yusko E. C., Sept D., Yang J., Mayer M., PLoS One 2012, 7, e47261. [DOI] [PMC free article] [PubMed] [Google Scholar]
- 6. Cizas P., Budvytytec R., Morkuniene R., Moldovan R., Broccio M., Lösche M., Niaura G., Valincius G., Borutaite V., Arch. Biochem. Biophys. 2010, 496, 84–92. [DOI] [PMC free article] [PubMed] [Google Scholar]
- 7. Benilova I., Karran E., De Strooper B., Nat. Neurosci. 2012, 15, 349–357. [DOI] [PubMed] [Google Scholar]
- 8. McDade E., Bateman R. J., Nature 2017, 547, 153–155. [DOI] [PubMed] [Google Scholar]
- 9. Nilsson M. R., Methods 2004, 34, 151–160. [DOI] [PubMed] [Google Scholar]
- 10. Biancalana M., Koide S., Biochim. Biophys. Acta Proteins Proteomics 2010, 1804, 1405–1412. [DOI] [PMC free article] [PubMed] [Google Scholar]
- 11. Hawe A., Sutter M., Jiskoot W., Pharm. Res. 2008, 25, 1487–1499. [DOI] [PMC free article] [PubMed] [Google Scholar]
- 12. Sang J. C., Lee J.-E., Dear A. J., De S., Meisl G., Thackray A. M., Bujdoso R., Knowlesa T. P. J., Klenerman D., Chem. Sci. 2019, 10, 4588–4597. [DOI] [PMC free article] [PubMed] [Google Scholar]
- 13. Morel B., Carrasco M. P., Jurado S., Marcob C., Conejero-Lara F., Phys. Chem. Chem. Phys. 2018, 20, 20597–20614. [DOI] [PubMed] [Google Scholar]
- 14. Younan N. D., Viles J. H., Biochemistry 2015, 54, 4297–4306. [DOI] [PubMed] [Google Scholar]
- 15. Jameson L. P., Smith N. W., Dzyuba S. V., ACS Chem. Neurosci. 2012, 3, 807–819. [DOI] [PMC free article] [PubMed] [Google Scholar]
- 16. Smith N. W., Alonso A., Brown C. M., Dzyuba S. V., Biochem. Biophys. Res. Commun. 2010, 391, 1455–1458. [DOI] [PubMed] [Google Scholar]
- 17. Jameson L. P., Dzyuba S. V., Bioorg. Med. Chem. Lett. 2013, 23, 1732–1735. [DOI] [PMC free article] [PubMed] [Google Scholar]
- 18. Hammarström P., Simon R., Nyström S., Konradsson P., Aslund A., Nilsson K. P., Biochemistry 2010, 49, 6838–6845. [DOI] [PubMed] [Google Scholar]
- 19. Teoh C. L., Su D., Sahu S., Yun S. W., Drummond E., Prelli F., Lim S., Cho S., Ham S., Wisniewski T., Chang Y. T., J. Am. Chem. Soc. 2015, 137, 13503–13509. [DOI] [PMC free article] [PubMed] [Google Scholar]
- 20. Hatai J., Motiei L., Margulies D., J. Am. Chem. Soc. 2017, 139, 2136–2139. [DOI] [PubMed] [Google Scholar]
- 21. Amijee H., Bate C., Williams A., Virdee J., Jeggo R., Spanswick D., Scopes D. I. C., Treherne J. M., Mazzitelli S., Chawner R., Eyers C. E., Doig A. J., Biochemistry 2012, 51, 8338–8352. [DOI] [PubMed] [Google Scholar]
- 22. Zheng X., Wu C., Liu D., Li H., Bitan G., Shea J.-E., Bowers M. T., J. Phys. Chem. B 2016, 120, 1615–1623. [DOI] [PMC free article] [PubMed] [Google Scholar]
- 23. Gessel M. M., Wu C., Li H., Bitan G., Shea J.-E., Bowers M. T., Biochemistry 2012, 51, 108–117. [DOI] [PMC free article] [PubMed] [Google Scholar]
- 24. Li H., Du Z., Lopes D. H. J., Fradinger E. A., Wang C., Bitan G., J. Med. Chem. 2011, 54, 8451–8460. [DOI] [PMC free article] [PubMed] [Google Scholar]
- 25. Soto C., Siqurdsson E. M., Morelli L., Kumar R. A., Castaño E. M., Frangione B., Nat. Med. 1998, 4, 822–826. [DOI] [PubMed] [Google Scholar]
- 26. Soto C., Kindy M. S., Baumann M., Frangione B., Biochem. Biophys. Res. Commun. 1996, 226, 672–680. [DOI] [PubMed] [Google Scholar]
- 27. Takahashi T., Mihara H., Acc. Chem. Res. 2008, 41, 1309–1318. [DOI] [PubMed] [Google Scholar]
- 28. Neddenriep B., Calciano A., Conti D., Sauve E., Paterson M., Bruno E., Moffet D. A., Open Biotechnol. J. 2011, 5, 39–46. [DOI] [PMC free article] [PubMed] [Google Scholar]
- 29. Arai T., Araya T., Sasaki D., Taniguchi A., Sato T., Sohma Y., Kanai M., Angew. Chem. Int. Ed. 2014, 53, 8236–8239; [DOI] [PubMed] [Google Scholar]; Angew. Chem. 2014, 126, 8375–8378. [Google Scholar]
- 30. Benseny-Cases N., Klementiera O., Clesdera J., Subcell. Biochem. 2012, 65, 53–74. [DOI] [PubMed] [Google Scholar]
- 31. Giehm L., Otzen D. E., Anal. Biochem. 2010, 400, 270–281. [DOI] [PubMed] [Google Scholar]
- 32. Pellegrino S., Tonali N., Erba E., Kaffy J., Taverna M., Contini A., Taylor M., Allsop D., Taverna M., Ongeri S., Chem. Sci. 2017, 8, 1295–1302. [DOI] [PMC free article] [PubMed] [Google Scholar]
- 33. Kaffy J., Brinet D., Soulier J.-L., Correia I., Tonali N., Fera K. F., Iacone Y., Hoffmann A. R. F., Khemtémourian L., Crousse B., Taylor M., Allsop D., Taverna M., Lequin O., Ongeri S., J. Med. Chem. 2016, 59, 2025–2040. [DOI] [PubMed] [Google Scholar]
- 34. Tonali N., Kaffy J., Soulier J.-L., Gelmi M. L., Erba E., Taverna M., van Heijenoort C., Ha-Duong T., Ongeri S., Eur. J. Med. Chem. 2018, 154, 280–293. [DOI] [PubMed] [Google Scholar]
- 35. Bernstein S. L., Dupuis N. F., Lazo N. D., Wyttenbach T., Condron M. M., Bitan G., Teplow D. B., Shea J. E., Ruotolo B. T., Robinson C. V., Bowers M. T., Nat. Chem. 2009, 1, 326–331. [DOI] [PMC free article] [PubMed] [Google Scholar]
- 36. Herrera M. G., Zamarreno F., Costabel M., Ritacco H., Hütten A., Sewald N., Dodero V. I., Biopolymers 2014, 101, 96–106. [DOI] [PubMed] [Google Scholar]
- 37. Micsonai A., Wien F., Kernya L., Lee Y.-H., Goto Y., Réfrégiers M., Kardos J., Proc. Natl. Acad. Sci. USA 2015, 112, E3095–E3103. [DOI] [PMC free article] [PubMed] [Google Scholar]
- 38. Misra P., Kodali R., Chemuru S., Kar K., Wetzel R., Nat. Commun. 2016, 7, 12419. [DOI] [PMC free article] [PubMed] [Google Scholar]
- 39. Feng Y., Wang X.-P., Yang S. G., Wang Y. J., Zhang X., Du X. T., Sun X. X., Zhao M., Huang L., Liu R. T., NeuroToxicology 2009, 30, 986–995. [DOI] [PubMed] [Google Scholar]
- 40. Ladiwala A. R. A., Lin J. C., Bale S. S., Marcelino-Cruz A. M., Bhattacharya M., Dordick J. S., Tessier P. M., J. Biol. Chem. 2010, 285, 24228–24237. [DOI] [PMC free article] [PubMed] [Google Scholar]
- 41. Chia S., Habchi J., Michaels T. C. T., Cohen S. I. A., Linse S., Dobson C. M., Knowles T. P. J., Vendruscolo M., Proc. Natl. Acad. Sci. USA 2018, 115, 10245–10250. [DOI] [PMC free article] [PubMed] [Google Scholar]
Associated Data
This section collects any data citations, data availability statements, or supplementary materials included in this article.
Supplementary Materials
As a service to our authors and readers, this journal provides supporting information supplied by the authors. Such materials are peer reviewed and may be re‐organized for online delivery, but are not copy‐edited or typeset. Technical support issues arising from supporting information (other than missing files) should be addressed to the authors.
Supplementary


