Abstract
Genomes of many eukaryotic species have a defined three-dimensional architecture critical for cellular processes. They are partitioned into topologically associated domains (TADs), defined as regions of high chromatin inter-connectivity. While TADs are not a prominent feature of A. thaliana genome organization, they have been reported for other plants including rice, maize, tomato and cotton and for which TAD formation appears to be linked to transcription and chromatin epigenetic status. Here we show that in the rice genome, sequence variation and meiotic recombination rate correlate with the 3D genome structure. TADs display increased SNP and SV density and higher recombination rate compared to inter-TAD regions. We associate the observed differences with the TAD epigenetic landscape, TE composition and an increased incidence of meiotic crossovers.
Subject terms: Plant genetics, Genome
Golicz et al. report an increase in single nucleotide polymorphisms and structural variations across and within Topologically Associated Domains (TADs) in the rice genome, which is different to the pattern observed in the human genome. They show that this may be due to epigenetic modifications, transposable elements composition, and meiotic crossovers in the TAD regions.
Introduction
The mechanism and functional significance of DNA packaging in the nucleus has been a long-standing question in biology. The genomes of animals and plants are partitioned into chromatin domains, referred to as topologically associated domains (TADs)1,2. These are structural units of chromosome compartmentalization, which emerged as a key feature of higher-order genome organization. They define the regulatory landscapes of chromosomes, form units of co-regulated genes and confine the effect of distal regulatory elements3. The abundance of plant TADs is related to genome size; they are not prominent in the compact genome of Arabidopsis3–6, but more abundant in the larger genomes of rice, maize, tomato, sorghum, foxtail millet and cotton7–9. Rice TAD borders were reported to be associated with active epigenetic marks and high levels of transcription. Previous results also hinted at an asymmetric epigenetic mark and gene-density distribution across TAD borders7.
To broaden our understanding of plant TADs, here we asked whether the presence of TADs in the rice genome is associated with changes in nucleotide and structural variant density, using data from the 3000 Rice Genomes Project, the largest publicly available crop plant genome resequencing dataset, as well as the associated publicly available SNP and structural variant calls10–12. We found that the rice genome can be divided in TAD and inter-TAD regions. Compared to inter-TADs, TADs have increased sequence variant density, meiotic recombination rate, are over-represented in transposable elements (TEs) and silencing epigenetic marks. Genes found in TADs are shorter, have lower expression levels and are overrepresented in functions related to signalling and response to environmental stimuli.
Results
TAD discovery
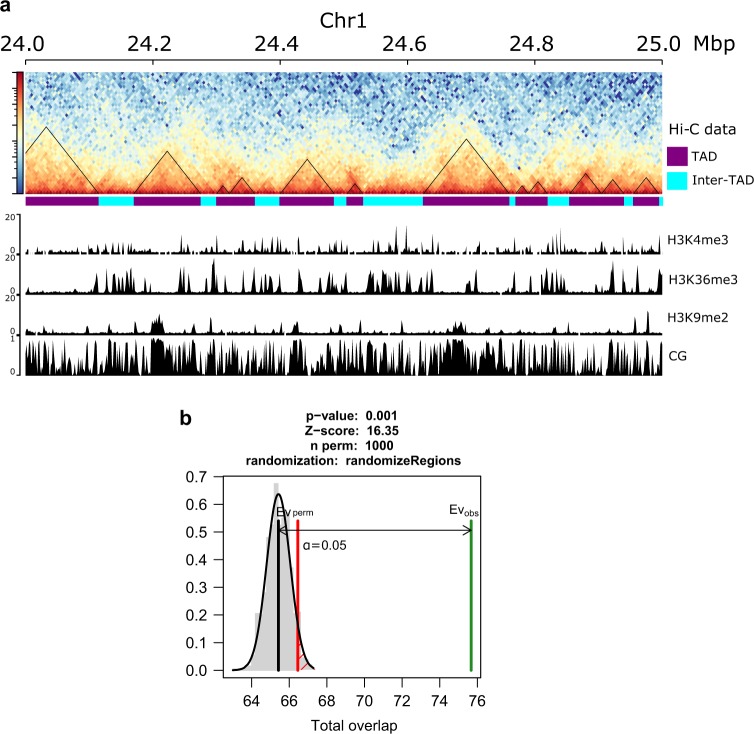
To date three Hi-C-based studies of the 3D conformation of the rice genome have been performed7,8,13. All three studies identified TADs, however, there were substantial differences in domain size, genome coverage by the domains identified as well as intra-domain interaction strength (Supplementary note, Supplementary Table 1). The differences most likely reflect the TAD discovery algorithms used as well as the underlying TAD definitions adopted. Liu et al.7 defined TADs only as regions of very strong interaction signals and the resulting TADs identified were relatively small (median size 45 to 50 kb) covering about a third of the genome, whereas TADs identified by Dong et al.8,13 were much larger (median size of 160 kb and 450 kb, respectively) covering higher proportion of the genome, but also had much lower median intra-TAD interaction signal (Supplementary Table 1). Together these results suggest that rice TADs, similar to what was found in metazoans14, could have hierarchical structure with smaller, densely interacting domains contained within larger scale domains of hundreds of kilo-base pairs. However, the analysis performed by Liu et al.7, as well as visual inspection of the interaction maps of rice genome (Fig. 1a), clearly indicates that there exist smaller regions of increased interactions, which manifest as strong triangular Hi-C signals15. We were intrigued by those and wondered whether any sequence features distinguish those from the remainder of the rice genome. We therefore used Armatus14, a software package designed specifically for the discovery of densely interacting domains and which has been shown to outperform both Arrowhead16 and DomainCaller17 algorithms in benchmarking comparisons18. We performed TAD discovery using all three rice Hi-C datasets available7,8,13, however, ultimately chose TADs identified by Armatus from Liu et al.7 dataset for final analysis, based on biological replicate concordance, number of valid pairs identified by Hi-C-Pro, TAD size and interaction strength (Supplementary note). We then compared the coordinates of 4599 TADs identified in our study with those reported by Liu et al7 and found that both sets of TADs overlap significantly more than it would be expected by chance alone (Fig. 1b, Supplementary data 1). We also investigated the distribution of epigenetic marks at TAD boundaries and found prominent H3K4me3, H3K9ac and H4K12ac peaks centred on TAD boundaries (Fig. 2, Supplementary Fig. 1), which is consistent with previous findings of enrichment of those epigenetic marks at rice TAD boundaries7,8,13. The TADs discovered had a median size of 35 kb and covered 69.7% of the rice genome, while regions falling outside of identified TADs (inter-TADs) had a median size of 25 kb and covered 30.3% of the rice genome.
Fig. 1. Distribution of TADs across the rice genome.
a Contact maps showing TADs across a section of rice chromosome 1. TADs identified as regions of high chromatin interactions by Armatus are outlined by black triangles. The remaining regions are inter-TADs. Tracks below Hi-C data present selected epigenetic modifications in TAD and inter-TAD regions. b Overlap between TADs called by Armatus in this study and those identified by Liu et al.7 Both sets of TADs overlap much more than it would be expected by chance alone. Green line—observed overlap, grey line—mean of simulated overlap, red line—significance threshold. TADs: n = 4599, inter-TADs: n = 3346.
Fig. 2. Variant profiles across human and rice TAD boundaries.
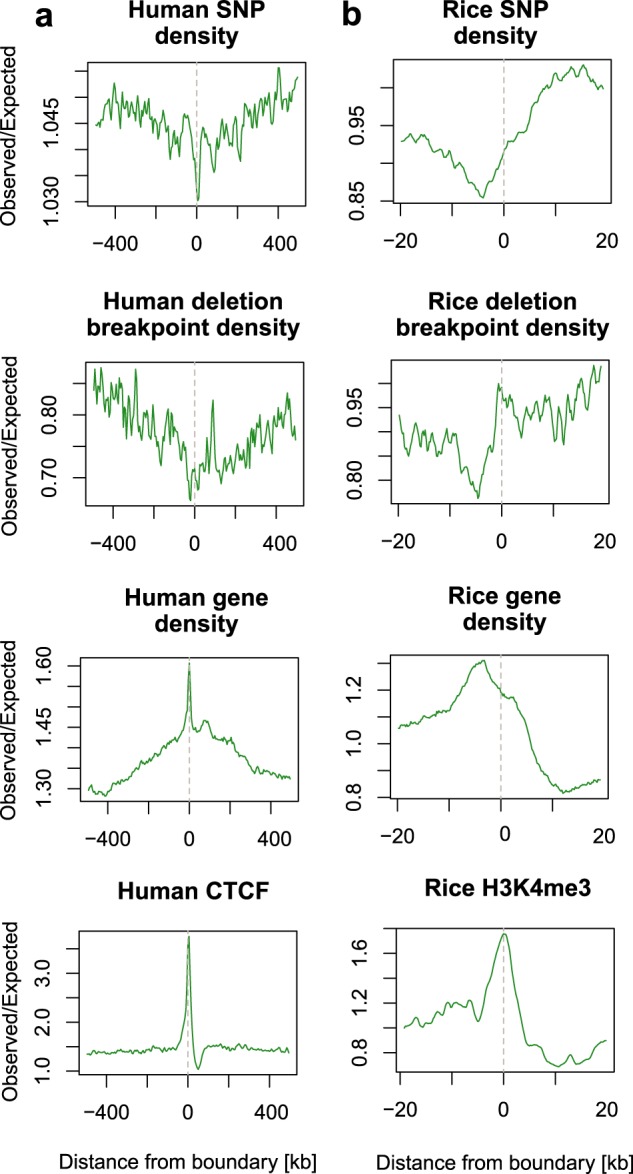
a Human variant profile across TAD boundaries. b Rice variant profile across TAD boundaries. For ease of comparisons with published literature following conventions of Liu et al.7 and Fudenberg et al.19 20 kb to the left and right of the boundary were shown for rice and 500 kb for human.
We then set out to explore whether there exist any genetic and epigenetic features which distinguish the densely interacting TADs (regions identified as TADs by Armatus) from inter-TAD regions (genomic regions falling outside of TADs identified by Armatus) (Fig. 1a).
Different variation profiles of rice and human TAD borders
A significantly reduced sequence variation is observed at TAD borders within the human genome, and this sequence conservation has been attributed to the requirement for boundary formation and recognition by boundary-binding proteins, including CTCF19. Deletion and mutation of TAD borders has in turn been linked to pathogenicity, including developmental disorders and cancers19,20. Although no CTCF homologue had been found in plants, homologues of cohesins are present2,21. One of the important outstanding questions regarding TAD formation in plants is whether sequence-specific boundary recognition is necessary for TAD formation. Genome-wide analysis of variant density allowed us to compare plant and human TAD boundary variant profiles.
Conservation of human TAD boundaries is reflected in SNP and structural variant distribution across the human genome19. When SNP and structural variant breakpoint density is plotted across TAD borders, there is a pronounced reduction in density exactly at the TAD border19 (Fig. 2a). Human TAD borders also display increased gene density17, which likely contributes to the variation profile observed (Fig. 2a). However, upon partitioning into genic and intergenic sequence the trend of reduced sequence variation at TAD boundary persists, supporting importance of boundary sequence conservation (Supplementary Fig. 2). We then employed the same apprach19 to study variant profile of TAD borders across the rice genome. We would expect that if there were a requirement for sequence recognition for boundary formation in rice, a similar reduction in variant density at TAD border would be found. However, in rice no immediate reduction in variant density at TAD boundary was observed (Fig. 2b). We did observe a reduction in variant density at ~5 kb before TAD boundary, but this most likely corresponds to an increase in gene density, as in contrast to what is observed in human, the 5 kb dip in variant density disappears upon partitioning into genic and intergenic sequence (Supplementary Fig. 2). The finding suggests that sequence conservation at TAD boundaries may be less important for rice than it is for human TAD formation. In addition, we noted an overall uneven distribution of both SNPs and SV breakpoints between TADs and inter-TADs, with TADs appearing to have a higher density of genomic variants.
Rice TADs have higher variant density compared to inter-TADs
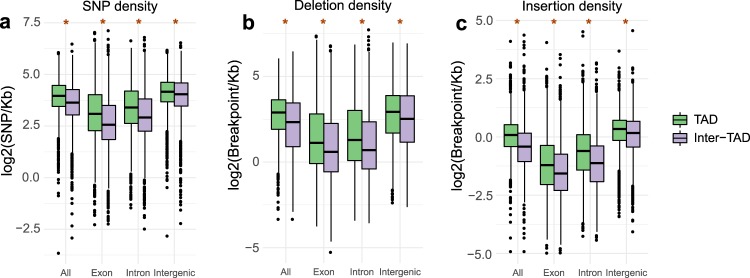
Having observed an asymmetry in variant distribution across TAD borders (Fig. 2), we then turned to comparisons of entire TAD and inter-TAD regions. First, we asked if TADs and inter-TADs differ in genomic variant distribution. We investigated the distribution of 6,495,641 SNPs, 3,534,001 deletion and 410,823 insertion breakpoints in the rice genome. We found that both SNP and structural variant breakpoint density is higher within rice TADs compared inter-TADs (Fig. 3). Rice TADs and inter-TAD regions differ in protein coding gene density (median TAD gene density—0.11 gene/kb, median inter-TAD gene-density—0.15 gene/kb, two-tailed Wilcoxon rank sum test p < 0.001) and gene bodies demonstrate reduced SNP and SV abundance compared to intergenic regions due to functional constraints11,12. To avoid bias due to differential gene density between regions, we partitioned the rice genome into exons, introns and intergenic sequence. Comparison of these domains demonstrated an increased SNP and insertion and deletion breakpoint density within TADs across both genic and intergenic sequences (Fig. 3). The results suggest that some properties of TADs, beyond differences in gene density, may contribute to their increased sequence variation.
Fig. 3. Variant density in TADs and inter-TAD regions.
a SNP, b deletion breakpoint and c insertion breakpoint density is significantly higher in TADs compared to inter-TAD regions. *p < 0.01, two-tailed Wilcoxon rank sum test, statistical tests were performed on non-log-transformed values. centre line, median; box limits, upper and lower quartiles; whiskers, 1.5× interquartile range; points, outliers.
Correlation between rice genomic and epigenomic features
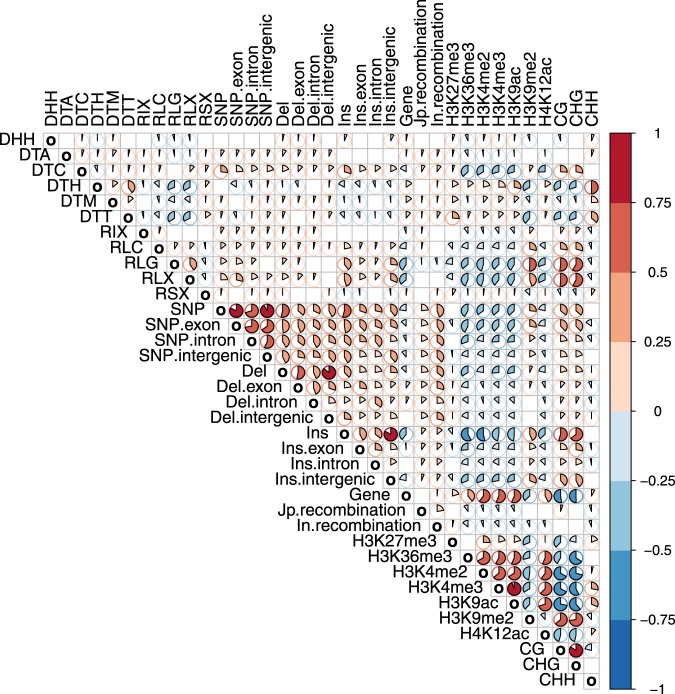
We wanted to investigate the potential causes for the differences in SNP and SV breakpoint density between TAD and inter-TAD regions. To that end we first performed a genome-wide analysis attempting to correlate different sequence and epigenetic features across the rice genome. A similar strategy has previously been used to for the analysis of human data and revealed that the chromatin state is a major influence on regional mutation rates22. For example, in human, H3K9 di- and tri- methylation and methylation in CG context have been associated with increased SNV mutation rate22–25. In medaka, a Japanese rice fish, DNA hypermethylation is associated with an increase in all types of single nucleotide substitutions, not just spontaneous oxidative de-amination of methylated CpG24. Some of the proposed mechanisms of action include alternative DNA repair pathways and impaired access of repair machinery due to chromatin compaction24,26. Similarly, our genome-wide analysis revealed significant positive correlation between SNP density across both genic and intergenic regions, CG and CHG DNA methylation and H3K9 di-methylation (Fig. 4, Supplementary Figs 3 and 4, Supplementary data 2). SNP density in both genic and intergenic regions was also positively correlated with transposable element density (especially CACTA DNA transposons and retrotransposons) revealing potential link between transposon density, heterochromatin and SNP accumulation. Transposons are subject to heterochromatic silencing associated with high levels of CG and CHG DNA methylation27, and heterochromatic silencing has been shown to spread to the surrounding sequences in maize28 and rice29. As transposon density as well as CG, CHG and H3K9me2 methylation are positively correlated with SNP density, heterochromatic spreading could contribute to SNP accumulation. Condensed chromatin self-organization30,31 could also impair access of the DNA repair machinery. In addition, compared with RNA transposons, DNA transposons had stronger positive correlation with deletion breakpoints, while RNA transposons were more strongly correlated with insertion breakpoints, in accordance with the postulated transposon origin of many reported rice SVs12. Finally, we observed an association between variant density and recombination rate, especially SNP density being positively correlated with recombination rate. The observation is in line with previous findings as increased SNP density was found to be associated with meiotic crossovers32–34.
Fig. 4. Correlations between different genomic and epigenomic features across the rice genome.
The genome was split into 40 kb bins for the analysis. Individual correlation plots can be obtained from Supplementary data 2. Red colour—positive correlation. Blue colour—negative correlation. Pie fill size is proportional to correlation. Plot presents Pearson correlations computed for log2-transformed values (Pearson and Spearman correlations for non-log-transformed values are shown in Supplementary Figs 3 and 4). Only significant correlations (cor.mtest implemented in package corrplot, p < 0.05) are shown. Del deletion, Ins insertion, Jp japonica, In indica. DHH—Helitron, DTA—hAT, DTC—CACTA, DTH—PIF-Harbinger, DTM—Mutator, DTT—Tc1-Mariner, RIX—LINE, RLC—LTR Copia, RLG—LTR Gypsy, RLX—LTR Superfamily unknown, RSX—SINE.
We then set out to test which of the features identified in this genome-wide analysis could contribute to increased variant density within TADs.
TADs and inter-TADs differ in epigenetic marks, TEs and recombination rate
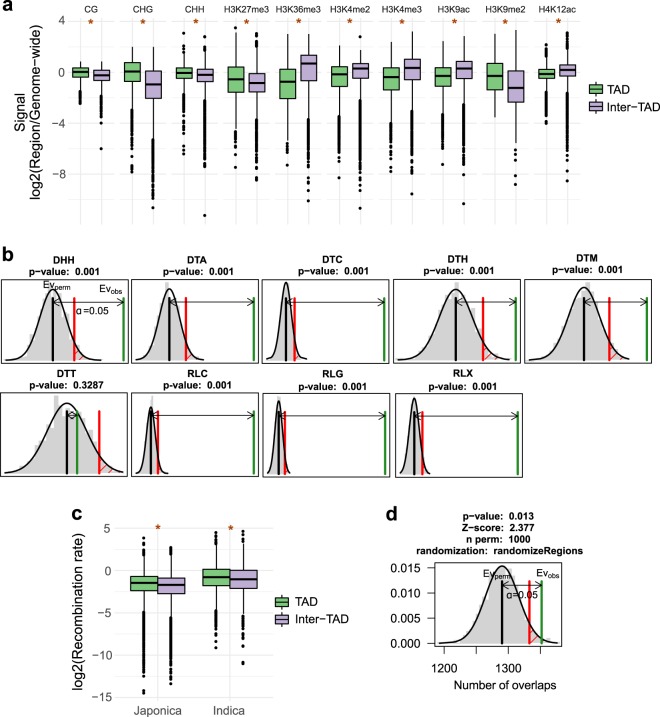
First, we compared levels of DNA methylation and histone modifications between TADs and inter-TAD regions. We found that TADs are lower in active and higher in repressive epigenetic marks compared to inter-TAD regions (Fig. 5a). TADs have a significantly higher CG and CHG DNA methylation and H3K9me2 levels than inter-TADs, a feature which has been shown to be mutagenic in humans22 and positively correlated with SNP density in our genome-wide analysis, suggesting that it could contribute to single nucleotide mutation accumulation in TADs. The results are also consistent with asymmetry in epigenetic marks across TAD boundaries observed (Supplementary Fig. 1) and previously reported7. We also observed that the proportion of C to T nucleotide substitution is higher in TADs than in inter-TADs (median fraction for TADs 0.2419, median fraction for inter-TADs 0.2277, two-tailed Wilcoxon rank sum test p < 0.001), suggesting that spontaneous oxidative de-amination of CpG may also add to the observed differences in sequence variation between TAD and inter-TAD regions. The findings suggest that chromatin state and epigenetic modifications may contribute to the differential single nucleotide variant accumulation across TAD and inter-TAD regions.
Fig. 5. Comparison of genomic and epigenomic features between TAD and inter-TAD regions.
a Histone and DNA modifications. TADs are higher in repressive and lower in active chromatin marks compared to inter-TAD regions. b Transposable element (TE) permutation analysis. Most TE classes are overrepresented in TADs. Green line—observed number of overlaps, grey line—mean of simulated overlaps, red line—significance threshold. Thousand permutations were performed. c Recombination rate. Recombination rate is significantly higher in TADs compared to inter-TAD regions. d Number of meiotic crossovers. Meiotic crossovers are significantly overrepresented in TADs. Green line—observed number of overlaps, grey line—mean of simulated overlaps, red line—significance threshold. *p < 0.01, two-tailed Wilcoxon rank sum test, statistical tests were performed on non-log-transformed values. Center line, median; box limits, upper and lower quartiles; whiskers, 1.5× interquartile range; points, outliers.
Increased presence of silencing marks is often associated with transposable elements (TEs)35 and our genome-wide analysis pointed to correlation between TEs, epigenetic silencing marks and variant density. We therefore investigated the TE composition of TADs and found differential TE partitioning between TAD and inter-TAD regions. We found that TADs are overrepresented in CACTA DNA transposons and retrotransposons (Fig. 5b), which have been found to be positively correlated with SNP density (Fig. 4). Increased TE density in TADs may promote heterochromatic silencing of the surrounding chromatin27,28 or condensed chromatin self-assembly30,31, which in turn could contribute to single nucleotide variant accumulation. In addition TEs in rice are associated with insertions and deletions12 (Fig. 4) and increased TE density in TADs most likely at least partially explains increased density of SV breakpoints.
Increased SNP density was previously found to be associated with meiotic crossovers32–34. Our genome-wide analysis also revealed significant positive correlation between SNP density and meiotic recombination rate (Fig. 4). We investigated whether TADs have a higher recombination rate and are more likely to overlap meiotic crossover (CO) events. We used two publicly available datasets, including 1067 unique breakpoints generated by resequencing of 38 rice F2 indica individuals33 and genome-wide recombination rate identified from 75 indica and 75 japonica accessions from the 3000 Rice Genomes Project34. We found that TADs have significantly higher recombination rate compared to inter-TAD regions (Fig. 5c). TADs overlapped more breakpoints than would be expected by chance (Fig. 5d). Interestingly, meiotic crossovers are also known to be associated with open chromatin state and high levels of H3K4me3, H3K9ac and H4K12ac34, which is decreased in TADs, compared to inter-TAD regions. On the other hand, retrotransposon methylation was shown to be positively correlated with recombination rate29. A mechanism integrating multiple contributing factors including the underlying genome sequence, epigenetic modifications and 3D chromatin structure likely controls meiotic crossover positioning and recombination rate.
Genes found in TADs and inter-TADs have different functions
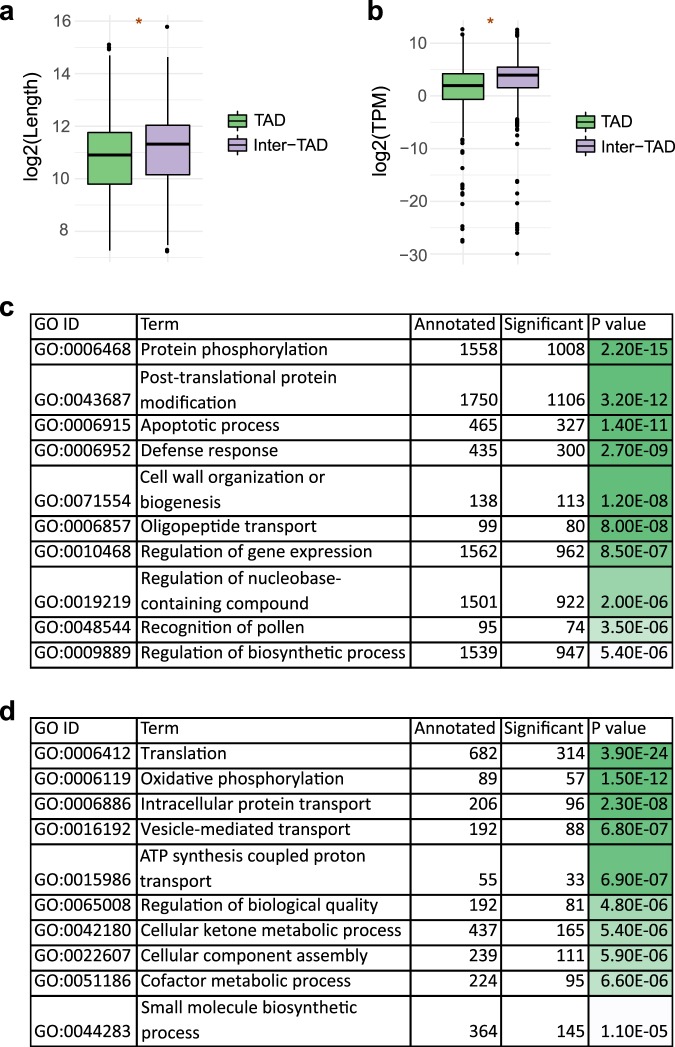
Our analysis suggests that the genome is effectively partitioned into TADs overrepresented in silent chromatin marks and transposable elements and inter-TAD regions associated with active chromatin. We were curious if the genes found within TADs and outside of TAD regions differ in any other properties beyond variant density. We found that genes found in inter-TAD regions are on average longer (Fig. 6a) and expressed at higher levels (Fig. 6b). We also searched for functional overrepresentation of TAD and inter-TAD genes. We found the inter-TAD genes to be overrepresented in functions related to translation, oxidative phosphorylation and protein transport (Fig. 6d) and the TAD genes to be overrepresented in functions related to protein phosphorylation and regulation of gene expression (Fig. 6c). The inter-TAD genes appear overrepresented in house-keeping functions while the TAD genes are overrepresented with functions related to signalling and responses to environmental stimuli.
Fig. 6. Genes in TAD and inter-TAD regions are significantly overrepresented in different functional categories.
a Gene length in TAD and inter-TAD regions. b Expression levels in TAD and inter-TAD regions. Genes within TADs have significantly lower expression levels. c GO terms overrepresented among genes found in TADs. d GO terms overrepresented among genes found in inter-TAD regions. *p < 0.01, two-tailed Wilcoxon rank sum test, statistical tests were performed on non-log-transformed values. Center line, median; box limits, upper and lower quartiles; whiskers, 1.5× interquartile range; points, outliers.
Discussion
Our observations mirror that made in Drosophila melanogaster, where a proposed model suggests that chromatin is divided in TADs and inter-TAD regions31. With inter-TADs harbouring active chromatin and genes overrepresented in house-keeping functions. Our observations point to a similar organization of the rice genome, which is also reminiscent of the compacted and loose structural domains identified in Arabidopsis, albeit at a smaller scale3–5. We also demonstrate that in contrast to human TAD borders, rice TAD borders do not show signatures of purifying selection, supporting the hypothesis that sequence recognition by insulating proteins in not necessary for TAD formation and consistent with the Drosophila model of TAD self-assembly due to an ability of inactive chromatin to aggregate31. We further extend those findings by analysis of sequence variants and find that TADs have a higher density of variants across both coding and non-coding regions. Our results suggest that beyond involvement in chromatin folding heterochromatic TADs may form a mutagenic environment which could contribute to variant accumulation, as increased SNP density was observed both across genic and non-genic regions.
Methods
TAD identification
The three existing rice Hi-C datasets were obtained from Sequence Read Archive (PRJNA391551, PRJNA354683, PRJNA429927)7,8,13. Interaction maps were built using Hi-C-Pro36 v2.11.1 at 5 kb pair resolution using rice genome MSU7/IRGSP1.037 as a reference. Interaction maps were first built separately for the biological replicates to investigate concordance between results obtained (Supplementary note) and biological replicates were then merged to obtain final interaction maps used for TAD identification. TADs were identified using Armatus14 v2.3. Several values of the γ parameter which controls TAD size were tested and the final value used was 0.4 (Supplementary note, Supplementary Table 2 and Supplementary Table 3).
Rice SNP and SV analysis
Rice genome and genome annotation (MSU7/IRGSP1.0) were downloaded from Phytozome v1238. SNP (3K RG 18mio base SNP Dataset) and SV (RG Large Structural Variants release 1.0) datasets were downloaded from SNP-Seek database39. SNPs were filtered to include only those found in Japonica and Indica lines with a minimum minor allele frequency of 0.01 using VCFtools40. SV variants were pre-filtered to include only those found in Japonica and Indica lines. Filtering was performed for consistency with Hi-C data (Japonica lines only) and recombination data (Japonica and Indica lines) available. For deletions, start and end coordinates were used as breakpoints. For insertions, start coordinates were used as breakpoints.
Rice recombination, epigenetic and expression data
Crossover breakpoints were obtained from ref. 33. Recombination rates across the rice genome were obtained from ref. 34. Histone modification ChIP-Seq data were obtained from PlantDHS41. DNA methylation data were obtained from MethBank42 v3.0. Gene expression data were obtained from ref. 7 (PRJNA354683). Expression levels were quantified using Kallisto43 v0.45.0.
Rice TE annotation
The non-redundant set of TEs was obtained from TREP database44. RepeatMasker v4.0.7, with default parameters using TREP database, was used to annotate the TEs in the rice genome.
Overlap analysis
The overlaps between TADs, genes, variants, histone and DNA modifications were computed using bedtools45 v2.28. The significance of overlap between Liu et al. TADs, crossover breakpoints, TEs and Armatus TADs was evaluated using regioneR46 v1.15.2 overlapPermTest function by random region re-distribution across the genome (randomizeRegions).
Relative abundance at TAD boundary
Relative abundance calculation was performed based on the score introduced by Fudenberg et al.19 with a minor adjustment of operating on densities rather than total counts and using a random re-distribution of windows rather than genome-wide abundance to obtain expected values to account for potential bias resulting from performing calculations on genomic windows.
Re-distribution of TAD boundaries across the rice genome was performed using randomizeRegions function of regioneR v1.15.2.
Genome-wide feature correlation analysis
The genome was split in 40 kb non-overlapping windows. Densities and signal levels for the corresponding genomic and epigenomic features were computed using bedtools45 v2.28 intersect and map functions. Pearson correlations were computed for log2-transformed and non-transformed values. Spearman correlations were computed for non-transformed values. Significance computed using cor.mtest implemented in package corrplot was used for significance testing (p < 0.05)). To avoid log2(0), 0.1 (median value of the entire dataset) was added to all values.
Gene ontology (GO) analysis
GO annotation was obtained from Agrigo247. TopGO48 v2.35.0 was used to compute functional overrepresentation of genes using method ‘weight’ to adjust for multiple comparisons.
Human genomic diversity analysis
Human 1000 genomes variants49 were downloaded from ENSEMBL and pre-filtered retaining only single nucleotide variants (SNVs) with minor allele frequency of over 0.01. Coordinates of human TADs were obtained from16 (GSE63525). Human deletions were obtained from50 (dbVar nstd100).
Statistics and reproducibility
Differences between TADs and inter-TADs were tested for statistical significance using two-tailed Wilcoxon rank sum test implemented in R. Overrepresentation of features within TADs was tested for statistical significance using permutation test implemented in regioneR. Pearson and Spearman correlations were computed using cor function in R and significance was computed using cor.mtest function implemented in the package corrplot. Enrichment of GO terms was analyzed suing topGO package, using method ‘weight’ to adjust for multiple comparisons.
Reporting summary
Further information on research design is available in the Nature Research Reporting Summary linked to this article.
Supplementary information
Acknowledgements
We would like to thank Dr Philipp Bayer for the valuable comments on the manuscript. This work was supported the University of Melbourne McKenzie Fellowship.
Author contributions
AAG conceived the study, designed the experiments, performed the analysis and wrote the manuscript, PLB and MBS edited the manuscript, DE provided critical comments on the study design and edited the manuscript. This research was supported by Spartan HPC at the University of Melbourne, Australia.
Data availability
All data used in the manuscript is publicly available (See “Methods”).
Supplementary data 1 and 2 can be found under https://osf.io/hevzb/.
Code availability
No custom code or mathematical algorithm central to the conclusions was used.
Competing interests
Authors declare no competing interests.
Footnotes
Publisher’s note Springer Nature remains neutral with regard to jurisdictional claims in published maps and institutional affiliations.
Supplementary information
Supplementary information is available for this paper at 10.1038/s42003-020-0932-2.
References
- 1.Dixon JesseR, Gorkin, David U, Ren B. Chromatin domains: the unit of chromosome organization. Mol. Cell. 2016;62:668–680. doi: 10.1016/j.molcel.2016.05.018. [DOI] [PMC free article] [PubMed] [Google Scholar]
- 2.Sotelo-Silveira M, Chavez Montes RA, Sotelo-Silveira JR, Marsch-Martinez N, de Folter S. Entering the next dimension: plant genomes in 3D. Trends Plant Sci. 2018;23:598–612. doi: 10.1016/j.tplants.2018.03.014. [DOI] [PubMed] [Google Scholar]
- 3.Feng S, et al. Genome-wide Hi-C analyses in wild-type and mutants reveal high-resolution chromatin interactions in arabidopsis. Mol. Cell. 2014;55:694–707. doi: 10.1016/j.molcel.2014.07.008. [DOI] [PMC free article] [PubMed] [Google Scholar]
- 4.Grob S, Schmid, Marc W, Grossniklaus U. Hi-C analysis in arabidopsis identifies the KNOT, a structure with similarities to the flamenco locus of Drosophila. Mol. Cell. 2014;55:678–693. doi: 10.1016/j.molcel.2014.07.009. [DOI] [PubMed] [Google Scholar]
- 5.Wang C, et al. Genome-wide analysis of local chromatin packing in Arabidopsis thaliana. Genome Res. 2015;25:246–256. doi: 10.1101/gr.170332.113. [DOI] [PMC free article] [PubMed] [Google Scholar]
- 6.Liu C, et al. Genome-wide analysis of chromatin packing in Arabidopsisthaliana at single-gene resolution. Genome Res. 2016;26:1057–1068. doi: 10.1101/gr.204032.116. [DOI] [PMC free article] [PubMed] [Google Scholar]
- 7.Liu C, Cheng YJ, Wang JW, Weigel D. Prominent topologically associated domains differentiate global chromatin packing in rice from Arabidopsis. Nat. Plants. 2017;3:742–748. doi: 10.1038/s41477-017-0005-9. [DOI] [PubMed] [Google Scholar]
- 8.Dong P, et al. 3D chromatin architecture of large plant genomes determined by local A/B compartments. Mol. Plant. 2017;10:1497–1509. doi: 10.1016/j.molp.2017.11.005. [DOI] [PubMed] [Google Scholar]
- 9.Wang M, et al. Evolutionary dynamics of 3D genome architecture following polyploidization in cotton. Nat. Plants. 2018;4:90–97. doi: 10.1038/s41477-017-0096-3. [DOI] [PubMed] [Google Scholar]
- 10.Wang W, et al. Genomic variation in 3,010 diverse accessions of Asian cultivated rice. Nature. 2018;557:43–49. doi: 10.1038/s41586-018-0063-9. [DOI] [PMC free article] [PubMed] [Google Scholar]
- 11.Tatarinova TV, et al. Nucleotide diversity analysis highlights functionally important genomic regions. Sci. Rep. 2016;6:35730. doi: 10.1038/srep35730. [DOI] [PMC free article] [PubMed] [Google Scholar]
- 12.Fuentes, R. R. et al. Structural variants in 3000 rice genomes. Genome Res.29, 870–880 (2019). [DOI] [PMC free article] [PubMed]
- 13.Dong Q, et al. Genome-wide Hi-C analysis reveals extensive hierarchical chromatin interactions in rice. Plant J. 2018;94:1141–1156. doi: 10.1111/tpj.13925. [DOI] [PubMed] [Google Scholar]
- 14.Filippova D, Patro R, Duggal G, Kingsford C. Identification of alternative topological domains in chromatin. Algorithms Mol. Biol. 2014;9:14. doi: 10.1186/1748-7188-9-14. [DOI] [PMC free article] [PubMed] [Google Scholar]
- 15.Grob S. Plants are not so different. Nat. Plants. 2017;3:690–691. doi: 10.1038/s41477-017-0013-9. [DOI] [PubMed] [Google Scholar]
- 16.Rao SSP, et al. A 3D map of the human genome at kilobase resolution reveals principles of chromatin looping. Cell. 2014;159:1665–1680. doi: 10.1016/j.cell.2014.11.021. [DOI] [PMC free article] [PubMed] [Google Scholar]
- 17.Dixon JR, et al. Topological domains in mammalian genomes identified by analysis of chromatin interactions. Nature. 2012;485:376–380. doi: 10.1038/nature11082. [DOI] [PMC free article] [PubMed] [Google Scholar]
- 18.Forcato M, et al. Comparison of computational methods for Hi-C data analysis. Nat. Methods. 2017;14:679–685. doi: 10.1038/nmeth.4325. [DOI] [PMC free article] [PubMed] [Google Scholar]
- 19.Fudenberg G, Pollard KS. Chromatin features constrain structural variation across evolutionary timescales. Proc. Natl Acad. Sci. USA. 2019;116:2175. doi: 10.1073/pnas.1808631116. [DOI] [PMC free article] [PubMed] [Google Scholar]
- 20.Kaiser VB, Semple CA. When TADs go bad: chromatin structure and nuclear organisation in human disease. F1000Research. 2017;6:314. doi: 10.12688/f1000research.10792.1. [DOI] [PMC free article] [PubMed] [Google Scholar]
- 21.Wood AJ, Severson AF, Meyer BJ. Condensin and cohesin complexity: the expanding repertoire of functions. Nat. Rev. Genet. 2010;11:391–404. doi: 10.1038/nrg2794. [DOI] [PMC free article] [PubMed] [Google Scholar]
- 22.Schuster-Böckler B, Lehner B. Chromatin organization is a major influence on regional mutation rates in human cancer cells. Nature. 2012;488:504. doi: 10.1038/nature11273. [DOI] [PubMed] [Google Scholar]
- 23.Carlson J, et al. Extremely rare variants reveal patterns of germline mutation rate heterogeneity in humans. Nat. Commun. 2018;9:3753–3753. doi: 10.1038/s41467-018-05936-5. [DOI] [PMC free article] [PubMed] [Google Scholar]
- 24.Qu W, et al. Genome-wide genetic variations are highly correlated with proximal DNA methylation patterns. Genome Res. 2012;22:1419–1425. doi: 10.1101/gr.140236.112. [DOI] [PMC free article] [PubMed] [Google Scholar]
- 25.Mugal CF, Ellegren H. Substitution rate variation at human CpG sites correlates with non-CpG divergence, methylation level and GC content. Genome Biol. 2011;12:R58–R58. doi: 10.1186/gb-2011-12-6-r58. [DOI] [PMC free article] [PubMed] [Google Scholar]
- 26.Sun L, et al. Preferential protection of genetic fidelity within open chromatin by the mismatch repair machinery. J. Biol. Chem. 2016;291:17692–17705. doi: 10.1074/jbc.M116.719971. [DOI] [PMC free article] [PubMed] [Google Scholar]
- 27.West PT, et al. Genomic distribution of H3K9me2 and DNA methylation in a maize genome. PLOS ONE. 2014;9:e105267. doi: 10.1371/journal.pone.0105267. [DOI] [PMC free article] [PubMed] [Google Scholar]
- 28.Eichten SR, et al. Spreading of heterochromatin is limited to specific families of maize retrotransposons. PLOS Genet. 2012;8:e1003127. doi: 10.1371/journal.pgen.1003127. [DOI] [PMC free article] [PubMed] [Google Scholar]
- 29.Choi JY, Purugganan MD. Evolutionary epigenomics of retrotransposon-mediated methylation spreading in rice. Mol. Biol. Evolution. 2017;35:365–382. doi: 10.1093/molbev/msx284. [DOI] [PMC free article] [PubMed] [Google Scholar]
- 30.Gavrilov AA, et al. Unraveling the mechanisms of chromatin fibril packaging. Nucleus. 2016;7:319–324. doi: 10.1080/19491034.2016.1190896. [DOI] [PMC free article] [PubMed] [Google Scholar]
- 31.Ulianov SV, et al. Active chromatin and transcription play a key role in chromosome partitioning into topologically associating domains. Genome Res. 2016;26:70–84. doi: 10.1101/gr.196006.115. [DOI] [PMC free article] [PubMed] [Google Scholar]
- 32.Makova KD, Hardison RC. The effects of chromatin organization on variation in mutation rates in the genome. Nat. Rev. Genet. 2015;16:213–223. doi: 10.1038/nrg3890. [DOI] [PMC free article] [PubMed] [Google Scholar]
- 33.Si W, et al. Widely distributed hot and cold spots in meiotic recombination as shown by the sequencing of rice F2 plants. N. Phytol. 2015;206:1491–1502. doi: 10.1111/nph.13319. [DOI] [PubMed] [Google Scholar]
- 34.Marand AP, et al. Historical meiotic crossover hotspots fueled patterns of evolutionary divergence in rice. Plant Cell. 2019;31:645. doi: 10.1105/tpc.18.00750. [DOI] [PMC free article] [PubMed] [Google Scholar]
- 35.Sigman MJ, Slotkin RK. The first rule of plant transposable element silencing: location, location, location. Plant Cell. 2016;28:304. doi: 10.1105/tpc.15.00869. [DOI] [PMC free article] [PubMed] [Google Scholar]
- 36.Servant N, et al. HiC-Pro: an optimized and flexible pipeline for Hi-C data processing. Genome Biol. 2015;16:259. doi: 10.1186/s13059-015-0831-x. [DOI] [PMC free article] [PubMed] [Google Scholar]
- 37.Kawahara Y, et al. Improvement of the Oryza sativa Nipponbare reference genome using next generation sequence and optical map data. Rice. 2013;6:4. doi: 10.1186/1939-8433-6-4. [DOI] [PMC free article] [PubMed] [Google Scholar]
- 38.Goodstein DM, et al. Phytozome: a comparative platform for green plant genomics. Nucleic Acids Res. 2012;40:D1178–D1186. doi: 10.1093/nar/gkr944. [DOI] [PMC free article] [PubMed] [Google Scholar]
- 39.Mansueto L, et al. Rice SNP-seek database update: new SNPs, indels, and queries. Nucleic Acids Res. 2017;45:D1075–D1081. doi: 10.1093/nar/gkw1135. [DOI] [PMC free article] [PubMed] [Google Scholar]
- 40.Danecek P, et al. The variant call format and VCFtools. Bioinformatics. 2011;27:2156–2158. doi: 10.1093/bioinformatics/btr330. [DOI] [PMC free article] [PubMed] [Google Scholar]
- 41.Zhang T, Marand AP, Jiang J. PlantDHS: a database for DNase I hypersensitive sites in plants. Nucleic Acids Res. 2016;44:D1148–D1153. doi: 10.1093/nar/gkv962. [DOI] [PMC free article] [PubMed] [Google Scholar]
- 42.Li R, et al. MethBank 3.0: a database of DNA methylomes across a variety of species. Nucleic Acids Res. 2018;46:D288–D295. doi: 10.1093/nar/gkx1139. [DOI] [PMC free article] [PubMed] [Google Scholar]
- 43.Bray NL, Pimentel H, Melsted P, Pachter L. Near-optimal probabilistic RNA-seq quantification. Nat. Biotechnol. 2016;34:525–527. doi: 10.1038/nbt.3519. [DOI] [PubMed] [Google Scholar]
- 44.Wicker T, Matthews DE, Keller B. TREP: a database for Triticeae repetitive elements. Trends Plant Sci. 2002;7:561–562. doi: 10.1016/S1360-1385(02)02372-5. [DOI] [Google Scholar]
- 45.Quinlan AR, Hall IM. BEDTools: a flexible suite of utilities for comparing genomic features. Bioinformatics. 2010;26:841–842. doi: 10.1093/bioinformatics/btq033. [DOI] [PMC free article] [PubMed] [Google Scholar]
- 46.Gel B, et al. regioneR: an R/Bioconductor package for the association analysis of genomic regions based on permutation tests. Bioinformatics. 2015;32:289–291. doi: 10.1093/bioinformatics/btv562. [DOI] [PMC free article] [PubMed] [Google Scholar]
- 47.Tian T, et al. agriGO v2.0: a GO analysis toolkit for the agricultural community, 2017 update. Nucleic Acids Res. 2017;45:W122–W129. doi: 10.1093/nar/gkx382. [DOI] [PMC free article] [PubMed] [Google Scholar]
- 48.Alexa A, Rahnenführer J, Lengauer T. Improved scoring of functional groups from gene expression data by decorrelating GO graph structure. Bioinformatics. 2006;22:1600–1607. doi: 10.1093/bioinformatics/btl140. [DOI] [PubMed] [Google Scholar]
- 49.Genomes Project C, et al. A global reference for human genetic variation. Nature. 2015;526:68–74. doi: 10.1038/nature15393. [DOI] [PMC free article] [PubMed] [Google Scholar]
- 50.Coe BP, et al. Refining analyses of copy number variation identifies specific genes associated with developmental delay. Nat. Genet. 2014;46:1063–1071. doi: 10.1038/ng.3092. [DOI] [PMC free article] [PubMed] [Google Scholar]
Associated Data
This section collects any data citations, data availability statements, or supplementary materials included in this article.
Supplementary Materials
Data Availability Statement
All data used in the manuscript is publicly available (See “Methods”).
Supplementary data 1 and 2 can be found under https://osf.io/hevzb/.
No custom code or mathematical algorithm central to the conclusions was used.


