

Abstract
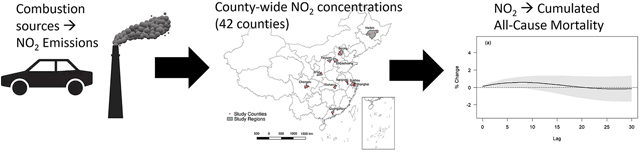
Nitrogen dioxide (NO2) is a well-established traffic emissions tracer and has been associated with multiple adverse health outcomes. Short- and long-term exposure to NO2 has been studied and is well-documented in existing literature, but information on intermediate-term NO2 effects and mortality is lacking, despite biological plausibility. We obtained daily NO2 and mortality data from 42 counties in China from 2013 to 2015. Distributed-lag non-linear models were employed to investigate the relationship between non-accidental mortality and NO2 up to 30 days before the event, including PM2.5, temperature, relative humidity, and holidays as covariates in a random effects meta-analysis pooling county-specific estimates. We repeated the analysis for cardiovascular- and respiratory-related mortality, and explored sex-stratified associations. Per 10 μg/m3 increase in NO2, we estimated a 0.13% (95%CI: 0.03, 0.23%), 0.57% (95%CI: −0.04, 1.18%), and −0.14% (95%CI: −1.63, 1.37%) change in non-accidental mortality for same-day and previous-day NO2 (lag0–1 cumulated), in the preceding 7 days (lag0–7 cumulated), and in the preceding 30 days (lag0–30 cumulated), respectively. The strongest estimate was observed for respiratory-related mortality in the lag0–30 cumulated effect for women (3.12%; 95%CI: −1.66, 8.13%). We observed a trend of higher effect estimates of intermediate-term NO2 exposure on respiratory mortality compared to that of the short-term, although the differences were not statistically significant. Our results at longer lags for all-cause and cardiovascular mortality were sensitive to modeling choices. Future work should further investigate intermediate-term air pollution exposure given their potential biological relevance, but in larger scale settings.
Keywords: air pollution, nitrogen dioxide, epidemiology, intermediate-term effects, random-effects meta-analysis
Graphical Abstract
Capsule:
Investigating the effects of mortality and NO2 up to 30 days prior to exposure, we found positive, albeit insignificant, associations with respiratory mortality, with cumulated effect estimates of over 3% increase in mortality per 10 μg/m3 increase in ambient NO2.
INTRODUCTION
Ambient air pollution is one of the leading environmental problems of the 21st century. Air pollutants such as fine particulate matter (particles with aerodynamic diameter ≤ 2.5μm; PM2.5) have been consistently linked with increases in mortality and morbidity (Di et al., 2017; Dockery et al., 1993; Guo et al., 2016; Kioumourtzoglou et al., 2015; Pope et al., 2002). The Global Burden Diseases, Injuries, and Risk Factors Study 2015 (GBD 2015) estimated that exposure to PM2.5 caused 4.2 million deaths in 2015, representing 7.6% of total global deaths (Cohen et al., 2017). Numerous existing epidemiologic studies have also linked many other air pollutants to increased mortality, including ozone (O3) (Bell et al., 2005; Di et al., 2017; Jerrett et al., 2009; Kinney and Özkaynak, 1991; Madrigano et al., 2015), sulfur dioxide (SO2) (Chen et al., 2008; Kan et al., 2010; Katsouyanni et al., 1997), and also nitrogen dioxide (NO2) (Chiusolo et al., 2017).
NO2 is a highly reactive gas and a primary pollutant from a variety of sources, especially from the combustion of fossil fuel (Friis, 2012; Koenig, 2000). As such, it is a well-established traffic emissions tracer (Seinfeld and Pandis, 2016; U.S. Environmental Protection Agency (EPA), 2016) and a regularly monitored air pollutant around the world. Existing studies conducted in North America and Europe have linked both short-term (i.e. daily) and long-term (i.e. annual) exposure to NO2 to increased mortality (Chiusolo et al., 2017; Crouse et al., 2015; Faustini et al., 2014). In vitro studies have also reported that NO2 is associated with cellular inflammation, bronchial hyperresponsiveness, and increased risk of infection, particularly in the respiratory system (Koenig, 2000). Furthermore, mechanistic studies have linked intermediate-term (i.e. monthly) exposure to NO2 and black carbon (a PM2.5 component also commonly used as a traffic emissions tracer) to sub-clinical outcomes, such as increased blood pressure and decreased lung function (Lepeule et al., 2014; Zhong et al., 2016). However, despite reported biologic plausibility, there remains a lack of epidemiologic studies exploring the relationship between intermediate-term NO2 exposure and clinical outcomes.
China’s enormous air pollution-related health burden and high greenhouse gas emissions place it squarely at the center of attention of air pollution research. As the world’s most populated country with over 1.4 billion people, China is one of the fastest developing countries in the world and also one of the most impacted by the adverse health effects of air pollution (Cohen et al., 2017). While the effects of both short- and long-term exposure to NO2 have been well-studied in Western countries, there have been relatively few studies on this topic conducted in China. Ambient air pollution levels in China are often orders of magnitudes higher than those in Western countries, and the wider exposure range fills a major gap in existing research, specifically allowing us to better characterize the exposure-response curve at a wider range of NO2 concentrations. In addition, the distribution of potential modifiers of the NO2-mortality association across countries, both at the population- and individual-level, are likely very different, greatly limiting the generalizability of studies from developed countries to China. To date, we are aware of only three multi-city studies that investigated the short-term associations of NO2 on mortality in China (Chen et al., 2018, 2012; Wong et al., 2008). Furthermore, multi-city studies that investigate the association of NO2 and mortality at longer time-scales in China, such as at the monthly or annual levels, are currently lacking. In fact, NO2-mortality studies using exposure metrics in between daily and annual exposure are scarce in general, and we are unaware of any studies that investigates intermediate-term NO2 exposure on cause-specific mortality around the world.
The objective of this study is to investigate the association between mortality and exposure to NO2 up to 30 days before the event in 42 Chinese counties. Existing studies provide evidence for health effects of air pollution at the monthly scale. For example, 28-day moving average exposure to black carbon, a traffic emissions tracer like NO2, has been linked increased blood pressure (Zhong et al., 2016). 28-day moving averages of various air pollutants, including black carbon, carbon monoxide, and NO2, have also been linked to decreased lung function (Lepeule et al., 2014). Given that studies of sub-clinical health endpoints provide biological plausibility for different biological pathways of NO2 at different timescales (Sandström, 1995; Steinvil et al., 2008; Ward-Caviness et al., 2016), understanding the clinical effects of monthly NO2 exposure on mortality will not only complete the spectrum of different exposure associations for the NO2-mortality association but also provide additional China-specific concentration-response functions that can be used to best inform China-specific regulatory actions.
METHODS
Study location
This study utilized data from 42 counties across 11 cities in China from January 2013 to December 2015. These cities include: Beijing (seven counties), Chengdu (six counties), Guangzhou (three counties), Harbin (four counties), Nanjing (three counties), Shanghai (seven counties), Shijiazhuang (four counties), Suzhou (one county), Taiyuan (two counties), Wuhan (three counties), and Xi’an (two counties). The locations of the counties are shown in Figure 1. Note that in China, counties are administrative units similar to districts, and are thus smaller than cities.
Figure 1.
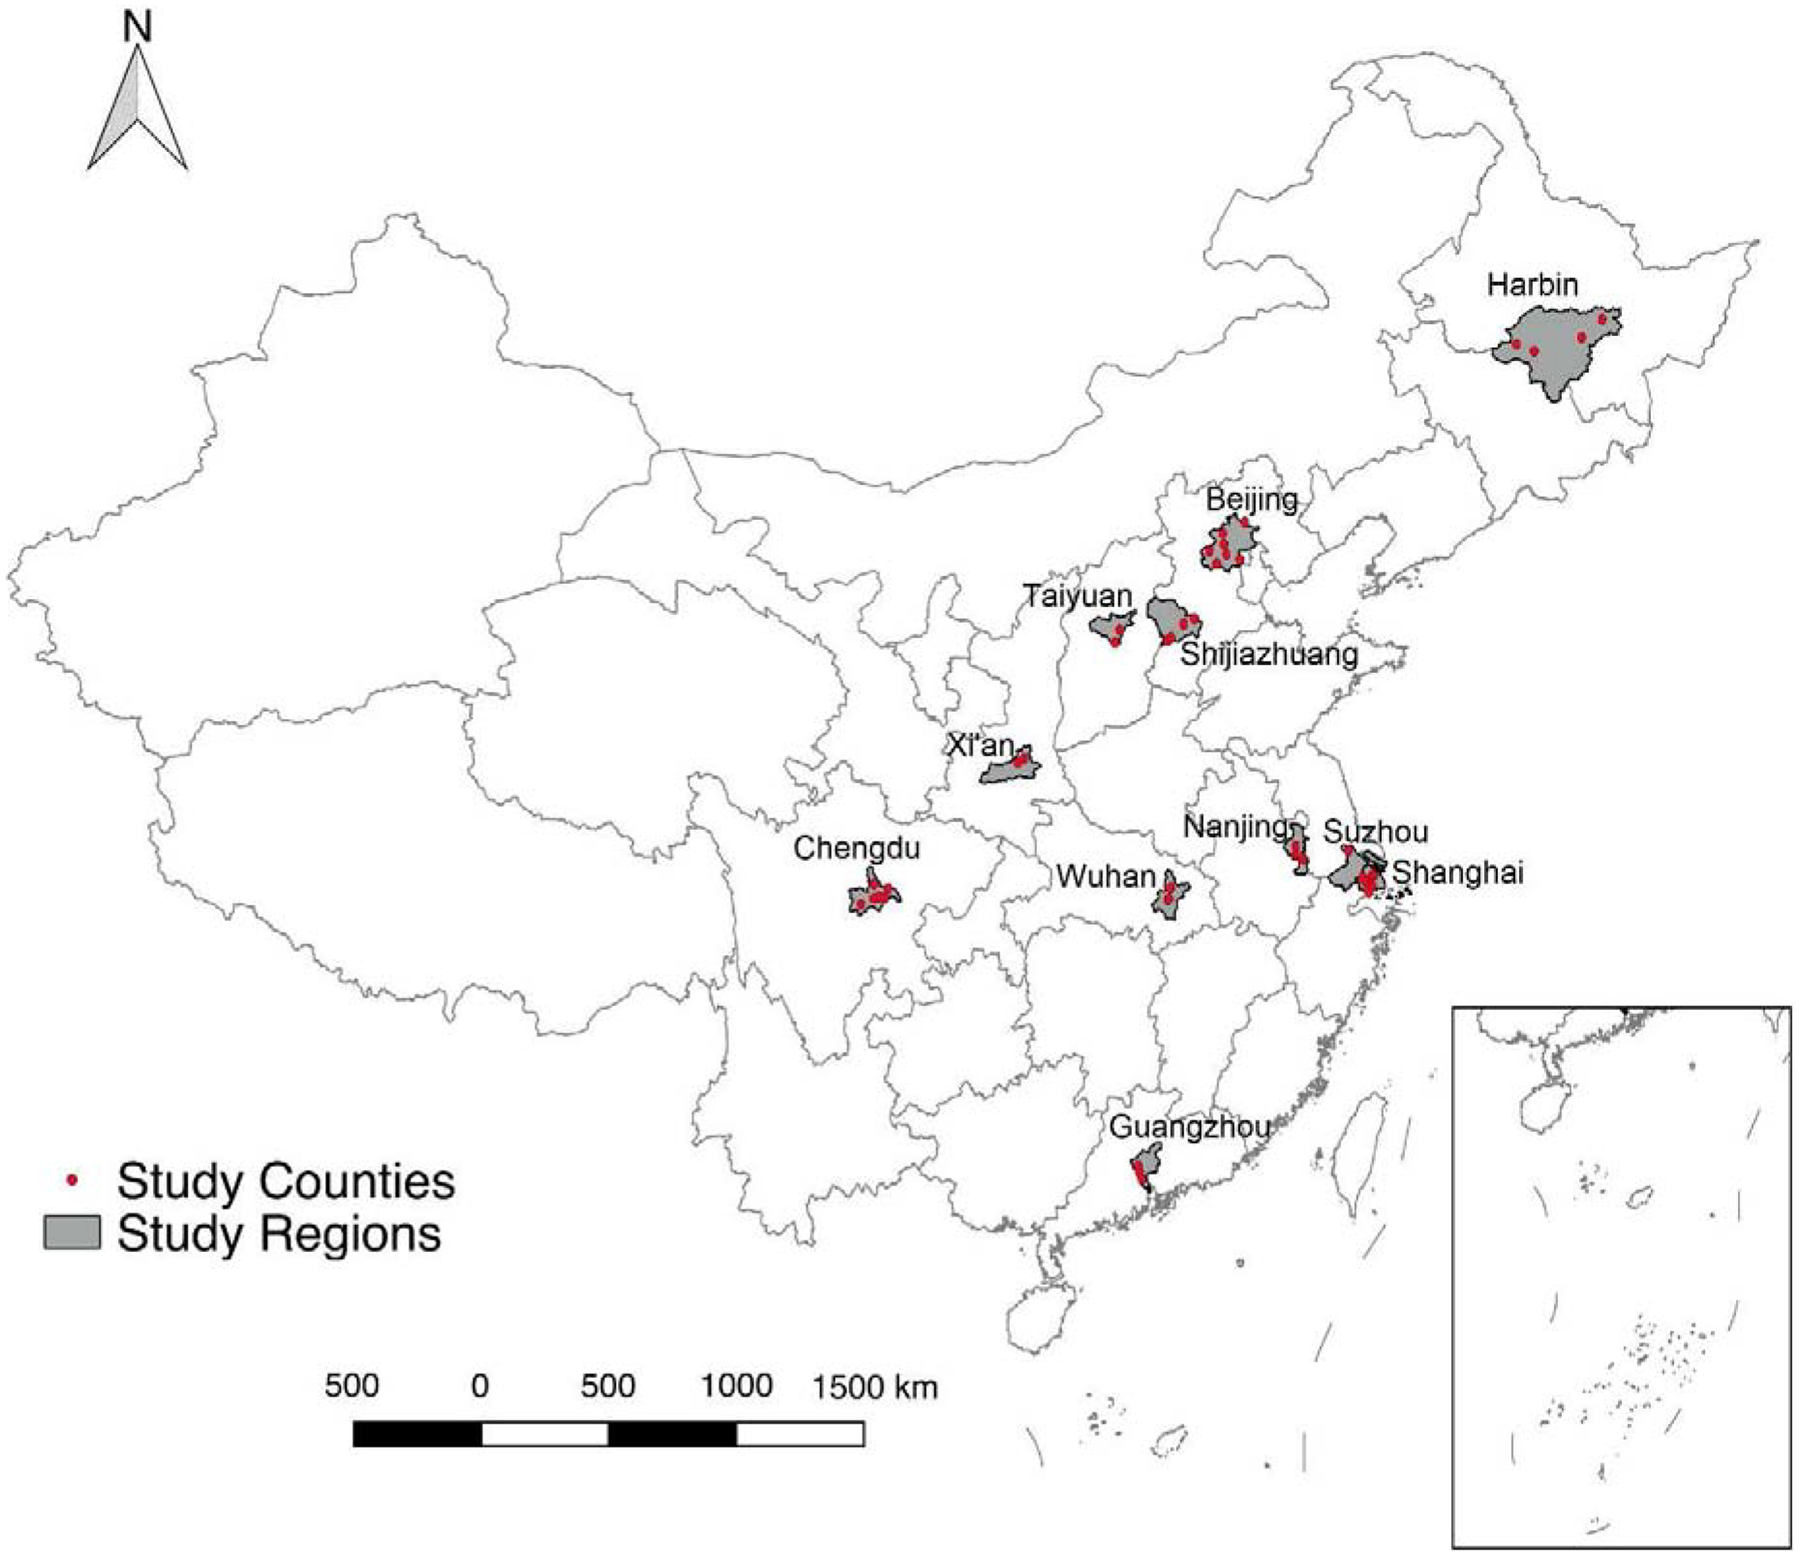
Geographic distribution of study counties.
Exposure assessment
Hourly concentrations of NO2 and PM2.5 were obtained from the National Air Pollution Monitoring System. We calculated daily average concentrations of NO2 and PM2.5 in each county using the averages of the hourly reported values. In each county, NO2 and PM2.5 concentrations from the monitoring station closest to the county center were assigned as the exposure for that county. If there were no monitoring stations located within a county, then the closest monitoring station from a nearby county was used for exposure assessment for that county. If multiple air monitors were available for a county, the concentrations were averaged. Of the 42 counties in this study, 18 included monitoring stations within the boundaries of the county. Aside from two rural counties (Fangzheng and Yilan), where the closest monitoring station was ~200 km away, the average distance of the closest nearby monitoring station to the centroid of each county that did not have a monitoring station was 24.4 km. Daily average temperature and relative humidity of cities were obtained from the data sharing network of the China Meteorological Bureau, which were then assigned to each county that comprises the city.
Outcome assessment
Daily mortality data for each county were obtained from the Chinese Center for Disease Control and Prevention’s Disease Surveillance Point System. The International Classification of Diseases, 10th revision was used to classify non-accidental mortality (A00-R99) and cause-specific mortality for each county, including for cardiovascular disease (I00-I99) and respiratory disease (J00-J99). Mortality counts were also stratified by sex.
Statistical analysis
We employed distributed-lag non-linear models (DLNMs) (Gasparrini, 2014) to investigate the relationship between non-accidental mortality and NO2 exposure up to 30 days before the event. The distributed lag model framework allows for the adjustment of exposures on other days while still estimating the temporal trend of the association, under the assumption that it varies smoothly as a function of time (Gasparrini, 2014, 2011; Kioumourtzoglou et al., 2019; Zanobetti et al., 2000). Specifically, we utilized overdispersed county-specific Poisson regression models to evaluate the NO2-mortality relationship. We selected the best fitting model and the appropriate degrees of freedom (df) for all non-linear terms included in the model based on quasi-Akaike Information Criterion (qAIC). In the model, we included smooth functions of calendar time to adjust for seasonality and long-term trends (using natural cubic splines with 4 df per year), as well as indicator variables for day of the week. We assessed potential non-linearity in the exposure-response relationships using penalized splines for NO2. We found no evidence of deviation from linearity, using the qAIC to select the best fitting linear versus non-linear models. Based on this criterion, we adopted a linear exposure-response for the NO2-mortality relationship and used smoothing functions to model the lag constraint (natural spline, 3 df). We controlled for potential confounding bias due to PM2.5 linearly, due to weather by including smoothing functions of average temperature (natural spline, 3 df) and relative humidity (natural spline, 3 df) all as 30-day distributed-lag terms, and from holidays as an indicator variable. We pooled the county-specific model results using a random effects meta-analysis (Gasparrini et al., 2017, 2012). We tested for calendar time df from 4 to 7 per year, and for NO2, PM2.5, temperature, and relative humidity, we evaluated various lag constraint structures, including polynomials and natural splines, from 3 to 6 df. We then repeated the analysis using both cause-specific (cardiovascular and respiratory) and sex-stratified mortality.
Finally, as a sensitivity analysis we also fit a fixed effects model using information on all counties in the same quasi-Poisson model with county-specific intercepts. We adjusted for the same variables as in the county-specific models. This model assumes the same confounding structure across all counties. However, county-specific DLNMs with 30 lags could become quite unstable, especially if the number of cases in some counties is small, and the fixed effects model using all the available information provides larger stability in the estimates.
All results are presented as percent changes per 10 μg/m3 increase in NO2 concentrations for comparability with other studies. All statistical analyses were performed using the R Statistical Software, version 3.5.1 (Foundation for Statistical Computing, Vienna, Austria).
RESULTS
Table 1 shows the descriptive statistics of the variables used for the daily model. The average daily and monthly NO2 levels for the study period across all counties were 50.2 μg/m3 and 50.6 μg/m3, respectively, both of which are below China’s current 24-hour regulatory standard of 80 μg/m3 (Ministry of Environmental Protection (China), 2012). The correlation between NO2 and PM2.5 in our data was 0.60. On average, there were around 12 non-accidental, 5 cardiovascular, and 2 respiratory deaths per county per day.
Table 1.
Pollutant, confounder, and outcome descriptive statistics (2013–2015; N = 42,248 days)
| Variable | Mean | Min | 25% | 50% | 75% | Max |
|---|---|---|---|---|---|---|
| NO2 (μg/m3) | 50.2 | 0.8 | 32.0 | 46.0 | 63.4 | 327.8 |
| PM2.5 (μg/m3) | 73.1 | 3.1 | 33.4 | 55.1 | 92.0 | 1009.6 |
| Mean Temperature (°C) | 15.3 | −25.7 | 7.4 | 17.6 | 23.9 | 35.5 |
| Relative Humidity (%) | 66.8 | 2.1 | 56.0 | 71.0 | 81.0 | 100.0 |
| Daily Mortality Counts | ||||||
| Non-accidental | 11.5 | 0.0 | 6.0 | 10.0 | 15.0 | 53.0 |
| Cardiovascular | 5.0 | 0.0 | 3.0 | 4.0 | 7.0 | 36.0 |
| Respiratory | 1.5 | 0.0 | 0.0 | 1.0 | 2.0 | 19.0 |
Figures 2a, 2b, and 2c show the 30-day lag-specific cumulated mortality effect estimates per 10 μg/m3 increase in NO2 for non-accidental, cardiovascular-, and respiratory-related mortality, respectively. Sex-stratified lag-specific cumulated estimates and lag-specific non-cumulated effect estimates are presented in the supplemental materials (Figures S1–S3). Specifically, we estimated an increase of 0.13% (95%CI: 0.03, 0.23%) in non-accidental mortality for same-day and previous day NO2 (lag0–1 cumulated), and an overall decrease of 0.14% (95%CI: −1.63, 1.37%) for the lag-specific cumulated effect of NO2 30-days before the event (lag0–30 cumulated). For cardiovascular mortality, we observed an increase of 0.10% (95%CI: −0.06, 0.25%) for lag0–1 cumulated NO2, and a decrease of 0.87% (95%CI: −3.26, 1.58%) for lag0–30 cumulated NO2. For respiratory mortality, we observed an increase of 0.03% (95%CI: −0.23, 0.30%) for lag0–1 cumulated NO2, and an increase of 2.13% (95%CI: −1.21, 5.58%) for lag0–30 cumulated NO2.
Figure 2.
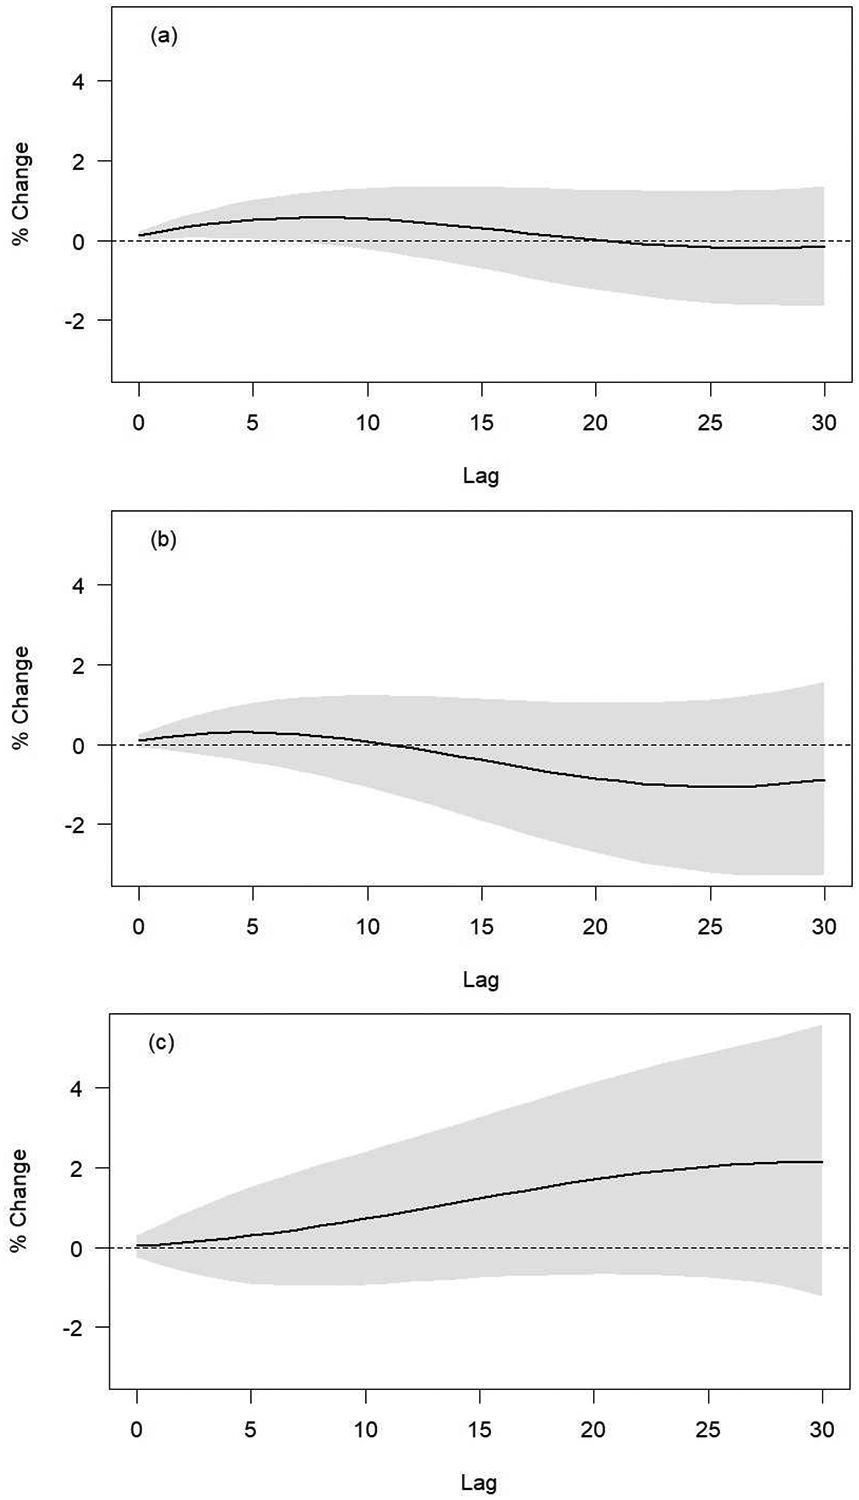
30-day lag-specific cumulated effect estimates per 10 μg/m3 NO2 increase for a) non-accidental mortality; b) cardiovascular mortality; and c) respiratory mortality.
In the sex-stratified analyses, effect estimates for women were generally higher than those of men at lag0–1 cumulated and at lag0–30 cumulated (Figure S2 and S3). In women, a 10 μg/m3 increase in 30-day cumulated NO2 resulted in a 0.83% (95%CI: −1.23, 2.93%) increase in non-accidental mortality. In comparison, for men, a 10 μg/m3 increase in 30-day cumulated NO2 resulted in a 1.10% (95%CI: −2.82, 0.65%) decrease in non-accidental mortality. Similar trends were observed for both cardiovascular and respiratory-related mortality, although the confidence intervals overlapped for sex-stratified results (Figure S3). Figure S4 presents the county-specific and pooled cumulated effect estimates for lag0–1, lag0–7, and lag0–30.
In sensitivity analyses we observed that these results were sensitive to modeling choices. Specifically, in the fixed effects analysis we found similar effect estimates at lag0–1 and statistically significant positive cumulated lag0–30 effect estimates (Figure S5). In general, while lag-specific effect estimates from the meta-analysis displayed the same trend, they resulted in attenuated estimates compared to the fixed effects analysis (Figure S6).
DISCUSSION
Using data from 42 counties spanning from northern to southern China, we investigated the association between NO2 and mortality for up to 30 days exposure before the event. We found increases in non-accidental mortality across China for up to 7 days exposure before the event, as well as higher albeit insignificant effect estimates for respiratory mortality for up to 30 days exposure before the event. To our best knowledge, this is the first study to investigate the association between intermediate-term NO2 exposure and mortality, and it adds to the already rich database of research looking at similar relationships between short-term NO2 exposure and mortality (Burnett et al., 2004; Chen et al., 2018, 2012; Chiusolo et al., 2017; Faustini et al., 2014; Wong et al., 2008).
Our results for the estimated effects of short-term NO2 exposure are smaller in magnitude compared to existing studies conducted in North America and Europe. In their single-pollutant models, Chiusolo and colleagues found a 2.09% (95%CI: 0.96, 3.24%) increase in all-natural mortality, a 2.63% (95%CI: 1.53, 3.75%) increase in cardiac mortality, and a 3.48% (95%CI: 0.75, 6.29%) increase in respiratory mortality per 10 μg/m3 increase in NO2 (Chiusolo et al., 2017). Crouse and colleagues reported a 5.2% (95%CI: 4.5, 5.9%) increase in non-accidental mortality, a 4.1% (95%CI: 2.8, 5.3%) increase in cardiovascular mortality, and a 3.6% (95%CI: 1.2, 6.1%) increase in diseases of the respiratory system per 8.1ppb increase in NO2 (Crouse et al., 2015). We believe that these smaller effect estimates may be explained by a plateauing exposure-response relationship. A recent study by Burnett et al. found that the long-term PM2.5-mortality relationship levels off at higher concentrations of PM2.5 (Burnett et al., 2018), and a similar phenomenon may be observed here in NO2 as well. Please note that this would not contradict our findings of a linear association in the NO2 concentration range included in our analyses. It is possible that we are only able to observe the linear portion at the high NO2 levels of the full non-linear exposure-response curve. In comparison, our results were more similar to those of studies from China. Wong and colleagues using data from three cities in China found a 1.19% (95%CI: 0.71, 1.66%) increase in natural mortality, a 1.32% (95%CI: 0.79, 1.86%) increase in cardiovascular mortality, and a 1.63% (95%CI: 0.62, 2.64%) increase in respiratory mortality per 10 μg/m3 increase in NO2 (Wong et al., 2008). In a more recent paper, Chen and colleagues conducted a nationwide time-series across 272 Chinese cities and found a 0.9% (95%PI: 0.7, 1.1%) increase in non-accidental mortality, a 0.9% (95%PI: 0.7, 1.2%) increase in cardiovascular mortality, and a 1.2% (95%PI: 0.9, 1.5%) increase in respiratory mortality per 10 μg/m3 increase in 2-day average concentrations of NO2 (Chen et al., 2018).
In our sex-stratified analysis, we observed stronger effect estimates in women than in men for lag0–30 cumulated exposure and all-cause mortality, albeit with overlapping confidence intervals. Stronger effect estimates in women have been reported previously in air pollution research (Clougherty, 2010). While the exact reason remains unclear, existing research has linked this disparity to sex differences in toxicity, metabolic rate, and sex steroid hormones (Butter, 2006; Cabello et al., 2015). Additional research is necessary to elucidate the biological mechanisms behind this phenomenon. Nonetheless, these differences in our analyses were not statistically significant and could be due to chance.
As mentioned earlier, to our best knowledge, this is the first study that investigated the association between intermediate-term NO2 exposure and mortality. Numerous biomarker studies have provided biological plausibility for different biological pathways of NO2 sub-clinical effects at different timescales (Sandström, 1995; Steinvil et al., 2008; Ward-Caviness et al., 2016). In terms of short-term exposure, one generally accepted mechanism is that air pollution is linked to pulmonary inflammation, which then results in the production of local inflammatory mediators that can then lead to systemic inflammation. As mentioned previously, intermediate-term (e.g. 28-day moving average) exposure to black carbon, a traffic emissions tracer like NO2, has been linked increased blood pressure (Zhong et al., 2016). 28-day moving averages of various air pollutants, including black carbon, carbon monoxide, and NO2, have also been linked to decreased lung function (Lepeule et al., 2014). Long-term (e.g. annual) exposure to air pollution, on the other hand, have been linked to DNA damage, epigenetic alterations, and biological aging (Ward-Caviness et al., 2016). For NO2 specifically, some of the major proposed mechanisms of toxicity include lipid peroxidation in cell membranes and reactions of free radicals on both structural and functional molecules (Sandström, 1995). Depending on the molecules of interest, the time it takes for a reaction to occur may differ drastically. However, despite strong biological plausibility, we did not observe elevated cumulated lag0–30 NO2 effect estimates for mortality, with the exception of respiratory mortality. Given the reported biological plausibility and the limited evidence for intermediate-term exposures, it is therefore of interest for time-series studies to look at the effect of exposures beyond that of the short- and long-term on clinical outcomes.
Although the effect estimates for short-term exposures are similar in our main and sensitivity analyses, we obtained different results for the cumulated lag0–30 exposures in the random effects meta-analysis vs. the fixed effects analysis. Specifically, we observed null associations when we ran county-specific models and then pooled in a meta-analysis and significantly positive associations in the fixed effects models. This discrepancy in results could indicate that the assumption of a similar confounding structure across counties in the fixed effects model may not be valid. However, it is also likely that the county-specific DLNMs with 30 lags, especially in some of the smaller counties in our analyses, may not have been stable enough to accommodate the high NO2 day-to-day autocorrelation. This is evident by the highly sensitive lag structure to the change in df observed in our sensitivity analysis. We are therefore not confident in our reported cumulated lag0–30 results and further research in settings with longer study periods is warranted. Nonetheless, we observed good agreement in the cumulated lag0–1 and lag0–7 effect estimates in both the main and sensitivity analyses.
Ambient air quality has been regulated in China since 1982, and NO2 is one of the originally regulated air pollutants. Since then, the standards have been revised three times, with the most recent standards released in 2012 (GB 3095–2012) that took effect in 2016. Under current standards, annual, 24-hour, and hourly limits for NO2 are set at 40, 80, and 200 μg/m3, respectively (Ministry of Environmental Protection (China), 2012). In addition to the ambient air quality standards, China’s twelfth Five-Year Plan (2011–2015) specifically set a goal of reducing national emissions of nitrogen oxides (NOx) by 10% relative to 2010 levels (de Foy et al., 2016). The most recent thirteenth Five-Year Plan (2016–2020) further tightened air quality regulations, requiring prefecture-level and larger cities to have an air quality index of 100 or below in at least 80% of the days per year (State Council of the People’s Republic of China, 2016). Combined with China’s concerted effort in reducing traffic in major urban areas through road space rationing (such as the even-odd license plate policy) and the drastic expansion of the public transportation system, NOx reduction will remain one of China’s top priorities over the next several years. We recommend that future policies should formally incorporate the health effects of different time-metrics of air pollution exposure as considered criteria. Specifically, given the current lack of existing standards for NO2 levels between daily and annual time-metrics, we believe that it is important to consider additional NO2 standards at more intermediate timescales, such as the monthly level. It is possible that NO2 concentrations slightly lower than the daily standard—i.e., in compliance with existing standards—are observed on multiple days within a month. However, neither the daily nor the annual standards would address this issue, highlighting the need to also consider intermediate-term standards.
Our study has numerous strengths. First, this is the first study on the intermediate-term associations of NO2 on mortality to date. Second, our dataset has coverage over 42 counties in 11 cities from northern to southern China, and provides a representative sample of China’s urban population in some of its most densely populated cities. Third, the use of DLNMs allows us to simultaneously evaluate short-term and longer-term NO2-mortality associations. Compared to a monthly-only model (i.e. average monthly exposure, aggregated monthly outcomes), the distributed lag models allow us to be more confident that the estimated intermediate-term effect is actually an intermediate-term effect, and not just an aggregate of short-term effects or an indicator for long-term effects. Lastly, this work coincides with priorities in China’s recent Five-Year Plans, and adds to the growing body of literature that policy makers can reference when formulating future regulations.
Our study also has a few limitations. First, although the existing dataset provides a representative spatial coverage of China, it is lacking in temporal coverage and only includes the time period of 2013 to 2015. Although this relatively short time period does not provide us with enough statistical power to explore longer-term associations of NO2 (e.g. annual exposures), the already large sample size allows us to be confident with all of our existing conclusions. Second, NO2 exposure data are obtained from the National Air Pollution Monitoring System, which provides hourly NO2 concentrations for each county and may be prone to measurement error since point estimates from monitors are used to represent county-level ambient concentrations. Third, we only had three years of data in each county, potentially limiting our power for the county-specific DLNMs and the stability of our results at longer lags. Lastly, there are a number of counties that did not have monitoring stations within its vicinity, and the closest monitoring station from a nearby county had to be used as the exposure assignment, which is another potential source of measurement error. However, only two counties were assigned monitors that were ~200 km away—their exclusion from the meta-analysis did not impact our results—and the centroids of the remaining 16 counties without a monitoring station were on average < 25 km away from the assigned monitoring station. A sensitivity analysis comparing the meta-analysis of all counties versus the meta-analysis of a subset of counties that only contained monitoring stations within its vicinity did not show significant differences. There is no reason, furthermore, to believe that the above errors would be differential, and non-differential exposure measurement error in time series studies has been shown to bias estimates towards the null (Dominici et al., 2000; Zeger et al., 2000), making the results of our study more likely to be conservative.
CONCLUSION
While China has rapidly expanded the number of air monitoring stations over the past few years, relatively few monitors exist in western China, which is traditionally less populated and less urbanized than eastern China. Most existing air pollution epidemiological studies in China are therefore better representations of urban China rather than China as a whole. As the number of air monitors in China continue to increase or predictions from highly spatiotemporally resolved NO2 models become available, more work needs to explore the air pollution-mortality relationship in understudied regions, such as Qinghai province, Xinjiang Autonomous Region, and Tibet Autonomous Region. As this is a county-level analysis, future studies in China should also explore intermediate- and long-term effects of air pollution on mortality and morbidity at the individual level, preferably using dedicated air pollution cohorts.
In conclusion, we investigated the association between mortality and NO2 exposure up to 30 days before the event and found significant cumulated associations up to seven days for non-accidental mortality, as well as an increase (albeit insignificant) of over 3% in respiratory mortality per 10 μg/m3 increase in ambient NO2 for cumulated lag0–30. Our all-cause and cardiovascular mortality cumulated lag0–30 effect estimates, however, were sensitive to modeling choices. Given the above and the established biological relevance, we believe that there is still a need to investigate intermediate-term exposure to air pollutants using data available for longer periods as these become available, and we would recommend sufficiently powered studies that are interested in intermediate-term health effects to further explore this topic.
Supplementary Material
Highlights.
We found non-linear NO2-mortality associations across lag time
Effect estimates are generally stronger in women than in men
Observed short-term effect estimates were robust to modeling choices
Cumulated intermediate-term results were sensitive to modeling choices
Acknowledgements
This study was partially supported by the National Institutes of Health Institutional Research T32 Training Grant (T32 ES023770), the National Institute of Environmental Health Sciences (NIEHS) Individual Fellowship Grant (F31 ES029372) and Center Core Grant (P30 ES009089), the Columbia Global Policy Initiative Faculty Grant, and the Columbia Weatherhead East Asian Institute Sasakawa Young Leaders Fellowship Fund.
Footnotes
Publisher's Disclaimer: This is a PDF file of an unedited manuscript that has been accepted for publication. As a service to our customers we are providing this early version of the manuscript. The manuscript will undergo copyediting, typesetting, and review of the resulting proof before it is published in its final form. Please note that during the production process errors may be discovered which could affect the content, and all legal disclaimers that apply to the journal pertain.
Declaration of interests
The authors declare that they have no known competing financial interests or personal relationships that could have appeared to influence the work reported in this paper.
References
- Bell ML, Dominici F, Samet JM, 2005. A meta-analysis of time-series studies of ozone and mortality with comparison to the National Morbidity, Mortality, and Air Pollution Study. Epidemiology 16, 436–445. 10.1097/01.ede.0000165817.40152.85 [DOI] [PMC free article] [PubMed] [Google Scholar]
- Burnett R, Chen H, Fann N, Hubbell B, Pope CA, Frostad J, Lim SS, Kan H, Walker KD, Thurston GD, Hayes RB, Lim CC, Turner MC, Jerrett M, Krewski D, Gapstur SM, Diver WR, Ostro B, Goldberg D, Crouse DL, Martin RV, Peters P, Pinault L, Tjepkema M, Donkelaar A Van, Villeneuve PJ, Miller AB, Yin P, Zhou M, Wang L, Janssen NAH, Marra M, Atkinson RW, Tsang H, Quoc T, Cannon JB, Allen RT, Hart JE, Laden F, Cesaroni G, Forastiere F, Weinmayr G, Jaensch A, Nagel G, Concin H, Spadaro JV, 2018 Global estimates of mortality associated with long- term exposure to outdoor fine particulate matter. Proc. Natl. Acad. Sci. U. S. A 115 10.1073/pnas.1803222115 [DOI] [PMC free article] [PubMed] [Google Scholar]
- Burnett RT, Stieb D, Brook JR, Cakmak S, Dales R, Raizenne M, Vincent R, Dann T, 2004. Associations between short-term changes in nitrogen dioxide and mortality in Canadian cities. Arch Env. Heal 59, 228–36. [DOI] [PubMed] [Google Scholar]
- Butter ME, 2006. Are Women More Vulnerable to Environmental Pollution? J. Hum. Ecol 20, 221–226. [Google Scholar]
- Cabello N, Mishra V, Sinha U, DiAngelo SL, Chroneos ZC, Ekpa NA, Cooper TK, Caruso CR, Silveyra P, 2015. Sex differences in the expression of lung inflammatory mediators in response to ozone. Am. J. Physiol. - Lung Cell. Mol. Physiol 10.1152/ajplung.00018.2015 [DOI] [PMC free article] [PubMed] [Google Scholar]
- Chen G, Song G, Jiang L, Zhang Y, Zhao N, Chen B, Kan H, 2008. Short-term effects of ambient gaseous pollutants and particulate matter on daily mortality in Shanghai, China. J. Occup. Health 50, 41–47. 10.1539/joh.50.41 [DOI] [PubMed] [Google Scholar]
- Chen R, Samoli E, Wong CM, Huang W, Wang Z, Chen B, Kan H, 2012. Associations between short-term exposure to nitrogen dioxide and mortality in 17 Chinese cities: The China Air Pollution and Health Effects Study (CAPES). Environ. Int 45, 32–38. 10.1016/j.envint.2012.04.008 [DOI] [PubMed] [Google Scholar]
- Chen R, Yin P, Meng X, Wang L, Liu C, Niu Y, Lin Z, Liu Y, Liu J, Qi J, You J, Kan H, Zhou M, 2018. Associations Between Ambient Nitrogen Dioxide and Daily Cause-specific Mortality 29. 10.1097/EDE.0000000000000829 [DOI] [PubMed] [Google Scholar]
- Chiusolo M, Cadum E, Stafoggia M, Galassi C, Faustini A, Bisanti L, Vigotti MA, Dessi MP, Cernigliaro A, Mallone S, Pacelli B, Minerba S, Simonato L, Environmental S, Perspectives H, September N, Chiusolo M, Cadum E, Stafoggia M, Galassi C, Berth G, Faustini A, Bisanti L, Vigotti MA, Dessi MP, Cernigliaro A, Mallone S, Pacelli B, 2017. Short-Term Effects of Nitrogen Dioxide on Mortality and Susceptibility Factors in 10 Italian Cities: The EpiAir Study Published by: The National Institute of Environmental Health Sciences Stable URL: http://www.jstor.org/stable/41263136Linkedreferenc. [DOI] [PMC free article] [PubMed] [Google Scholar]
- Clougherty JE, 2010. A growing role for gender analysis in air pollution epidemiology. Environ. Health Perspect 118, 167–176. 10.1289/ehp.0900994 [DOI] [PMC free article] [PubMed] [Google Scholar]
- Cohen AJ, Brauer M, Burnett R, Anderson HR, Frostad J, Estep K, Balakrishnan K, Brunekreef B, Dandona L, Dandona R, Feigin V, Freedman G, Hubbell B, Jobling A, Kan H, Knibbs L, Liu Y, Martin R, Morawska L, Pope CA, Shin H, Straif K, Shaddick G, Thomas M, van Dingenen R, van Donkelaar A, Vos T, Murray CJL, Forouzanfar MH, 2017. Estimates and 25-year trends of the global burden of disease attributable to ambient air pollution: An analysis of data from the Global Burden of Diseases Study 2015. Lancet 389, 1907–1918. 10.1016/S0140-6736(17)30505-6 [DOI] [PMC free article] [PubMed] [Google Scholar]
- Crouse DL, Peters PA, Hystad P, Brook JR, van Donkelaar A, Martin RV, Villeneuve PJ, Jerrett M, Goldberg MS, Arden Pope C, Brauer M, Brook RD, Robichaud A, Menard R, Burnett RT, 2015. Ambient PM2.5, O3, and NO2 exposures and associations with mortality over 16 years of follow-up in the canadian census health and environment cohort (CanCHEC). Environ. Health Perspect 123, 1180–1186. 10.1289/ehp.1409276 [DOI] [PMC free article] [PubMed] [Google Scholar]
- de Foy B, Lu Z, Streets DG, 2016. Satellite NO2 retrievals suggest China has exceeded its NOx reduction goals from the twelfth Five-Year Plan. Sci. Rep 6, 35912 10.1038/srep35912 [DOI] [PMC free article] [PubMed] [Google Scholar]
- Di Q, Wang Yan, Zanobetti A, Wang Yun, Koutrakis P, Choirat C, Dominici F, Schwartz JD, 2017. Air Pollution and Mortality in the Medicare Population. N. Engl. J. Med 376, 2513–2522. 10.1056/NEJMoa1702747 [DOI] [PMC free article] [PubMed] [Google Scholar]
- Dockery DW, Pope CA, Xu X, Spengler JD, Ware JH, Fay ME, Ferris BG, Speizer FE, 1993. An Association between Air Pollution and Mortality in Six U.S. Cities. N. Engl. J. Med 329, 1753–1759. 10.1056/NEJM199312093292401 [DOI] [PubMed] [Google Scholar]
- Dominici F, Zeger SL, Samet JM, 2000. A measurement error model for time-series studies of air pollution and mortality. Biostatistics 1, 157–75. 10.1093/biostatistics/1.2.157 [DOI] [PubMed] [Google Scholar]
- Faustini A, Rapp R, Forastiere F, 2014. Nitrogen dioxide and mortality: Review and meta-analysis of long-term studies. Eur. Respir. J 44, 744–753. 10.1183/09031936.00114713 [DOI] [PubMed] [Google Scholar]
- Friis R, 2012. Essentials of Environmental Health. Dep. Heal. Sci. Calif. State Univ; Long Beach Long Beach, Calif. 442. [Google Scholar]
- Gasparrini A, 2014. Modeling exposure-lag-response associations with distributed lag non-linear models. Stat. Med 33, 881–899. 10.1002/sim.5963 [DOI] [PMC free article] [PubMed] [Google Scholar]
- Gasparrini A, 2011. Distributed Lag Linear and Non-Linear Models in R: The Package dlnm. J. Stat. Softw 43, 1–20. [PMC free article] [PubMed] [Google Scholar]
- Gasparrini A, Armstrong B, Kenward MG, 2012. Multivariate meta-analysis for non-linear and other multi-parameter associations. Stat. Med 10.1002/sim.5471 [DOI] [PMC free article] [PubMed] [Google Scholar]
- Gasparrini A, Scheipl F, Armstrong B, Kenward MG, 2017. A penalized framework for distributed lag non-linear models. Biometrics 73, 938–948. 10.1111/biom.12645 [DOI] [PubMed] [Google Scholar]
- Guo Y, Zeng H, Zheng R, Li S, Barnett AG, Zhang S, Zou X, Huxley R, Chen W, Williams G, 2016. The association between lung cancer incidence and ambient air pollution in China: A spatiotemporal analysis. Environ. Res 144, 60–65. 10.1016/j.envres.2015.11.004 [DOI] [PubMed] [Google Scholar]
- Huynen MMTE, Martens P, Schram D, Weijenberg MP, Kunst AE, 2001. The impact of heat waves and cold spells on mortality rates in the Dutch population. Environ. Health Perspect 109, 463–470. 10.1289/ehp.01109463 [DOI] [PMC free article] [PubMed] [Google Scholar]
- Jerrett M, Burnett RT, Pope CA, Ito K, Thurston G, Krewski D, Shi Y, Calle E, Thun M, 2009. Long-Term Ozone Exposure and Mortality. N. Engl. J. Med 360, 1085–1095. 10.1056/NEJMoa0803894 [DOI] [PMC free article] [PubMed] [Google Scholar]
- Kan Haidong, Wong Chit Ming, Vichit-Vadakan Nuntavarn, Qian Zhengmin, Vichit-Vadakan N, Vajanapoom N, Ostro B, Wong CM, Thach TQ, Chau PYK, Chan KP, Chung RY, Ou CQ, Yang L, Thomas GN, Lam TH, Hedley AJ, Peiris JSM, Wong TW, Kan H, Chen B, Zhao N, Zhang Y, London SJ, Song G, Jiang L, Chen G, Qian Z, Lin HM, Bentley CM, Lin HM, He Q, Kong L, Yang N, Zhou D, Xu S, Liu W, 2010. Short-term association between sulfur dioxide and daily mortality: The Public Health and Air Pollution in Asia (PAPA) study. Environ. Res 110, 258–264. 10.1016/j.envres.2010.01.006 [DOI] [PMC free article] [PubMed] [Google Scholar]
- Katsouyanni K, Touloumi G, Spix C, Schwartz J, Balducci F, Medina S, Rossi G, Wojtyniak B, Sunyer J, Bacharova L, Schouten JP, Ponka A, Anderson HR, 1997. Short term effects of ambient sulphur dioxide and particulate matter on mortality in 12 European cities: results from time series data from the APHEA project. Bmj 314, 1658–1658. 10.1136/bmj.314.7095.1658 [DOI] [PMC free article] [PubMed] [Google Scholar]
- Kinney PL, Özkaynak H, 1991. Associations of daily mortality and air pollution in Los Angeles County. Environ. Res 54, 99–120. 10.1016/S0013-9351(05)80094-5 [DOI] [PubMed] [Google Scholar]
- Kioumourtzoglou M-A, Schwartz J, James P, Dominici F, Zanobetti A, 2015. PM2.5 and mortality in 207 US cities. Epidemiology 27, 1 10.1097/EDE.0000000000000422 [DOI] [PMC free article] [PubMed] [Google Scholar]
- Kioumourtzoglou M, Raz R, Wilson A, Fluss R, Nirel R, 2019. Traffic-related Air Pollution and Pregnancy Loss 30. 10.1097/EDE.0000000000000918 [DOI] [PMC free article] [PubMed] [Google Scholar]
- Koenig JQ, 2000. Health Effects of Ambient Air Pollution, Health Effects of Ambient Air Pollution. Springer US, Boston, MA: 10.1007/978-1-4615-4569-9 [DOI] [Google Scholar]
- Lepeule J, Bind M-AC, Baccarelli AA, Koutrakis P, Tarantini L, Litonjua A, Sparrow D, Vokonas P, Schwartz JD, 2014. Epigenetic Influences on Associations between Air Pollutants and Lung Function in Elderly Men: The Normative Aging Study. Environ. Health Perspect 566, 566–572. 10.1289/ehp.1206458 [DOI] [PMC free article] [PubMed] [Google Scholar]
- Madrigano J, Jack D, Anderson GB, Bell ML, Kinney PL, 2015. Temperature, ozone, and mortality in urban and non-urban counties in the northeastern United States. Environ. Health 14, 3 10.1186/1476-069X-14-3 [DOI] [PMC free article] [PubMed] [Google Scholar]
- Ministry of Environmental Protection (China), 2012. Ambient air quality standards 6.
- Pope CA, Burnett RT, Thun MJ, Calle EE, Krewski D, Ito K, Thurston GD, 2002. Lung cancer, cardiopulmonary mortality, and long-term exposure to fine particulate air pollution. J. Am. Med. Assoc 287, 1132–1141. 10.1016/j.scitotenv.2011.03.017 [DOI] [PMC free article] [PubMed] [Google Scholar]
- Sandström T, 1995. Respiratory effects of air pollutants: experimental studies in humans. Eur. Respir. J 8, 976–995. 10.1183/09031936.95.08060976 [DOI] [PubMed] [Google Scholar]
- Schwartz J, 2000. Harvesting and Long Term Exposure Effects in the Relation between Air Pollution and Mortality. Am. J. Epidemiol 151, 440–448. 10.1093/oxfordjournals.aje.a010228 [DOI] [PubMed] [Google Scholar]
- Seinfeld JH, Pandis SN, 2016. Atmospheric Chemistry and Physics: From Air Pollution to Climate Change, Atmospheric Chemistry and Physics. 10.1080/00139157.1999.10544295 [DOI] [Google Scholar]
- State Council of the People’s Republic of China, 2016. State Department issues 13th Five-Year Plan for Ecological Environment Protection [WWW Document]. URL http://www.gov.cn/zhengce/content/2016-12/05/content_5143290.htm [Google Scholar]
- Steinvil A, Kordova-Biezuner L, Shapira I, Berliner S, Rogowski O, 2008. Short-term exposure to air pollution and inflammation-sensitive biomarkers. Environ. Res 106, 51–61. 10.1016/j.envres.2007.08.006 [DOI] [PubMed] [Google Scholar]
- U.S. Environmental Protection Agency (EPA), 2016. Basic Information about NO2 | Nitrogen Dioxide (NO2) Pollution [WWW Document]. URL https://www.epa.gov/no2-pollution/basic-information-about-no2#WhatisNO2 (accessed 12.20.17). [Google Scholar]
- Ward-Caviness CK, Nwanaji-Enwerem JC, Wolf K, Wahl S, Colicino E, Trevisi L, Kloog I, Just AC, Vokonas P, Cyrys J, Gieger C, Schwartz J, Baccarelli AA, Schneider A, Peters A, 2016. Long-term exposure to air pollution is associated with biological aging. Oncotarget 7, 74510–74525. 10.18632/oncotarget.12903 [DOI] [PMC free article] [PubMed] [Google Scholar]
- Wong C-M, Vichit-Vadakan N, Kan H, Qian Z, 2008. Public Health and Air Pollution in Asia (PAPA): A Multicity Study of Short-Term Effects of Air Pollution on Mortality. Environ. Health Perspect 116, 1195–1202. 10.1289/ehp.11257 [DOI] [PMC free article] [PubMed] [Google Scholar]
- Zanobetti A, Wand MP, Schwartz J, Ryan LM, 2000. Generalized additive distributed lag models: quantifying mortality displacement. Print. Gt. Britain Biostat 1, 279–292. 10.1093/biostatistics/1.3.279 [DOI] [PubMed] [Google Scholar]
- Zeger SL, Thomas D, Dominici F, Samet JM, Schwartz J, Dockery D, Cohen A, 2000. Exposure measurement error in time-series studies of air pollution: Concepts and consequences. Environ. Health Perspect 108, 419–426. 10.1289/ehp.00108419 [DOI] [PMC free article] [PubMed] [Google Scholar]
- Zhong J, Cayir A, Trevisi L, Sanchez-Guerra M, Lin X, Peng C, Bind MA, Prada D, Laue H, Brennan KJM, Dereix A, Sparrow D, Vokonas P, Schwartz J, Baccarelli AA, 2016. Traffic-Related Air Pollution, Blood Pressure, and Adaptive Response of Mitochondrial Abundance. Circulation 133, 378–387. 10.1161/CIRCULATIONAHA.115.018802 [DOI] [PMC free article] [PubMed] [Google Scholar]
Associated Data
This section collects any data citations, data availability statements, or supplementary materials included in this article.