

Abstract
The class B G protein-coupled receptor (GPCR) calcitonin receptor (CTR) is a drug target for osteoporosis and diabetes. N-glycosylation of asparagine 130 in its extracellular domain (ECD) enhances calcitonin hormone affinity with the proximal GlcNAc residue mediating this effect through an unknown mechanism. Here, we present two crystal structures of salmon calcitonin-bound, GlcNAc-bearing CTR ECD at 1.78 and 2.85 Å resolutions and analyze the mechanism of the glycan effect. The N130 GlcNAc does not contact the hormone. Surprisingly, the structures are nearly identical to a structure of hormone-bound, N-glycan-free ECD, which suggested that the GlcNAc might affect CTR dynamics not observed in the static crystallographic snapshots. Hydrogen-deuterium exchange mass spectrometry and molecular dynamics simulations revealed that glycosylation stabilized a β-sheet adjacent to the N130 GlcNAc and the N-terminal α-helix near the peptide-binding site, while increasing flexibility of the peptide-binding site turret loop. These changes due to N-glycosylation increased the ligand on-rate and decreased its off rate. The glycan effect extended to RAMP-CTR amylin receptor complexes and was also conserved in the related CGRP receptor. These results reveal that N-glycosylation can modulate GPCR function by altering receptor dynamics.
Keywords: G protein-coupled receptor (GPCR), post-translational modification, N-linked glycosylation, peptide hormone, receptor dynamics, ligand binding kinetics, dynamic allostery
Graphical Abstract

INTRODUCTION
The calcitonin receptor (CTR) is a class B G protein-coupled receptor (GPCR) and its activation regulates calcium homeostasis and bone turnover [1, 2]. CTR is a drug target for treating Paget’s disease, osteoporosis, and hypercalcemia, which all result from abnormal bone turnover and calcium regulation. A 32-amino acid peptide hormone salmon calcitonin (sCT), which has higher affinity than human calcitonin, has been developed as a drug for these clinical applications [3]. CTR can form a heterodimeric complex with any of three accessory Receptor Activity-Modifying Proteins (RAMPs), which enhance affinity for a 37-amino acid peptide hormone amylin [4–6]. Amylin is co-secreted with insulin from pancreatic β-cells and activates the CTR:RAMP complexes expressed in the brain [7, 8]. The amylin receptors are designated AMY1, AMY2, and AMY3 for CTR complexes with RAMP1, -2, and -3 respectively. Amylin improves blood glucose control by reducing appetite, slowing gastric emptying, and inhibiting glucagon secretion [9]. A chimera of rat and human amylin pramlintide has been developed to treat type I and type II diabetes [10]. Understanding the molecular mechanism of how peptide hormone binding affinity is determined at CTR will provide an important foundational basis to develop peptide drugs targeting both CTR and the amylin receptors.
CTR has an extracellular domain (ECD) and a plasma membrane-embedded seven transmembrane domain (TMD). A general mechanism of peptide hormone interaction with class B GPCRs has been proposed; the receptor ECD first binds to the C-terminal half of the peptide hormone to increase the local concentration of the N-terminal half of the peptide, which subsequently binds and activates the receptor TMD [11]. Our previous report with alanine-scanning mutagenesis of sCT(22–32) and molecular modeling suggested a relatively unstructured ECD-bound sCT conformation with a β-turn near its C-terminus [12]. This model was consistent with a crystal structure of CTR ECD bound with a sCT analog, which showed precisely how the hormone binds the ECD [13]. More recently, the cryo-EM structure of full length CTR in complex with sCT(1–32) and the heterotrimeric Gs protein revealed the molecular interaction of the N-terminal half of sCT with CTR TMD [14, 15]. sCT(8–19) formed an amphipathic helix toward a hydrophobic TMD environment and several hydrogen bond interactions were observed between sCT N-terminal residues and CTR TMD. The receptor residues needed for association with hCT and rat amylin have been examined by mutagenesis in the presence and absence of RAMP1 [16]. Interestingly, this study examined the interface of RAMP1 ECD with CTR, and suggested that RAMP1 might exert its functions, at least in part, by altering the dynamics of the CTR.
CTR is a glycoprotein with four N-glycosylation sites, all of which are located in the ECD: N28, N73, N125, and N130. The first of these sites is absent in a functional splice variant [17]. We reported that CTR N-glycosylation enhanced calcitonin binding affinity ~10-fold for the isolated ECD [18]. The proximal GlcNAc residue of CTR N130 was largely responsible for the affinity enhancement along with a small contribution from the proximal GlcNAc at N125. In addition, Liang et al. showed that N-glycosylation of CTR N130 enhanced both peptide binding affinity and signaling potency ~10-fold at full-length CTR [14]. To date, the molecular basis for this significant glycan effect on the function of this clinically important GPCR remains unknown. The sCT-CTR ECD crystal structure used N-glycan-free ECD expressed in E. coli. The full-length cryo-EM CTR structure included N-glycosylated ECD, however, the ECD was poorly resolved and not modeled due to apparent inter-domain flexibility even when bound by ligand. Thus, despite the recent structural insight into the molecular pharmacology of ligand binding to the CTR we still lack a structural understanding of the glycan effect. More broadly, the effects of N-glycosylation on GPCR structure and function in general remain poorly understood despite other notable examples of significant modulation of GPCR function by N-glycosylation [19].
In the current study, we sought to understand how N-glycosylation modulates GPCR function using CTR as a model system. We obtained two crystal structures of sCT-bound human CTR ECD containing the proximal GlcNAc residues at the N-glycosylation sites and compared them to the prior N-glycan-free structure. Molecular dynamics (MD) simulations and hydrogen-deuterium exchange mass spectrometry (HDX-MS) were performed to gain a molecular insight into the receptor dynamics between the glycosylated and non-glycosylated forms of the ECD. Analysis of the low frequency oscillations between the simulations highlighted key structural differences which are consistent with the effects of the GlcNAc residues on sCT binding kinetics and CTR ECD dynamics determined experimentally by HDX-MS. Our results indicate that while glycosylation at CTR N130 does not directly contact sCT and does not significantly alter the global conformation of the CTR ECD, it does modulate the ECD dynamics. In addition, we show that the glycan effect is maintained in the heterodimeric AMY1 and AMY2 receptors and is also conserved in at least one other class B GPCR. This study is the first, to our knowledge, to show that N-glycosylation can modulate GPCR function by controlling receptor dynamics.
RESULTS
Crystal structures of sCT bound to proximal GlcNAc-bearing CTR ECD
The human CTR ECD was fused with maltose-binding protein (MBP) at its N-terminus to facilitate crystallization [20] and a (His)6 tag at its C-terminus for purification. Two versions of the fusion protein were constructed with CTR residues 38–141 or 40–141. The fusion proteins were expressed as secreted proteins in HEK293 GnTI− cells [21] and the three glycosylation sites in the ECD, N73, N125, and N130 were trimmed to single GlcNAc residues with Endo H for crystallization. Crystals of the 38–141 construct obtained with sCT(16–32) at neutral pH diffracted to 1.78 Å resolution and crystals of the 40–141 construct obtained with sCT(22–32) at pH 4.7 diffracted to 2.85 Å resolution. Both structures were solved by molecular replacement and refined to good geometry and R factors (Table 1). The 1.78Å structure had two molecules in the asymmetric unit and the 2.85Å structure had a single molecule (Figure S1). The two complexes in the 1.78Å structure were similar except that the C72-C112 disulfide in the Mol B CTR ECD was partially broken, which required fitting alternative mainchain conformations for a segment near the disulfide. Despite this issue, the peptide-binding mode was the same in both complexes. 2mFo-DFc electron density maps showed clear density for the proximal GlcNAc residue of CTR ECD N130 in both structures (Figure S2). Electron density for the N125 GlcNAc residue in the 1.78Å structure was very poor so this glycan was omitted from the final model. Electron density of moderate quality was observed for the N73 GlcNAc in both structures. Hereafter we use Mol A of the 1.78Å structure for Figures.
Table 1.
X-ray diffraction data collection and refinement statistics.
| Data collection | ||
| Space group | P6522 | P4132 |
| Cell dimensions | ||
| a, b, c (Å) | 121.03, 121.03, 263.96 | 181.29, 181.29, 181.29 |
| α, β, γ (°) | 90, 90, 120 | 90, 90, 90 |
| Resolution (Å) | 50.0 – 1.78 | 50.0 – 2.85 |
| Rmerge | 0.066 (0.954)a | 0.122 (1.440)a |
| CC1/2 | (0.628)a | (0.614)a |
| I / σI | 29.82 (1.38)a | 21.24 (1.32)a |
| Completeness (%) | 99.0 (97.0)a | 99.0 (99.7)a |
| Redundancy | 7.4 (5.9)a | 9.3 (9.3)a |
| Refinement | ||
| Resolution (Å) | 49.86 – 1.78 | 48.45 – 2.85 |
| No. reflections | 103153 | 22878 |
| Rwork / Rfree | 0.186/0.214 | 0.193/0.225 |
| Protein molecules/ASU | 2 | 1 |
| No. atoms | 8740 | 3874 |
| Protein(+GlcNAc) /peptide | 8037 | 3845 |
| Heterogen atoms (Maltose, etc.) | 51 | 27 |
| Water | 652 | 2 |
| No. of TLS groups | 6 | 3 |
| B-factors (Mol A/B or Mol A) | ||
| MBP | 27.4/33.3 | 84.6 |
| CTR ECD (+GlcNAc) | 48.3/34.3 | 73.3 |
| sCT | 36.2/39.7 | 97.8 |
| Water | 35.0 | 68.2 |
| RMS deviations | ||
| Bond lengths (Å) | 0.015 | 0.015 |
| Bond angles (°) | 1.68 | 1.83 |
| Ramachandran Analysisb | ||
| Preferred regions (%) | 97.1 | 97.3 |
| Allowed regions (%) | 2.9 | 2.7 |
| Outliers (%) | 0 | 0 |
| All-atom Clashscorec | 2.44 (99th percentile) | 3.28 (100th percentile) |
| MolProbity scorec | 1.35 (97th percentile) | 1.78 (100th percentile) |
Values in parentheses are for highest-resolution shell.
As defined by COOT.
As determined by MolProbity. Values in parentheses represent rank among structures of similar resolution.
The two structures exhibited the same binding mode for the primary ECD-binding 22–32 portion of the peptide despite their crystallization at significantly different pH values (Figure 1A and 1B). The defining peptide feature was a type II β-turn near the C-terminus. The affinity-enhancing N130 GlcNAc residue adopted the same conformation in both structures and notably, there were no direct contacts between the GlcNAc and the sCT peptide. The N-terminal α1 helical region of CTR ECD adopted a different conformation in the 1.78Å and 2.85Å structures, which may be in part affected by fusion to MBP (Figure 1A, 1B, and S1). Key molecular interactions of sCT with the glycosylated CTR ECD include hydrogen bonds between sCT T25 and CTR D101, the type II β-turn of sCT G28 to T31 contacting the CTR turret loop, the C-terminal P32 interaction with CTR W79 “Trp Shelf”, and hydrogen bonds between the sCT P32 amide and the CTR S129 backbone (Figure 1C and 1D). A unique interaction not previously observed is CTR Y41 in the flexible α1 region forming a hydrogen bond with sCT T25 in the 1.78Å structure (Figure 1C). This interaction was not present in the 2.85Å structure (Figure 1D).
Figure 1. Crystal structures of sCT bound to proximal GlcNAc-bearing CTR ECD.
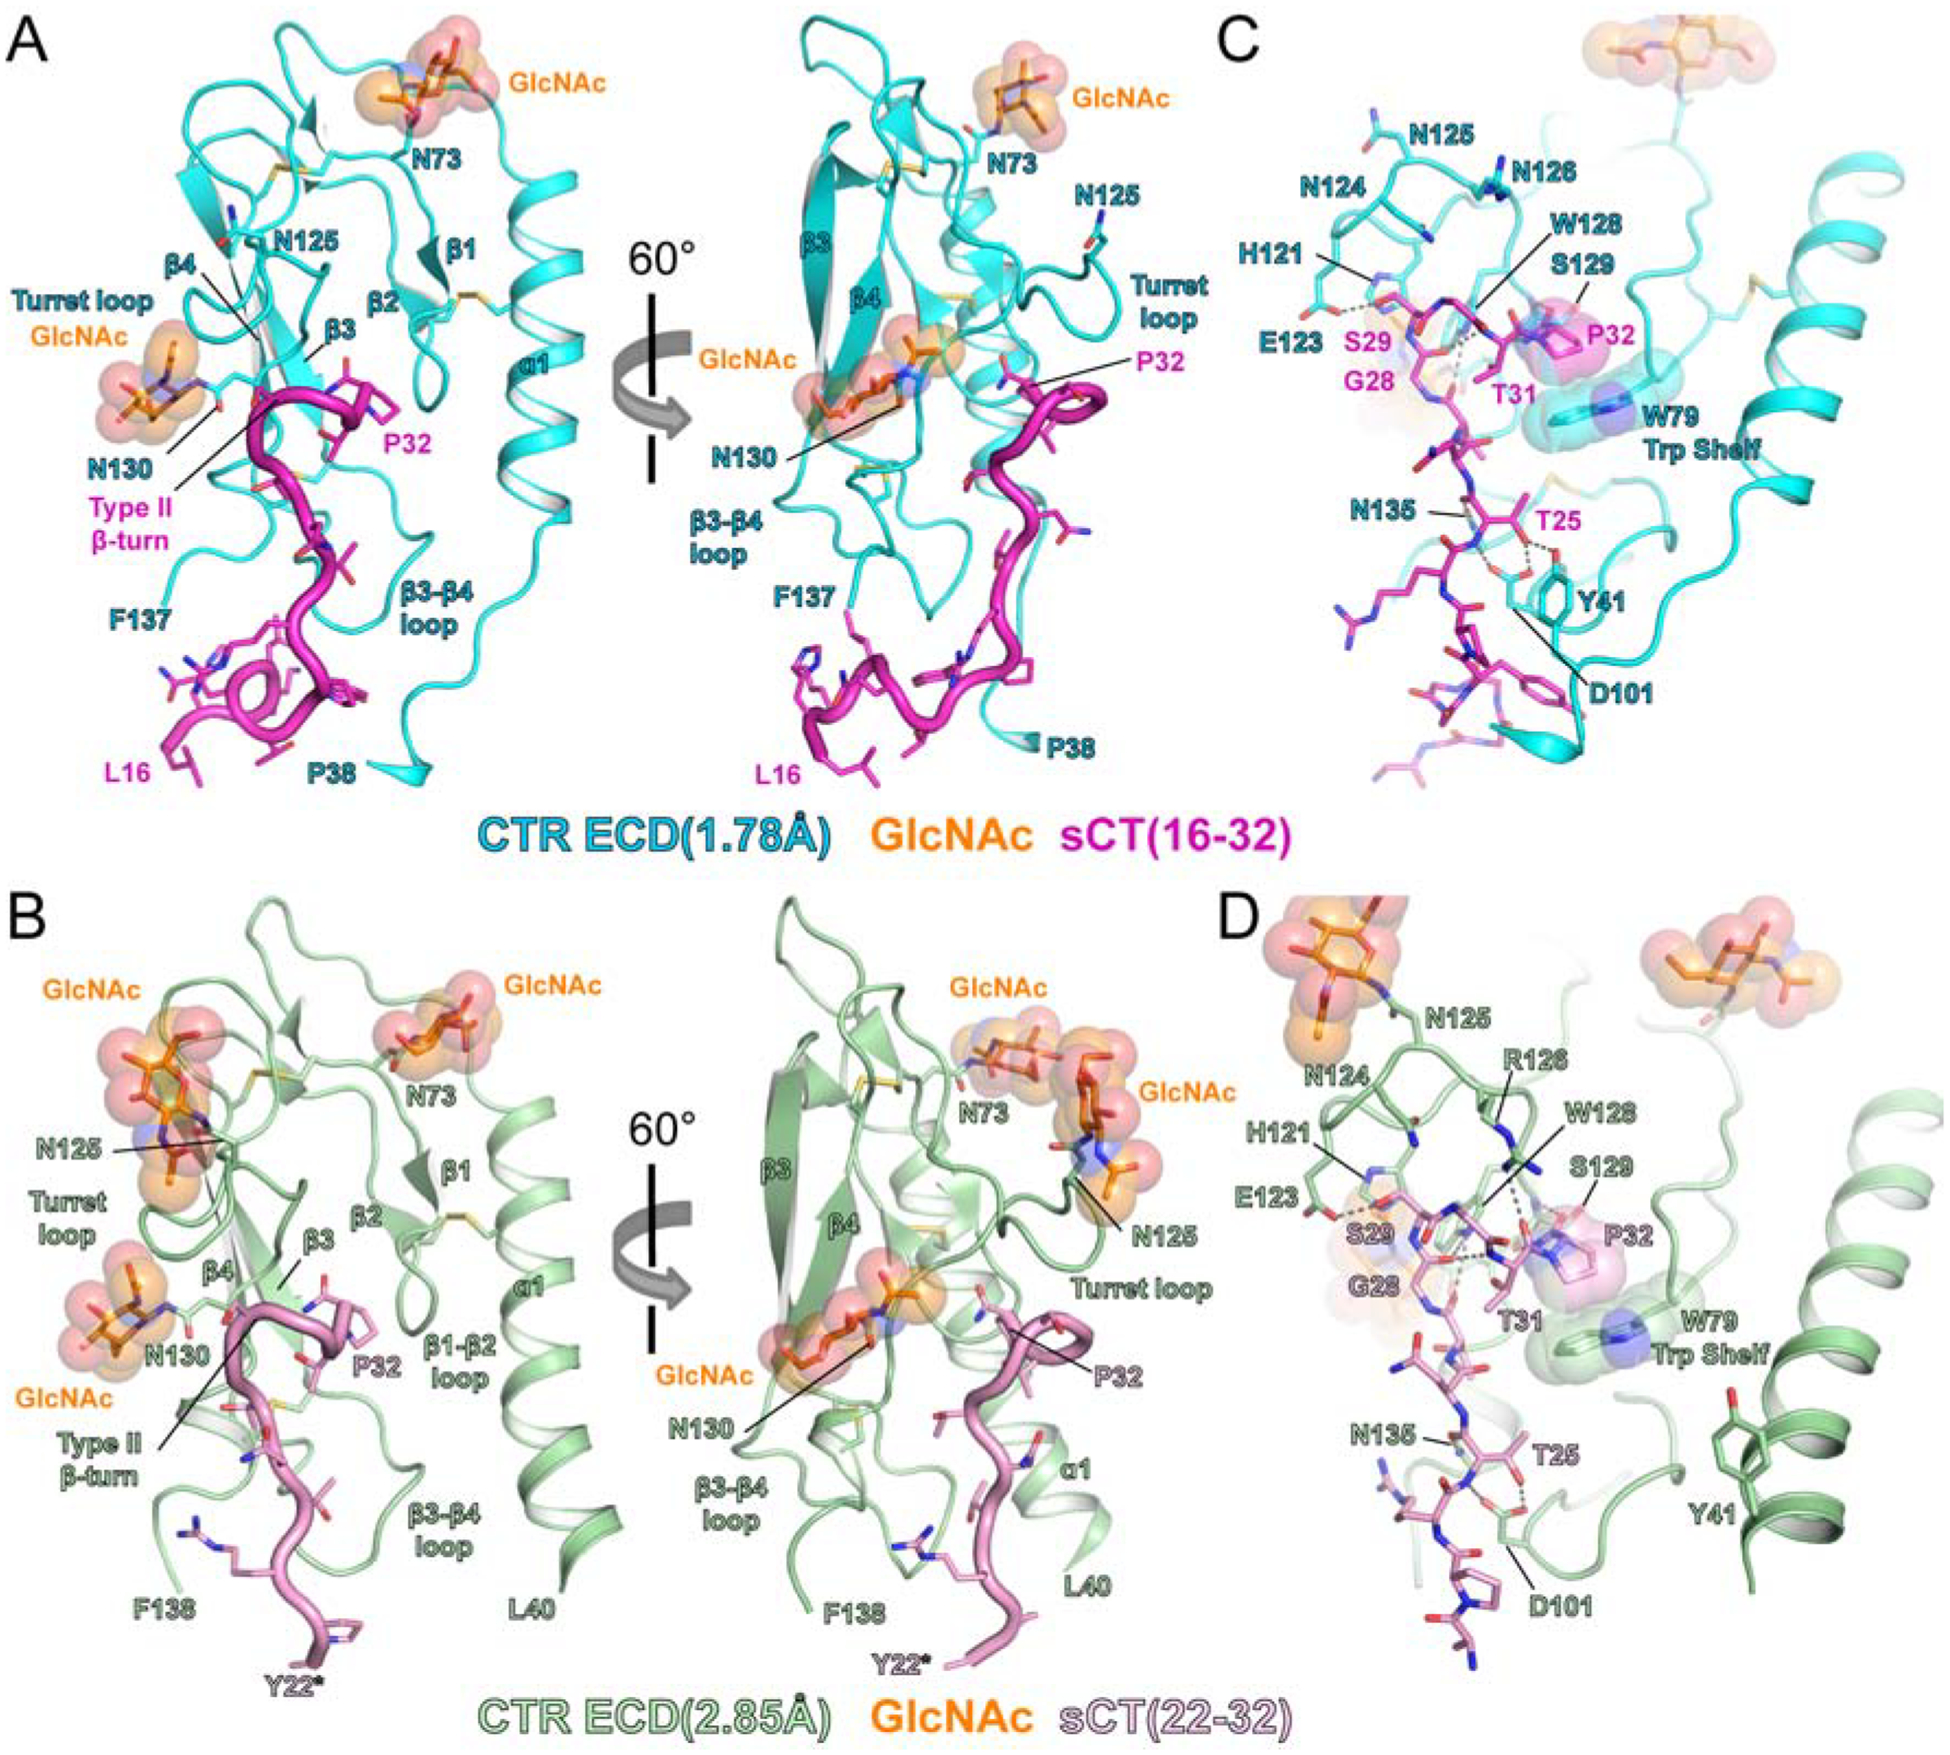
(A) The 1.78Å CTR ECD structure. (B) The 2.85Å CTR ECD structure. See Figure S1 for MBP-fused CTR ECD in the asymmetric unit cell. MBP is omitted for clarity. See Figure S2 for the electron density of N130 GlcNAc. (C and D) The detailed view of sCT interaction with CTR ECD. Hydrogen bonds are represented as a gray dotted line. See also Figure S4.
Effects of mutating CTR ECD residues near the N130 proximal GlcNAc
The structures suggested possible interaction of the N130 GlcNAc with neighboring CTR ECD residues; F119, W128, T132, M133, and T109 all have atoms within 4.5 Å of the GlcNAc. We investigated the mutational effects of these residues on peptide hormone affinity. In addition, we tested whether peptide affinity is still decreased by PNGase F-catalyzed receptor deglycosylation. If any of these residues mediates the GlcNAc effect, then mutation of the residue should decrease peptide affinity and peptide affinity should be unaffected or less-affected when N-glycans are removed by PNGase F treatment. We expressed and purified MBP-CTR ECD with the single F119H, F119L, W128H, M133A, or T109V mutation using HEK293T cells. T132 was not mutated, because this would eliminate N-glycosylation of N130. A fluorescence polarization/anisotropy assay was used to examine binding affinity of the purified fusion proteins for a FITC-labeled high-affinity calcitonin analog AC413(6–25) Y25P probe as previously described [18]. F119H and F119L mutations of CTR ECD designed to eliminate contact with the GlcNAc acetyl moiety decreased the peptide affinity by 3-fold. However, PNGase F treatment of these mutant receptors showed a further ~10-fold decrease in peptide affinity (Figure S3B, S3C, S3F, and S3G). CTR ECD W128 locates in the sCT-binding pocket and is within the hydrogen bond distance of the main chain carbonyls of sCT T27 and G28 (Figure 1C and 1D). The W128H mutation designed to maintain this hydrogen bonding potential while removing the indole contact with the GlcNAc acetyl moiety dramatically diminished the peptide binding affinity. When the W128H mutant receptor was treated with PNGase F, the peptide affinity appeared to be further decreased, although the full binding curve could not be obtained due to very weak affinity (Figure S3J and S3K). The M133A mutation of CTR ECD did not alter peptide affinity significantly (Figure S3N). CTR ECD T109 forms hydrogen bonds with two water molecules that connect T109 to N130 GlcNAc through hydrogen bonds (Figure S3O). The T109V mutation designed to eliminate the hydrogen bonds decreased the peptide affinity, but once again the peptide affinity was further decreased ~10-fold by PNGase F treatment (Figure S3P and S3Q). These results suggested that the side chains of these CTR residues do not mediate the GlcNAc effect.
The GlcNAc-bearing structures differ little from the structure of sCT bound to N-glycan free CTR ECD
We compared our structures to the structure of sCT bound to bacterially produced, N-glycan free CTR ECD [13] to look for GlcNAc effects on ECD and/or peptide conformations. Surprisingly, superimposition of our structures with the three sCT-CTR ECD complexes present in the asymmetric unit of PDB ID 5II0 (2.1 Å resolution) revealed very similar receptor and peptide conformations (Figure 2A and 2B). Mol A ECD of the 1.78 Å structure aligned to the three ECD molecules of 5II0 with RMSD values of 0.377 Å, 0.378 Å, and 0.349 Å, respectively. The 2.85 Å structure ECD aligned to the three ECD molecules of 5II0 with RMSD values of 0.358 Å, 0.298 Å, and 0.359 Å, respectively. The primary difference among the ECDs was the variability in the conformation of the N-terminal part of α1, indicating flexibility of this region that is most likely enabled by residue Gly 44. An interesting side note is that Y41 of CTR ECD Mol C in the glycan-free structure appears as though it might have formed a hydrogen bond with sCT T25 as observed in our 1.78 Å structure, if not for a urea molecule from the crystallization solution taking its place (Figure S4). The binding conformation of sCT for the CTR ECD was largely unchanged by N-glycosylation. sCT T25 to P32 residues were minimally affected, if at all, by CTR glycosylation. Y22 to R24 sCT residues positioned in several directions, which is likely due to increased flexibility of Y22 to R24 that escape the peptide-binding pocket of CTR ECD. These comparisons of static crystallographic snapshots failed to provide an obvious explanation for the glycan effect.
Figure 2. Comparisons of the GlcNAc-bearing structures to the N-glycan free CTR ECD structure.

(A) 1.78Å and (B) 2.85Å sCT-CTR ECD complexes were aligned with Mol A of the sCT-bound glycan-free CTR ECD from PDB ID 5II0. Mol B and Mol C of sCT-bound glycan-free CTR ECD were also aligned with sCT-bound glycan-free CTR ECD Mol A. See also Figure S4.
Receptor N-glycosylation increases the on rate and slows the off rate of sCT binding
We reasoned that the N130 GlcNAc might alter receptor dynamics. Indeed, our previous study suggested that RAMP1 functions in part by altering CTR ECD dynamics [16]. To enable experiments testing this hypothesis we expressed and purified MBP-free CTR ECD to remove any complications from the presence of MBP. This was done by purifying MBP-TEV cleavage site-CTR ECD fusions and removing the MBP with TEV protease. Three versions of CTR ECD were purified: Endo H-treated CTR ECD WT and N130D mutant produced in HEK293S GnTI− cells, and glycan-free CTR ECD WT produced in E. coli. Endo H was used to trim the glycans to the proximal GlcNAc residues. The CTR ECDs were highly purified, although the Endo H-treated CTR ECD WT and N130D proteins did exhibit a second minor band on SDS-PAGE due to incomplete Endo H trimming (Figure S5). The glycan-free ECD exhibited a tendency to aggregate at high concentrations; Johansson et al. also noted this behavior [13], and they crystallized their protein in the presence of 2 M urea to overcome this problem. Fortunately, the N130D ECD exhibited better solubility characteristics than the E. coli-produced protein, but it still could not be concentrated as high as the glycosylated WT ECD.
First, we measured the equilibrium binding affinities of sCT for the three CTR ECDs in the FP assay. The CTR ECD N130D mutation or the complete absence of N-glycans significantly decreased FITC-labeled sCT affinity by over 5-fold (Figure 3A and Table 2). Competitive binding assays also showed the affinity decrease of non-labeled sCT(22–32) by the N130D mutation or with glycan-free CTR ECD (Figure 3B and Table 2). These results are consistent with our previous findings with MBP-CTR ECD fusion proteins. Next, we analyzed the kinetics of binding to dissect the N-glycosylation effect on the on and off rates. For these experiments we used biolayer interferometry to measure real-time binding of the purified ECDs to sCT immobilized on the sensor tips. Figure 3C–3E shows the binding profile generated from each of the three CTR ECD proteins. Both association and dissociation rates for CTR ECD were altered by receptor N-glycosylation; sCT association was 2.8-fold decreased, whereas sCT dissociation was over 2-fold increased by the N130D mutation (Figure 3C and 3D and Table 3). The complete absence of N-glycans in E. coli-produced CTR ECD further decreased the sCT association rate (Figure 3D and 3E and Table 3). The calculated affinities (KD) from association and dissociation rates were comparable to the KD values obtained from the equilibrium FP assays.
Figure 3. Equilibrium and kinetic analyses of sCT binding to CTR ECD glycoforms.

(A) Equilibrium saturation binding FP assay assessing binding of the indicated CTR ECD glycoforms to a FITC-sCT(22–32) probe. (B) Equilibrium FP competition binding assay assessing displacement of the probe by unlabeled sCT(22–32). FP assay was performed with duplicate samples at each receptor concentration using FITC-sCT(22–32) as a probe. Data points in the plot were shown as mean with SEM as error bars. When the error bars were shorter than the height of the symbol, the error bars were omitted. (C-E) sCT binding kinetics was measured with biolayer interferometry assay. Mean values of KD, kon, and koff were shown. Representative curves of both FP and kinetic assays were shown from at least three independent experiments.
Table 2.
Peptide ligand affinity measured by FP assay
| Receptor ECD | Expression | Enzyme treatment | N | Mean ± SEM |
|---|---|---|---|---|
| Figure 3A | pKD of FITC-sCT(22–32) | |||
| CTR.38–141 WT | HEK293S GnTI− | Endo H | 5 | 6.30 ± 0.03 (0.50 ± 0.03)b |
| CTR.38–141 N130D | HEK293S GnTI− | Endo H | 3 | 5.70 ± 0.03a (2.0 ± 0.13) |
| Glycan-free CTR.38–141 WT | E. coli | None | 4 | 5.57 ± 0.03a (2.7 ± 0.20) |
| Figure 3B | pKI of sCT(22–32) | |||
| CTR.38–141 WT | HEK293S GnTI− | Endo H | 4 | 5.81 ± 0.03 (1.6 ± 0.12) |
| CTR.38–141 N130D | HEK293S GnTI− | Endo H | 3 | 5.26 ± 0.04a (5.6 ± 0.48) |
| Glycan-free CTR.38–141 WT | E. coli | None | 4 | 4.97 ± 0.07a (11 ± 1.7) |
| Figure S8A | pKD of FITC-AC413(6–25) | |||
| RAMP1-CTR.34–141 WT | HEK293S GnTI− | None | 3 | 5.89 ± 0.08 (1.3 ± 0.21) |
| CTR.34–141 WT | HEK293S GnTI− | None | 3 | 4.67 ± 0.12 (23 ± 5.8) |
| Figure S8B | pKD of FITC-sCT(22–32) | |||
| RAMP1-CTR.34–141 WT | HEK293S GnTI− | None | 3 | 6.56 ± 0.06 (0.28 ± 0.04) |
| CTR.34–141 WT | HEK293S GnTI− | None | 3 | 6.43 ± 0.06 (0.38 ± 0.06) |
| Figure S8D | pKD of FITC-AC413(6–25) | |||
| RAMP1-CTR.34–141 WT | HEK293S GnTI− | None | 3 | 6.04 ± 0.03 (0.92 ± 0.07) |
| RAMP1-CTR.34–141 WT | HEK293S GnTI− | Inactive PNGase F | 3 | 6.01 ± 0.03 (0.97 ± 0.06) |
| RAMP1-CTR.34–141 WT | HEK293S GnTI− | PNGase F | 3 | < 5.0 (> 10) |
| RAMP1-CTR.34–141 N130D | HEK293S GnTI− | None | 3 | 5.12 ± 0.07a (7.9 ± 1.4) |
| Figure S10C | pKD of FITC-AM analog | |||
| RAMP1-CLR.29–144 WT | HEK293T | None | 3 | 6.51 ± 0.02 (0.31 ± 0.01) |
| RAMP1-CLR.29–144 WT | HEK293T | Inactive PNGase F | 3 | 6.56 ± 0.07 (0.28 ± 0.05) |
| RAMP1-CLR.29–144 WT | HEK293T | PNGase F | 3 | 5.87 ± 0.04a (1.4 ± 0.13) |
| RAMP1-CLR.29–144 N123D | HEK293T | None | 3 | 6.13 ± 0.01a (0.74 ± 0.01) |
p < 0.05 compared to the glycosylated receptor ECD WT with Endo H treatment (Figure 3A and 3B) or none treatment (Figure S8D and S10C). ANOVA with Tukey’s post hoc test was used for statistical analysis.
KD or KI values in μM are given in parenthesis.
Table 3.
sCT binding kinetic parameters from biolayer interferometry
| CTR.38–141 | Mean ± SEM | ||||
|---|---|---|---|---|---|
| N | kon (1 × 10⁴/Ms) | koff (1/s) | Calculated KD (μM) | Steady state KD (μM) | |
| Endo H-treated WT | 3 | 17.8 ± 2.0 | 0.37 ± 0.02 | 2.1 ± 0.1 | 1.9 ± 0.2 |
| Endo H-treated N130D | 3 | 6.3 ± 1.0a | 0.73 ± 0.03a | 12.4 ± 2.5a | 11.9 ± 1.7a |
| Glycan-free WT | 3 | 2.1 ± 0.5a | 0.61 ± 0.03a | 30.9 ± 5.3a | 10.8 ± 2.2a |
All kinetic parameters were produced from ForteBio data analysis software (version 8.1).
p < 0.05 compared to Endo H-treated CTR.38–141 WT. ANOVA with Tukey’s post hoc test was used for statistical analysis.
N-glycosylation of CTR N130 alters ECD conformational dynamics
The N-glycosylation effect on the conformational dynamics of CTR ECD was analyzed using a combination of hydrogen-deuterium exchange mass spectrometry (HDX-MS) (Figure 4) and molecular dynamics simulations (Figure 5). HDX-MS probes the exchange rate between amide hydrogens within a protein and deuterium in the solvent, which is affected by solvent exposure and conformational dynamics and/or flexibility of the protein; higher deuterium uptake represents more solvent-exposure and/or higher conformational dynamics of the protein. For these experiments we compared the Endo H-treated WT and N130D CTR ECD proteins. The N-terminal part of the CTR ECD WT α1 helical region (residues 41–52) showed significantly less HDX signal than the N130D mutant (Figure 4A). The HDX signal of residues 41–52 reached a plateau over time. We found that the β3 strand and its adjacent loops (residues 84–96) showed a decrease in HDX signal with N-glycans (Figure 4B). The peptide fragment of residues 81–90 showed minimal changes by N-glycans (Figure S7) suggesting that the HDX signal of residues 84–96 resulted from residues 91–96. The β4 strand and its distal residues (residues 107–118) of CTR ECD WT also showed a significant decrease in HDX signal compared to the N130D mutant (Figure 4C). Interestingly, the conformational dynamics of the turret loop residues 119–127 in CTR ECD WT was greater than that of the N130D mutant (Figure 4D). We also obtained HDX-MS results of CTR ECDs in the presence of an excess of sCT (22–32). The differences in HDX signal between sCT-bound CTR ECD WT and N130D were consistent with those with ligand-free CTR ECD WT and N130D (Figure S6).
Figure 4. N-glycosylation of CTR N130 alters ECD conformational dynamics.

Selected CTR ECD residues corresponding to the peptide fragments were color-coded on the 2.85Å CTR ECD structure, and the deuterium uptake plots were provided. See Figure S6 for HDX results in the presence of excess sCT. See also Figure S7. HDX results were shown as mean ± SEM from at least three independent experiments. The statistically significant differences were analyzed by a Student’s t-test (*p < 0.05).
Figure 5. Molecular dynamics (MD) simulations with CTR ECD with or without GlcNAcs.

(A) RMSF (Root Mean Squared Fluctuation) for the dynamics of the GlcNAc-bearing 1.78Å CTR ECD and glycan-free CTR ECD (PDB 5II0). Residues 44–136 were used for all MD simulations. Averaged RMSF values were shown from two molecules of the 1.78Å structure and three molecules of glycan-free CTR ECD present in the asymmetric unit. (B) RMSF for the dynamics of the GlcNAc-removed 1.78Å CTR ECD and glycan-free CTR ECD (PDB 5II0). (C-F) RMSF of CTR ECD was visualized using VMD showing five representative frames during the MD simulations. Two end frames of each direction were colored with blue or red, and the middle frame was colored with gray.
We used molecular dynamics (MD) simulations coupled with principle component analysis (PCA) to investigate if CTR ECD dynamics are altered by receptor N-glycosylation. The first seven, non-zero, eigenvectors which covered 87–91% of the total motion were analyzed for each structure. Our high resolution 1.78Å CTR ECD structure and glycan-free structure (PDB 5II0) were used for the simulations. In the glycan-free CTR ECD crystal structure, three molecules of CTR ECD were in the asymmetric unit and the conformation of amino-terminal residues 34–43 was different among three molecules (Figure 2 and S4). The residue 136 of the 1.78 Å CTR ECD structure was modeled as the C-terminal end of the CTR ECD since electron density beyond this residue was very weak to model. For exact residue comparison, MD simulations were performed with residues 44 to 136 of the GlcNAc-bearing and glycan-free CTR ECD. PCA highlighted that the N-terminal α1 helical domain showed a significant reduction in the RMSF (Root Mean Squared Fluctuation) in the structures containing the GlcNAc residues compared to the non-glycosylated form. The reduced motion in domain can be attributed directly to the presence of the glycosylation (Figure 5A and 5C). The simulation result was consistent with the decreased flexibility inferred by HDX-MS in which CTR ECD residues 41 to 52, 84 to 96, and 107 to 118 were stabilized by the GlcNAc residues (Figure 5A, 5C, 5D, and 5E). In the simulations, N-glycosylation also stabilized residues 61–63 at the beginning of the loop following α1 (Figure 5A and 5D). Residues at the apex of the turret loop showed slightly increased flexibility with GlcNAcs compared to the loop of glycan-free CTR ECD, although this effect was subtle when visually represented (Figure 5F). We also performed MD simulations with the 1.78 Å CTR ECD structure model after the GlcNAc residues of N73 and N130 were deleted. The CTR ECD with GlcNAcs removed produced virtually the same RMSF as that of glycan-free CTR ECD (PDB 5II0) (Figure 5B). The RMSF patterns from MD simulations were consistent with the HDX-MS results and together they strongly suggest that the N130 proximal GlcNAc residue stabilizes the adjacent β-sheet and the N-terminal α-helix while increasing turret loop flexibility.
Receptor N-glycosylation also enhances peptide hormone affinity for amylin and CGRP receptors
Since glycosylation affected CTR ECD conformational dynamics we asked if the glycan effect was altered by binding of the RAMP1 or RAMP2 accessory proteins to CTR in the context of the AMY1 and AMY2 receptor ECD complexes. First, we expressed and purified a tethered fusion protein of the RAMP1 and CTR ECDs secreted from HEK293S GnTI− cells and compared its peptide binding selectivity profile to that of the isolated CTR ECD in the FP assay. The RAMP1-CTR ECD fusion showed a marked increase in affinity for the amylin analog AC413 when compared to CTR ECD alone, whereas sCT bound both proteins with similar affinities (Figure S8A and S8B). The tethered RAMP1-CTR ECD fusion thus exhibited the peptide binding profile expected of the AMY1 receptor. Next, we examined the effects of N-glycosylation on hormone binding to the RAMP1-CTR ECD fusion. RAMP1, which lacks N-glycosylation sites, is predicted to bind to the N-terminal α-helix of CTR and make minimal contact with the peptide (Figure S8C). PNGase F treatment of the RAMP1-CTR ECD fusion dramatically decreased the affinity of AC413 (Figure S8D and S8E and Table 2). The N130D mutation in CTR of the RAMP1-CTR ECD fusion also significantly decreased the peptide affinity, although not to the same extent as PNGase F treatment probably due to a small contribution from the N125 glycan as we previously observed for CTR ECD (Figure S8D and Table 2) [18]. We also purified a RAMP2-CTR ECD fusion. In this case RAMP2 ECD adds one additional N-glycosylation site. The RAMP2-CTR ECD fusion showed a higher amylin analog AC413 affinity, compared to CTR ECD alone (Figure S9A and S9B). Consistent with the results of RAMP1-CTR ECD fusion, PNGase F treatment of RAMP2-CTR ECD fusion significantly decreased the AC413 affinity (Figure S9C and S9D).
Last, we asked if the glycan effect is conserved in any other class B GPCRs. Amino acid sequence alignment of the ECDs of the fifteen human class B GPCRs revealed that the CTR N130 glycosylation site is conserved in six of the receptors including the related CTR-like receptor (CLR), the two parathyroid hormone receptors and the two corticotropin releasing factor receptors (Figure S10A). CLR is an obligate heterodimer with RAMPs and the CLR:RAMP1 complex is the calcitonin-gene related peptide (CGRP) receptor, which binds both CGRP and adrenomedullin (AM) peptides. We built a RAMP1:CLR ECD model bearing proximal GlcNAc residues by adding the glycans to the recently reported cryo-EM structure of the CGRP receptor (PDB 6E3Y) [22] (Figure S10B). Although the cryo-EM density for the ECD complex was low resolution, density for the proximal GlcNAc was apparent at each of the three glycan sites. This modeling exercise was consistent with the CLR N123 proximal GlcNAc (equivalent to CTR N130) adopting the same conformation observed in our CTR ECD structures and being too distant to contact the bound peptide. We purified a tethered RAMP1-CLR ECD fusion protein secreted from HEK293T cells and evaluated the effect of receptor N-glycosylation on binding of a high-affinity AM analog in the FP assay. PNGase F treatment significantly reduced the peptide affinity and the CLR N123 site was largely responsible for this effect as indicated by reduced affinity of the RAMP1-CLR fusion containing the CLR N123D mutation (Figure S10C and S10D and Table 2). These results indicated that the affinity-enhancing effect of receptor N-glycosylation is conserved in at least one other class B GPCR.
DISCUSSION
Structures of sCT bound to the glycosylated CTR ECD
The two new crystal structures of glycosylated CTR ECD with bound sCT C-terminal fragments reported here revealed receptor and peptide conformations in good agreement with those previously reported for the sCT-bound glycan-free ECD [13]. N-glycosylation clearly does not cause major conformational changes in the receptor or the bound peptide.. Apart from the issue of how N-glycans affect ligand-receptor interaction our structures revealed new information potentially relevant to the N-terminus of CTR and its ability to contact the ligand. In our high-resolution structure we observed a unique interaction of CTR Y41 with T25 of the peptide hormone that was not previously observed. This could be an artifact resulting from fusion of the ECD with MBP, but it nonetheless demonstrates the potential for N-terminal CTR residues to contact the ligand. Considerable flexibility of this CTR region is evident in comparisons of all the structures now available (Figure 2). Interestingly, previous cross-linking data with full-length CT and CTR identified proximity between residue 26 of CT and residue 30 of CTR [23]. It thus appears that the N-terminal region of CTR, including several residues lacking in our crystallization constructs, is probably quite dynamic and thereby able to approach the ligand. Whether such contacts play a significant role in CT signaling in cells is unclear. Notably, structural studies of the related CGRP and adrenomedullin receptors did not show the same level of flexibility in the N-terminal α-helix of CLR [24–26]. The CTR ECD appears to be more dynamic than that of CLR, at least for this region, and this might contribute to differences in the pharmacology of these two related receptors.
Mechanism of N-glycan-mediated enhancement of CTR peptide hormone affinity
N-glycosylation has been reported to play multiple functions, such as in protein folding, stability, and receptor-ligand interactions, all of which can contribute to ligand binding affinity [28–30]. N-glycosylation effects on sCT-CTR interaction had been elusive with mixed results [31–33] until recent reports clearly demonstrated a significant enhancement of hormone affinity conferred by N-glycosylation of CTR N130 [14, 18]. Nonetheless, the molecular mechanism of the glycan effect remained unknown. The crystal structures with GlcNAc-bearing CTR presented here showed that the proximal GlcNAc residue of N130 does not make direct contact with the sCT peptide. When we compared these structures to that of the glycan-free CTR ECD, the structural differences were minimal. This suggested that the static crystal structures were missing important differences in dynamics. We used MD simulations and HDX-MS in combination to probe the conformational dynamics of the glycosylated vs. the non-glycosylated forms of the protein. While MD and HDX-MS do report on the conformation dynamics, it should be noted that HDX will only report on mobility where there are changes in solvent accessibility of the peptide backbone; thus it would not be expected that there would be perfect agreement between MD simulations and HDX experiments [34]. In addition, our HDX-MS experiments compared WT glycosylated ECD to the N130D mutant that retains glycosylation at the N73 and N125 sites, whereas the MD simulations compared WT ECD with GlcNAcs to glycan-free WT ECD. Unfortunately, solubility challenges with the MBP- and glycan-free WT ECD prevented us from obtaining good HDX-MS data on this sample.
Despite the imperfect comparison, the HDX-MS results and the MD simulations were largely in agreement and together they indicated that the CTR N130 N-glycan altered CTR ECD conformational dynamics. These effects on dynamics enhanced the ligand on rate and slowed its off rate. Several regions of the ECD were stabilized by glycosylation including the N-terminal region of the CTR α-helix, which is distant from the N-glycan sites, the β-sheet comprising the β3 and β4 strands adjacent to the N130 GlcNAc responsible for ligand affinity enhancement, and residues 61–63 near the N73 GlcNAc. The stabilization of residues 41–52 may indirectly enhance the residency time of the bound peptide by acting as a buttress to position the β1-β2 loop of the receptor against the ligand. The side chain of Met 48 of CTR ECD is within ~4 Å distance from the W79 Trp shelf in our crystal structures. The stabilized dynamics of Met 48 could help Trp 79 confine its position and interact with C-terminal Pro 32 of the calcitonin peptide (Figure 1C). The β-sheet is a crucial structural element of the ECD fold, so its stabilization would be expected to contribute to overall domain stability including the peptide-binding site. The changes in residues 61–63 probably result from effects of the N73 GlcNAc on the adjacent Arg 74, which forms polar interactions with residues 62 and 63. This is likely of little importance because the N73 glycan has no effect on peptide hormone affinity [18]. In contrast to the multiple areas of decreased flexibility resulting from glycosylation, flexibility of the turret loop adjacent to the N130 glycan site was increased, although this effect was more evident in the HDX-MS data than in the MD simulations. The basis for this small discrepancy is unclear, but whatever the reason any alteration in turret loop dynamics is likely very relevant to ligand residency because the peptide β-turn directly contacts this loop.
How does the N130 GlcNAc exert its effects on CTR dynamics? Despite the apparent interaction of the GlcNAc with neighboring CTR residues such as F119 and W128, we were unable to find evidence that these residues mediated the GlcNAc effect. Although mutation of some of the residues in the vicinity of the GlcNAc resulted in decreased peptide affinity, in all cases examined the affinity of the mutant receptor was still further decreased by enzymatic deglycosylation. These results suggested that the GlcNAc effect is either mediated through a combination of these residues such that mutating any one alone does not reveal a significant effect or that the effect is mediated directly through the N130 residue itself or perhaps T132, which we could not mutate. Previous studies with glycopeptides have shown that N-glycans can alter conformational preference of the peptide backbone near the glycosylation site [35, 36]. The CTR N130 GlcNAc effect could be mediated through effects on the N130 backbone. Interestingly, the N130 backbone amide and carbonyl make hydrogen bonds with the backbone of T109 in the β4 strand, thus providing a physical link between the N130 glycan site and the adjacent β-sheet that is stabilized by the glycan. Additionally, glycosylation has recently been shown in MD simulations to control fluid dynamics of the bulk solvent and as a knock on effect of this altering allosteric communication to non-juxtaposed regions of the receptor [37]. In these cases, the underlying mechanism seems to be at least in part due to dynamic allostery, where changes in the dynamics (rather than the static structure) of a protein at one site cause effects at a more distant location [38, 39]. In broad terms, as the glycosylation at N130 is close to the β-sheet and turret loop it seems plausible that initial effects may occur on these elements and may then be progressively transmitted back down the rest of the receptor, appearing as regions of reduced or enhanced flexibility as observed.
Interestingly, the binding of either RAMP1 or RAMP2 to CTR did not appear to alter the glycan effect in the amylin receptors. Based on similarity to the CGRP receptor, the RAMPs very likely bind to the CTR α-helix. Presumably these contacts do not substantially alter the dynamics of the CTR ECD that are relevant to the glycan effect, although we have previously suggested that a major component of RAMP1 action is to alter the dynamics of the CTR, specifically the loop between β3 and β4, the loop distal to β4 and the turret loop and C-terminus [16]. It is intriguing that in the current study, we again find evidence for changed mobility in all of these areas except for the extreme C-terminus.
Overall effects of N-glycosylation on receptor function
The functions of protein N-glycosylation have been studied for several decades. Protein folding and consequential quality control of producing functional protein are often critical roles of N-glycans [28]. Glycans can modulate molecular interactions especially with the proteins expressing lectin domains or through steric effects on protein conformation and binding [29]. McElroy et al., reported a dramatic example of intermolecular binding promotion mediated by N-glycosylation of a cell surface receptor that bears similarities to our results presented here [40]. They showed that N-glycosylation of the IL-7 receptor α unit (IL-7Rα) ectodomain significantly increased IL-7 binding affinity. From the kinetics assay, this large affinity increase was primarily derived from an accelerated association rate of IL-7. They obtained crystal structures of glycosylated and non-glycosylated IL7/IL-7Rα complex and found that N-glycosylation of IL-7Rα did not induce large conformational changes and that IL-7 did not contact the receptor N-glycans. They speculated that the N-glycans altered the receptor conformational dynamics, but did not present evidence for this. N-glycan-mediated alteration of receptor dynamics may be a more widespread mechanism affecting ligand-receptor interactions than has been appreciated.
Studies with structural comparison were reported using available crystal structures of glycosylated proteins and their corresponding non-glycosylated versions [41, 42]. These reports found that N-glycosylation generally does not induce dramatic conformational changes of protein structure, consistent with our findings for CTR. Lee et al. further performed MD simulations and reported that N-glycosylation decreased the dynamic fluctuations of the proteins tested, which probably increased their stabilities. Interestingly, in the case of our CTR results shown here we not only observed an N-glycan-mediated stabilizing effect, but also an increased flexibility of the turret loop in the peptide-binding site. Our results thus suggest that N-glycans may in some cases also increase protein dynamics to enhance ligand-receptor interactions.
N-glycosylation effects on other class B GPCRs
The class B GPCR ECD fold is highly conserved. Notably, six of the fifteen human class B GPCRs have an N-glycosylation site equivalent to CTR N130 raising the possibility that ligand interactions with other class B GPCRs may be also be affected by N-glycosylation. Early reports on N-glycosylation effects on the related CLR yielded conflicting results with evidence both for and against a role of N-glycosylation in ligand binding at CLR [43, 44]. Here, we showed that the glycan effect is conserved in the heterodimeric CGRP receptor (RAMP1-CLR) and that the N123 site was responsible for the effect. Given the modeling of GlcNAcs on the CGRP receptor presented in Figure S10 it seems likely that the CLR N123 GlcNAc does not contact the bound peptide ligand and probably does not significantly alter the binding mode. Thus, we propose that the CLR N123 N-glycan alters CLR dynamics similar to what we observed here for CTR.
Interestingly, although the PTH1R receptor has N-glycan sites equivalent to CTR N130 and N125 in the turret loop there is clear evidence that PTH1R N-glycosylation has no effect on receptor function. Tunicamycin treatment with the human PTH type 1 receptor (PTH1R) expressed in mammalian cells showed no changes in PTH binding affinity and PTH potency for the receptor activation [45]. The recent crystal structure of the human full-length PTH1R with bound PTH showed that a fucose attached to the proximal GlcNAc residue of PTH1R N161 in the turret loop locates in proximity to the main chain of PTH Y34 and forms a polar interaction [46]. However, the N161D mutation of PTH1R did not change the binding affinity for PTH indicating that the glycan interaction with PTH Y34 observed in the crystal structure is dispensable for PTH binding to its receptor. Figure S10E shows structural comparison with PTH1R ECD-PTH and CTR ECD-sCT. The proximal GlcNAc residue of PTH1R N166 positions similarly to that of CTR N130. However, the ECD binding C-terminal part of PTH was much closer to the α1 region of PTH1R than corresponding sCT. In addition, the turret loop of PTH1R ECD is more distant from PTH than the distance of the turret loop of CTR ECD from sCT. These structural differences may contribute to the differences in N-glycosylation effects at these two receptors. Compared to a relatively stable PTH helical domain, the flexible conformation of sCT may also be involved in the affinity-enhancing effect of receptor N-glycosylation.
Other class B GPCRs have also been reported to elicit N-glycosylation effects on their functions. Chen et al., showed that the glucagon-like peptide 1 receptor (GLP-1R) significantly reduced GLP-1 affinity and signaling potency by the double mutations of two N-glycosylation sites [47]. Pituitary adenylate cyclase activating polypeptide (PACAP) type I (PAC1) receptor showed a significant 30-fold decrease in PACAP-27 affinity by tunicamycin treatment without altering binding capacity [48]. In addition, mutagenesis of N-glycosylation sites was reported to diminish the expression level of the glucose-dependent insulinotropic polypeptide (GIP) receptor [49], the vasoactive intestinal peptide (VIP) 1 receptor [50], the glucagon receptor (GCGR) [51], and the secretin receptor [52]. The corticotropin releasing factor receptor type 1 (CRF1R) with a single N-glycosylation site mutation expressed the receptor comparable to WT. However, the combined mutations of three sites decreased the receptor expression and consequentially reduced ligand binding and CRF potency for receptor activation [53]. Interestingly, the corresponding N130 residue of CTR ECD is conserved as N98 of CRF1R and CRF2R. How N-glycans of CRF1R N98 contribute to CRF binding affinity still remains to be clearly addressed in a future study.
Closing remarks
Class B GPCRs are physiologically important receptors and drug targets of multiple drugs. Evidence provided by this study suggests that N-glycosylation of CTR extracellular domain modulates receptor dynamics rather than global conformation. Amylin and CGRP receptors also enhance ligand affinity by receptor N-glycosylation. Most of other class B GPCRs and various cell surface receptors have shown that N-glycans at least to some degree contribute to their cell surface expression and/or functions. Although there are exceptions against the currently known functions of protein N-glycans, structural mechanism provided by this study suggests that dynamic allostery, an important concept little applied to GPCRs, may be significant for understanding their mechanisms. This information will inform the GPCR field and can be considered for peptide drug development towards improved binding profile.
MATERIALS AND METHODS
Reagents
DMEM with 4.5 g/L glucose and L-glutamine, and non-essential amino acid mixture were purchased from Lonza (Basel, Switzerland). FBS was from Life Technologies (Carlsbad, CA). HEK293S GnTI− and HEK293T cells were purchased from ATCC (Manassas, VA) and ThermoScientific (Waltham, MA), respectively. PNGase F was purchased from New England Biolabs (NEB, Ipswich, MA). Gibson Assembly Master Mix and required restriction enzymes were purchased from NEB. Crystal screening blocks were purchased from Hampton Research (Aliso Viejo, CA). All other reagents were purchased from Sigma-Aldrich (St. Louis, MO), unless otherwise noted.
Cell lines
HEK293S GnTI− cells were used to express glycosylated MBP-CTR ECD with Man5GlcNAc2 N-glycans, which are sensitive to Endo H-mediated N-glycan trimming. CTR ECD WT and N130D mutant and RAMP1-CTR ECD fusion WT and N130D mutant were also expressed from HEK293S GnTI− cells. HEK293T cells were used to express fully glycosylated MBP-CTR ECD, RAMP1-CLR ECD fusion, and their mutants. HEK293T cells were cultured at 37C, 5% CO2 in Dulbecco’s Modified Eagle Media (DMEM) plus 10% fetal bovine serum (FBS). HEK293S GnTI− cells were cultured at the same condition and media as those used for HEK293T cells except supplementing non-essential amino acid mixture to the culture media. Both cell lines were directly purchased from the suppliers and have not been authenticated. Information on sex of the cell lines is not available.
Bacterial cells
Origami B DE3 cells from Novagen containing the trxB gor mutations were used for expression and purification of MBP-TEV cleavage site-CTR ECD from E. coli.
Plasmids
pHLsec-based vectors were used for N-glycosylated protein expression from mammalian cells as secreted proteins [54]. The Gibson Assembly method was used for constructing plasmids and mutagenesis of receptor ECDs. pHLsec/MBP-hCTR.38–141-H6 (pSL015) and pHLsec/MBP-hCTR.40–141-H6 (pSL017) were generated for crystal screening of MBP-CTR ECD. pHLsec/MBP-hCTR.38–141-H6 W128H (pSL018), F119L (pSL019), F119H (pSL020), M133A (pSL021), and T109V (pSL022) were produced for a mutagenesis study. MBP in above plasmids contain a linker sequence NAAAEF at the C-terminal end of MBP sequence. Plasmids of pHLsec/MBP-TEV cleavage site-hCTR.34–141-H6 (pSL052), pHLsec/MBP-TEV cleavage site-hCTR.38–141-H6 WT (pSL031) and N130D (pSL033), pHLsec/MBP-TEV cleavage site-hRAMP1.24–111-(GSA)3-hCTR.34–141-H6 WT (pSL041) and N130D (pSL048), pHLsec/MBP-TEV cleavage site-hRAMP2.55–140-(GSA)3-hCTR.38–141-H6 (pSL042), and pHLsec/MBP-TEV cleavage site-hRAMP1.24–111-(GS)5-hCLR.29–144-H6 WT (pSL039) and N123D (pSL047) were generated to produce MBP-free receptor ECDs. A pETDuet-1 vector was used for the expression of MBP-TEV cleavage site-CTR.38–141-H6 from E.coli as a glycan-free from (pSL035). The TEV cleavage site represented in above plasmids encodes GSSSGGGENLYFQGS including a linker prior to a TEV cleavage site. Coding sequences of all plasmids were confirmed by automated DNA sequencing performed by the University of Oklahoma Health Sciences Center Laboratory for Molecular Biology and Cytometry Research core facility. These plasmids were purified for transient transfection using a Macherey-Nagel Midi or Giga kit according to the manufacturer’s directions.
Glycosylated receptor ECD expression and purification
General procedures of glycosylated receptor MBP-ECD expression and purification were previously described [12, 18]. All purifications were performed at 4°C unless otherwise noted. To produce MBP-CTR ECD bearing proximal GlcNAcs for crystallization, glycosylated MBP-CTR ECD was expressed from HEK293S GnTI− cells in six roller bottles (MIDSCI, Cat# HRBV-1900, 1900 cm2/bottle, rolling speed 0.2 RPM) at 37°C for 4 days after plasmid transfection with polyethyleneimine (PEI). The expressed MBP-CTR ECD was purified with immobilized Ni metal affinity chromatography (IMAC). The peak fractions were pooled and incubated with 1:10 ratio (w/w, Endo H: protein), while dialyzing to 25 mM MOPS (pH 6.5) and 150 mM NaCl at 4°C overnight. Next day, pH of the mixture was adjusted to pH 7.5 with 1 M Tris HCl (pH 9.0) and purified with IMAC. The peak fractions were pooled and concentrated using a spin concentrator with 10kDa MWCO (Millipore). The concentrated solution was purified with size-exclusion chromatography (SEC). The Endo H-treated MBP-CTR ECD purified as a monomer and was used for crystal screening. Fully glycosylated MBP-CTR ECD WT and mutants were expressed from HEK293T cells in six T175 flasks for 3 days at 37°C after PEI transfection and purified with IMAC and following SEC. The monomer peak fractions were pooled, dialyzed to storage buffer (25 mM HEPES pH 7.5, 150 mM NaCl, and 50% (v/v) glycerol) overnight, and stored at −80°C until use.
For BLI and HDX-MS experiments, Endo H-treated, MBP-free CTR ECD WT and N130D were produced as below. MBP-TEV cleavage site-CTR ECD WT and N130D were first expressed from HEK293S GnTI− cells in six roller bottles as described above. Expressed proteins were purified by IMAC and the peak fractions were pooled and incubated with 1:5 ratio (w/w, TEV protease: protein) at 20°C for 6 h. Then, the reaction mixture was incubated with 1:10 ratio (w/w, Endo H: protein), while dialyzing to 25 mM MOPS (pH 6.5) and 150 mM NaCl at 4°C overnight. Next day, pH of the equilibrated mixture was adjusted to pH 7.5 with 1M Tris HCl (pH 9.0) and the pH-adjusted mixture was further purified with IMAC and following SEC. The peak fractions were pooled, dialyzed to storage buffer described above, and stored at −80°C until use.
To produce MBP-free RAMP1-CTR ECD and RAMP1-CLR ECD fusions, MBP-TEV cleavage site-receptor ECD was expressed from HEK293S GnTI− or HEK293T cells. The expressed MBP-TEV cleavage site-receptor ECD was initially purified by IMAC. Then, the peak fractions were pooled and incubated with 1:5 ratio (w/w, TEV protease: protein) at 20°C overnight. After TEV protease reaction, the mixture was purified with IMAC and following SEC. The peak fractions were pooled, dialyzed to storage buffer described above, and stored at −80°C until use. Receptor ECD concentrations were measured by either UV absorbance at 280 nm using extinction coefficients calculated from Tyr, Trp and Cystine residues or Bradford assay with a BSA standard curve.
Glycan-free receptor ECD expression in bacteria and purification
General procedures of glycan-free MBP-CTR ECD expression and its purification were previously described [18]. MBP-TEV cleavage site-CTR ECD expressed from E. coli Origami B (DE3) was purified with IMAC. The peak fractions were pooled and subjected to disulfide shuffling reaction in the presence of RAMP2 ECD at 20°C overnight for proper folding. Next day, the reaction mixture was purified with amylose affinity chromatography and following SEC. The purified sample was incubated with 1:5 ratio (w/w, TEV protease: protein) at 20°C for 6 h. Then, the reaction mixture was dialyzed to 50 mM Tris HCl (pH 7.5), 150 mM NaCl, 10% (v/v) glycerol at 4°C overnight to remove bound maltose. Next day, the equilibrated mixture was applied to amylose affinity chromatography. The peak fractions were pooled and further purified with IMAC. The final peak fractions were dialyzed to storage buffer described above and stored at −80°C until use.
Synthetic peptides
All peptides used in this study were custom-synthesized and HPLC-purified by RS Synthesis (Louisville, KY). The lyophilized powders were dissolved in sterile ultrapure water at an approximate peptide concentration of 10 mg/mL and multiple aliquots were stored at −80°C until use. The peptide stock concentration was determined by UV absorbance at 280 nm using extinction coefficients calculated from Tyr, Trp and Cystine residues after the peptide was 50-fold diluted with 10 mM Tris and 1 mM EDTA (pH 8.0). A FITC extinction coefficient (72,000 M−1 cm−1 at 495 nm, pH 8.0) was used to measure the concentration of FITC-labeled peptides.
Crystallization, diffraction data collection, structure solution, and refinement
Endo H-treated MBP-CTR.38–141-H6 and MBP-CTR.40–141-H6 were incubated with sCT(16–32) and sCT(22–32), respectively at 1:1.3 molar ratio (protein: peptide) for 1 h on ice. The protein-peptide mixture was concentrated to 30 mg/mL as previously described [24]. Crystals of MBP-CTR.38–141-H6 with sCT(16–32) were grown by hanging drop vapor diffusion in 34% (v/v) pentaerythritol ethoxylate (15/4 EO/OH), 0.05M Bis-Tris (pH 6.8), and 0.1 M ammonium sulfate. In addition, crystals of MBP-CTR.40–141-H6 with sCT(22–32) was grown by hanging drop vapor diffusion in 1.94 M ammonium sulfate and 0.1 M sodium acetate (pH 4.7). The MBP-CTR.38–141-H6 crystals were flash frozen in liquid nitrogen without any additional cryoprotectant, whereas the MBP-CTR.40–141-H6 crystals were dialyzed overnight to the reservoir solution supplemented with 15% (v/v) ethylene glycol for cryoprotection and flash frozen in liquid nitrogen. Diffraction data were collected remotely at the LS-CAT beamlines 21-ID-F and -G of the Advanced Photon Source (Argonne, IL). A set of diffraction images from a single crystal was processed with HKL2000 [55] and the CCP4 suite [56]. Phaser was used for molecular replacement (MR) with MBP and CTR ECD (PDB 5II0, chain A) as search models (both ligand-free). The MR model was rebuilt and ligands and GlcNAcs were added with COOT [57]. REFMAC5 [58] was used for TLS and restrained refinement. Automatic NCS restrains were applied for the sCT(16–32)-bound MBP-CTR.38–141-H6 structural model with two molecules in the asymmetric unit.
For modeling GlcNAcs with energetically favorable 4C1 conformation, the torsion angles of GlcNAc (three letter code for REFMAC library: NAG) were restrained. The process of GlcNAc model building with the 4C1 conformation was previously described [59]. A normal NAG library file was generated with ACEDRG software in the CCP4 suite [60], which produced the lowest energy NAG conformer. Torsion angles of the lowest energy conformer were measured using Pymol. The generic torsion angles of the NAG library file were replaced with the measured torsion angles of the lowest energy NAG conformer. The torsion angle-restrained NAG was added to asparagine of CTR ECD using a carbohydrate module in COOT. The normal NAG-ASN linker file was also generated using JLigand [61] and was combined with the torsion angle-restrained NAG library file to produce a single library file for REFMAC5 refinement. After final refinement with REFMAC5, Privateer software in the CCP4 suite was used to validate the geometry and conformation of GlcNAcs [62]. All GlcNAcs added in the CTR ECD structural models retained the 4C1 conformation without any stereochemical problems.
Fluorescence polarization/anisotropy (FP) peptide binding assay
Equilibrium peptide binding assay with saturation and competition binding formats was performed as previously described at room temperature [18]. FITC-labeled sCT(22–32), AC413(6–25) WT, AC413(6–25) [Y25P], and AM(37–52) [S45W/Q50W] were used as probes. The reaction buffer consists of 50 mM HEPES (pH 7.4), 150 mM NaCl, 0.5 mg/mL fatty acid-free BSA, 0.5 mM maltose, 0.5 mM EDTA, and 0.1% (v/v) Tween 20. A probe concentration 10 nM was used in all experiments except 7 nM was used for FITC-AM(37–52) [S45W/Q50W]. For the competition-binding assay, a receptor concentration that is two times the KD value was used (KD 501 nM, KD 1995 nM, and KD 2691 nM for Endo H-treated CTR ECD WT, N130D, and E. coli-produced CTR ECD, respectively). A PolarStar Omega plate reader (BMG Labtech) was used to read fluorescence polarization/anisotropy. Data analysis and nonlinear regression curve fitting were performed with PRISM 7.0 as previously described [18].
PNGase F-catalyzed deglycosylation
Glycosylated receptor ECDs produced from HEK293S GnTI− or HEK293T cells were treated with PNGase F to remove all N-glycans as previously described [18].
BLI kinetic assay
Endo H-treated CTR ECD WT and N130D and E. coli-produced glycan-free CTR ECD WT were used for BLI kinetic assay. An Octet-RED96 system with streptavidin-coated sensors (ForteBIO, SAX biosensors) was used to measure binding kinetics with an immobilized, biotinylated sCT(1–32) [C1A/C7A] peptide. The assay buffer was 50 mM HEPES (pH 7.4), 150 mM NaCl, 5 mg/mL fatty acid-free BSA, 0.5 mM maltose, 0.5 mM EDTA, and 0.1% (v/v) Tween 20. All steps were conducted at 25°C with each biosensor stirred at 1000 RPM in 0.2 mL of samples. The biosensors were pre-equilibrated with the assay buffer for at least 30 min before use. The sensors were first equilibrated with the assay buffer for 120 sec. Then, the sensors were loaded with 25 nM biotinylated sCT for 200 sec, which occupies ~ 25% of total binding capacity of each sensor. After 60 sec washing and additional 120 sec equilibrium steps with the assay buffer, the sensors were dipped into CTR ECD samples to measure an association rate for 50 sec. Then, the sensors were transferred to the wells with assay buffer alone for 100 sec to start the dissociation phase. The standard kinetics (5.0Hz, averaging by 20) was used as an acquisition rate. ForteBio data analysis software (version 8.1) was used to obtain kinetic parameters. Five different concentrations of CTR ECD were used for the kinetic assay. Endo H-treated and glycan-free CTR ECDs in the assay buffer did not show non-specific binding to the sensor. Endo H-treated CTR ECD N130D showed non-specific binding for the sensor to some degrees particularly at 4 μM concentration. The non-specific binding of high concentration CTR ECD N130D to an empty sensor was subtracted from the total binding signal of the samples. The reference well with the assay buffer alone was used as baseline for other samples for data processing. After reference well subtraction, Y axis was aligned according to BLI signal during the last 5 sec of the equilibrium step prior to the association. Inter-step correction was performed by aligning to the dissociation phase and Savitzky-Golay filtering option was applied. Both association and dissociation phases from the process data were used for curve fitting by applying a 1:1 binding model and a global fitting option. Processed BLI signals and their curve fitting results (until 50 sec of the dissociation phase) were exported from ForteBio data analysis software and PRISM 7.0 was used for figure representation.
HDX-MS analysis
Following protein samples are prepared in 100 μM: Endo H-treated CTR ECD WT and N130D either with or without 100 μM sCT. Hydrogen/deuterium exchange was initiated by mixing 4 μL of each protein samples with 26 μL of D2O buffer (25 mM HEPES, pD 7.4, 150 mM NaCl, 10% glycerol) and incubating for 10, 100, 1000, or 10000 sec on ice. For the sCT-bound samples, 15 μM salmon calcitonin was additionally added in the D2O buffer. At the indicated time points, each mixture was quenched by adding 30 μL of ice-cold quenching buffer (0.1 M NaH2PO4, pH 2.01, 20 mM TCEP, 1 M guanidine hydrochloride). For non-deuterated samples, 4 μL of protein samples are mixed with 26 μL of H2O buffer (25 mM HEPES, pH 7.4, 150 mM NaCl, 10% glycerol) and quenched by 30 μL of ice-cold quench buffer. Back-exchange level was not corrected because all the data is comparison of different states and the fully deuterated samples were aggregated. The quenched samples were digested by passing through an immobilized pepsin column (2.1 × 30 mm) (Life Technologies, Carlbad, CA, USA) at a flow rate of 100 μL/min with 0.05% formic acid in H2O at 12°C. The digested fragments were collected on a C18 VanGuard trap column (Waters, Milford, MA, USA) and desalted with 0.15% formic acid in H2O. The fragments were subsequently separated by ultra-pressure liquid chromatography using an ACQUITY UPLC C18 column (1.7 μm, 1.0 mm × 100 mm) (Waters, Milford, MA, USA) at a flow rate of 40 μL/min with an acetonitrile gradient starting with 8% and increasing to 85% over 7.5 min. To minimize the back exchange of deuterium to hydrogen, the system including trapping and UPLC column was maintained at 0.5°C during the analysis and all buffers were adjusted to pH 2.5. Peptic peptides were identified from the non-deuterated samples with ProteinLynx Global Server (PLGS) 3.0 (Waters, Milford, MA, USA). The following parameters were applied: monoisotopic mass, nonspecific enzyme digestion allowing up to one missed cleavage, automatic fragment mass tolerance and automatic peptide mass tolerance. Searches were performed with the variable methionine oxidation modification. The amount of deuterium of peptic peptides at each time point was determined by measuring the centroid of the isotopic distribution using DynamX 3.0 (Waters, Milford, MA, USA).
MD simulations
Replica Exchange Monte Carlo (REMC) simulations were performed using Gromacs software [63] with sixteen temperatures ranging between 300–500K; 1 node a temperature point were used in all simulations. Three chains (Mol A, B, and C) of glycan-free CTR ECD structure (PDB 5II0), two chains (Mol A and B) of 1.78Å CTR ECD structure, and their non-glycosylated versions without GlcNAc residues were used. Residues 44 to 136 of the 1.78Å CTR ECD structure were selected for MD simulations to make a complete comparison to glycan-free CTR ECD (PDB 5II0). Alternative backbone A of 1.78Å CTR ECD Mol B structure was chosen since it is more consistent with the corresponding region of CTR ECD Mol A. The REMC simulations used 16 temperatures ranging between 300 to 500K and lasted for 500 ns. The resulting trajectory of three chains of glycan-free CTR ECD and two chains of either glycosylated or non-glycosylated CTR ECD were combined and first eigenvector was used to calculate RMSF. VMD was used to visualize CTR ECD flexibility during the MD simulations [64].
Molecular modeling and structure figures
Pymol (Schrodinger) was used for the representation of the structural figures. The structural models of MBP-CTR ECD W128H, F119H, F119L, M133A, and T109V mutants were generated by the mutagenesis wizard in Pymol. Glycosylated and glycan-free CTR ECDs were superimposed by aligning CTR ECDs with Pymol. For the glycosylated CGRP receptor ECD structure, the cryo EM structure of the full-length CGRP receptor was used (PDB 6E3Y) and the proximal GlcNAc residues of its ECD were modeled with COOT based on the cryo EM density map of N-glycans. The homology model of the amylin receptor ECD was generated based on the full-length CGRP receptor structure (PDB 6E3Y) by replacing CLR ECD with the 2.85Å CTR ECD structure after alignment. PTH1R ECD (PDB 6FJ3) was aligned with the 2.85Å CTR ECD structure using Pymol.
Sequence alignment of class B GPCR ECDs
ClustalX2 was used with identity matrix for sequence alignment [65]. The alignment was adjusted minimally for conserved residues. The following human class B GPCR ECDs were used: calcitonin receptor (CALCR, CBN80566.1), calcitonin-like receptor (CLR, AAA62158.1), parathyroid hormone receptor 1 (PTH1R, AAR18076.1), parathyroid hormone receptor 2 (PTH2R, EAW70451.1), corticotropin-releasing factor receptor 1 (CRFR1, AAC69993.1), corticotropin-releasing factor receptor 2 isoform 2 precursor (CRFR2b, NP_001189404.1), glucagon-like peptide-1 receptor (GLP1R, AAA17021.1), glucagon-like peptide 2 receptor (GLP2R, NP_004237.1), glucagon receptor (GCGR, AAC52063.1), secretin receptor (SCTR, AAA64949.1), growth hormone-releasing hormone receptor (GRHR, AAA35890.1), GIP receptor (GIPR, AAA84418.1), pituitary adenylate cyclase activating polypeptide 1 receptor (PAC1, EAW93978.1), vasoactive intestinal peptide receptor 1 (VIPR1, AAH64424.1), and vasoactive intestinal peptide receptor 2 (VIPR2, EAX04596.1). ESPript 3.0 was used for figure representation [66].
Statistical analysis
Three or more independent experiments (on different days) were performed both for FP equilibrium binding assay and BLI kinetic assay, unless otherwise noted. Duplicate samples of each receptor concentration were used for the individual FP equilibrium binding experiment, while BLI kinetics assay used a single sample of each receptor concentration. pKD and pKI from FP binding assay and kon, koff, and calculated pKD from BLI kinetic assay were reported as Mean ± SEM. PRISM 7.0 was used for one-way analysis of variance (ANOVA) followed by Tukey’s post-hoc test for multiple comparisons. For HDX-MS, a Student’s t-test was used. p < 0.05 was regarded as statistical significance. The details of statistical analysis used for the representative figures can be found in the figure legends.
Supplementary Material
HIGHLIGHTS.
How N-glycosylation enhances ligand affinity of the calcitonin receptor is unknown.
Crystal structures of calcitonin bound to N-glycosylated calcitonin receptor ECD.
MD simulations and HDX-MS experiments show that N-glycans modulate ECD dynamics.
N-glycans similarly enhance ligand affinity of related amylin and CGRP receptors.
N-glycosylation of GPCRs can modulate their function by altering receptor dynamics.
ACKOWLEDGMENTS
We thank Elena Kondrashkina for assistance with remote data collection at LS-CAT beamline 21-ID-F/G of the Advanced Photon Source, Argonne National Laboratory. This research used resources of the Advanced Photon Source, a U.S. Department of Energy (DOE) Office of Science User Facility operated for the DOE Office of Science by Argonne National Laboratory under Contract No. DE-AC02-06CH11357. Use of the LS-CAT Sector 21 was supported by the Michigan Economic Development Corporation and the Michigan Technology Tri-Corridor (Grant 085P1000817). We thank Dr. Ann West and Skyler Hebdon for helping us use their biolayer interferometry instrument. This work was supported by NIH grant R01GM104251 to AAP, the National Research Foundation of Korea grant NRF-2018R1A2B6001554 to KYC, and use of the crystal imaging microscope was supported by NIH COBRE award P20GM103640. DRP and JS were supported by the BBSRC grant BB/M007529/1; research data relating to this is accessible via https://researchdata.aston.ac.uk/cgi/users/home?screen=EPrint::View&eprintid=433.
Footnotes
Publisher's Disclaimer: This is a PDF file of an unedited manuscript that has been accepted for publication. As a service to our customers we are providing this early version of the manuscript. The manuscript will undergo copyediting, typesetting, and review of the resulting proof before it is published in its final form. Please note that during the production process errors may be discovered which could affect the content, and all legal disclaimers that apply to the journal pertain.
DECLARATION OF INTERESTS
The authors declare no competing interests.
REFERENCES
- [1].Purdue BW, Tilakaratne N, Sexton PM. Molecular pharmacology of the calcitonin receptor. Receptors & channels. 2002;8:243–55. [PubMed] [Google Scholar]
- [2].Masi L, Brandi ML. Calcitonin and calcitonin receptors. Clin Cases Miner Bone Metab. 2007;4:117–22. [PMC free article] [PubMed] [Google Scholar]
- [3].Chesnut CH 3rd, Azria M, Silverman S, Engelhardt M, Olson M, Mindeholm L. Salmon calcitonin: a review of current and future therapeutic indications. Osteoporosis international : a journal established as result of cooperation between the European Foundation for Osteoporosis and the National Osteoporosis Foundation of the USA. 2008;19:479–91. [DOI] [PubMed] [Google Scholar]
- [4].Christopoulos G, Perry KJ, Morfis M, Tilakaratne N, Gao Y, Fraser NJ, et al. Multiple amylin receptors arise from receptor activity-modifying protein interaction with the calcitonin receptor gene product. Molecular pharmacology. 1999;56:235–42. [DOI] [PubMed] [Google Scholar]
- [5].Muff R, Buhlmann N, Fischer JA, Born W. An amylin receptor is revealed following co-transfection of a calcitonin receptor with receptor activity modifying proteins-1 or -3. Endocrinology. 1999;140:2924–7. [DOI] [PubMed] [Google Scholar]
- [6].Armour SL, Foord S, Kenakin T, Chen WJ. Pharmacological characterization of receptor-activity-modifying proteins (RAMPs) and the human calcitonin receptor. Journal of pharmacological and toxicological methods. 1999;42:217–24. [DOI] [PubMed] [Google Scholar]
- [7].Liberini CG, Boyle CN, Cifani C, Venniro M, Hope BT, Lutz TA. Amylin receptor components and the leptin receptor are co-expressed in single rat area postrema neurons. The European journal of neuroscience. 2016;43:653–61. [DOI] [PMC free article] [PubMed] [Google Scholar]
- [8].Bower RL, Eftekhari S, Waldvogel HJ, Faull RL, Tajti J, Edvinsson L, et al. Mapping the calcitonin receptor in human brain stem. Am J Physiol Regul Integr Comp Physiol. 2016;310:R788–93. [DOI] [PubMed] [Google Scholar]
- [9].Hay DL, Chen S, Lutz TA, Parkes DG, Roth JD. Amylin: Pharmacology, Physiology, and Clinical Potential. Pharmacological reviews. 2015;67:564–600. [DOI] [PubMed] [Google Scholar]
- [10].McQueen J. Pramlintide acetate. Am J Health Syst Pharm. 2005;62:2363–72. [DOI] [PubMed] [Google Scholar]
- [11].Hoare SR. Mechanisms of peptide and nonpeptide ligand binding to Class B G-protein-coupled receptors. Drug Discov Today. 2005;10:417–27. [DOI] [PubMed] [Google Scholar]
- [12].Lee SM, Hay DL, Pioszak AA. Calcitonin and Amylin Receptor Peptide Interaction Mechanisms: INSIGHTS INTO PEPTIDE-BINDING MODES AND ALLOSTERIC MODULATION OF THE CALCITONIN RECEPTOR BY RECEPTOR ACTIVITY-MODIFYING PROTEINS. J Biol Chem. 2016;291:8686–700. [DOI] [PMC free article] [PubMed] [Google Scholar]
- [13].Johansson E, Hansen JL, Hansen AM, Shaw AC, Becker P, Schaffer L, et al. Type II Turn of Receptor-bound Salmon Calcitonin Revealed by X-ray Crystallography. J Biol Chem. 2016;291:13689–98. [DOI] [PMC free article] [PubMed] [Google Scholar]
- [14].Liang YL, Khoshouei M, Radjainia M, Zhang Y, Glukhova A, Tarrasch J, et al. Phase-plate cryo-EM structure of a class B GPCR-G-protein complex. Nature. 2017;546:118–23. [DOI] [PMC free article] [PubMed] [Google Scholar]
- [15].Ed Maso, Glukhova A, Zhu Y, Garcia-Nafria J, Tate CG, Atanasio S, et al. The Molecular Control of Calcitonin Receptor Signaling. ACS Pharmacology & Translational Science. 2019;2:31–51. [DOI] [PMC free article] [PubMed] [Google Scholar]
- [16].Gingell J, Simms J, Barwell J, Poyner DR, Watkins HA, Pioszak AA, et al. An allosteric role for receptor activity-modifying proteins in defining GPCR pharmacology. Cell Discov. 2016;2:16012. [DOI] [PMC free article] [PubMed] [Google Scholar]
- [17].Albrandt K, Brady EM, Moore CX, Mull E, Sierzega ME, Beaumont K. Molecular cloning and functional expression of a third isoform of the human calcitonin receptor and partial characterization of the calcitonin receptor gene. Endocrinology. 1995;136:5377–84. [DOI] [PubMed] [Google Scholar]
- [18].Lee SM, Booe JM, Gingell JJ, Sjoelund V, Hay DL, Pioszak AA. N-Glycosylation of Asparagine 130 in the Extracellular Domain of the Human Calcitonin Receptor Significantly Increases Peptide Hormone Affinity. Biochemistry. 2017;56:3380–93. [DOI] [PMC free article] [PubMed] [Google Scholar]
- [19].Soto AG, Smith TH, Chen B, Bhattacharya S, Cordova IC, Kenakin T, et al. N-linked glycosylation of protease-activated receptor-1 at extracellular loop 2 regulates G-protein signaling bias. Proc Natl Acad Sci U S A. 2015;112:E3600–8. [DOI] [PMC free article] [PubMed] [Google Scholar]
- [20].Pioszak AA, Xu HE. Molecular recognition of parathyroid hormone by its G protein-coupled receptor. Proc Natl Acad Sci U S A. 2008;105:5034–9. [DOI] [PMC free article] [PubMed] [Google Scholar]
- [21].Reeves PJ, Callewaert N, Contreras R, Khorana HG. Structure and function in rhodopsin: high-level expression of rhodopsin with restricted and homogeneous N-glycosylation by a tetracycline-inducible N-acetylglucosaminyltransferase I-negative HEK293S stable mammalian cell line. Proc Natl Acad Sci U S A. 2002;99:13419–24. [DOI] [PMC free article] [PubMed] [Google Scholar]
- [22].Liang YL, Khoshouei M, Deganutti G, Glukhova A, Koole C, Peat TS, et al. Cryo-EM structure of the active, Gs-protein complexed, human CGRP receptor. Nature. 2018;561:492–7. [DOI] [PMC free article] [PubMed] [Google Scholar]
- [23].Dong M, Pinon DI, Cox RF, Miller LJ. Importance of the amino terminus in secretin family G protein-coupled receptors. Intrinsic photoaffinity labeling establishes initial docking constraints for the calcitonin receptor. J Biol Chem. 2004;279:1167–75. [DOI] [PubMed] [Google Scholar]
- [24].Booe JM, Walker CS, Barwell J, Kuteyi G, Simms J, Jamaluddin MA, et al. Structural Basis for Receptor Activity-Modifying Protein-Dependent Selective Peptide Recognition by a G Protein-Coupled Receptor. Mol Cell. 2015;58:1040–52. [DOI] [PMC free article] [PubMed] [Google Scholar]
- [25].Booe JM, Warner ML, Roehrkasse AM, Hay DL, Pioszak AA. Probing the Mechanism of Receptor Activity-Modifying Protein Modulation of GPCR Ligand Selectivity through Rational Design of Potent Adrenomedullin and Calcitonin Gene-Related Peptide Antagonists. Molecular pharmacology. 2018;93:355–67. [DOI] [PMC free article] [PubMed] [Google Scholar]
- [26].Roehrkasse AM, Booe JM, Lee SM, Warner ML, Pioszak AA. Structure-function analyses reveal a triple beta-turn receptor-bound conformation of adrenomedullin 2/intermedin and enable peptide antagonist design. J Biol Chem. 2018;293:15840–54. [DOI] [PMC free article] [PubMed] [Google Scholar]
- [27].Dong M, Pinon DI, Cox RF, Miller LJ. Molecular approximation between a residue in the amino-terminal region of calcitonin and the third extracellular loop of the class B G protein-coupled calcitonin receptor. J Biol Chem. 2004;279:31177–82. [DOI] [PubMed] [Google Scholar]
- [28].Helenius A, Aebi M. Intracellular functions of N-linked glycans. Science. 2001;291:2364–9. [DOI] [PubMed] [Google Scholar]
- [29].Ohtsubo K, Marth JD. Glycosylation in cellular mechanisms of health and disease. Cell. 2006;126:855–67. [DOI] [PubMed] [Google Scholar]
- [30].Wormald MR, Dwek RA. Glycoproteins: glycan presentation and protein-fold stability. Structure. 1999;7:R155–60. [DOI] [PubMed] [Google Scholar]
- [31].Ho HH, Gilbert MT, Nussenzveig DR, Gershengorn MC. Glycosylation is important for binding to human calcitonin receptors. Biochemistry. 1999;38:1866–72. [DOI] [PubMed] [Google Scholar]
- [32].Moseley JM, Findlay DM, Gorman JJ, Michelangeli VP, Martin TJ. The calcitonin receptor on T 47D breast cancer cells. Evidence for glycosylation. The Biochemical journal. 1983;212:609–16. [DOI] [PMC free article] [PubMed] [Google Scholar]
- [33].Quiza M, Dowton M, Perry KJ, Sexton PM. Electrophoretic mobility and glycosylation characteristics of heterogeneously expressed calcitonin receptors. Endocrinology. 1997;138:530–9. [DOI] [PubMed] [Google Scholar]
- [34].Devaurs D, Antunes DA, Papanastasiou M, Moll M, Ricklin D, Lambris JD, et al. Coarse-Grained Conformational Sampling of Protein Structure Improves the Fit to Experimental Hydrogen-Exchange Data. Front Mol Biosci. 2017;4:13. [DOI] [PMC free article] [PubMed] [Google Scholar]
- [35].Imperiali B, Rickert KW. Conformational implications of asparagine-linked glycosylation. Proc Natl Acad Sci U S A. 1995;92:97–101. [DOI] [PMC free article] [PubMed] [Google Scholar]
- [36].Live DH, Kumar RA, Beebe X, Danishefsky SJ. Conformational influences of glycosylation of a peptide: a possible model for the effect of glycosylation on the rate of protein folding. Proc Natl Acad Sci U S A. 1996;93:12759–61. [DOI] [PMC free article] [PubMed] [Google Scholar]
- [37].Ramya L. Role of N-glycan in the structural changes of myelin oligodendrocyte glycoprotein and its complex with an antibody. J Biomol Struct Dyn. 2019:1–10. [DOI] [PubMed] [Google Scholar]
- [38].Haliloglu T, Bahar I. Adaptability of protein structures to enable functional interactions and evolutionary implications. Curr Opin Struct Biol. 2015;35:17–23. [DOI] [PMC free article] [PubMed] [Google Scholar]
- [39].Motlagh HN, Wrabl JO, Li J, Hilser VJ. The ensemble nature of allostery. Nature. 2014;508:331–9. [DOI] [PMC free article] [PubMed] [Google Scholar]
- [40].McElroy CA, Dohm JA, Walsh ST. Structural and biophysical studies of the human IL-7/IL-7Ralpha complex. Structure. 2009;17:54–65. [DOI] [PMC free article] [PubMed] [Google Scholar]
- [41].Lee HS, Qi Y, Im W. Effects of N-glycosylation on protein conformation and dynamics: Protein Data Bank analysis and molecular dynamics simulation study. Sci Rep. 2015;5:8926. [DOI] [PMC free article] [PubMed] [Google Scholar]
- [42].Xin F, Radivojac P. Post-translational modifications induce significant yet not extreme changes to protein structure. Bioinformatics. 2012;28:2905–13. [DOI] [PubMed] [Google Scholar]
- [43].Gujer R, Aldecoa A, Buhlmann N, Leuthauser K, Muff R, Fischer JA, et al. Mutations of the asparagine117 residue of a receptor activity-modifying protein 1-dependent human calcitonin gene-related peptide receptor result in selective loss of function. Biochemistry. 2001;40:5392–8. [DOI] [PubMed] [Google Scholar]
- [44].Kamitani S, Sakata T. Glycosylation of human CRLR at Asn123 is required for ligand binding and signaling. Biochim Biophys Acta. 2001;1539:131–9. [DOI] [PubMed] [Google Scholar]
- [45].Bisello A, Greenberg Z, Behar V, Rosenblatt M, Suva LJ, Chorev M. Role of glycosylation in expression and function of the human parathyroid hormone/parathyroid hormone-related protein receptor. Biochemistry. 1996;35:15890–5. [DOI] [PubMed] [Google Scholar]
- [46].Ehrenmann J, Schoppe J, Klenk C, Rappas M, Kummer L, Dore AS, et al. High-resolution crystal structure of parathyroid hormone 1 receptor in complex with a peptide agonist. Nat Struct Mol Biol. 2018;25:1086–92. [DOI] [PubMed] [Google Scholar]
- [47].Chen Q, Miller LJ, Dong M. Role of N-linked glycosylation in biosynthesis, trafficking, and function of the human glucagon-like peptide 1 receptor. Am J Physiol Endocrinol Metab. 2010;299:E62–8. [DOI] [PMC free article] [PubMed] [Google Scholar]
- [48].Cao Y, Gimpl G. A constitutively active pituitary adenylate cyclase activating polypeptide (PACAP) type I receptor shows enhanced photoaffinity labeling of its highly glycosylated form. Biochim Biophys Acta. 2001;1548:139–51. [DOI] [PubMed] [Google Scholar]
- [49].Whitaker GM, Lynn FC, McIntosh CH, Accili EA. Regulation of GIP and GLP1 receptor cell surface expression by N-glycosylation and receptor heteromerization. PLoS One. 2012;7:e32675. [DOI] [PMC free article] [PubMed] [Google Scholar]
- [50].Couvineau A, Fabre C, Gaudin P, Maoret JJ, Laburthe M. Mutagenesis of N-glycosylation sites in the human vasoactive intestinal peptide 1 receptor. Evidence that asparagine 58 or 69 is crucial for correct delivery of the receptor to plasma membrane. Biochemistry. 1996;35:1745–52. [DOI] [PubMed] [Google Scholar]
- [51].Johswich A, Longuet C, Pawling J, Abdel Rahman A, Ryczko M, Drucker DJ, et al. N-glycan remodeling on glucagon receptor is an effector of nutrient sensing by the hexosamine biosynthesis pathway. J Biol Chem. 2014;289:15927–41. [DOI] [PMC free article] [PubMed] [Google Scholar]
- [52].Pang RT, Ng SS, Cheng CH, Holtmann MH, Miller LJ, Chow BK. Role of N-linked glycosylation on the function and expression of the human secretin receptor. Endocrinology. 1999;140:5102–11. [DOI] [PubMed] [Google Scholar]
- [53].Assil IQ, Abou-Samra AB. N-glycosylation of CRF receptor type 1 is important for its ligand-specific interaction. Am J Physiol Endocrinol Metab. 2001;281:E1015–21. [DOI] [PubMed] [Google Scholar]
- [54].Aricescu AR, Lu W, Jones EY. A time- and cost-efficient system for high-level protein production in mammalian cells. Acta Crystallogr D Biol Crystallogr. 2006;62:1243–50. [DOI] [PubMed] [Google Scholar]
- [55].Otwinowski Z, Minor W. Processing of X-ray diffraction data collected in oscillation mode. Methods Enzymol. 1997;276:307–26. [DOI] [PubMed] [Google Scholar]
- [56].Winn MD, Ballard CC, Cowtan KD, Dodson EJ, Emsley P, Evans PR, et al. Overview of the CCP4 suite and current developments. Acta Crystallogr D Biol Crystallogr. 2011;67:235–42. [DOI] [PMC free article] [PubMed] [Google Scholar]
- [57].Emsley P, Lohkamp B, Scott WG, Cowtan K. Features and development of Coot. Acta Crystallogr D Biol Crystallogr. 2010;66:486–501. [DOI] [PMC free article] [PubMed] [Google Scholar]
- [58].Murshudov GN, Vagin AA, Dodson EJ. Refinement of macromolecular structures by the maximum-likelihood method. Acta Crystallogr D Biol Crystallogr. 1997;53:240–55. [DOI] [PubMed] [Google Scholar]
- [59].Agirre J, Ariza A, Offen WA, Turkenburg JP, Roberts SM, McNicholas S, et al. Three-dimensional structures of two heavily N-glycosylated Aspergillus sp. family GH3 beta-D-glucosidases. Acta Crystallogr D Struct Biol. 2016;72:254–65. [DOI] [PMC free article] [PubMed] [Google Scholar]
- [60].Long F, Nicholls RA, Emsley P, Graaeulis S, Merkys A, Vaitkus A, et al. AceDRG: a stereochemical description generator for ligands. Acta Crystallogr D Struct Biol. 2017;73:112–22. [DOI] [PMC free article] [PubMed] [Google Scholar]
- [61].Lebedev AA, Young P, Isupov MN, Moroz OV, Vagin AA, Murshudov GN. JLigand: a graphical tool for the CCP4 template-restraint library. Acta Crystallogr D Biol Crystallogr. 2012;68:431–40. [DOI] [PMC free article] [PubMed] [Google Scholar]
- [62].Agirre J, Iglesias-Fernandez J, Rovira C, Davies GJ, Wilson KS, Cowtan KD. Privateer: software for the conformational validation of carbohydrate structures. Nat Struct Mol Biol. 2015;22:833–4. [DOI] [PubMed] [Google Scholar]
- [63].Lindahl E, Hess B, van der Spoel D. GROMACS 3.0: a package for molecular simulation and trajectory analysis. J Mol Model. 2001;7:306–17. [Google Scholar]
- [64].Humphrey W, Dalke A, Schulten K. VMD: visual molecular dynamics. J Mol Graph. 1996;14:33–8, 27–8. [DOI] [PubMed] [Google Scholar]
- [65].Larkin MA, Blackshields G, Brown NP, Chenna R, McGettigan PA, McWilliam H, et al. Clustal W and Clustal X version 2.0. Bioinformatics. 2007;23:2947–8. [DOI] [PubMed] [Google Scholar]
- [66].Robert X, Gouet P. Deciphering key features in protein structures with the new ENDscript server. Nucleic Acids Res. 2014;42:W320–4. [DOI] [PMC free article] [PubMed] [Google Scholar]
Associated Data
This section collects any data citations, data availability statements, or supplementary materials included in this article.