Abstract
Background
Secondary lymphedema is a common condition that affects patients with malignant tumors. Conservative treatments fail to provide lasting relief because they do not address the underlying pathological accumulation of excessive fat. Our aim is to clarify the molecular mechanisms of abnormal adipogenic differentiation in lymphedema adipose tissue.
Methods
We compared the proliferation and adipogenesis potential of adipose-derived mesenchymal stem cells (ASCs) from the lymphedema adipose tissue from liposuction specimens of 10 patients with extremity lymphedema with that of ASCs from adipose tissue from the normal upper abdomen of the same patients. Transcriptome analysis were performed to identify the differences between the two kinds of ASCs. Cyclin-dependent kinase 1 (CDK1) inhibitors were used to treat the abnormal ASCs in lymphedema adipose tissue.
Results
Our results demonstrate that significant functional and transcriptomic differences exist between the two kinds of ASCs. Up-regulated genes were mainly involved in cell proliferation and division while down-regulated genes were mainly associated with immune responses and inflammatory as well as osteogenic and myogenic differentiation. Furthermore, we find that the excessive proliferation and adipogenesis of ASCs from lymphedema adipose tissue returned to the normal phenotype by CDK1 inhibitors. ASCs from lymphedema adipose tissues have higher immunosuppressive effect and the cytokines related to immunosuppressive was significantly up-regulated.
Conclusions
In conclusion, lymphedema-associated ASCs had more rapid proliferation and a higher adipogenic differentiation capacity. CDK1 may be a key driver of proliferation and adipogenic differentiation in these cells, which might expound the accumulation of adipose tissue extensively observed in secondary lymphedema. ASCs from lymphedema adipose tissues showed immunomodulation dysfunction and immunomodulation may play an important role in the pathogenesis of lymphedema.
Keywords: Adipogenesis, adipose-derived mesenchymal stem cells (ASCs), cyclin-dependent kinase 1 (CDK1), proliferation, secondary lymphedema, immunomodulation
Introduction
Secondary lymphedema is a common condition that affects patients with malignant tumors. There is presently no cure for lymphedema, which is one of the most painful and unpleasant sequelae among cancer survivors (1). Conservative treatment is still the main means to remedy lymphedema; however, these treatments fail to provide thorough solution because they do not address the underlying pathological accumulation of excessive fat (2).
Lymphedema complication is mainly caused by the damage to or removal of lymph nodes as a part of breast and gynecologic cancer treatment. The blockage in the lymphatic system hampers the lymphatic drainage and induces the accumulation of fluid. It further results in chronic inflammation, adipose deposition, fibrosis, and swelling in the affected area. In the late stage of lymphedema, adipose deposition is reluctant to mechanical treatments (e.g., compressive garments, manual lymphatic massage, etc.) and is related to severe infections, skin changes, and functional disability (3). More recently, liposuction has been used extensively to remove the excess adipose tissue of limbs in late-stage lymphedema (4). It also helps to examine whether the stromal fraction of adipose tissue in lymphedema is different from that of unaffected adipose tissue of the same person.
Adipose-derived mesenchymal stem cells (ASCs) have been identified from the stromal vascular fraction of adipose tissue (5,6). ASCs have a high plasticity and can differentiate into various types of cells, including adipocytes, osteoblasts, chondrocytes, myocytes, hepatocytes, neural cells, endothelial cells, and epithelial cells (7-13). The adipogenic potential of ASCs has been well studied, and articles have been published about ASCs in vitro adipogenesis (14-16). We hypothesize that ASCs in lymphedema tissue have significant differences from those cells in normal subcutaneous fat in terms of gene expression and differentiation capacity, which could account for the adipose deposition seen in secondary lymphedema patients. In the present study, we described the functional differences between ASCs from lymphedema and normal adipose tissue in malignancy-related lymphedema, explored the transcriptomic differences between two kinds of ASCs, studied the effect of cyclin-dependent kinase 1 (CDK1) inhibitors on lymphedema adipose tissue, and explored the immunosuppressive effect of ASCs from lymphedema and normal adipose tissue.
Methods
Isolation and maintenance of human ASCs
This study was approved by the Ethics Committee of Peking Union Medical College Hospital. Liposuction specimens were obtained from the affected thighs of ten patients with lymphedema to form the lymphedema group. As for control, our samples were mainly from patients who have undergone gynecologic cancer, considering the risk of lymphedema in the other extremity, we chose the normal upper abdomen of the same patients to form the normal group. All patients had signed the informed consents. Stromal vascular fraction cells were isolated as described previously (17). Briefly, liposuction specimens were cleaned with Hank’s balanced salt solution (HBSS) (14025-126, Thermo Fisher Scientific, Waltham, MA, USA) several times to remove the blood cells and then were digested with 0.1% collagenase type I (17100-017, Invitrogen, Carlsbad, CA, USA) supplied with 4% penicillin streptomycin solution (P/S) (15070-063, Thermo Fisher Scientific) at 37 °C for 30 min. Digested adipose tissues were centrifuged at 1,500 rpm for 10 min, and the pellet was resuspended in HBSS, filtered through a 100-um strainer. The samples were subsequently centrifuged at 1,500 rpm for 5 min at 4 °C to obtain a pellet containing the stromal vascular cell fraction. The centrifugation step was repeated. The pellets were resuspended in fresh media for ASCs culture. After 1 day, the nonadherent cells were removed by two or three washes with HBSS, and medium changes were performed every 2 days thereafter. The cells were expanded using TrypLETM Express Enzyme (12605093, Thermo Fisher Scientific) at a ratio of 1:3 until they achieved 80% confluence. The cell morphology was monitored using an inverted microscope. Experiments were conducted using ASCs at passage 3. For culturing and expansion of ASCs, the cells were cultured in low-glucose Dulbecco’s modified eagle medium (DMEM) (11885-092, Thermo Fisher Scientific) and 15% fetal bovine serum (FBS) (10099141, Thermo Fisher Scientific).
Cell proliferation assay and small-molecule inhibitor efficacy evaluation
An enhanced cell counting kit-8 (CCK8) (C0042, Beyotime Biotechnology, Shanghai, China) was used for the cell proliferation assays and for the evaluation of the small-molecule inhibitor efficacy. For the cell proliferation assays, the cells were plated in 96-well plates at a density of 6,000 cells per square centimeter, and the medium was replaced every 2 days. The regular cultured cells were detected with CCK8 at 36, 48, 72, 96, 120 and 144 h in triplicate, and each experiment was repeated independently in three donors. For small-molecule inhibitor efficacy evaluation, the cells were plated in 96-well plates at a density of 12,000 cells per square centimeter, and different concentrations of small-molecule inhibitors were added (JNJ: 0, 125, 250, 500, 750, or 1,000 nM; Ro-3306: 0, 1.25, 2.5, 5, 7.5, or 10 µM; PurA: 0, 3.125, 6.25, 12.5, 25, or 50 µM) (S1249, S7747, S7793, Selleckchem, USA) after cell attachment. The treated cells were detected with CCK8 at 12, 24, 48, 72 and 120 h in triplicate, and each experiment was repeated independently in three donors. The optical density (OD) values were detected by a Tecan Sunrise at 450 nm.
Adipogenic differentiation and characterization of ASCs
Cells were plated in 12-well plates at a density of 12,000 cells per square centimeter; the medium was replaced every 2 days. Once the ASCs became 100% confluent, the cells were induced in adipogenic induction medium (PT-3102B, Lonza, Basel, Switzerland) supplemented with h-insulin (recombinant), L-glutamine, MCGS, dexamethasone, indomethacin, IBMX (3-isobuty-1-methylxanthine), and GA-1000 for 3 days followed by 3 days of culture in adipogenic maintenance medium (PT-3102A, Lonza) supplemented with h-insulin (recombinant), L-glutamine, MCGS, and GA-1000. After 2 complete cycles of induction/maintenance, the extent of adipogenic differentiation was observed under a light microscope. Each experiment was repeated independently in four donors. The cells were then fixed with 4% paraformaldehyde and stained with Oil Red O (E607319, BBI Life Sciences, Shanghai, China) and the Oil Red O staining area was measured using ImageJ (https://imagej.nih.gov/ij/) to evaluate the degree of adipogenesis. We averaged the values of 10 images of each sample for the Oil Red O staining for statistical analysis. For the flow cytometric analysis, 5×10⁵ ASCs [in 100 µL phosphate-buffered saline (PBS)] were incubated with various fluorescently labeled monoclonal antibodies (anti-human CD45-PE, anti-human CD31-PE, anti-human HLA-DR-FITC, anti-human CD29-PE, anti-human CD44-PE, anti-human HLA-A, B, C-PE, anti-human CD90-FITC, anti-human CD13-FITC, Biolegend, San Diego, CA, USA) and incubated in the dark at 2–8 °C for 30 min. After washing twice with PBS, the cells were resuspended in 300 µL PBS and analyzed using a Calibur flow cytometer (Mindray, Shenzhen, China).
RNA extraction, library construction and sequencing
Total cellular RNA was extracted using a miRNeasy Mini Kit (217004, Qiagen, Hilden, Germany) according to the manufacturer’s instructions. Library Construction was performed by using a NEBNext Ultra RNA library Prep Kit for Illumina (#E7530L, NEB, Ipswich, MA, USA). RNA Sequencing was performed on a HiSeqXTen sequencer.
Transcript abundance quantification
After quality control and assessment, sequencing reads were subjected to transcript abundance quantification with kallisto (18), a pseudoalignment-based (alignment-free) RNA-seq quantification program that greatly outperforms other tools in terms of speed while achieving similar accuracy. All human protein-coding and non-coding transcripts from Ensembl (http://grch37.ensembl.org) database (19) (version: GRCh37 release 89) were used as a reference transcriptome. Transcript abundance was normalized with transcripts per million (TPM) for comparison between samples. Along with transcript abundance estimates, 100 bootstraps per sample were generated (kallisto quant –b 100), which served as proxies for technical replicates. Gene expression abundance was determined by aggregating the abundances of all the corresponding transcript isoforms.
Identification of differentially expressed genes (DEGs)
Following quantification, the identification of DEGs was performed by using sleuth (20), which can leverage the bootstraps of kallisto to correct for technical variation. Given the paired-sample design of our experiment, we included donor as a covariate in the model of sleuth to account for potential donor effects. Only genes that achieved both biological and statistical significance were considered as DEGs. The biological significance threshold was set to a fold change (FC) of ±2-fold, and the statistical significance threshold was set to a q value of 0.05 (–log 10 q value >1.3). Gene ontology (GO) biological process term (version: 23.02.2017) enrichment analyses were carried out using a Cytoscape (21) application ClueGO (22) for up-regulated and down-regulated DEGs, respectively, with the following settings: Min GO level =7, Max GO Level =8, Number of Genes =5, Min Percentage =6.0, Kappa Score Threshold =0.3, Initial Group Size =3, and GO Fusion = true. The cutoff for significantly enriched terms was set to an adjusted P value of 0.05.
Identification of differentially expressed pathways
While DEG analysis can only detect genes with large changes in expression, differential expressed pathway (DEP) analysis facilitates the detection of a set of functionally related genes, i.e., in a pathway where the gene expression changes are small or moderate but occur in a coordinated manner; these small changes in functionally related genes may be important but could be missed by differential expression gene analysis (23). In this study, we performed gene set enrichment analysis (GSEA) (24) implemented in R package clusterProfile (25) to identify differentially expressed pathways under default settings. In brief, (I) all genes were ranked according to their expression differences between ASC samples from affected areas and normal areas; (II) for each pre-defined gene set (GO biological process), an enrichment score (ES) was calculated, which is a running-sum statistic reflecting the degree to which a gene set is overrepresented at the top or bottom of a ranked list of genes; (III) statistical significance estimation of the ES was done by calculating a P value using a permutation test. The threshold for significantly up/down-regulated pathways was set to an adjusted P value of 0.05. To facilitate interpretation of a long list of identified GO terms, i.e., significant DEPs by GSEA, REVIGO (26) was used to summarize the GO terms through finding a representative subset of the terms using clustering based on semantic similarity measures (Allowed similarity: Small; Database with GO term sizes: Homo Sapiens).
RNA extraction, reverse transcriptase (RT)-PCR and real-time RT-PCR
Total cellular RNA was extracted using a miRNeasy Mini Kit (217004, Qiagen) according to the manufacturer’s instructions. RNA was transcribed into cDNA using the PrimeScriptTM Reverse Transcriptase system (2680A, Takara, Japan), Quantification of RNA levels for 50 selected genes for quantitative PCR (qPCR) validation was achieved by quantitative RT-PCR (RT-qPCR) using an ABI ViiA7 system and SYBR Green Master Mix (FP205-02, TIANGEN, Beijing, China). Each reaction was run in triplicate, and the data were analyzed according to the threshold cycle (Ct) method. The data were normalized to the expression of GAPDH.
Immunofluorescence
For the immunofluorescence assays, the cells were plated in 24-well plates at a density of 6,000 cells per square centimeter. The ASCs cultured for 72 h were fixed with 4% paraformaldehyde and incubated with an anti-ki67 antibody (9129, Cell Signaling Technology, Danvers, MA, USA) followed by the Alexa Fluor® 488 goat-anti rabbit IgG (ZF-0511, Zsbio, Beijing, China) for 2 h at room temperature. The cells were mounted with mounting medium containing 4',6-diamidino-2-phenylindole (DAPI) nuclear stain (ZLI-9577, Zsbio) and were examined by confocal microscopy (ZEISS LSM780). The mean fluorescence intensity was measured using ZEN software (ZEISS). For statistical analysis of Ki67 staining, we first averaged the values of 15 images of each sample.
Western blot
The ASCs were homogenized in lysis buffer (9803, Cell Signaling Technology) supplemented with complete protease/phosphatase inhibitor cocktail (5872, Cell Signaling Technology) and incubated for 30 min at 4 °C. To remove cell debris, the lysates were centrifuged at 12,000 g for 10 min at 4 °C. The protein concentrations of the lysates were measured with a Micro BCA Protein Assay Kit (23235, Thermo Scientific) according to the manufacturer’s instructions. Total protein samples were prepared for loading with loading buffer. After separation by NuPAGE 4–12% Bis-Tris precast gels (NP0322BOX, Invitrogen) with NuPAGE® MOPS SDS Running Buffer (NP0001, Invitrogen), the proteins were blotted onto a PVDF transfer membrane at 300 mA for 90 min. After blocking with 5% skim milk powder in TBST (0.1 M Tris-HCl pH 8, 1.5 M NaCl and 0.1% Tween-20) for 1 h at room temperature, the membrane was incubated overnight at 4 °C with the primary antibodies CDK1, p-CDK1, CDK2, p-CDK2, Cyclin B, Cyclin A, or β-tubulin (9116, 4539, 2546, 2561, 12231, 4656, 2128, Cell Signaling Technology) followed by 1 h incubation with peroxidase-conjugated rabbit anti-goat IgG (H+L) (ZB2306, Zsbio) (p-CDK1, CDK2, p-CDK2, Cyclin B), peroxidase-conjugated mouse anti-goat IgG (ZB2305, Zsbio) (CDK1) or peroxidase-conjugated rabbit anti-goat IgE (1110-05, SouthernBiotech) (Cyclin A) at room temperature and was developed with the Chemiluminescent Substrate (34080&34095, Thermo Scientific).
ASCs immunosuppressive function identification and the cytokines screening
ASCs were plated in 96-well plates at a density of 5,000, 10,000 and 20,000 cells/well. After cultured for 48 h, the cells were treated with mitomycin c (20 ug/well) for 1 h. Meanwhile, the peripheral blood mononuclear cells (PBMCs) were isolated from normal donor using Ficoll and SepMate-15 (15420, STEMCELL) tube according to the manufacturer’s instructions, and added to the 96-well plates (2×10⁵ cells/well) in which ASCs treated with mitomycin c cultured. Then, the co-cultured cells were treated with phytohemagglutinin (PHA) for 72 h, ASC alone with Mitomycin as control. After that, CCK8 were added to the plates to detect the cell number. The [OD value (experiment group)–OD value (control group)] was used to quantify lymphocyte proliferation. Each experiment was repeated independently in three donors. To screening cytokines that work in this process, human XL cytokine array (ary022b, R&D) were used to detect the cytokines profile of ASCs lysates. The samples were ASCs protein lysates derived from lymphedema and normal adipose tissue from three randomly selected patients, and all experiments were performed according to the instructions. Finally, image J were used to analyze its gray value.
Statistical analysis
Statistical analyses were performed in R (New Zealand) or Prism 6. All data were presented as the means ± SEM. To compare the differences in proliferation and gene expression between lymphedema and normal group, paired t-test was used for the statistical evaluation of the data. To perform statistical analysis on the pictures, the nonparametric Kolmogorov-Smirnov test (K-S test) was used to evaluate whether the data was in a normal distribution, then t-test was used for the statistical evaluation of the data. To evaluate the effect of small molecular inhibitor, one-way ANOVA was performed followed by LSD test. To compare the immunosuppressive of ASCs, Two-way ANOVA was performed followed by LSD test. The significant threshold was set to a P value of 0.05.
Results
ASCs from lymphedema adipose tissues have higher proliferative capacity and stronger ability to differentiate into adipocytes
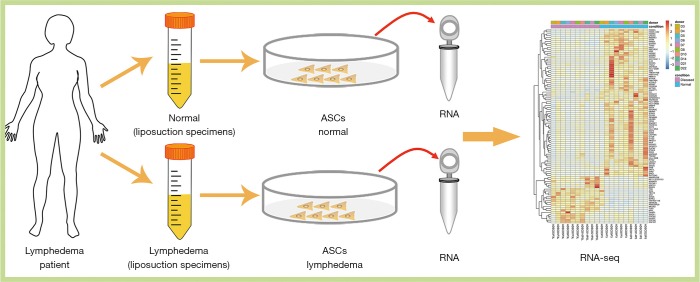
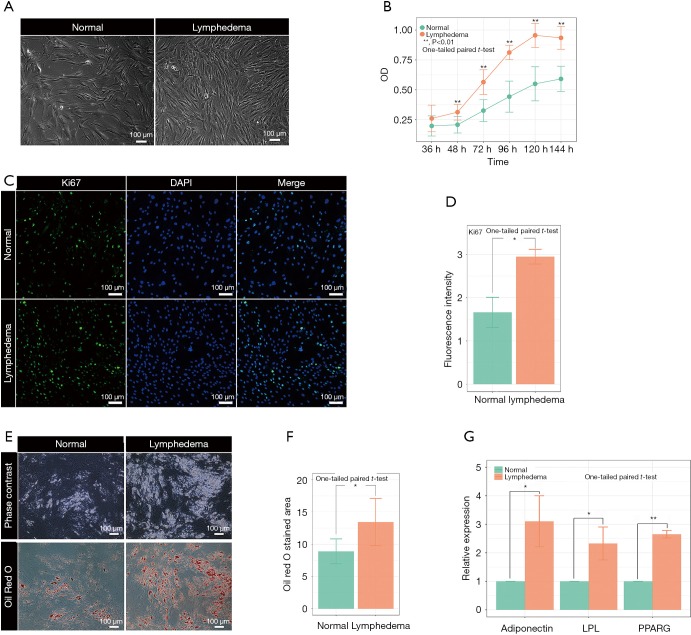
To investigate the pathological mechanism of secondary lymphedema, we isolated ASCs from the lymphedema tissue from liposuction specimens of ten patients who suffered secondary lymphedema and used adipose tissues from the normal upper abdomen as controls (Figure 1, Figure S1). Among the ten lymphedema specimens, eight were derived from lower limbs of postoperative gynecologic neoplasm patients, and two were from the upper limbs of postoperative breast cancer patients. When the ASCs were cultured for 72 h in vitro, the cell density of ASCs isolated from lymphedema (lymphedema group) and normal (normal group) adipose tissues was significantly different (Figure 2A). To clarify the difference between the two groups, we detected the cell number of each group with a CCK8 after the cells were cultured for 36, 48, 72, 96, 120 and 144 h. The data showed that the number of cells in the lymphedema group increased significantly after they were cultured for 48, 72, 96, 120 and 144 h (Figure 2B). We further validated these findings with Ki67 immunofluorescence staining, a cellular marker for proliferation, revealing that ASCs in the lymphedema group possessed higher proliferative capacity than those in the normal group (P=0.038) (Figure 2C,D). To evaluate the adipogenesis potential of the two groups, we directly differentiated ASCs into adipocytes and used Oil Red O staining to mark the differentiated cells; as shown in Figure 2E,F, the lymphedema group was easier to differentiate into adipocytes (P=0.039). In addition, the differentiation efficiency was confirmed using RT-qPCR to measure quantitative changes in the expressions of adipocyte-specific markers in both groups, such as PPARG (P=0.0013), LPL (P=0.038), and adiponectin (P=0.029) (Figure 2G). Altogether, these results indicate that the ASCs derived from lymphedema tissue have a higher proliferative capacity and stronger ability to differentiate into adipocytes than those from normal adipose tissue of the same donor.
Figure 1.
Schematic experiment design of this study. Lymphedema-associated ASCs and ASCs from normal tissue were obtained from the same patients, and then the transcriptome difference was detected. ASCs, adipose-derived mesenchymal stem cells.
Figure S1.
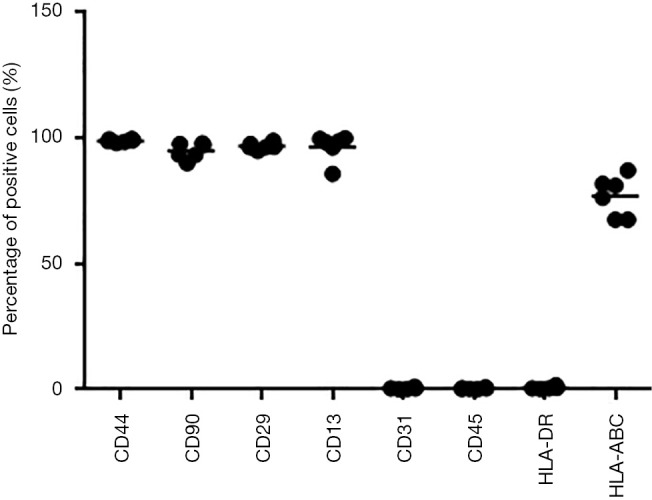
Detection the surface marker of lymphedema associated ASCs from 6 donors. Flow cytometric analysis identified the positive surface markers CD44, CD90, CD29, CD13, HLA-ABC and the negative surface markers HLA-DR, CD31 and CD45. The ordinate represents the percentage of positive expression cells of each surface marker. ASC, adipose-derived mesenchymal stem cell.
Figure 2.
Evaluation of the proliferative capacity and differentiation potential of ASCs derived from lymphedema tissue (lymphedema group) and normal adipose tissue (normal group). (A) Representative photos of the lymphedema group and normal group cultured for 72 h. Bar =100 µm; (B) the division potential of lymphedema group and normal group ASCs from 3 random donors at different time points (36, 48, 72, 96, 120 and 144 h) was detected. Values were expressed as the mean ± SEM of three replicates, **, P<0.01 (one-tailed paired t-test); (C) representative pictures of immunofluorescence staining with Ki-67 in two groups of ASCs; (D) immunofluorescence staining with Ki-67 in two groups of ASCs of 3 random donors; 15 images of each condition were captured for statistical analysis. (one-tailed paired t-test). The signal intensity of ki67 was expressed as the mean ± SEM. Bar =100 µm; (E) representative pictures of ASCs stained with Oil Red O after adipogenesis induce; (F) ASCs induced to differentiate into adipocytes were stained with Oil Red O; 10 images of each condition were captured for statistical analysis. The areas stained with Oil Red O were expressed as the mean ± SEM (n=4). Bar =100 µm. *, P<0.05 (one-tailed paired t-test); (G) RT-qPCR detection of the expression of mature adipocyte markers adiponectin, LPL, and PPARG after adipogenesis. GAPDH as internal reference. *, P<0.05; **, P<0.01 (one-tailed paired t-test). ASCs, adipose-derived mesenchymal stem cells; RT-qPCR, quantitative reverse transcriptase-PCR.
DEGs between ASCs from lymphedema and normal adipose tissue
To explore the transcriptomic differences between ASCs from lymphedema and normal adipose tissues, on average, we generated 68.6 million RNA sequencing reads for each sample (Table S1). The percentage of bases with a Phred-scaled quality score greater than or equal to 30 was 92%, thus providing sufficient data quality for analysis. An average of 92.6% reads were pseudoaligned to a reference transcriptome with 196,534 annotated transcripts from both protein-coding and non-coding genes. Overall, expressions of 18,360 genes were detected in at least one of the studied samples, accounting for 28.8% of the 63,677 genes in the reference transcriptome.
Table S1. Overview of all samples in this study and their corresponding transcriptome sequencing data.
| SampleID | Condition | DonorID | Clean reads number | Clean bases number | Clean Q30 bases rate (%) | PercPsudAlignReads (%) |
|---|---|---|---|---|---|---|
| ADSCD10P3 | Normal | D10 | 69,122,212 | 10,368,331,800 | 91.7 | 92.2 |
| ADSCD10P3L | Diseased | D10 | 67,854,602 | 10,178,190,300 | 94.22 | 92.8 |
| ADSCD14P3 | Normal | D14 | 69,316,476 | 10,397,471,400 | 91.5 | 92.5 |
| ADSCD14P3L | Diseased | D14 | 68,921,720 | 10,338,258,000 | 91.94 | 92.2 |
| ADSCD21P3 | Normal | D21 | 69,326,892 | 10,399,033,800 | 90.72 | 93.1 |
| ADSCD21P3L | Diseased | D21 | 67,899,680 | 10,184,952,000 | 94.08 | 92.7 |
| ADSCD22P3 | Normal | D22 | 68,458,264 | 10,268,739,600 | 91.8 | 92.8 |
| ADSCD22P3L | Diseased | D22 | 69,592,968 | 10,438,945,200 | 94.08 | 92.3 |
| ADSCD3P3 | Normal | D3 | 68,078,440 | 10,211,766,000 | 89.91 | 92.3 |
| ADSCD3P3L | Diseased | D3 | 69,542,654 | 10,431,398,100 | 92.43 | 92.6 |
| ADSCD4P3 | Normal | D4 | 67,738,804 | 10,160,820,600 | 94.06 | 93.1 |
| ADSCD4P3L | Diseased | D4 | 68,029,144 | 10,204,371,600 | 92.15 | 93.1 |
| ADSCD5P3 | Normal | D5 | 69,448,722 | 10,417,308,300 | 90.38 | 92.3 |
| ADSCD5P3L | Diseased | D5 | 67,457,984 | 10,118,697,600 | 91.7 | 92.5 |
| ADSCD6P3 | Normal | D6 | 68,785,206 | 10,317,780,900 | 91.49 | 92.8 |
| ADSCD6P3L | Diseased | D6 | 67,970,286 | 10,195,542,900 | 91.17 | 92.3 |
| ADSCD7P3 | Normal | D7 | 67,952,930 | 10,192,939,500 | 93.98 | 93 |
| ADSCD7P3L | Diseased | D7 | 68,715,512 | 10,307,326,800 | 91.34 | 92.7 |
| ADSCD8P3 | Normal | D8 | 69,436,546 | 10,415,481,900 | 92.14 | 92.8 |
| ADSCD8P3L | Diseased | D8 | 69,172,082 | 10,375,812,300 | 90.18 | 92.8 |
SampleID: ID of the sample; Condition: the sources of ADSCs; DonorID: ID of the donor; Clean reads number: the number of reads after quality control; Clean bases number: the number of bases after quality control; Clean Q30 bases rate (%): the percentage of bases with a Phred-scaled quality score greater than or equal to 30; PercPsudAlignReads (%): the percentage of psudoaligned reads.
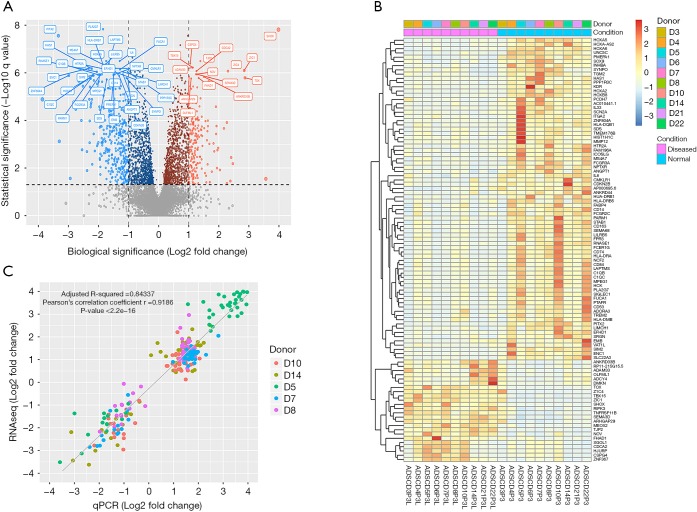
We performed a systematic analysis of DEGs between ASCs from lymphedema and normal adipose tissues in 10 donors. With a conservative threshold in which only genes that achieved both biological (absolute FC>2) and statistical significance (q value <0.05) were considered as DEGs, we identified a total of 217 and 415 genes that were significantly up-regulated and down-regulated in ASCs from lymphedema adipose tissues, respectively (Figure 3A, in total online: http://fp.amegroups.cn/cms/f8bdbd44a00d5c20aa803cdc4c130202/gs.2020.02.09-1.docx, http://fp.amegroups.cn/cms/f38f55672cb02a260f5bbe27bd306421/gs.2020.02.09-2.docx). Variability in expression levels of these identified DEGs could be observed across donors (Figure 3B), and the median of coefficient of variance (MOCV) of gene expression was 0.673 and 0.650 in the lymphedema and normal group for all DEGs, respectively. However, the FC between lymphedema and normal adipose tissue among donors was less variable with a MOCV of 0.467.
Figure 3.
DEGs of ASCs from lymphedema and normal adipose tissue from 10 donors. (A) Volcano plot showing FCs and q values of all expressed genes. The biological significance (X-axis) threshold was set to a FC of ±2-fold, and the statistical (Y-axis) significance threshold was set to a q value of 0.05 (–log10 q value >1.3). Dots in five different colors represent insignificant genes (gray), both statistically and biologically significant genes that are up-regulated (light red), both statistically and biologically significant genes that are down-regulated (light blue), only statistically significant genes that are up-regulated (dark red) and only statistically significant genes that are down-regulated (dark red). The dot size reflects the absolute FC. The top 50 DEGs ranked by q value were labeled with their gene symbols; (B) heatmap showing the expression levels of the top 100 DEGs across 20 ASC samples in two different conditions (affected versus normal) from 10 donors. Samples from different donors are in different colors. Hierarchical clustering was performed to separately display the expression patterns of up-regulated and down-regulated genes of ASCs from the lymphedema group versus the normal group; (C) RT-qPCR validation of 50 selected DEGs in ASCs samples from 5 donors. Samples from different donors are in different colors. The solid line represents a fitted linear regression model between log2-FCs determined via qPCR and RNA-seq. Pearson’s correlation coefficient (r), correlation test P value and adjusted R squared for the linear model are displayed in the plot. DEGs, differentially expressed genes; ASCs, adipose-derived mesenchymal stem cells; RT-qPCR, quantitative reverse transcriptase-PCR; FC, fold change.
To validate the FCs obtained by RNA-seq, we used qPCR, the golden standard for gene expression assay, to obtain the FCs of 50 functionally intriguing DEGs in 5 donors (in total online: http://fp.amegroups.cn/cms/6ca977fbb81d5292426e586d4c28cd1b/gs.2020.02.09-3.docx). As shown in Figure 3C, there was a high correlation between the FCs obtained by RNA-seq and qPCR (Pearson’s correlation coefficient: 0.9186, P<2.2E–16). The linear regression fitting the data could account for 84.3% of the total variation (adjusted R-squared: 0.84337). These results suggested that the gene FCs obtained by RNA-seq agreed well with those obtained by qPCR.
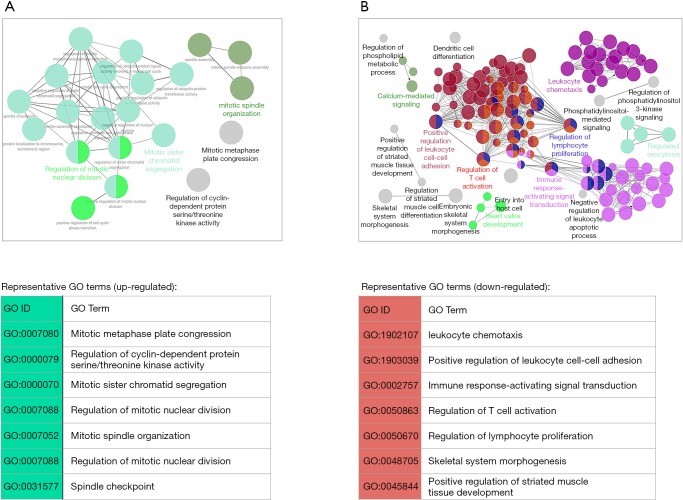
Up-regulated genes were mainly involved in cell proliferation and division and were significantly (corrected P value <0.05) enriched for GO terms such as regulation of mitotic nuclear division (GO:0007088), mitotic sister chromatid segregation (GO:0000070) and mitotic spindle organization (GO:0007052) (Figure 4A, in total online: http://fp.amegroups.cn/cms/06ded2fd7ac2cbd1aedb142168c117c8/gs.2020.02.09-4.docx). Among the up-regulated genes associated with those terms were well-known cell cycle regulator genes such as cyclin-encoding genes (e.g., CCNA2, CCNB2 and CCNB1), CDK-encoding genes (e.g., CDK1), cell division cycle (CDC)-encoding genes (e.g., CDCA8, CDCA2, CDCA5, CDCA3, CDC20), Polo-like kinase-encoding genes (e.g., PLK1) and Aurora kinase-encoding genes (e.g., AURKB).
Figure 4.
Network view of the GO terms enriched in the up-regulated (A) and down-regulated (B) DEGs. The cutoff of GO enrichment analysis was set to an adjusted p value of 0.05. Each node denotes an over-represented term, and the node size reflects the statistical significance of the term. Functionally similar terms were clustered together and in the same color. The nodes in gray represent unclustered terms. Only the representative (the most significant) term within a cluster is labeled with the name. DEGs, differentially expressed genes; GO, gene ontology.
GO enrichment analysis revealed that down-regulated genes were mainly associated with inflammatory and immune responses as well as osteogenic and myogenic differentiation (Figure 4B, in total online: http://fp.amegroups.cn/cms/b4eadf3e0e8e164ad36f04e89cd5df77/gs.2020.02.09-5.docx). Representative GO biological process terms included leukocyte chemotaxis (GO:1902107), positive regulation of leukocyte cell-cell adhesion (GO:1903039), immune response-activating signal transduction (GO:0002757), regulation of T cell activation (GO:0050863), regulation of lymphocyte proliferation (GO:0050670), skeletal system morphogenesis (GO:0048705) and positive regulation of striated muscle tissue development (GO:0045844, in total online: http://fp.amegroups.cn/cms/b4eadf3e0e8e164ad36f04e89cd5df77/gs.2020.02.09-5.docx). Among the down-regulated genes associated with those terms were many Interleukins (e.g., IL-6, IL-8, IL-33) and genes from the CC and CXC subfamily of chemokines, including CCL2, CCL8, CCL13, CCL18, CCL22, CCL26, CXCL5, CXCL6 and CXCL8. Chemokines secreted by mesenchymal stem cells (MSCs) are known to be able to mediate the immunoregulatory effect of MSCs through attracting immune cells in close proximity to MSCs.
Although we did not find any significantly enriched GO terms related to adipogenic differentiation, some genes involved in the early stages of adipogenesis were significantly changed in ASCs from affected areas. For example, KIF4, an early marker of adipogenic differentiation (q=2.64E–05, FC=1.71), and ARHGAP29, a positive regulator of adipogenic commitment, were up-regulated (q=4.34E–09, FC=2.02), while WNT5A, a ligand that negatively regulates adipogenic commitment, was down-regulated (q=6.88E–5, FC=1.91).
Differentially expressed pathways between ASCs from lymphedema and normal adipose tissue
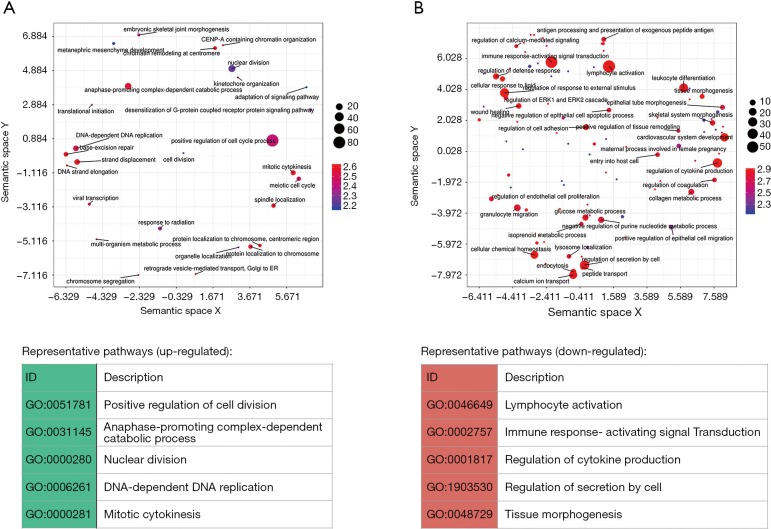
In addition to the DEG analysis above, we further performed GSEA to identify differential regulation at the pathway level. Generally, the results confirmed the findings in the DEG analysis. We found 211 significantly up-regulated gene sets of GO biological processes in ASCs from lymphedema adipose tissue (adjusted P value <0.05, in total online: http://fp.amegroups.cn/cms/aaf206a2c26e50c34abe9b95d8cb73da/gs.2020.02.09-6.docx), which were mainly involved in pathways related to cell division and proliferation. After redundancy was removed, representative up-regulated pathways were mainly found to include positive regulation of cell division (GO:0051781), anaphase-promoting complex-dependent catabolic process (GO:0031145), nuclear division (GO:0000280), DNA-dependent DNA replication (GO:0006261), and mitotic cytokinesis (GO:0000281) (Figure 5A). We also identified 544 significantly down-regulated pathways, which were mainly involved in inflammatory and immune responses as well as tissue morphogenesis (adjusted P value <0.05, in total online: http://fp.amegroups.cn/cms/f6d7ab282475f21a09baabb1d6cc40f0/gs.2020.02.09-7.docx). The representative down-regulated pathways were, for example, lymphocyte activation (GO:0046649), immune response-activating signal transduction (GO:0002757), regulation of cytokine production (GO:0001817), regulation of secretion by cell (GO:1903530) and tissue morphogenesis (GO:0048729) (Figure 5B).
Figure 5.
Differentially expressed [(A) up-regulated; (B) down-regulated] pathways as revealed by GSEA. REVIGO was used to summarize significant GO terms by removing redundant terms and visualize terms in a semantic space. Only one representative term is displayed and labeled with its name for a group of redundant terms. The dot size reflects the number of terms represented, and the color denotes the significance of the term (–log10 q value). The distance between terms reflects their semantical similarity. GSEA, gene set enrichment analysis; GO, gene ontology.
Effects of a cell cycle inhibitor on the proliferation and adipogenesis potential of ASCs from lymphedema adipose tissue
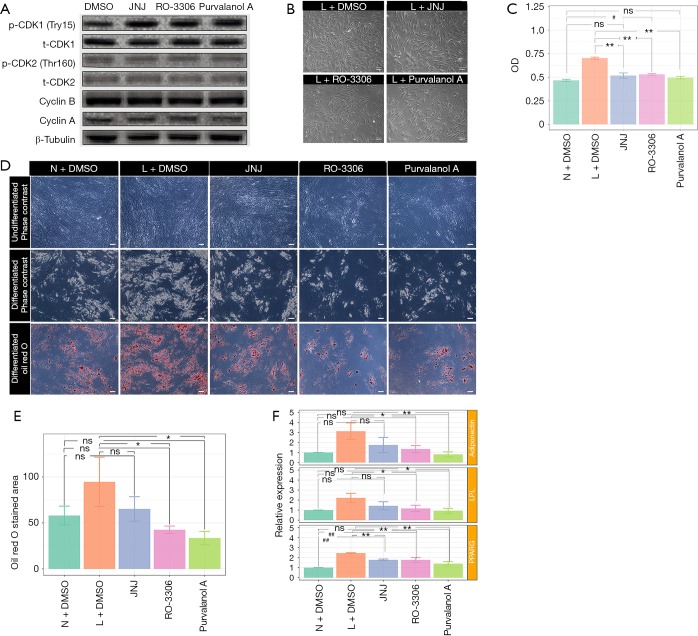
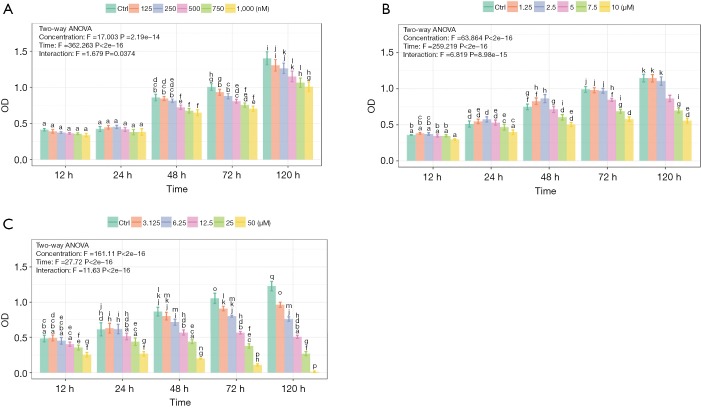
Based on the GO terms, cell cycle regulator genes were up-regulated in ASCs from lymphedema tissue, particularly cyclins, CDKs and CDC encoding genes. To investigate the effect of cell cycle regulators on proliferation and the adipogenesis potential of these cells and to determine whether the small-molecule cell cycle inhibitors could return the lymphedema to normal phenotype, we chose three cell cycle inhibitors (JNJ, Ro-3306 and purvalanol A) that target CDK1, CDK2, or Cyclin A and Cyclin B. To determine the effective concentration of all inhibitors, we added each of them at different concentrations (JNJ: 0, 125, 250, 500, 750, 1,000 nM; Ro-3306: 0, 1.25, 2.5, 5, 7.5, 10 µM; purvalanol A: 0, 3.125, 6.25, 12.5, 25, 50 µM) to ASCs from lymphedema tissue and detected cell proliferation using CCK8 at different time points (12, 24, 48, 72, 120 h) (Figure S2A,B,C). According to the results, the optimum concentration was 750 nM (JNJ), 7.5 µM (Ro-3306) and 12.5 µM (purvalanol A). To explore the underlying mechanism of how cell cycle regulators affect ASC biology in the lymphedema area, we treated lymphedema-associated ASCs with JNJ (750 nM), Ro-3306 (7.5 µM) or purvalanol A (12.5 µM) for 2 h and detected the expression level of CDK1, CDK2, Cyclin B and Cyclin A using immunoblotting. As is well known, CDK1 is maintained in an inactive state by phosphorylation at Tyr15, while CDK2 is activated by phosphorylation at Tyr160. We found that CDK1 activity decreased remarkably under any inhibitor treatment, while CDK2, p-CDK2, Cyclin A and Cyclin B had no change (Figure 6A). More significantly, the proliferation of ASCs from lymphedema adipose tissue displayed a distinct decline after treatment with JNJ (P<0.0001), Ro-3306 (P<0.0001) or purvalanol A (P<0.0001) for 48 h, and the proliferation even reached the level of cells from normal adipose tissue (JNJ: P=0.0520; Ro-3306: P=0.0206; purvalanol A: P=0.2418) (Figure 6B,C). This finding suggests that CDK1 is an important element that contributes to the abnormal biological characteristics of ASCs from lymphedema adipose tissue. To evaluate the role of CDK1 down-regulation on the adipogenesis potential of lymphedema-associated ASCs, we cultured these cells with three inhibitors for 5 days. Then, all cells were induced with adipogenic induction medium for 10 days. Oil Red O staining showed that all three inhibitors were able to reduce the differentiation efficiency of ASCs and return the abnormal adipogenic differentiation of ASCs from lymphedema adipose tissue to normal phenotype, especially purvalanol A (Figure 6D,E,F). Taken together, these findings indicate that CDK1 is a key driver that prompts lymphedema-associated ASCs toward proliferation and adipogenic differentiation and that down-regulation of CDK1 expression could effectively return the abnormal biological characteristics of those cells to normal phenotype.
Figure 6.
Cell cycle inhibitor influences the proliferative ability and differentiation potential of ASCs. (A) Immunoblot analysis of p-CDK1, CDK1, p-CDK2, CDK2, Cyclin B and Cyclin A expression levels after the cells were treated or not treated with CDK inhibitors JNJ, Ro-3306, or purvalanol A for 2 h; (B) representative photos of cell density and morphology of ASCs after treatment with CDK inhibitors JNJ, Ro-3306, or purvalanol A for 48 h. Bar =100 µm; (C) the division potential of ASCs was detected with CCK8 after the cells were treated or not treated with CDK inhibitors JNJ, Ro-3306, or purvalanol A for 48 h. Values were expressed as the mean ± SEM of three replicates. **, P<0.01, significantly different from L+DMSO; #, P<0.01, significantly different from N+DMSO; ns, no statistical difference (one-way ANOVA). (D) ASCs treated with or without CDK inhibitors, JNJ, Ro-3306, or purvalanol A were induced to differentiate into adipocytes and were stained with Oil Red O; 10 images of each condition were captured for statistical analysis; (E) the areas stained with Oil Red O was expressed as the mean ± SEM (n=3). Bar=100 µm. *, P<0.05, **, P<0.01, significantly different from L+DMSO; ##, P<0.01, significantly different from N+DMSO; ns, no statistical difference (one-way ANOVA); (F) RT-qPCR detected the expression of mature adipocyte markers adiponectin, LPL, or PPARG in induced ASCs, which were treated with CDK inhibitors before adipogenesis. ASCs derived from lymphedema group and normal group of 3 random donors in triplicates. *, P<0.05, **, P<0.01, significantly different from L+DMSO; #, P<0.05, ##, P<0.01, significantly different from N+DMSO; ns, no statistical difference (one-way ANOVA). N, normal; L, lymphedema; ASCs, adipose-derived mesenchymal stem cells; RT-qPCR, quantitative reverse transcriptase-PCR; CDK, cyclin-dependent kinase; CCK8, cell counting kit-8.
ASCs from lymphedema adipose tissues have higher immunosuppressive effect
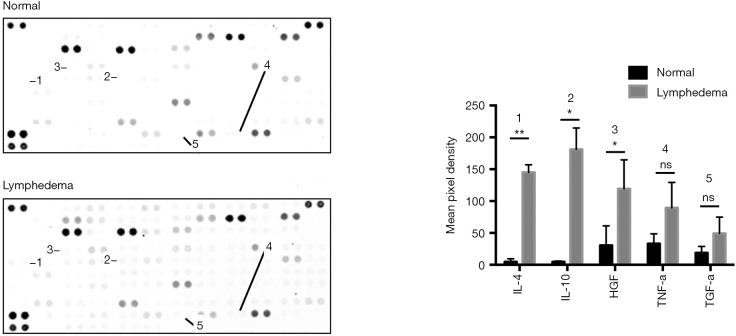
There were many reports indicated that MSCs have immunosuppressive effects (27,28). In our RNA-seq bioinformatics analysis results, the down-regulated pathway was mainly concentrated in the immune response, the main down-regulated pathway in lymphedema adipose tissue included immune response-activating signal transduction (GO:0002757), regulation of T cell activation (GO:0050863), regulation of lymphocyte proliferation (GO:0050670), etc. The weakened immune response pathway in lymphedema group suggesting that lymphedema tissue derived ASCs may has a stronger immunosuppressive effect. In order to verify our hypothesis, PBMCs undergo PHA activation were incubated with ASCs treated with mitomycin c. As shown in Figure 7, ASCs inhibited the proliferation of PBMC in a cell density-dependent manner, and the lymphedema adipose tissue derived ASCs further significantly suppressed the PBMC proliferation. In order to explore the main cytokines that caused this difference, we conducted the human XL cytokine array to screening the key cytokines that play a role in this process. We examined the expression of cytokines IL-10, IL-4, HGF, TNF-a and TGF-a (29), which were closely related to the immunosuppressive effects of MSCs. The results showed that the cytokines that mediating immunosuppression was higher in ASCs derived from lymphedema adipose tissue (Figure 8, in total online: http://fp.amegroups.cn/cms/4c1aa0462da842d40e159eac29137102/gs.2020.02.09-8.docx), which was consistent with the results of our immunosuppression experiment. Taken together, ASCs derived from lymphedema adipose tissue may have a higher immunosuppressive effect through produce more cytokines that mediating immunosuppression.
Figure 7.
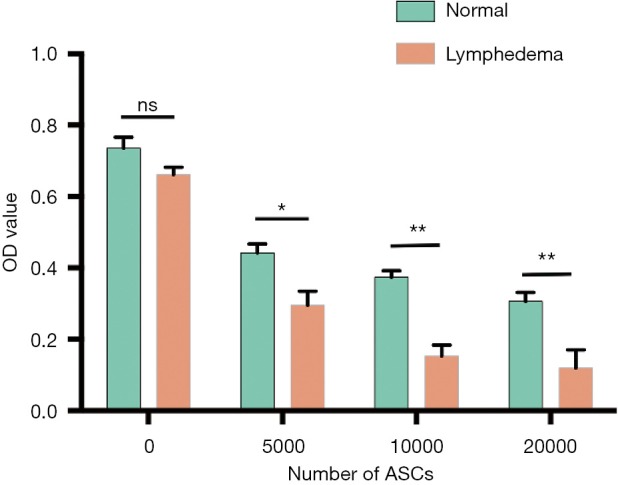
Modulation of PBMCs proliferation by ASCs on a dose-dependent manner. The proliferation potential of PBMCs were detected by CCK8 in the presence of different number of ASCs (5,000, 10,000 and 20,000 cells/well) derived from lymphedema group and normal group of 3 random donors in triplicates. All the co-cultured cells were treated with PHA to activate the immune cells. Values were expressed as the mean ± SEM. *, P<0.05; **, P<0.01; ns, no statistical difference (two-way ANOVA). ASCs, adipose-derived mesenchymal stem cells; CCK8, cell counting kit-8; PBMCs, peripheral blood mononuclear cells; PHA, phytohemagglutinin.
Figure 8.
Difference of cytokines expression between ASCs derived from lymphedema and normal adipose tissue. The cell lysates of ASCs were used to conduct the human XL cytokine array (ary022b, R&D). The mean pixel density was used to represent the expression level of cytokines. After analyzing their pixel values, we listed the cytokines that play an important role in mediating immunosuppression. Each cytokine was detected in duplicate. The mean pixel density was expressed as the mean ± SEM.*, P<0.5; **, P<0.01; ns, no statistical difference (two-tailed paired t-test). ASCs, adipose-derived mesenchymal stem cells.
Discussion
The pathology of secondary extremity lymphedema has been increasingly studied; adipose deposition is one of the main features seen in the secondary lymphedema extremity. It is reported that the extremity with secondary lymphedema shows 70% increase in adipose tissue compared to that in the normal side (30). To remove localized excess adipose tissue in lymphedema area, liposuction has been applied (31-34). However, the real reason of the increased adipose tissue is unclear as before. A previous study has showed that the dysfunction of Prox1 signal pathway may involve in the adipose deposition (35). In addition, recent studies suggest that chronic inflammation and lymphatic fluid stasis are related to the unusual adipogenesis in the animal model with secondary lymphedema (36,37). Unfortunately, these studies all failed to elaborate on the origin and molecular regulation mechanism of excess adipose tissue in secondary lymphedema.
So far, the adipose tissue excised from secondary lymphedema has been discussed in several reports, but few studies investigate the role of ASCs in the pathogenesis of adipose deposition (38). In this work, we compared the proliferation and adipogenesis potential of ASCs from lymphedema and normal adipose tissue in patients with secondary lymphedema. Interestingly, we found that the number of cells derived from lymphedema adipose tissue was significantly increased after the cells were cultured in vitro for 48 h compared with that from normal adipose tissue. Furthermore, adipogenic differentiation was also largely affected; differentiation was increased in lymphedema-associated ASCs, indicating that the change in the biological characteristics of ASCs in the lymphedema area may be a critical element for this process. In this study, we used abdominal adipose tissue as control. To date there were different opinions on the problem that different tissue-harvesting sites of ASCs have different functions. A study reported that the proportion of ASCs from different sites was different, but the ASCs have no difference in proliferation and differentiation ability (39). In another study, the researchers compared ASCs from different sites and found that ASCs derived from the abdomen possess a higher proliferative capacity than thigh (40). These supported our finding that ASCs in edema lesions have stronger ability of proliferation and adipogenic differentiation than normal ASCs.
To comprehensively understand the involved molecular mechanisms of ASC dysfunction in secondary lymphedema, we performed RNA-seq analysis to explore the transcriptomic differences between ASCs from lymphedema and normal adipose tissue in all 10 patients. We found distinct heterogeneity in the transcriptional signatures between the two kinds of ASCs. Using a systematic analysis of DEGs, we identified a total of 217 and 415 genes that were significantly up-regulated and down-regulated in ASCs from lymphedema tissue, respectively. Up-regulated genes were mainly involved in cell proliferation and division while down-regulated genes were mainly associated with immune response and inflammatory as well as osteogenic and myogenic differentiation. This was the first study that performing RNA-seq on ASCs derived from lymphedema to detect the transcriptome differences and these results provided directions and resources for further study of the pathogenesis of lymphedema.
Remarkably, up-regulated genes were mainly key cell cycle regulators, such as CDK1, CDK2, Cyclin A and Cyclin B, suggesting that the cell cycle has a substantial effect on ASC biology in the lymphedema area, leading to the differences observed in our functional analyses. Stem cells possess the unique differentiation characteristics during cell division. These cells need to self-renew for retaining the unique activity, and their differentiation potential is controlled by their proliferative capacity. A recent study showed that cellular proliferation stimulation of human MSCs could be beneficial for adipogenesis during the mitotic phase by increasing the population of cells capable of committing to adipocytes before adipogenic commitment (14). Cell cycle directly linked to the proliferation and pluripotency of stem cells (41), which is regulated seven core cell cycle factors, including three CDKs (1, 2, and 4) and four activating cyclins (A, B, D, and E) (42). Thereinto, G1 and S phases are promoted by CDK2/Cyclin E/A and CDK4/Cyclin D, whereas late G2 and mitosis is regulated by CDK1/Cyclin B (43). CDK1 has always been regarded as the master regulator of cell cycle; and other CDKs without exception cannot replace its function (44-46). In the study, when lymphedema-associated ASCs were treated with cell cycle inhibitors (JNJ, Ro-3306 or purvalanol A) for 2 h, their CDK1 expression was evidently down-regulated, while CDK2, Cyclin A and Cyclin B expression did not change. More importantly, this treatment effectively returned the abnormal proliferation and adipogenesis potential of ASCs from lymphedema adipose tissues to normal phenotype, demonstrating that cell cycle regulators, particularly CDK1, are important players in the excessive proliferation and adipogenic differentiation of lymphedema-associated ASCs, which could explain the adipose deposition of secondary lymphedema to some degree. Furthermore, our results also support an intrinsic link between proliferation and differentiation in stem cells. On the other hand, the down-regulated genes were mainly associated with immune response, implicating that there was difference in immunomodulation effect between ASCs from lymphedema and normal adipose tissues. In this study, we demonstrated that the ASCs from lymphedema adipose tissues have higher immunosuppressive effect. This may be related to the down-regulation of the expression of interleukin and chemokine which can activate lymphocyte proliferation (in total online: http://fp.amegroups.cn/cms/b4eadf3e0e8e164ad36f04e89cd5df77/gs.2020.02.09-5.docx). And this may also be due to the up-regulation of cytokines closely related to the immunosuppressive effect of MSCs (Figure 8). Previous studies have shown that lymphedema tissue immune dysfunction and the number of crown-like structures (dead adipocytes surrounded by M1 macrophages) decreased (47). Combined with our findings, we suspect that this may be due to enhanced immunosuppression effect of ASCs from lymphedema adipose tissues, but this still requires further study.
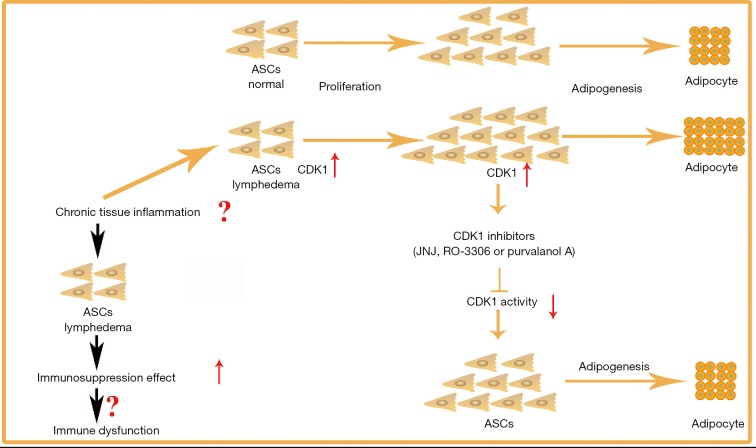
In summary, we isolated ASCs from the lymphedema adipose tissue from liposuction specimens of 10 patients with malignancy-related extremity lymphedema, and we used adipose tissue from the normal upper abdomen of the same patients as control tissue. We compared the proliferation and adipogenic differentiation capacity between the two kinds of ASCs, and we explored the transcriptomic differences between them. We found that lymphedema-associated ASCs had more rapid proliferation and a higher adipogenic differentiation capacity. CDK1 inhibitors could return the abnormal biological characteristics of these cells to normal phenotype, suggesting that CDK1 is a key driver of proliferation and adipogenic differentiation in these cells, which might expound the accumulation of adipose tissue extensively observed in secondary lymphedema, indicating the CDK1 may be a potential target for lymphedema therapy. In addition, our finding showed that ASCs from lymphedema adipose tissues have higher immunosuppressive effect, which may play an important role in the pathogenesis of lymphedema (Figure 9).
Figure 9.
Schematic difference of lymphedema-associated ASCs and ASCs from normal tissue of the same patients. Lymphedema-associated ASCs had more rapid proliferation and adipogenic differentiation capacity than ASC from normal tissue. CDK1 is a key driver that may prompt these cells toward proliferation and adipogenic differentiation could explain the adipose tissue accumulation widely observed in secondary lymphedema. ASCs from lymphedema adipose tissues showed immunomodulation dysfunction which may play an important role in the pathogenesis of lymphedema. ASCs, adipose-derived mesenchymal stem cells; CDK1, cyclin-dependent kinase 1.
Figure S2.
Determination of the optimum concentration of small-molecule inhibitor treatment. (A) ASCs treated with JNJ at different concentrations (0, 125, 250, 500, 750, or 1,000 nM); (B) ASCs treated with Ro-3306 at different concentrations (0, 1.25, 2.5, 5, 7.5, or 10 µM); (C) ASCs treated with purvalanol A at different concentrations (0, 3.125, 6.25, 12.5, 25, or 50 µM). CCK8 was used to evaluate the effect of JNJ on ASC proliferation. If the same letter appears above the column of each concentration at one time point, that indicates that there was no statistical significance between those two concentrations at that timepoint. ASC, adipose-derived mesenchymal stem cell.
Acknowledgments
Funding: This work was supported by the National Natural Science Foundation of China (81670444, 81870229), Graduate Students Innovation Foundation of Peking Union Medical College (2016-0710-04) and CAMS Initiative for Innovative Medicine (CAMS-I2M) under grant number 2016-I2M-1-016.
Ethical Statement: The authors are accountable for all aspects of the work in ensuring that questions related to the accuracy or integrity of any part of the work are appropriately investigated and resolved. This study was approved by the Ethics Committee of Peking Union (No. 2012-034). All patients had signed the informed consents.
Open Access Statement: This is an Open Access article distributed in accordance with the Creative Commons Attribution-NonCommercial-NoDerivs 4.0 International License (CC BY-NC-ND 4.0), which permits the non-commercial replication and distribution of the article with the strict proviso that no changes or edits are made and the original work is properly cited (including links to both the formal publication through the relevant DOI and the license). See: https://creativecommons.org/licenses/by-nc-nd/4.0/.
Footnotes
Provenance and Peer Review: This article was commissioned by the Guest Editors (Xiaona Lu, Antonio Jorge Forte) for the series “Lymphedema” published in Gland Surgery. The article was sent for external peer review organized by the Guest Editors and the editorial office.
Conflicts of Interest: All authors have completed the ICMJE uniform disclosure form (available at http://dx.doi.org/10.21037/gs.2020.02.09). The series “Lymphedema” was commissioned by the editorial office without any funding or sponsorship. The authors have no other conflicts of interest to declare.
References
- 1.Fialka-Moser V, Crevenna R, Korpan M, et al. Cancer rehabilitation: particularly with aspects on physical impairments. J Rehabil Med 2003;35:153-62. 10.1080/16501970306129 [DOI] [PubMed] [Google Scholar]
- 2.Brorson H, Ohlin K, Olsson G, et al. Breast cancer-related chronic arm lymphedema is associated with excess adipose and muscle tissue. Lymphat Res Biol 2009;7:3-10. 10.1089/lrb.2008.1022 [DOI] [PubMed] [Google Scholar]
- 3.Rockson SG. Lymphedema. Curr Treat Options Cardiovasc Med 2006;8:129-36. 10.1007/s11936-006-0005-y [DOI] [PubMed] [Google Scholar]
- 4.Greene AK, Voss SD, Maclellan RA. Liposuction for Swelling in Patients with Lymphedema. N Engl J Med 2017;377:1788-9. 10.1056/NEJMc1709275 [DOI] [PubMed] [Google Scholar]
- 5.Zuk PA, Zhu M, Mizuno H, et al. Multilineage cells from human adipose tissue: implications for cell-based therapies. Tissue Eng 2001;7:211-28. 10.1089/107632701300062859 [DOI] [PubMed] [Google Scholar]
- 6.Zuk PA, Zhu M, Ashjian P, et al. Human adipose tissue is a source of multipotent stem cells. Mol Biol Cell 2002;13:4279-95. 10.1091/mbc.e02-02-0105 [DOI] [PMC free article] [PubMed] [Google Scholar]
- 7.Sysoeva VY, Ageeva LV, Tyurin-Kuzmin PA, al. Local angiotensin II promotes adipogenic differentiation of human adipose tissue mesenchymal stem cells through type 2 angiotensin receptor. Stem Cell Res 2017;25:115-22. 10.1016/j.scr.2017.10.022 [DOI] [PubMed] [Google Scholar]
- 8.Zhu Y, Wu Y, Cheng J, et al. Pharmacological activation of TAZ enhances osteogenic differentiation and bone formation of adipose-derived stem cells. Stem Cell Res Ther 2018;9:53. 10.1186/s13287-018-0799-z [DOI] [PMC free article] [PubMed] [Google Scholar]
- 9.Zhao Y, Jiang H, Liu XW, et al. Neurogenic differentiation from adipose-derived stem cells and application for autologous transplantation in spinal cord injury. Cell Tissue Bank 2015;16:335-42. 10.1007/s10561-014-9476-3 [DOI] [PubMed] [Google Scholar]
- 10.Faghih H, Javeri A, Taha MF. Impact of early subcultures on stemness, migration and angiogenic potential of adipose tissue-derived stem cells and their resistance to in vitro ischemic condition. Cytotechnology 2017;69:885-900. 10.1007/s10616-017-0104-5 [DOI] [PMC free article] [PubMed] [Google Scholar]
- 11.Merfeld-Clauss S, Lupov IP, Lu H, et al. Adipose stromal cells differentiate along a smooth muscle lineage pathway upon endothelial cell contact via induction of activin A. Circ Res 2014;115:800-9. 10.1161/CIRCRESAHA.115.304026 [DOI] [PubMed] [Google Scholar]
- 12.Milner DJ, Bionaz M, Monaco E, et al. Myogenic potential of mesenchymal stem cells isolated from porcine adipose tissue. Cell Tissue Res 2018;372:507-22. 10.1007/s00441-017-2764-z [DOI] [PubMed] [Google Scholar]
- 13.Xu LJ, Wang SF, Wang DQ, et al. Adipose-derived stromal cells resemble bone marrow stromal cells in hepatocyte differentiation potential in vitro and in vivo. World J Gastroenterol 2017;23:6973-82. 10.3748/wjg.v23.i38.6973 [DOI] [PMC free article] [PubMed] [Google Scholar]
- 14.Marquez MP, Alencastro F, Madrigal A, et al. The role of cellular proliferation in adipogenic differentiation of human adipose tissue-derived mesenchymal stem cells. Stem Cells Dev 2017;26:1578-95. 10.1089/scd.2017.0071 [DOI] [PMC free article] [PubMed] [Google Scholar]
- 15.Visweswaran M, Schiefer L, Arfuso F, et al. Wnt antagonist secreted frizzled-related protein 4 upregulates adipogenic differentiation in human adipose tissue-derived mesenchymal stem cells. PLoS One 2015;10:e0118005. 10.1371/journal.pone.0118005 [DOI] [PMC free article] [PubMed] [Google Scholar]
- 16.Chen JG, Spagnoli A, Torquati A. Adipogenic differentiation of adipose tissue-derived human mesenchymal stem cells: effect of gastric bypass surgery. Surg Endosc 2012;26:3449-56. 10.1007/s00464-012-2353-x [DOI] [PMC free article] [PubMed] [Google Scholar]
- 17.Gimble JM, Katz AJ, Bunnell BA. Adipose-derived stem cells for regenerative medicine. Circ Res 2007:100:1249-60. 10.1161/01.RES.0000265074.83288.09 [DOI] [PMC free article] [PubMed] [Google Scholar]
- 18.Bray NL, Pimentel H, Melsted P, et al. Near-optimal probabilistic RNA-seq quantification. Nat Biotechnol 2016;34:525-7. 10.1038/nbt.3519 [DOI] [PubMed] [Google Scholar]
- 19.Yates A, Akanni W, Amode R, et al. Ensembl 2016. Nucleic Acids Res 2016;44:D710-6. 10.1093/nar/gkv1157 [DOI] [PMC free article] [PubMed] [Google Scholar]
- 20.Pimentel H, Bray NL, Punente S, et al. Differential analysis of RNA-seq incorporating quantification uncertainty. Nat Methods 2017;14:687-90. 10.1038/nmeth.4324 [DOI] [PubMed] [Google Scholar]
- 21.Cline MS, Smoot M, Cerami E, et al. Integration of biological networks and gene expression data using Cytoscape. Nat Protoc 2007;2:2366-82. 10.1038/nprot.2007.324 [DOI] [PMC free article] [PubMed] [Google Scholar]
- 22.Bindea G, Mlecnik B, Hacki H, et al. ClueGO: a Cytoscape plug-in to decipher functionally grouped gene ontology and pathway annotation networks. Bioinformatics 2009;25:1091-3. 10.1093/bioinformatics/btp101 [DOI] [PMC free article] [PubMed] [Google Scholar]
- 23.Emmert-Streib F, Glazko GV. Pathway analysis of expression data: deciphering functional building blocks of complex diseases. PLoS Comput Biol 2011;7:e1002053. 10.1371/journal.pcbi.1002053 [DOI] [PMC free article] [PubMed] [Google Scholar]
- 24.Subramanian A, Tamayo P, Mootha VK, et al. Gene set enrichment analysis: a knowledge-based approach for interpreting genome-wide expression profiles. Proc Natl Acad Sci U S A 2005;102:15545-50. 10.1073/pnas.0506580102 [DOI] [PMC free article] [PubMed] [Google Scholar]
- 25.Yu G, Wang LG, Han Y, et al. clusterProfiler: an R package for comparing biological themes among gene clusters. OMICS 2012;16:284-7. 10.1089/omi.2011.0118 [DOI] [PMC free article] [PubMed] [Google Scholar]
- 26.Supek F, Bosnjak M, Skunca N, et al. REVIGO summarizes and visualizes long lists of gene ontology terms. PLoS One 2011;6:e21800. 10.1371/journal.pone.0021800 [DOI] [PMC free article] [PubMed] [Google Scholar]
- 27.Kyurkchiev D, Bochev I, Ivanova-Todorova E, et al. Secretion of immunoregulatory cytokines by mesenchymal stem cells. World J Stem Cells 2014;6:552-70. 10.4252/wjsc.v6.i5.552 [DOI] [PMC free article] [PubMed] [Google Scholar]
- 28.Lopez-Santalla M, Mancheno-Corvo P, Menta R, et al. Human adipose-derived mesenchymal stem cells modulate experimental autoimmune arthritis by modifying early adaptive T cell responses. Stem Cells 2015;33:3493-503. 10.1002/stem.2113 [DOI] [PubMed] [Google Scholar]
- 29.Maria AT, Maumus M, Le Quellec A, et al. Adipose-derived mesenchymal stem cells in autoimmune disorders: state of the art and perspectives for systemic sclerosis. Clin Rev Allergy Immunol 2017;52:234-59. 10.1007/s12016-016-8552-9 [DOI] [PubMed] [Google Scholar]
- 30.Brorson H, Ohlin K, Olsson G, et al. Adipose tissue dominates chronic arm lymphedema following breast cancer: an analysis using volume rendered CT images. Lymphat Res Biol 2006;4:199-210. 10.1089/lrb.2006.4404 [DOI] [PubMed] [Google Scholar]
- 31.Brorson H. Liposuction gives complete reduction of chronic large arm lymphedema after breast cancer. Acta Oncol 2000;39:407-20. 10.1080/028418600750013195 [DOI] [PubMed] [Google Scholar]
- 32.Qi F, Gu J, Shi Y, et al. Treatment of upper limb lymphedema with combination of liposuction, myocutaneous flap transfer, and lymph-fascia grafting: a preliminary study. Microsurgery 2009;29;29-34. 10.1002/micr.20567 [DOI] [PubMed] [Google Scholar]
- 33.Brorson H. Liposuction in arm lymphedema treatment. Scand J Surg 2003;92:287-95. 10.1177/145749690309200409 [DOI] [PubMed] [Google Scholar]
- 34.Brorson H, Svensson H. Liposuction combined with controlled compression therapy reduces arm lymphedema more effectively than controlled compression therapy alone. Plast Reconstr Surg 1998;102:1058-67; discussion 1068. 10.1097/00006534-199809020-00021 [DOI] [PubMed] [Google Scholar]
- 35.Harvey NL, Srinivasan RS, Dillard ME, et al. Lymphatic vascular defects promoted by Prox1 haploinsufficiency cause adult-onset obesity. Nat Genet 2005;37:1072-81. 10.1038/ng1642 [DOI] [PubMed] [Google Scholar]
- 36.Aschen S, Zampell JC, Elhadad S, et al. Regulation of adipogenesis by lymphatic fluid stasis: part II. Expression of adipose differentiation genes. Plast Reconstr Surg 2012;129:838-47. 10.1097/PRS.0b013e3182450b47 [DOI] [PMC free article] [PubMed] [Google Scholar]
- 37.Zampell JC, Aschen S, Weitman ES, et al. Regulation of adipogenesis by lymphatic fluid stasis: part I. Adipogenesis, fibrosis, and inflammation. Plast Reconstr Surg 2012;129:825-34. 10.1097/PRS.0b013e3182450b2d [DOI] [PMC free article] [PubMed] [Google Scholar]
- 38.Levi B, Glotzbach JP, Sorkin M, et al. Molecular analysis and differentiation capacity of adipose-derived stem cells from lymphedema tissue. Plast Reconstr Surg 2013;132:580-9. 10.1097/PRS.0b013e31829ace13 [DOI] [PMC free article] [PubMed] [Google Scholar]
- 39.Jurgens WJ, Oedayrajsingh-Varma MJ, Helder MN, et al. Effect of tissue-harvesting site on yield of stem cells derived from adipose tissue: implications for cell-based therapies. Cell Tissue Res 2008;332:415-26. 10.1007/s00441-007-0555-7 [DOI] [PMC free article] [PubMed] [Google Scholar]
- 40.Reumann MK, Linnemann C, Aspera-Werz RH, et al. Donor site location is critical for proliferation, stem cell capacity, and osteogenic differentiation of adipose mesenchymal stem/stromal cells: implications for bone tissue engineering. Int J Mol Sci 2018. doi: . 10.3390/ijms19071868 [DOI] [PMC free article] [PubMed] [Google Scholar]
- 41.Neganova I, Tilgner K, Buskin A, et al. CDK1 plays an important role in the maintenance of pluripotency and genomic stability in human pluripotent stem cells. Cell Death Dis 2014;5:e1508. 10.1038/cddis.2014.464 [DOI] [PMC free article] [PubMed] [Google Scholar]
- 42.Morgan DO. Principles of CDK regulation. Nature 1995;374:131-4. 10.1038/374131a0 [DOI] [PubMed] [Google Scholar]
- 43.Murray AW. Cyclin-dependent kinases: regulators of the cell cycle and more. Chem Biol 1994;1:191-5. 10.1016/1074-5521(94)90009-4 [DOI] [PubMed] [Google Scholar]
- 44.Santamaría D, Barrière C, Cerqueira A, et al. Cdk1 is sufficient to drive the mammalian cell cycle. Nature 2007;448:811-5. 10.1038/nature06046 [DOI] [PubMed] [Google Scholar]
- 45.Ortega S, Prieto I, Odajima J, et al. Cyclin-dependent kinase 2 is essential for meiosis but not for mitotic cell division in mice. Nat Genet 2003;35:25-31. 10.1038/ng1232 [DOI] [PubMed] [Google Scholar]
- 46.Sherr CJ, Roberts JM. Living with or without cyclins and cyclin-dependent kinases. Genes Dev 2004;18:2699-711. 10.1101/gad.1256504 [DOI] [PubMed] [Google Scholar]
- 47.Tashiro K, Feng J, Wu SH, et al. Pathological changes of adipose tissue in secondary lymphoedema. Br J Dermatol 2017;177:158-67. 10.1111/bjd.15238 [DOI] [PubMed] [Google Scholar]


