

Abstract
Background
Domestication and centuries of selective breeding have changed genomes of sheep breeds to respond to environmental challenges and human needs. The genomes of local breeds, therefore, are valuable sources of genomic variants to be used to understand mechanisms of response to adaptation and artificial selection. As a step toward this we performed a high-density genotyping and comprehensive scans for signatures of selection in the genomes from 15 local sheep breeds reared across Russia.
Results
Results demonstrated that the genomes of Russian sheep breeds contain multiple regions under putative selection. More than 50% of these regions matched with intervals identified in previous scans for selective sweeps in sheep genomes. These regions contain well-known candidate genes related to morphology, adaptation, and domestication (e.g., KITLG, KIT, MITF, and MC1R), wool quality and quantity (e.g., DSG@, DSC@, and KRT@), growth and feed intake (e.g., HOXA@, HOXC@, LCORL, NCAPG, LAP3, and CCSER1), reproduction (e.g., CMTM6, HTRA1, GNAQ, UBQLN1, and IFT88), and milk-related traits (e.g., ABCG2, SPP1, ACSS1, and ACSS2). In addition, multiple genes that are putatively related to environmental adaptations were top-ranked in selected intervals (e.g., EGFR, HSPH1, NMUR1, EDNRB, PRL, TSHR, and ADAMTS5). Moreover, we observed that multiple key genes involved in human hereditary sensory and autonomic neuropathies, and genetic disorders accompanied with an inability to feel pain and environmental temperatures, were top-ranked in multiple or individual sheep breeds from Russia pointing to a possible mechanism of adaptation to harsh climatic conditions.
Conclusions
Our work represents the first comprehensive scan for signatures of selection in genomes of local sheep breeds from the Russian Federation of both European and Asian origins. We confirmed that the genomes of Russian sheep contain previously identified signatures of selection, demonstrating the robustness of our integrative approach. Multiple novel signatures of selection were found near genes which could be related to adaptation to the harsh environments of Russia. Our study forms a basis for future work on using Russian sheep genomes to spot specific genetic variants or haplotypes to be used in efforts on developing next-generation highly productive breeds, better suited to diverse Eurasian environments.
Electronic supplementary material
The online version of this article (10.1186/s12864-019-5537-0) contains supplementary material, which is available to authorized users.
Keywords: Local sheep breeds, Selection, Adaptation, Genotyping, Russian Federation
Background
The domestication and selective breeding of livestock species has led to changes in their genomes to meet the needs of humans and adapting livestock to various environments [1]. Many centuries of artificial selection shaped the genomes of contemporary sheep breeds by selective sweeps, which are associated with a variety of economically important traits, such as quality and quantity of wool, milk and meat. On the other hand, the history and development of these breeds is associated with the history of human migrations [2, 3]. After domestication about 9000–11,000 years ago on the territory of modern Iran [4], sheep have been spread worldwide, accompanying human migrations, e.g., the nomad’s expansion [2–4]. Thus, both artificial selection and acclimatization to various environments have contributed to the diversity of local breeds, expressing distinct and sometimes contrasting phenotypes (e.g., polled and horned breeds, black and white fleece, breeds adapted to the hot temperatures in Africa and the cold climates of Siberia). Therefore, domestic sheep should be considered as a valuable model species to study genome reaction to both environmental adaptation and artificial selection.
Searches for genome intervals, genes and polymorphisms which determine performance for economically important traits in sheep have resulted in revealing signatures of selection likely associated with coat colour [5–7], tail fat deposition [8], muscle growth [9], milk yield [10], reproductive traits [6, 11], wool [12], resistance to parasites [13], presence/absence of horns [6, 11], etc. These chromosome regions contain markers (genes or regulatory sequences) which should be the focus of future efforts on the improvement of local and multinational breeds using the rapidly-developing plethora of contemporary genetics tools.
Sheep have been successfully bred in different environments including some harsh ones, suggesting that the process of extreme acclimation could also lead to selective sweeps in the genomes of local breeds. Environment-influenced adaptations are complex, effecting multiple biochemical processes; therefore signatures of selection would be expected in genes from different pathways [14]. Thus, adaptation to high altitudes is an essential feature for the sheep breeding industry in countries with a predominating mountain terrain. Genomic studies of Tibetan sheep identified several candidate genes, associated with tolerance to hypoxia (e.g., EPAS1, CRYAA, LONP1, NF1, DPP4, SOD1, PPARG, and SOCS2). It was proposed that a key gene for adaptation to hypoxia is the EPAS1, which effects the mean corpuscular haemoglobin concentration and mean corpuscular volume [15]. A study of sheep breeds from a different region, the Himalayas, suggests that the FGF-7 is a candidate for protection against pulmonary injuries and affects efficiency of lungs in sheep that inhabit high-altitude areas [16].
Temperature regime is one of the key climate factors that influence survival and successful breeding of livestock species. Multiple genes and gene networks are affected in different environments. For instance, Kim et al. (2016) shows that in the genomes of Egyptian indigenous sheep, there are changes in multiple genes that influence adaptation to hot arid environments including genes involved in melanogenesis, body size and development, energy and digestive metabolism, as well as in nervous and autoimmune response [17]. Furthermore, Lv and co-workers (2014) identified 17 genes putatively associated with climate-driven selection when they looked at a set of native sheep populations from a worldwide range of geographic areas [18]. Nine of the genes were directly involved in energy and regulation activities (e.g., TBC1D12 and FBXO8) or encoded enzyme activators (e.g., THY1), while eight additional genes were involved in endocrine and autoimmune processes (e.g., EDNRB, NMUR1, PRL, IL12RB1, and ACVR2A). Signatures of adaptations, caused by temperature and sunlight, were linked to the TBC1D12 [18]. Comparative genomics provides additional evidence for links between genes and acclimation. For instance, TRPM8 (transient receptor potential cation channel subfamily M member 8) plays a role in thermal sensation in mice [19]. The same gene was linked to cold tolerance in sheep [6, 7, 11]. These examples demonstrate that different genes could be affected by selection to similar environments, suggesting that studies of multiple breeds adapted to a variety of conditions could help revealing a full set of genomic regions affected during the process of adaptation.
As a step toward this goal, we present the scan for signatures of selection in a set of 15 Russian local sheep breeds. For our current analysis we chose a subset of genetically different breeds and breeds adapted to cold climates of Siberia based on results of our previous study focused on the phylogenetic history of 25 Russian sheep breeds, performed using a medium-density ovine SNP array [20]. We added one additional breed from Siberia (putatively adapted to cold climate), to extend the dataset of cold-adapted breeds. Due to its large area and geographical position, Russia comprises a variety of diverse climatic zones present in Eurasia. Nevertheless, about three quarters of Russia is represented by territories in a continental climate with occasionally extremely low winter temperatures (- 30 °C and below). Because of adaptation to the diverse environments of Russia, we expect that the analysis of Russian native breeds will: a) confirm the previously reported signatures of selection, and b) point to new regions not found in other studies, which could be important for the local adaptations especially in the northern regions. We used a combination of two powerful approaches to identify signatures of selection, one based on differences in frequencies of haplotypes in sets of related breeds (hapFLK), and the second one combining various breed-specific selection statistics into a single integrated framework (DCMS). Together these methods provide a complimentary way of finding signatures of selection in the set of 15 Russian sheep breeds, which we genotyped on a high-density SNP array. We analysed a minimum of 40 autosomes per breed (20 individuals) to ensure detection of the most common signatures of selection by both methods. Our data represent the first comprehensive analysis of selective sweeps in the genomes of Russian local sheep breeds. Our results could be used by the international community to better understand genetic mechanisms of adaptation to various environments, and by breeders looking to develop new breeds that are better adapted to local conditions or to improve adaptation in extant breeds.
Results
Breed groups
The Admixture and Principal Component Analysis (PCA; PC1) suggested the presence of two well-differentiated clusters of breeds in our dataset (Fig. 1): Buubei, Lezgin, Karachaev, Karakul, Tuva, Edilbai, Romanov (GROUP1) and the Russian Longhaired, Altai Mountain, Groznensk, Salsk, Volgograd, Krasnoyarsk, Baikal, and Kulundin (GROUP2). Although the Romanov breed demonstrated a substantial differentiation from the rest of the breeds we assigned it to GROUP1 because it had a higher GROUP1 component in the ADMIXTURE (K = 2) analysis, clustered with other GROUP1 breeds based on the PCA PC1 results, and additionally represents a coarse wool breed (as all other breeds from the GROUP1). In total, 312 animals from 15 Russian local sheep breeds with a mean number of 21 individuals per breed were used in these analyses (Table 1).
Fig. 1.
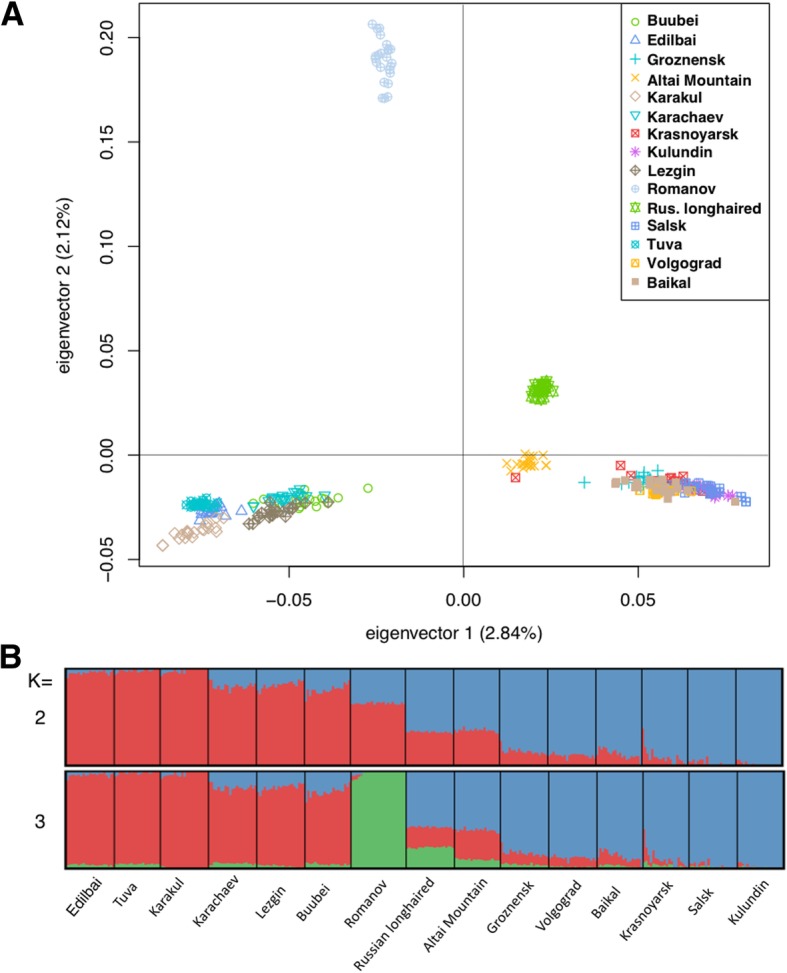
PCA (a) and ADMIXTURE (b) analysis indicate clear separation of the two major sheep groups. The GROUP1 includes Edilbai, Tuva, Karakul, Karachaev, Lezgin, Buubei, Romanov breeds and the GROUP2 includes Russian Longhaired, Altai Mountain, Groznensk, Volgograd, Baikal, Krasnoyarsk, Salsk, and Kulundin breeds
Table 1.
Breeds and breed groups
| Breed | No. samples | Wool type | Reference | Breed group |
|---|---|---|---|---|
| Buubei | 20 | coarse | [20] | GROUP1 |
| Lezgin | 21 | coarse | [20] | GROUP1 |
| Karachaev | 21 | coarse | [20] | GROUP1 |
| Karakul | 21 | coarse | [20] | GROUP1 |
| Tuva | 20 | coarse | [20] | GROUP1 |
| Edilbai | 21 | coarse | [20] | GROUP1 |
| Romanov | 24 | coarse | [20] | GROUP1 |
| Russian Longhaired | 21 | semi-fine | [20] | GROUP2 |
| Altai Mountain | 20 | semi-fine | [20] | GROUP2 |
| Groznensk | 21 | fine | [20] | GROUP2 |
| Salsk | 21 | fine | [20] | GROUP2 |
| Volgograd | 21 | fine | [20] | GROUP2 |
| Krasnoyarsk | 20 | fine | [107] | GROUP2 |
| Baikal | 20 | fine | [20] | GROUP2 |
| Kulundin | 20 | fine | [20] | GROUP2 |
| Average/Total | 21/312 | – | – | – |
The de-correlated composite of multiple signals (DCMS) and hapFLK statistics for individual breeds and groups of breeds overlapped to some extent: 546 DCMS-detected regions, covering 100.8 Mbp of the sheep genome sequence were found in shared intervals, providing independent support for selected regions (Fig. 2, see Additional file 1). However, because the hapFLK statistic detects signatures of selection within groups of breeds and the DCMS in our study was used to combine statistics within a breed, the hapFLK results could not be added to the DCMS framework. The hapFLK revealed additional selective sweeps within groups of breeds missed by the DCMS, while the DCMS was efficient in detecting narrower selective sweeps often attributed to individual breeds.
Fig. 2.
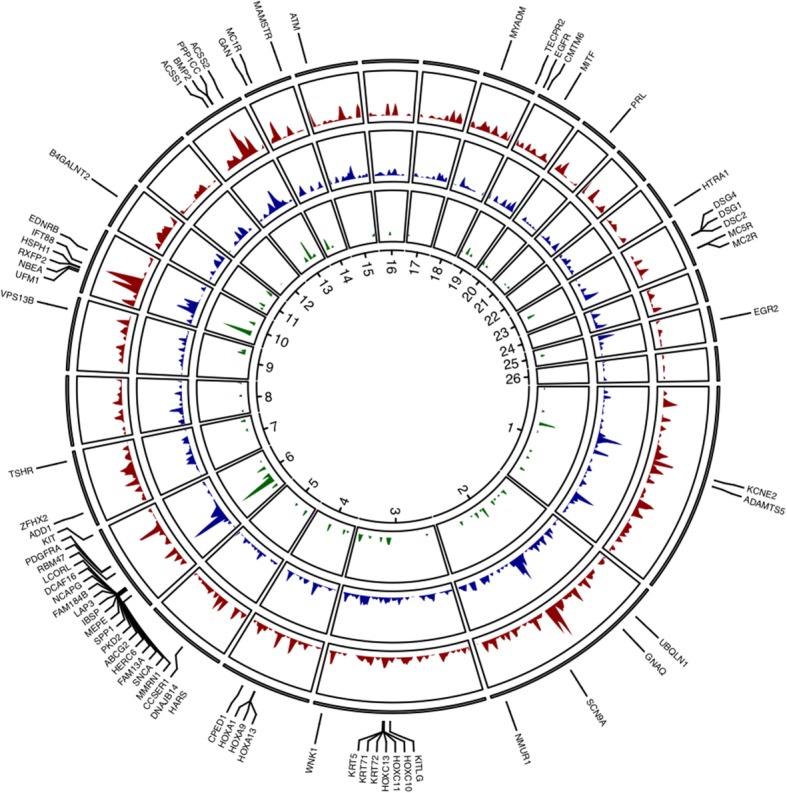
Circus plot of the relative density of selected regions along the ovine genome. DCMS statistics corresponding to GROUP1 is in dark red, to GROUP2 in dark blue, and hapFLK statistics for all breeds shown in green
Composite measure of selection
DCMS statistics were calculated for each single nucleotide polymorphism (SNP) for each breed. After fitting for normal distribution, calculation of p-values and correction for multiple testing, we obtained from 134 to 238 genomic intervals under putative selection per breed (q-value < 0.01) with a total of 3069 regions detected across all breeds (with some overlaps between breeds; Fig. 2, see Additional file 2). The size of the genomic regions putatively under selection varied from 1 bp to 3,510,819 bp, with the average size equal to 120,924 bp. The total number of genes across all selected regions per breed ranged from 146 to 366.
HapFLK
The total number of selected regions identified by the hapFLK analysis (122; Fig. 3, see Additional file 2) was lower than found by the DCMS method. The largest number of hapFLK-detected regions was observed in the GROUP1 set of breeds (62), followed by the all-breed (33) and the GROUP2 (27) sets. The GROUP1 and GROUP2 shared five common hapFLK intervals. One region was found on ovine chromosome (OAR) 6 (34.6–37.5 Mbp) containing multiple genes with known effects on economically important traits such as milk production and growth. Three overlapping regions were detected on this chromosome: one near the UFM1 gene involved in brain development and abnormalities in humans [21]; the second, near neurobeachin (NBEA), a gene previously associated with autism in humans [22] and wool production traits in sheep [23]; and the last, near RXFP2, involved in formation of horns in sheep [24] and cattle [25]. The last overlapping region was found on OAR13 and contained BMP2, the only common gene between the groups in this region. BMP2 is associated with the body size and developmental traits in sheep [17]. Sizes of the hapFLK putatively selected regions ranged from 70 Kbp to 5.7 Mbp with an average size of 667.7 Kbp.
Fig. 3.

Manhattan plots of the hapFLK statistics for two groups of Russian sheep breeds. The shared signatures of selection between the two groups are highlighted in red and the candidate genes names are indicated. Blue and red horizontal lines indicate suggestive (q-value< 0.05) and significant (q-value< 0.01) FDR thresholds, respectively
Candidate genes for adaptation of the Russian sheep breeds to environmental and climate challenges
In the regions under putative selection we looked for genes that could be related to adaption of Russian sheep breeds to local environments (Table 2). We noticed that five breeds: Karachaev, Krasnoyarsk, Lezgin, Salsk, and Altai Mountain had a common signature of selection reported by the DCMS method near the ZFHX2 (zinc finger homeobox 2), a gene which was shown to be responsible for an inability to feel pain in humans (including low and high temperatures) [26]. The same authors report that ZFHX2 knock-out mice had significantly higher acute thermal pain thresholds [26]. Interestingly, several other genes directly involved in hereditary sensory and autonomic neuropathies [27] often accompanied with inability to feel pain and cold temperatures in humans were found top-ranked in selected regions in the Russian sheep breeds. Among them were the SCN9A [28], reported for Buubei, WNK1 [29] reported for Salsk, HARS [30] reported for Karakul and Kulundin breeds, TECPR2 [31] reported for Tuva sheep, GAN [27] for Karachaev, and EGR2 [27] for GROUP1.
Table 2.
Selective sweeps and candidate genes related to acclimation and economically important traits found in genomes of Russian sheep breeds
| OAR | Start (Mbp) | End (Mbp) | q-value | Breed/Group | Method | No. genes | Candidate genes (rank) | Trait |
|---|---|---|---|---|---|---|---|---|
| 1 | 119.12 | 119.49 | 1.90E-09 | Karachaev | DCMS | 6 | KCNE2 (1) | growth |
| 1 | 119.09 | 119.49 | 7.67E-05 | Karakul | DCMS | 6 | KCNE2 (1) | growth |
| 1 | 119.23 | 119.45 | 0.001775722 | Tuva | DCMS | 5 | KCNE2 (1) | growth |
| 1 | 127.64 | 127.75 | 0.000366751 | Altai Mountain | DCMS | 1 | ADAMTS5 (1) | acclimation |
| 1 | 127.63 | 127.74 | 0.000199884 | Baikal | DCMS | 1 | ADAMTS5 (1) | acclimation |
| 1 | 127.63 | 127.69 | 0.007036415 | Kulundin | DCMS | 1 | ADAMTS5 (1) | acclimation |
| 2 | 35.41 | 36.06 | 0.000153169 | GROUP1 | hapFLK | 6 | UBQLN1 (5) | reproduction |
| 2 | 35.87 | 35.92 | 0.004399798 | Salsk | DCMS | 1 | UBQLN1 (1) | reproduction |
| 2 | 58.59 | 58.75 | 0.000834252 | Edillbai | DCMS | 1 | GNAQ (1) | reproduction |
| 2 | 58.62 | 58.74 | 0.002702535 | Lezgin | DCMS | 1 | GNAQ (1) | reproduction |
| 2 | 58.64 | 58.71 | 0.008858869 | Karakul | DCMS | 1 | GNAQ (1) | reproduction |
| 2 | 142.19 | 142.30 | 2.19E-05 | Buubei | DCMS | 1 | SCN9A (1) | temperature sensation |
| 2 | 232.36 | 232.41 | 0.00631797 | Romanov | DCMS | 1 | NMUR1 (1) | acclimation |
| 3 | 124.57 | 124.69 | 0.000275686 | Edillbai | DCMS | 1 | KITLG (1) | coat colour/domestication |
| 3 | 124.55 | 124.68 | 8.86E-05 | Buubei | DCMS | 1 | KITLG (1) | coat colour/domestication |
| 3 | 132.24 | 132.94 | 9.65E-05 | GROUP1 | hapFLK | 16 | HOXC@ (1–7, 9) | growth |
| 3 | 132.26 | 132.53 | 6.51E-07 | Lezgin | DCMS | 9 | HOXC@ (1–6, 8,9) | growth |
| 3 | 132.31 | 132.51 | 0.000416517 | Karakul | DCMS | 9 | HOXC@ (1–6,8,9) | growth |
| 3 | 132.31 | 132.42 | 0.008497984 | Edillbai | DCMS | 7 | HOXC@ (1–6) | growth |
| 3 | 133.58 | 133.77 | 9.72E-13 | Salsk | DCMS | 8 | KRT@ (1–8) | wool |
| 3 | 133.59 | 133.76 | 1.36E-07 | Krasnoyarsk | DCMS | 7 | KRT@ (1–7) | wool |
| 3 | 133.60 | 133.75 | 3.73E-07 | Groznensk | DCMS | 6 | KRT@ (1–6) | wool |
| 3 | 133.56 | 133.75 | 3.24E-10 | Baikal | DCMS | 6 | KRT@ (1–6) | wool |
| 3 | 133.57 | 133.72 | 1.35E-08 | Kulundin | DCMS | 5 | KRT@ (1–5) | wool |
| 3 | 133.61 | 133.66 | 0.005739761 | Volgograd | DCMS | 1 | KRT72 (1) | wool |
| 3 | 211.49 | 211.62 | 0.000569719 | Salsk | DCMS | 1 | WNK1 (1) | temperature sensation |
| 4 | 68.29 | 69.18 | 4.31E-08 | GROUP1 | hapFLK | 12 | HOXA@ (1–9) | growth |
| 4 | 68.81 | 69.17 | 6.70E-06 | Karakul | DCMS | 8 | HOXA@ (1–8) | growth |
| 4 | 68.75 | 69.13 | 3.56E-08 | Buubei | DCMS | 10 | HOXA@ (1–9) | growth |
| 4 | 68.64 | 68.99 | 1.25E-06 | Russian Longhaired | DCMS | 10 | HOXA@ (2–9) | growth |
| 4 | 68.62 | 68.97 | 9.34E-14 | Karachaev | DCMS | 10 | HOXA@ (1,3–10) | growth |
| 4 | 68.62 | 68.92 | 5.18E-05 | Kulundin | DCMS | 4 | HOXA@ (2–4) | growth |
| 4 | 85.61 | 85.75 | 3.38E-07 | Karachaev | DCMS | 1 | CPED1 (1) | growth |
| 4 | 85.66 | 85.71 | 0.000339136 | Krasnoyarsk | DCMS | 1 | CPED1 (1) | growth |
| 4 | 85.67 | 85.71 | 0.002455069 | Edillbai | DCMS | 1 | CPED1 (1) | growth |
| 4 | 85.67 | 85.70 | 0.002368717 | Altai Mountain | DCMS | 1 | CPED1 (1) | growth |
| 5 | 49.07 | 49.38 | 0.000134196 | Karakul | DCMS | 12 | HARS (1) | temperature sensation |
| 5 | 49.19 | 49.27 | 0.001308813 | Kulundin | DCMS | 4 | HARS (1) | temperature sensation |
| 6 | 24.71 | 25.01 | 1.33E-08 | Kulundin | DCMS | 3 | DNAJB14 (3) | reproduction |
| 6 | 24.71 | 25.01 | 4.37E-09 | Baikal | DCMS | 3 | DNAJB14 (1) | reproduction |
| 6 | 24.69 | 24.98 | 0.000102818 | Salsk | DCMS | 3 | DNAJB14 (1) | reproduction |
| 6 | 24.71 | 24.97 | 6.53E-09 | Krasnoyarsk | DCMS | 3 | DNAJB14 (1) | reproduction |
| 6 | 24.74 | 24.95 | 0.000157066 | Altai Mountain | DCMS | 3 | DNAJB14 (1) | reproduction |
| 6 | 24.74 | 24.94 | 8.54E-05 | Lezgin | DCMS | 3 | DNAJB14 (1) | reproduction |
| 6 | 24.75 | 24.90 | 0.005804894 | Edillbai | DCMS | 1 | DNAJB14 (1) | reproduction |
| 6 | 24.71 | 24.89 | 0.000171107 | Tuva | DCMS | 2 | DNAJB14 (1) | reproduction |
| 6 | 24.65 | 24.88 | 6.15E-06 | Buubei | DCMS | 1 | DNAJB14 (1) | reproduction |
| 6 | 24.71 | 24.88 | 0.000392132 | Karakul | DCMS | 1 | DNAJB14 (1) | reproduction |
| 6 | 24.71 | 24.86 | 0.000596432 | Karachaev | DCMS | 1 | DNAJB14 (1) | reproduction |
| 6 | 34.63 | 40.33 | 0 | GROUP2 | hapFLK | 25 | MEPE (1) IBSP (2) SPP1 (3) PKD2 (4) ABCG2 (5) LAP3 (6) MED28 FAM184B (8) NCAPG (11) HERC6 (12) LCORL (13) FAM13A (19) SNCA (22) | growth, milk |
| 6 | 35.67 | 39.19 | 8.04E-10 | Volgograd | DCMS | 19 | HERC6 (1) ABCG2 (8) PKD2 (10) SPP1 (11) MEPE (12) IBSP (13) LAP3 (14) FAM184B (16) NCAPG (18) LCORL (19) | growth, milk |
| 6 | 34.85 | 38.82 | 0 | All | hapFLK | 21 | LCORL (1) NCAPG (2) FAM184B (4) LAP3 (6) IBSP (7) MEPE (8) SPP1 (9) PKD2 (10) ABCG2 (11) HERC6 (13) FAM13A (19) | growth, milk |
| 6 | 36.40 | 38.62 | 3.50E-08 | Kulundin | DCMS | 11 | LAP3 (2) FAM184B (3) NCAPG (5) LCORL (6) IBSP (7) MEPE (8) SPP1 (9) PKD2 (10) ABCG2 (11) | growth, milk |
| 6 | 36.87 | 38.28 | 3.13E-11 | Baikal | DCMS | 6 | LAP3 (1) FAM184B (2) NCAPG (4) LCORL (5) | growth |
| 6 | 36.52 | 38.24 | 3.68E-08 | Salsk | DCMS | 10 | LAP3 (2) FAM184B (3) NCAPG (5) LCORL (6) IBSP (7) MEPE (8) SPP1 (9) PKD2 (10) ABCG2 (11) | growth, milk |
| 6 | 36.45 | 37.87 | 5.07E-07 | Krasnoyarsk | DCMS | 11 | PKD2 (1) SPP1 (2) ABCG2 (3) MEPE (4) IBSP (5) LAP3 (6) FAM184B (7) NCAPG (9) LCORL (10) | growth, milk |
| 6 | 37.23 | 37.63 | 3.10E-06 | Lezgin | DCMS | 4 | LCORL (1) NCAPG (2) FAM184B (4) | growth |
| 6 | 37.36 | 37.60 | 0.000701655 | Edillbai | DCMS | 1 | LCORL (1) | growth |
| 6 | 37.25 | 37.45 | 0.008575203 | GROUP1 | hapFLK | 3 | NCAPG (1) FAM184B (3) | growth |
| 6 | 37.35 | 37.44 | 0.007856497 | Buubei | DCMS | 1 | LCORL (1) | growth |
| 6 | 37.09 | 37.14 | 0.009452078 | Altai Mountain | DCMS | 2 | LAP3 (1) | growth |
| 6 | 36.52 | 36.80 | 7.87E-05 | Baikal | DCMS | 3 | SPP1 (1) PKD2 (2) ABCG2 (3) | milk |
| 6 | 36.09 | 36.51 | 5.45E-05 | Karakul | DCMS | 5 | HERC6 (1) | growth |
| 6 | 36.09 | 36.45 | 4.06E-07 | Lezgin | DCMS | 6 | HERC6 (2) | growth |
| 6 | 36.11 | 36.40 | 0.000168675 | Kulundin | DCMS | 4 | HERC6 (4) | growth |
| 6 | 36.05 | 36.33 | 0.000432111 | Krasnoyarsk | DCMS | 5 | HERC6 (4) | growth |
| 6 | 36.23 | 36.30 | 0.003706257 | Altai Mountain | DCMS | 1 | HERC6 (1) | growth |
| 6 | 36.16 | 36.30 | 0.000321255 | Salsk | DCMS | 4 | HERC6 (4) | growth |
| 6 | 34.87 | 35.07 | 1.56E-05 | Kulundin | DCMS | 1 | SNCA (1) | milk |
| 6 | 34.87 | 35.03 | 0.000133556 | Volgograd | DCMS | 1 | SNCA (1) | milk |
| 6 | 34.89 | 35.02 | 0.000295081 | Krasnoyarsk | DCMS | 1 | SNCA (1) | milk |
| 6 | 34.90 | 35.02 | 0.000209331 | Baikal | DCMS | 1 | SNCA (1) | milk |
| 6 | 34.29 | 34.84 | 0.003646083 | All | hapFLK | 1 | MMRN1 (1) | acclimation |
| 6 | 34.72 | 34.80 | 0.003960894 | Krasnoyarsk | DCMS | 1 | MMRN1 (1) | acclimation |
| 6 | 34.50 | 34.75 | 6.39E-06 | Volgograd | DCMS | 1 | MMRN1 (1) | acclimation |
| 6 | 33.28 | 34.60 | 0.001085822 | GROUP2 | hapFLK | 1 | CCSER1 (1) | feed intake |
| 6 | 34.22 | 34.47 | 8.89E-05 | Volgograd | DCMS | 1 | CCSER1 (1) | feed intake |
| 6 | 33.33 | 34.26 | 0.000135783 | All | hapFLK | 1 | CCSER1 (1) | feed intake |
| 6 | 59.32 | 59.45 | 3.41E-09 | Altai Mountain | DCMS | 1 | RBM47 (1) | growth |
| 6 | 59.34 | 59.45 | 3.26E-06 | Groznensk | DCMS | 1 | RBM47 (1) | growth |
| 6 | 59.35 | 59.42 | 0.004758624 | Kulundin | DCMS | 1 | RBM47 (1) | growth |
| 6 | 59.36 | 59.41 | 0.001116515 | Krasnoyarsk | DCMS | 1 | RBM47 (1) | growth |
| 6 | 69.84 | 70.85 | 5.07E-08 | All | hapFLK | 4 | KIT (1) | coat colour/domestication |
| 6 | 69.66 | 70.59 | 0 | GROUP1 | hapFLK | 3 | PDGFRA (1) KIT (2) | acclimation, coat colour/domestication |
| 6 | 115.08 | 115.56 | 0.003511895 | GROUP2 | hapFLK | 5 | ADD1 (1) | acclimation |
| 7 | 20.98 | 21.22 | 2.53E-08 | Karachaev | DCMS | 11 | ZFHX2 (1) | temperature sensation |
| 7 | 20.96 | 21.11 | 8.00E-05 | Buubei | DCMS | 6 | ZFHX2 (4) | temperature sensation |
| 7 | 21.01 | 21.08 | 0.005941688 | Lezgin | DCMS | 1 | ZFHX2 (1) | temperature sensation |
| 7 | 21.00 | 21.04 | 5.71E-05 | Krasnoyarsk | DCMS | 1 | ZFHX2 (1) | temperature sensation |
| 7 | 21.01 | 21.04 | 0.000126518 | Salsk | DCMS | 1 | ZFHX2 (1) | temperature sensation |
| 7 | 21.01 | 21.04 | 0.006713729 | Altai Mountain | DCMS | 1 | ZFHX2 (1) | temperature sensation |
| 7 | 89.24 | 89.81 | 2.26E-05 | GROUP1 | hapFLK | 4 | TSHR (1) | acclimation |
| 7 | 89.35 | 89.55 | 9.23E-08 | Lezgin | DCMS | 2 | TSHR (2) | acclimation |
| 7 | 89.39 | 89.48 | 0.004845986 | Karakul | DCMS | 1 | TSHR (1) | acclimation |
| 9 | 77.25 | 77.91 | 1.34E-07 | Edillbai | DCMS | 2 | VPS13B (2) | milk |
| 9 | 77.24 | 77.87 | 0.000648121 | GROUP1 | hapFLK | 2 | VPS13B (1) | milk |
| 9 | 77.07 | 77.17 | 0.001546422 | Karakul | DCMS | 1 | VPS13B (1) | milk |
| 9 | 77.09 | 77.13 | 0.006246497 | Salsk | DCMS | 1 | VPS13B (1) | milk |
| 10 | 23.77 | 24.44 | 0.000617495 | GROUP2 | hapFLK | 2 | UFM1 (1) | Domestication |
| 10 | 23.60 | 24.42 | 9.64E-05 | All | hapFLK | 3 | UFM1 (1) | Domestication |
| 10 | 23.90 | 24.31 | 0.007350694 | GROUP1 | hapFLK | 1 | UFM1 (1) | Domestication |
| 10 | 25.16 | 30.13 | 0 | All | hapFLK | 18 | RXFP2 (1) HSPH1 (4) | wool, horns, acclimation |
| 10 | 28.03 | 30.10 | 0 | GROUP2 | hapFLK | 11 | RXFP2 (1) HSPH1 (4) | horns, acclimation |
| 10 | 30.06 | 30.10 | 0.005654316 | Baikal | DCMS | 1 | HSPH1 (1) | acclimation |
| 10 | 28.16 | 30.00 | 0 | GROUP1 | hapFLK | 10 | RXFP2 (1) | horns |
| 10 | 29.39 | 29.75 | 3.78E-12 | Edillbai | DCMS | 1 | RXFP2 (1) | horns |
| 10 | 29.36 | 29.64 | 2.56E-06 | Russian Longhaired | DCMS | 1 | RXFP2 (1) | horns |
| 10 | 29.32 | 29.63 | 1.23E-06 | Romanov | DCMS | 1 | RXFP2 (1) | horns |
| 10 | 29.47 | 29.63 | 1.14E-05 | Karachaev | DCMS | 1 | RXFP2 (1) | horns |
| 10 | 29.47 | 29.55 | 0.002108118 | Groznensk | DCMS | 1 | RXFP2 (1) | horns |
| 10 | 29.44 | 29.49 | 0.000484163 | Altai Mountain | DCMS | 1 | RXFP2 (1) | horns |
| 10 | 25.19 | 28.02 | 1.42E-07 | GROUP2 | hapFLK | 7 | NBEA (1) | wool |
| 10 | 26.17 | 26.93 | 0.000427859 | GROUP1 | hapFLK | 1 | NBEA (1) | wool |
| 10 | 26.55 | 26.66 | 0.001229851 | Kulundin | DCMS | 1 | NBEA (1) | wool |
| 10 | 26.30 | 26.56 | 0.000110212 | Edillbai | DCMS | 1 | NBEA (1) | wool |
| 10 | 26.33 | 26.41 | 0.000152487 | Groznensk | DCMS | 1 | NBEA (1) | wool |
| 10 | 26.15 | 26.17 | 0.001280272 | Kulundin | DCMS | 1 | NBEA (1) | wool |
| 10 | 26.15 | 26.17 | 0.009743166 | Baikal | DCMS | 1 | NBEA (1) | wool |
| 10 | 35.95 | 36.35 | 0.000164969 | Tuva | DCMS | 8 | IFT88 (6) | reproduction |
| 10 | 36.05 | 36.25 | 3.80E-05 | Edillbai | DCMS | 2 | IFT88 (2) | reproduction |
| 10 | 35.99 | 36.12 | 0.003724073 | Romanov | DCMS | 3 | IFT88 (1) | reproduction |
| 10 | 53.47 | 53.76 | 0.005873975 | GROUP1 | hapFLK | 1 | EDNRB (1) | acclimation |
| 11 | 36.89 | 37.00 | 0.00235957 | Volgograd | DCMS | 1 | B4GALNT2 (1) | reproduction |
| 11 | 36.92 | 36.95 | 0.00700516 | Groznensk | DCMS | 1 | B4GALNT2 (1) | reproduction |
| 11 | 36.92 | 36.95 | 0.002079112 | Karachaev | DCMS | 1 | B4GALNT2 (1) | reproduction |
| 11 | 36.89 | 36.94 | 0.008582697 | Karakul | DCMS | 1 | B4GALNT2 (1) | reproduction |
| 13 | 41.71 | 41.86 | 1.37E-05 | Groznensk | DCMS | 4 | ACSS1 (1) | milk |
| 13 | 41.70 | 41.84 | 5.56E-07 | Volgograd | DCMS | 4 | ACSS1 (1) | milk |
| 13 | 41.72 | 41.83 | 7.68E-06 | Altai Mountain | DCMS | 3 | ACSS1 (1) | milk |
| 13 | 47.98 | 49.75 | 7.29E-11 | All | hapFLK | 3 | PPP1CC (1) BMP2 (2) | body size, reproduction |
| 13 | 48.34 | 49.40 | 1.74E-11 | Karachaev | DCMS | 3 | PPP1CC (1) BMP2 (3) | body size, reproduction |
| 13 | 48.43 | 49.30 | 9.62E-07 | GROUP1 | hapFLK | 3 | PPP1CC (1) BMP2 (3) | body size, reproduction |
| 13 | 48.52 | 49.30 | 7.96E-09 | Tuva | DCMS | 2 | PPP1CC (1) | reproduction |
| 13 | 48.83 | 49.17 | 8.51E-11 | Kulundin | DCMS | 1 | PPP1CC (1) | reproduction |
| 13 | 48.80 | 49.15 | 3.36E-08 | Salsk | DCMS | 1 | PPP1CC (1) | reproduction |
| 13 | 48.84 | 49.15 | 5.59E-05 | Volgograd | DCMS | 1 | PPP1CC (1) | reproduction |
| 13 | 48.83 | 49.12 | 4.19E-05 | Russian Longhaired | DCMS | 1 | PPP1CC (1) | reproduction |
| 13 | 48.83 | 49.08 | 0.003588777 | Groznensk | DCMS | 1 | PPP1CC (1) | reproduction |
| 13 | 48.29 | 48.66 | 0.005674193 | GROUP2 | hapFLK | 1 | BMP2 (1) | body size |
| 13 | 63.47 | 63.91 | 3.91E-06 | Romanov | DCMS | 10 | ACSS2 (1) | milk |
| 14 | 7.30 | 7.48 | 0.000183645 | Karachaev | DCMS | 2 | GAN (1) | temperature sensation |
| 14 | 13.59 | 15.49 | 0 | GROUP1 | hapFLK | 30 | MC1R (1) | coat colour/acclimation |
| 14 | 13.75 | 14.80 | 0 | All | hapFLK | 22 | MC1R (2) | coat colour/acclimation |
| 14 | 14.15 | 14.43 | 2.15E-06 | Karachaev | DCMS | 8 | MC1R (3) | coat colour/acclimation |
| 14 | 14.14 | 14.27 | 1.18E-05 | Karakul | DCMS | 6 | MC1R (3) | coat colour/acclimation |
| 14 | 14.20 | 14.26 | 0.003770506 | Lezgin | DCMS | 5 | MC1R (3) | coat colour/acclimation |
| 14 | 14.14 | 14.25 | 8.10E-05 | Tuva | DCMS | 5 | MC1R (4) | coat colour/acclimation |
| 14 | 14.20 | 14.23 | 0.002109007 | Baikal | DCMS | 3 | MC1R (2) | coat colour/acclimation |
| 14 | 14.21 | 14.23 | 0.005865778 | Altai Mountain | DCMS | 2 | MC1R (1) | coat colour/acclimation |
| 14 | 54.32 | 54.41 | 7.27E-07 | Volgograd | DCMS | 3 | MAMSTR (1) | lipid metabolosm |
| 14 | 54.33 | 54.40 | 2.20E-05 | Karachaev | DCMS | 1 | MAMSTR (1) | lipid metabolosm |
| 14 | 54.34 | 54.40 | 5.36E-05 | Baikal | DCMS | 2 | MAMSTR (1) | lipid metabolosm |
| 14 | 54.31 | 54.39 | 0.000163454 | Salsk | DCMS | 4 | MAMSTR (4) | lipid metabolosm |
| 14 | 54.35 | 54.39 | 0.003248022 | Groznensk | DCMS | 1 | MAMSTR (4) | lipid metabolosm |
| 14 | 54.31 | 54.39 | 0.001065341 | Kulundin | DCMS | 4 | MAMSTR (4) | lipid metabolosm |
| 14 | 54.34 | 54.39 | 0.00166944 | Altai Mountain | DCMS | 1 | MAMSTR (1) | lipid metabolosm |
| 14 | 54.36 | 54.39 | 0.001659425 | Romanov | DCMS | 1 | MAMSTR (1) | lipid metabolosm |
| 15 | 17.37 | 17.43 | 0.001101253 | Groznensk | DCMS | 1 | ATM (1) | milk |
| 15 | 17.37 | 17.42 | 0.003777078 | Baikal | DCMS | 1 | ATM (1) | milk |
| 15 | 17.37 | 17.41 | 0.002123085 | Salsk | DCMS | 1 | ATM (1) | milk |
| 18 | 65.86 | 66.20 | 0.000807705 | Tuva | DCMS | 3 | TECPR2 (1) | temperature sensation |
| 18 | 65.89 | 66.04 | 0.003657536 | Lezgin | DCMS | 2 | TECPR2 (2) | temperature sensation |
| 19 | 0.85 | 0.89 | 0.006060865 | Altai Mountain | DCMS | 1 | EGFR (1) | acclimation |
| 19 | 6.84 | 6.88 | 0.002683568 | Edillbai | DCMS | 1 | CMTM6 (1) | reproduction |
| 19 | 6.83 | 6.85 | 0.006206755 | Karakul | DCMS | 1 | CMTM6 (1) | reproduction |
| 19 | 31.51 | 31.87 | 1.06E-06 | GROUP1 | hapFLK | 1 | MITF (1) | coat colour/domestication |
| 19 | 31.51 | 31.86 | 0.000136197 | All | hapFLK | 1 | MITF (1) | coat colour/domestication |
| 19 | 31.60 | 31.65 | 0.002412391 | Karakul | DCMS | 1 | MITF (1) | coat colour/domestication |
| 20 | 34.19 | 34.23 | 0.003574509 | Volgograd | DCMS | 1 | PRL (1) | acclimation |
| 22 | 41.25 | 41.33 | 0.003671941 | Buubei | DCMS | 1 | HTRA1 (1) | reproduction |
| 22 | 41.23 | 41.31 | 0.00040073 | Karakul | DCMS | 1 | HTRA1 (1) | reproduction |
| 22 | 41.25 | 41.31 | 0.006635799 | Tuva | DCMS | 1 | HTRA1 (1) | reproduction |
| 23 | 25.42 | 26.46 | 0 | GROUP1 | hapFLK | 12 | DSG@ (1–4), DSC@ (7–9) | wool |
| 23 | 26.20 | 26.36 | 1.05E-05 | Russian Longhaired | DCMS | 2 | DSC@ (1–2) | wool |
| 23 | 25.90 | 26.34 | 5.97E-05 | All | hapFLK | 5 | DSG@ (1–2), DCG@ (3–5) | wool |
| 23 | 25.90 | 26.33 | 8.02E-10 | Altai Mountain | DCMS | 6 | DSG@ (1–3,5), DSC@ (4,6) | wool |
| 23 | 25.98 | 26.11 | 0.002876356 | Russian Longhaired | DCMS | 3 | DSG@ (−3) | wool |
| 23 | 43.81 | 44.51 | 9.44E-06 | Salsk | DCMS | 3 | MC5R (1) MC2R (3) | acclimation |
| 23 | 43.75 | 44.06 | 0.000654721 | Baikal | DCMS | 3 | MC2R (1) MC5R (2) | acclimation |
| 25 | 18.69 | 18.88 | 0.001140569 | GROUP1 | hapFLK | 2 | EGR2 (1) | temperature sensation |
We also found several genes that were previously proposed to be related to thermal adaptations [14]. Among them was the EGFR, a membrane receptor for epidermal growth factors and a top DCMS candidate in a 33 Kbp region on OAR19 reported for the Altai Mountain sheep breed from Siberia. According to Wollenberg Valero and co-workers (2014) EGFR could represent a functional hub for the relay of thermal signalling [14]. Another gene involved in adaptation to hot/cold environment was the heatshock protein H1 (HSPH1) [14], the top-ranked gene found in a DCMS-reported region on OAR10 for the Baikal sheep. Several genes linked to climate adaptation through their interaction with the POMC (pro-opiomelanocorin receptor), shown to be involved in energy homeostasis, melanocyte stimulation and immune response [14], were top-ranked in selected regions of Russian sheep breeds. Among them are melanocortin receptors: MC1R, MC2R, and MC5R. The MC1R was the top gene in a hapFLK reported region on OAR14 for GROUP1 and in a DCMS reported region for Altai Mountain sheep. The MC2R was the top gene for a DCMS-reported region on OAR23 found in Baikal breed. The MC5R was the top gene in region found by the DCMS method in the Salsk sheep. The melanocortin receptors are involved in the movement and positioning of melanocytes, suggesting their possible contribution to adaptation to different light regimes [14], however these genes could also be involved in formation of coat colours, suggesting their contribution to economically important traits [32]. Another gene, functionally linked to POMC [14] was the MMRN1 with SNPs associated with winter duration in 54 human populations [33]. It was the top ranked gene in a hapFLK reported region on OAR6 for the all-breed analysis, and in the regions found by the DCMS method for Volgograd and Krasnoyarsk sheep.
We further found genes previously identified in a genome-wide scan for climate-mediated selective pressures in sheep [18] in the DCMS or hapFLK-reported regions. These included the NMUR1, EDNRB, and PRL all being the top genes in the DCMS/hapFLK reported intervals for the Romanov, GROUP1, and Volgograd breeds, respectively. The hapFLK method reported another region under putative selection for GROUP1 with PDGFRA found near the most significant SNP. Under cold stress, proliferation of endothelial cells and interstitial cells expressing PDGFRA increases 3-4 fold in brown adipose tissue; it is a key gene involved in cold-induced adipogenesis in mice [34]. Also, the adipocyte determination and differentiation-dependent factor 1 (ADD1) known to be involved in cold adaptation through brown adipocytes [35] was top-ranked for a region on OAR6 reported in GROUP2 by hapFLK. Consistent with the expected role of brown adipose tissue in adaptation to cold climate sheep breeds from Siberia: Kulundin, Altai Mountain, and Baikal all had a strong signature of selection (q-value ranges from 10− 5 to10− 7; DCMS) near the ADAMTS5, shown to be involved in the adiposity and metabolic health. Enhanced thermogenesis through the browning of white adipose tissue was reported in ADAMTS5 knock out mice upon cold exposure [36, 37]. In accordance with the previous findings in Chinese native sheep [11] and indigenous Sunite sheep [38] we detected a signature of selection by DCMS near TSHR in Karakul and Lezgin breeds. TSHR was previously associated with metabolic regulation and photoperiod control or reproduction in vertebrates [11].
Morphological traits and adaptations
Of the 3191 genomic intervals (3069 from DCMS and 122 from hapFLK analyses) under putative selection, 50.6% overlapped with regions previously predicted to have been under selection in sheep in different studies [1, 7, 11, 39] (see Additional file 2). Among these previously detected regions, strong signals of differentiation were obtained in the regions containing well known candidate genes related to morphology, adaptation, and domestication (e.g., KITLG, KIT, MITF, and MC1R), wool quality and quantity (e.g., DSG@, DSC@, and KRT@) growth and feed intake (HOXA@, HOXC@, LCORL, NCAPG, LAP3, and CCSER1), reproduction (CMTM6, HTRA1, GNAQ, UBQLN1, and IFT88), and milk traits (ABCG2, SPP1, ACSS1, and ACSS2; Fig. 2, Table 2).
Fleece related traits
Quantity and quality of wool is one of the most economically important traits in sheep. Consistent with this, the hapFLK analysis shows a strong signature of selection (q-value < 10− 5) in the group of all Russian breeds on OAR23 in the region containing a cluster of seven desmosomal genes (DSG@ and DSC@). This selection signal becomes much stronger for GROUP1 (q-value < 10− 23), but the region is narrower and contains only the DSG@ genes. DSMC splits this interval in two regions for the Russian Longhaired breed, suggesting separate selection sweeps near the DSG and DSC gene clusters. The Altai Mountain breed, however, exhibits the wider selection signal covering both clusters. The DSG4 (desmoglein 4) is a known candidate for wool length and crimp in sheep [40], likely to be related to white and black coat colour in goats [41] and is a known cause of the recessive hairless phenotype in rats [42]. The DSG1 and DSG3 are associated with hair growth and follicle structure and the DSC2 with woolly/straight hair phenotype in sheep [43, 44]. The DSMC method reports another strong selection signal (q-value < 10− 7) near the keratin gene cluster (KTR@) on OAR3 for the fine fleeced breeds: Baikal, Kulundin, Salsk, Krasnoyarsk, Groznensk, and Volgograd. For five out of the six breeds the selection intervals are relatively wide (> 100 Kbp) and contain multiple keratin genes while the Volgograd breed contains a narrower interval (~ 50 Kbp) with the KRT72 gene only. Multiple members of the keratin cluster were shown to be related to fleece development. KRT5 is related to fleece development and function [45], while KRT71 is associated with the curly hair phenotype in sheep [46].
Coat colour
We identified a large group of known candidate genes related to coat colour, a trait of economic importance, also related to domestication and historical breed formation [47]. As expected, strong signatures of selection were found in the regions containing the genes KIT on OAR6, and KITLG on OAR3. The KIT proto-oncogene receptor tyrosine kinase (KIT) is associated with coat colour in various sheep breeds [5] and other species [48]. In our study, hapFLK identified the chromosomal interval containing this gene to be under strong selection in the set of all Russian breeds and GROUP1. KITLG is associated with pigmentation in sheep [49], roan coat phenotype in goats [50], and cattle [51]. The DCMS method reported this gene to be the top-ranked candidate in the selected regions of the Buubei and roan Edilbai breeds. Another gene found in a region of putative positive selection, the melanocortin 1 receptor (MC1R), was top-ranked in the hapFLK-reported region in GROUP1 and in the DCMS interval identified in the Altai Mountain breed. MC1R has a pleiotropic effect, known, among other traits, to influence coat colour in sheep [52] and cattle [53]. The microphthalmia transcription factor (MITF) is a regulator of melanocyte development, and is associated with coat colour in mouse [54], dog [55], and other species. A strong signature of selection (q-value < 10− 6) was reported by hapFLK for GROUP1 in a ~ 350 Kbp interval on OAR19 containing MITF, and by DCMS for the Karakul breed. We identified an additional 20 genes in selected regions of Russian sheep breeds, reported by either hapFLK or DCMS (or both) methods that could be related to coat colour, fleece and other phenotypes in Russian sheep breeds (see Additional file 3).
Milk and lactation-related traits
The hapFLK method reported a large, ~ 5.7 Mbp region on OAR6 (34.63–40.33 Mbp) containing multiple candidate genes associated with milk production, growth, and feed efficiency (MEPE, IBSP, SPP1, PKD2, ABCG2, LAP3, NCAPG, LCORL, FAM13A, FAM184B, DCAF16, HERC6, and SNCA) for the GROUP2 set of breeds. A part of this region (37.25–37.45 Mbp) was also reported for GROUP1, including candidate genes NCAPG, DCAF16, FAM184B. A strong positive selection around the ABCG2, SPP1, LAP3, NCAPG, LCORL, PKD2, IBSP, and MEPE genes has been reported in domestic sheep including most European [1] and Chinese indigenous breeds [39]. A major milk-related trait gene, the ATP-binding cassette, sub-family G (white), member 2 (ABCG2 [56]) was found in intervals reported by DCMS for multiple Russian breeds but was not top-ranked in any of them. On the other hand, the region containing three genes ABCG2, SPP1, and PKD2 was under selection in the Baikal sheep with SPP1 (osteopontin) reported as the top-ranked gene by DCMS. SPP1 is associated with milk protein percentage, milk yield, milk protein yield, and lactation regulation in dairy cattle [57]. Signatures of selection near the SNCA, potentially related to milk protein and fat traits in dairy cattle [58] were reported by DSMC for the Kulundin, Volgograd, Krasnoyarsk, and Baikal breeds. Two family members, the ACSS1 and ACSS2 previously associated with the mammary gland function and milk fatty acid composition in sheep [59, 60], cattle [61], and yaks [62] were the top-ranked genes in positively selected regions reported by DCMS. The ACSS1 gene was reported for the Volgograd, Groznensk, and Altai Mountain, and ACSS2 for the Romanov breeds. Another gene related to the mammary gland function was the ATM on OAR15, found in a DCMS-reported region for the Salsk, Baikal, and Groznensk breeds. The ATM contributes to mammary gland homeostasis and its knockout leads to a progressive lactation defect in mice [63]. In addition, we found VPS13B, a known candidate gene for milk-related traits in buffalo [64], in the interval reported by hapFLK for GROUP1. The DCMS analysis further reported this region to be under putative selection in the Karakul, Salsk, and Edilbai sheep.
Growth and feed intake
Two genomic regions containing clusters of HOX genes were reported by hapFLK for GROUP1. The first cluster contained the HOXC@ on OAR3 while the second, HOXA@ on OAR4. These regions were further confirmed to be under putative positive selection by the DCMS method. The region containing the HOXC@ could be under selection in the Lezgin, Edilbai, and Karakul breeds while the HOXA@-containing region, in the Karachaev, Kulundin, Russian Longhaired, Buubei, and Karakul breeds. The HOX genes are involved in regulation of limb development in mammals [65, 66], with the HOXA@ also being associated with body composition and structure in pigs [67] and HOXC@ being associated with tail fat deposition in sheep [68].
The region containing LAP3, NCAPG, LCORL, and HERC6 genes on OAR6 is known to be related to growth traits, carcass composition, body size, weight and height in sheep [1], horses [69], and cattle [70, 71]. The results obtained using hapFLK and DCMS showed varying patterns of selective sweeps near these genes in Russian sheep breeds. Thus, according to hapFLK, LCORL was top-ranked for the all-breed analysis. This was further supported by DCMS for the Lezgin, Buubei, and Edilbai breeds while the NCAPG was top-ranked by hapFLK for the GROUP1 only. The LAP3 from the same area was top-ranked for the Baikal and Altai Mountain breeds and the HERC6 for Volgograd, Karakul, and Altai Mountain implying multiple signatures of selection in this region. The hapFLK approach reveals a ~ 1 Mbp interval containing only one gene, the CCSER1, on OAR6 in the all-breed set as well as in GROUP2, while DCMS further confirms this signature of selection in Volgograd, Krasnoyarsk, and Baikal breeds. Variants in the CCSER1 are associated with the feed efficiency in beef cattle [72].
Furthermore, the DSMC method reported signatures of selection in regions near the functional gene candidates RBM47, KCNE2, CPED1, and MAMSTR in multiple sheep breeds. These candidate genes are responsible for processes related to growth (RBM47 [73]), thyroid hormone biosynthesis (KCNE2 [74]), development of bone mineral density (CPED1 [75]), and lipid and glucose metabolism (MAMSTR [76]).
Reproduction
Both hapFLK and DCMS reported putative positive selection in multiple breeds for genomic regions containing genes with known effects on reproduction in mammals, including fertility: DNAJB14 [77], gonad development and sperm maturation: GNAQ [78], spermatogenesis: UBQLN1 [79], IFT88 [80], and PPP1CC [81]. The DCMS method detected selection sweeps near CMTM6 in Karakul and Edilbai sheep and near HTRA1 in Karakul, Tuva, and Buubei sheep. These genes are associated with off-season reproduction traits, such as year-around oestrous behavior in sheep (HTRA1 [82] and the evolution of sperm and the circadian rhythm systems in mammals (CMTM6 [83]). The DCMS method further reported narrow selection sweeps for multiple Russian sheep breeds in the areas of B4GALNT2 which was proposed as a strong candidate gene for ewe fertility [84].
Discussion
Here we present the first comprehensive study of signatures of selection in the genomes of 15 native sheep breeds from the Russian Federation, for most of which we recently revealed the phylogenetic and population history in the context of related breeds from other countries [20]. In contrast to our phylogenetic study, based on moderate-density SNP array genotypes, genotyping for the present study was performed on a high-density array required to reveal the majority of selective sweeps. The analysis of the data was performed using complimentary approaches: the hapFLK and DCMS, which allowed us to detect signatures of selection that are putatively related to adaptation of breeds to local environments and human needs.
More than 50% of the putatively selected regions detected in the present study overlap with previously reported signatures of selection in various sheep breeds [1, 7, 11, 39], suggesting that our approach is robust enough to detect the expected signals of selection and that our dataset is different enough from the previously published ones to reveal new strong selective sweeps. The overlap observed between the hapFLK and the DCMS results point to putatively selected regions that are detectable using different models. The overlapping regions mainly contained known targets of selection in sheep. However, in general, hapFLK detects fewer but longer selected regions, while DSMC identifies a larger number of shorter intervals. This indicates that hapFLK could be more efficient in detecting regions with long haplotypes under selection, while DCMS can further dissect these intervals and point to specific genes under putative selection in individual breeds. DCMS is also capable of detecting shorter intervals, not found by hapFLK. This is confirmed by the fact that the region on OAR6, containing multiple genes related to milk production and growth traits was reported as a single interval by hapFLK but DCMS reported different regions within this interval containing different genes to be under selection in individual breeds. We detected the strongest signatures of selection shared between two groups of Russian sheep breeds in the regions of genes related to brain development, growth, milk production, and horned/polled phenotypes. These groups of genes are likely to be related to the process of domestication and historical breed formation.
In contrast to our recent study on the signatures of selection in Russian native cattle breeds [85] and high-density analysis of popular commercial breeds from Zhao and co-workers (2015) [86] we did not observe breeds where major milk-production related genes (e.g., DGAT1 and ABCG2) would be reported as top ranked. This could be related to the fact that the sheep breeds used for milk production in the Russian Federation (e.g., Lezgin and Karachaev) cannot be considered as strictly dairy breeds. They are also breed for wool and meat, and these traits are often more important.
Consistent with this and our previous publication [20], the PCA and ADMIXTURE analysis separated the Russian sheep breeds into two major clusters which follow wool quality type [20]. The DCMS method further suggested that the cluster of KRT genes on OAR3 is under positive selection in fine wool breeds, confirming that the keratin genes could be related to the quality of wool, as it has been shown in other studies [46]. Interestingly, the region containing a cluster of desmosomal genes was under strong selection in coarse wool breeds (GROUP1). The DCMS approach, however, points to two breeds from GROUP2, which also had this region under putative selection. GROUP2 includes breeds with the fine and semi-fine wool. According to DCMS the desmosomal genes were under selection only in the semi-fine Russian Longhaired and Altai Mountain breeds. Combined with the hapFLK results, this may indicate that selection in desmosomal genes could be related to ‘coarseness’ of the sheep wool but this hypothesis needs further verification using sequenced genomes from breeds of all the three types.
Unlike the Yakut cattle [87], domestic sheep cannot be normally found above the Polar Circle in Russia. However, the harsh environments of Siberia and other parts of the Russian Federation still impose significant selective pressure on local sheep breeds. Consistent with this, multiple genes related to acclimatization were found in putatively selected regions in Russian sheep breeds. In another study [85] we found one of the strongest signals of selection in the Yakut cattle, adapted to survive at − 50 °C, in the area of the gene RETREG1, one of the key genes involved in the hereditary sensory and autonomic neuropathy, type II in humans [27]. This disorder in humans is accompanied by an inability to feel pain and low temperatures. In the present study, we identified multiple genes with known key contributions to human hereditary sensory and autonomic neuropathies (types I-IV) in selected regions of individual or multiple sheep breeds. It is tempting to hypothesise that changes within these genes could be related to adaptation to the harsh environments of the Russian Federation. For the breeds from Siberia, changes in these genes could be beneficial for surviving cold winters, but in other breeds they could be advantageous for survival in cold mountain climates. However, a definite answer to this question could only be obtained after the actual sequences of these genes are obtained for breeds dwelling in different environments and the presence and frequencies of missense or regulatory variants are compared.
Similar to Russian native cattle breeds, sheep breeds express signatures of selection in regions of genes related to brown adipogenesis. Brown adipose tissue is an important organ involved in in non-shivering thermogenesis indicating that these genes could be related to adaptation to cold climates. However, the adipose tissue contributes to phenotypic differences between breeds (fat- and thin-tailed sheep) and to meat quality, which is an economically important trait. This suggests that more studies need to be done to distinguish potential adaptive effects of the genes involved into adipogenesis, from their contribution to economically important traits in sheep and cattle.
Conclusions
In conclusion, we identified signatures of selection in Russian local sheep breeds of European and Asian origin. These signatures point to known regions related to economically important traits, domestication and breed formation as well as to intervals of the sheep genome that could contribute to adaptation of breeds to their corresponding local environments. Our results indicate that a detailed study(ies) of Russian local breeds involving whole-genome sequencing should focus on identifying causative genetic variants or haplotypes. These polymorphisms should be in turn the focus of future efforts on the improvement of local breeds, or for selecting multinational commercial breeds which would be better suited for the environments of the Russian Federation and Northern Eurasia.
Methods
Sample collection
Tissue samples for the Lezgin, Karachaev, Karakul, Edilbai, Romanov, Russian Longhaired, Groznensk, Salsk, and Volgograd breeds and blood samples for the Buubei, Tuva, Altai Mountain, Krasnoyarsk, Baikal, and Kulundin breeds were collected from farms and breeding centres across Russia. All samples were collected by trained personnel following strict veterinary regulations. We studied the pedigrees of animals to avoid sampling of close relatives (siblings, parents, and offspring). Tissues and blood were stored at -80 °C until use.
Genotyping of Russian sheep breeds
DNA from tissue samples of nine sheep breeds was extracted using Nexttec columns (Nexttec Biotechnology GmbH, Germany) following the manufacturer’s instructions. DNA from blood samples of six additional sheep breeds was extracted using cell lysation followed by phenol-chloroform extraction [88]. DNA samples of all breeds were genotyped using the Ovine Infinium® HD SNP BeadChip (600 K SNPs) to produce dense genome coverage. Genotypes were called using GenomeStudio 2 software (Illumina, San Diego, USA) and samples with overall calling rate < 95% were removed from further analyses. The produced files with genotypes (.ped) and chromosomal positions (.map) were processed using PLINK v.1.90 whole genome analysis toolkit [89].
Analysis of groups of populations
Divergence between populations can influence methods which assume a certain population structure and low level of genetic differentiation [7]. To reduce the effect of population structure on the hapFLK analysis, we performed the Principal Component Analysis (PCA [90]) and ADMIXTURE genetic clustering on all the studied breeds. Prior to the analyses, to reduce effects of linkage-disequilibrium between loci we pruned the dataset using the PLINK function --indep-pairwise 50 10 0.1 using only autosomal genotypes resulting in 95,809 variants for 312 animals. Then we ran ADMIXTURE for K = 1–20 and calculated cross-validation error for each run (-cv). The results of the ADMIXTURE analysis were visualized with PONG software [91] the results of PCA analysis were plotted within the R environment.
Identification of signatures of selection with hapFLK statistics
We performed a genome scan for selective sweeps within each group of breeds and for all breeds simultaneously to infer regions which were under selection during the group/breed formation and in the ancestral population of all studied breeds using a haplotype-based statistics hapFLK [92]. Due to the hapFLK model assuming that selection acts on shared ancestral SNP allele frequencies, we excluded rare SNPs with low minor allele frequencies (MAFs) from each of the breed groups (MAF < 0.05). We also excluded poorly genotyped individuals (< 95% of SNPs with genotypes), loci genotyped in < 99% of samples, SNPs without chromosomal assignments, and SNPs on sex chromosomes in PLINK, using the commands: --maf 0.05, --mind 0.05, --geno 0.01, and --chr 1–26 prior to performing the genome selection scans. This resulted in 506,343 autosomal SNPs for the all-breed analysis, 492,607 and 499,219 for GROUP1 and GROUP2, respectively.
The hapFLK method takes the haplotype structure of the population into account. What was important for our dataset is that this method can account for population bottlenecks and migration. Reynolds distances and a kinship matrix were calculated by the hapFLK program v.1.4 [92]. For the hapFLK analysis, the number of haplotype clusters for each breed group were estimated with fastPhase [93] and were set as -K 40, 25, 35 for the all-breed set, GROUP1, and GROUP2, respectively. The expected maximum number of iterations was set to 30 for three groups. We applied midpoint rooting to all sets of breeds.
P-value calculation
For hapFLK, the calculation of raw p-values was performed assuming that the selected regions represent only a small fraction of the genome [7]. The genome-wide distribution of hapFLK statistics could be modelled relatively well with a normal distribution except for a small fraction of outliers from potentially selected regions [7]. Robust estimations of the mean and variance of the hapFLK statistic were obtained using the R MASS package rlm function to eliminate influence of outlying regions following Biotard and co-workers (2016) [94]. This has been done for each group (all breeds, GROUP1, and GROUP2). The hapFLK values were Z-transformed using these parameter estimates, and p-values were calculated from the normal distribution in R. The R qvalue package was used to correct p-values for multiple testing [95].
Composite measure of selection (DCMS statistics)
Recent studies demonstrated the high efficiency of composite measures of selection over the single-statistic tests or their simple meta-analysis [96, 97]. Composite measures of selection such as de-correlated composite of multiple signals DCMS [96] allow more pricisely locate the selection signal and filter out spurious results specific for some methods. For this study we combined five well-established genome-wide statististics into a single DCMS framework [96]. The DCMS works by combining p-values from different statistics at each locus and correcting for the overall correlation between the statistics based on the covariance matrix. We aggregated the following statistics in the present work: haplotype homozygosity (H1 [98]), modified haplotype homozygosity statistics (H12 [98], fixation index (FST [99], Tajima’s D index [100] and nucleotide diversity (Pi [101]).
Haplotype-based statistics
Autosomal genotypes were phased using SHAPEIT2 software [102] with 400 conditioning states (-states 400) and effective population size parameter equal to 3000 (-effective-size 3000) as a safe estimate of genetic variation within our diverse dataset. The recombination rate along the chromosomes was corrected with a high-resolution ovine genetic map [103].
To calculate the haplotype-based H1 and H12 statistics the phased VCF file was converted to the format required by the H12_H2H1.py script (https://github.com/ngarud/SelectionHapStats) from Garud and co-workers (2015) [98]. The statistics were calculated for each autosome of each breed using overlapping windows of 25 single nucleotide variants (SNVs, -w 25) with the step size equal to 1 (-j 1) and allowing zero false-positive SNVs per window (-d 0).
Tajima’s D statistics
To calculate Tajima’s D statistics, we first formed chromosome intervals based on the output of the H1 statistics and then passed them to the bcftools (view) software [104] along with the breed-specific gzipped VCF file, before being piped to the vcftools -TajimaD function. The work was performed in a parallel mode with assistance of GNU PARALLEL [105] to reduce calculation time.
Fixation index (FST)
To quantify the population differentiation for every SNV we calculated FST index for each breed against the combined pooled sample of all other breeds using the plink --fst function. Negative FST values were converted into zeros and the statistic was smoothed for each chromosome using R runmed function in windows of 31 SNPs (k = 31, endrule = “constant”) to reduce noise.
Nucleotide diversity (pi)
Nucleotide diversity was calculated using the vcftools -site-pi option for each position and breed separately. To reduce the overall noise the statistic was smoothed with the R runmed function with a window size of 31 SNPs (k = 31, endrule = “constant”).
De-correlated composite of multiple signals (DCMS)
At the first step, we combined all the calculated statistics (H12, H1, Pi, Tajima’s D, FST) into a single spreadsheet based on the SNV name. We then calculated genome-wide rank-based p-values for each statistic (stat_to_pvalue MINOTAUR function) using one-tailed tests (Pi and Tajima D – left-tailed; H1, H12, and FST – right-tailed) of the R MINOTAUR package [106]. To adjust for the correlation among the statistics we calculated the covariance matrix based on 300,000 randomly sampled SNPs using the CovNAMcd function with alpha = 0.75. The matrix was then used to calculate the DCMS statistic using DCMS function of the MINOTAUR package. We fitted the resulting DCMS statistics for each breed into a normal distribution using the robust fitting of the linear model method implemented in the rlm R function of the MASS package [94]. The fitted DCMS statistics were then converted into p-values using the pnorm function (lower.tail = FALSE, log.p = FALSE) and the p-values were finally converted to the corresponding q-values using the qvalue R function [95].
Identification of chromosome intervals under selection and candidate genes
We downloaded the ovine gene annotations from the Biomart [107] which correspond to the Oar_v3.1 genome assembly [108]. Next, we considered chromosome intervals with SNPs with adjusted p-values < 0.01 to determine putative regions under selection. The boundaries of each interval were defined by the locations of the first flanking SNPs exhibiting adjusted p-values > 0.1. Within the selected intervals, genes were identified within 1σ value from the most significant SNP based on statistical value (DCMS or hapFLK) distribution similar to Fariello and co-workers [7]. This approach helps to balance the number of candidate genes reported between the “sharp” selection peaks, and intervals with many SNPs exhibiting similar statistics values where larger numbers of genes were reported. Finally, the genes were ranked based on their distance from the SNP with the highest statistics value in each region with larger ranks assigned to more distant genes.
Additional files
Overlapping regions under putative selection detected by both the DCMS and hapFLK approaches. (XLSX 106 kb)
Putatively selected regions in genomes of 15 Russian sheep breeds as detected by the hapFLK and DCMS approaches. (XLSX 300 kb)
Additional candidate genes top-ranked in selected regions of 15 Russian sheep breeds. (XLSX 11 kb)
Acknowledgements
Not applicable.
Funding
The work was supported by the Russian Science Foundation grants (RSF, 16–14–00090 and RSF, 14–36–00039). Genotyping of the Tuva, Bubbei, Krasnoyarsk, Altai Mountain, Kulundin, and Baikal breeds were funded by the grant RSF, 16–14–00090 while genotyping of Lezgin, Karachaev, Karakul, Edilbaev, Romanov, Russian Longhaired, Groznensk, Salsk, and Volgograd breeds were funded from the grant RSF, 14–36–00039. The signatures of selection analyses were performed using the pipelines developed as part of the grant RSF, 16–14–00090. Publication costs were funded by the RSF grant 16–14–00090.
Availability of data and materials
Genotyping datasets are available from authors upon a reasonable request.
About this supplement
This article has been published as part of BMC Genomics Volume 20 Supplement 3, 2019: Selected articles from BGRS\SB-2018: genomics. The full contents of the supplement are available online at https://bmcgenomics.biomedcentral.com/articles/supplements/volume-20-supplement-3.
Authors’ contributions
AAY, DML, TED, NAZ analysed the data and drafted parts of the manuscript; NSY, AVD, NAZ edited the manuscript; NSY, TNK, MIS, SVE, AVD collected tissue and blood samples; HR, KW, GB genotyped samples for nine sheep breeds; DML wrote final version of the manuscript; DML and NAZ conceived the study. All authors approved the final version of the manuscript.
Ethics approval
Collection of animal samples for this study was approved by the ICG SB RAS Ethical Committee (approval 37/28.11.2017).
Consent for publication
Not applicable.
Competing interests
The authors declare that they have no competing interests.
Publisher’s Note
Springer Nature remains neutral with regard to jurisdictional claims in published maps and institutional affiliations.
Footnotes
Andrey A. Yurchenko and Tatiana E. Deniskova contributed equally to this work.
Contributor Information
Andrey A. Yurchenko, Email: andreyurch@gmail.com
Tatiana E. Deniskova, Email: horarka@yandex.ru
Nikolay S. Yudin, Email: yudin@bionet.nsc.ru
Arsen V. Dotsev, Email: asnd@mail.ru
Timur N. Khamiruev, Email: tnik0979@mail.ru
Marina I. Selionova, Email: m_selin@mail.ru
Sergey V. Egorov, Email: sibniptij@ngs.ru
Henry Reyer, Email: reyer@fbn-dummerstorf.de.
Klaus Wimmers, Email: wimmers@fbn-dummerstorf.de.
Gottfried Brem, Email: gottfried.brem@agrobiogen.de.
Natalia A. Zinovieva, Email: n_zinovieva@mail.ru
Denis M. Larkin, Email: dmlarkin@gmail.com
References
- 1.Rochus CM, Tortereau F, Plisson-Petit F, Restoux G, Moreno-Romieux C, Tosser-Klopp G, Servin B. Revealing the selection history of adaptive loci using genome-wide scans for selection: an example from domestic sheep. BMC Genomics. 2018;19(1):7. doi: 10.1186/s12864-018-4447-x. [DOI] [PMC free article] [PubMed] [Google Scholar]
- 2.Lv FH, Peng WF, Yang J, Zhao YX, Li WR, Liu MJ, Ma YH, Zhao QJ, Yang GL, Wang F, et al. Mitogenomic meta-analysis identifies two phases of migration in the history of eastern Eurasian sheep. Mol Biol Evol. 2015;32(10):2515–2533. doi: 10.1093/molbev/msv139. [DOI] [PMC free article] [PubMed] [Google Scholar]
- 3.Zhao YX, Yang J, Lv FH, Hu XJ, Xie XL, Zhang M, Li WR, Liu MJ, Wang YT, Li JQ, et al. Genomic reconstruction of the history of native sheep reveals the peopling patterns of nomads and the expansion of early pastoralism in East Asia. Mol Biol Evol. 2017;34(9):2380–2395. doi: 10.1093/molbev/msx181. [DOI] [PMC free article] [PubMed] [Google Scholar]
- 4.Zeder MA. Domestication and early agriculture in the Mediterranean Basin: origins, diffusion, and impact. Proc Natl Acad Sci U S A. 2008;105(33):11597–11604. doi: 10.1073/pnas.0801317105. [DOI] [PMC free article] [PubMed] [Google Scholar]
- 5.Garcia-Gamez E, Reverter A, Whan V, McWilliam SM, Arranz JJ, Kijas J, Consortium ISG Using regulatory and epistatic networks to extend the findings of a genome scan: identifying the gene drivers of pigmentation in merino sheep. PLoS One. 2011;6(6):e21158. doi: 10.1371/journal.pone.0021158. [DOI] [PMC free article] [PubMed] [Google Scholar]
- 6.Kijas JW, Lenstra JA, Hayes B, Boitard S, Porto Neto LR, San Cristobal M, Servin B, McCulloch R, Whan V, Gietzen K, et al. Genome-wide analysis of the world's sheep breeds reveals high levels of historic mixture and strong recent selection. PLoS Biol. 2012;10(2):e1001258. doi: 10.1371/journal.pbio.1001258. [DOI] [PMC free article] [PubMed] [Google Scholar]
- 7.Fariello MI, Servin B, Tosser-Klopp G, Rupp R, Moreno C, San Cristobal M, Boitard S, Consortium ISG. Selection signatures in worldwide sheep populations. PLoS One. 2014;9(8):e103813. doi: 10.1371/journal.pone.0103813. [DOI] [PMC free article] [PubMed] [Google Scholar]
- 8.Moradi MH, Nejati-Javaremi A, Moradi-Shahrbabak M, Dodds KG, McEwan JC. Genomic scan of selective sweeps in thin and fat tail sheep breeds for identifying of candidate regions associated with fat deposition. BMC Genet. 2012;13:10. doi: 10.1186/1471-2156-13-10. [DOI] [PMC free article] [PubMed] [Google Scholar]
- 9.Fleming-Waddell JN, Olbricht GR, Taxis TM, White JD, Vuocolo T, Craig BA, Tellam RL, Neary MK, Cockett NE, Bidwell CA. Effect of DLK1 and RTL1 but not MEG3 or MEG8 on muscle gene expression in Callipyge lambs. PLoS One. 2009;4(10):e7399. doi: 10.1371/journal.pone.0007399. [DOI] [PMC free article] [PubMed] [Google Scholar]
- 10.Moioli B, Scata MC, Steri R, Napolitano F, Catillo G. Signatures of selection identify loci associated with milk yield in sheep. BMC Genet. 2013;14:76. doi: 10.1186/1471-2156-14-76. [DOI] [PMC free article] [PubMed] [Google Scholar]
- 11.Liu ZH, Ji ZB, Wang GZ, Chao TL, Hou L, Wang JM. Genome-wide analysis reveals signatures of selection for important traits in domestic sheep from different ecoregions. BMC Genomics. 2016;17(1):863. doi: 10.1186/s12864-016-3212-2. [DOI] [PMC free article] [PubMed] [Google Scholar]
- 12.Demars J, Cano M, Drouilhet L, Plisson-Petit F, Bardou P, Fabre S, Servin B, Sarry J, Woloszyn F, Mulsant P, et al. Genome-wide identification of the mutation underlying fleece variation and discriminating ancestral hairy species from modern woolly sheep. Mol Biol Evol. 2017;34(7):1722–1729. doi: 10.1093/molbev/msx114. [DOI] [PMC free article] [PubMed] [Google Scholar]
- 13.Mcrae KM, McEwan JC, Dodds KG, Gemmell NJ. Signatures of selection in sheep bred for resistance or susceptibility to gastrointestinal nematodes. BMC Genomics. 2014;15:637. doi: 10.1186/1471-2164-15-637. [DOI] [PMC free article] [PubMed] [Google Scholar]
- 14.Wollenberg Valero KC, Pathak R, Prajapati I, Bankston S, Thompson A, Usher J, Isokpehi RD. A candidate multimodal functional genetic network for thermal adaptation. PeerJ. 2014;2:e578. doi: 10.7717/peerj.578. [DOI] [PMC free article] [PubMed] [Google Scholar]
- 15.Wei CH, Wang HH, Liu G, Zhao FP, Kijas JW, Ma YJ, Lu J, Zhang L, Cao JX, Wu MM, et al. Genome-wide analysis reveals adaptation to high altitudes in Tibetan sheep. Sci Rep-Uk. 2016;6:26770. [DOI] [PMC free article] [PubMed]
- 16.Gorkhali NA, Dong KZ, Yang M, Song S, Kader A, Shrestha BS, He XH, Zhao QJ, Pu YB, Li XC, et al. Genomic analysis identified a potential novel molecular mechanism for high-altitude adaptation in sheep at the Himalayas. Sci Rep-Uk. 2016;6:29963. [DOI] [PMC free article] [PubMed]
- 17.Kim ES, Elbeltagy AR, Aboul-Naga AM, Rischkowsky B, Sayre B, Mwacharo JM, Rothschild MF. Multiple genomic signatures of selection in goats and sheep indigenous to a hot arid environment. Heredity. 2016;116(3):255–264. doi: 10.1038/hdy.2015.94. [DOI] [PMC free article] [PubMed] [Google Scholar]
- 18.Lv FH, Agha S, Kantanen J, Colli L, Stucki S, Kijas JW, Joost S, Li MH, Marsan PA. Adaptations to climate-mediated selective pressures in sheep. Mol Biol Evol. 2014;31(12):3324–3343. doi: 10.1093/molbev/msu264. [DOI] [PMC free article] [PubMed] [Google Scholar]
- 19.Bautista DM, Siemens J, Glazer JM, Tsuruda PR, Basbaum AI, Stucky CL, Jordt SE, Julius D. The menthol receptor TRPM8 is the principal detector of environmental cold. Nature. 2007;448(7150):204–208. doi: 10.1038/nature05910. [DOI] [PubMed] [Google Scholar]
- 20.Deniskova TE, Dotsev AV, Selionova MI, Kunz E, Medugorac I, Reyer H, Wimmers K, Barbato M, Traspov AA, Brem G, et al. Population structure and genetic diversity of 25 Russian sheep breeds based on whole-genome genotyping. Genet Sel Evol. 2018;50(1):29. doi: 10.1186/s12711-018-0399-5. [DOI] [PMC free article] [PubMed] [Google Scholar]
- 21.Muona M, Ishimura R, Laari A, Ichimura Y, Linnankivi T, Keski-Filppula R, Herva R, Rantala H, Paetau A, Poyhonen M, et al. Biallelic variants in UBA5 link dysfunctional UFM1 ubiquitin-like modifier pathway to severe infantile-onset encephalopathy. Am J Hum Genet. 2016;99(3):683–694. doi: 10.1016/j.ajhg.2016.06.020. [DOI] [PMC free article] [PubMed] [Google Scholar]
- 22.Tuand K, Stijnen P, Volders K, Declercq J, Nuytens K, Meulemans S, Creemers J. Nuclear localization of the autism candidate gene Neurobeachin and functional interaction with the NOTCH1 intracellular domain indicate a role in regulating transcription. PLoS One. 2016;11(3):e0151954. doi: 10.1371/journal.pone.0151954. [DOI] [PMC free article] [PubMed] [Google Scholar]
- 23.Wang Z, Zhang H, Yang H, Wang S, Rong E, Pei W, Li H, Wang N. Genome-wide association study for wool production traits in a Chinese merino sheep population. PLoS One. 2014;9(9):e107101. doi: 10.1371/journal.pone.0107101. [DOI] [PMC free article] [PubMed] [Google Scholar]
- 24.Pan ZY, Li SD, Liu QY, Wang Z, Zhou ZK, Di R, Miao BP, Hu WP, Wang XY, Hu XX, et al. Whole-genome sequences of 89 Chinese sheep suggest role of RXFP2 in the development of unique horn phenotype as response to semi-feralization. Gigascience. 2018;7(4). 10.1093/gigascience/giy019. [DOI] [PMC free article] [PubMed]
- 25.Allais-Bonnet A, Grohs C, Medugorac I, Krebs S, Djari A, Graf A, Fritz S, Seichter D, Baur A, Russ I, et al. Novel insights into the bovine polled phenotype and horn ontogenesis in Bovidae. PLoS One. 2013;8(5):e63512. doi: 10.1371/journal.pone.0063512. [DOI] [PMC free article] [PubMed] [Google Scholar]
- 26.Habib AM, Matsuyama A, Okorokov AL, Santana-Varela S, Bras JT, Aloisi AM, Emery EC, Bogdanov YD, Follenfant M, Gossage SJ, et al. A novel human pain insensitivity disorder caused by a point mutation in ZFHX2. Brain. 2018;141:365–376. doi: 10.1093/brain/awx326. [DOI] [PMC free article] [PubMed] [Google Scholar]
- 27.Klein CJ, Duan XH, Shy ME. Inherited neuropathies: clinical overview and update. Muscle Nerve. 2013;48(4):604–622. doi: 10.1002/mus.23775. [DOI] [PMC free article] [PubMed] [Google Scholar]
- 28.Staud R, Price DD, Janicke D, Andrade E, Hadjipanayis AG, Eaton WT, Kaplan L, Wallace MR. Two novel mutations of SCN9A (Nav1.7) are associated with partial congenital insensitivity to pain. Eur J Pain. 2011;15(3):223–230. doi: 10.1016/j.ejpain.2010.07.003. [DOI] [PMC free article] [PubMed] [Google Scholar]
- 29.Potulska-Chromik A, Kabzinska D, Lipowska M, Kostera-Pruszczyk A, Kochanski A. A novel homozygous mutation in the WNK1/HSN2 gene causing hereditary sensory neuropathy type 2. Acta Biochim Pol. 2012;59(3):413–415. doi: 10.18388/abp.2012_2131. [DOI] [PubMed] [Google Scholar]
- 30.Brozkova DS, Deconinck T, Griffin LB, Ferbert A, Haberlova J, Mazanec R, Lassuthova P, Roth C, Pilunthanakul T, Rautenstrauss B, et al. Loss of function mutations in HARS cause a spectrum of inherited peripheral neuropathies. Brain. 2015;138:2161–2172. doi: 10.1093/brain/awv158. [DOI] [PMC free article] [PubMed] [Google Scholar]
- 31.Heimer G, Oz-Levi D, Eyal E, Edvardson S, Nissenkorn A, Ruzzo EK, Szeinberg A, Maayan C, Mai-Zahav M, Efrati O, et al. TECPR2 mutations cause a new subtype of familial dysautonomia like hereditary sensory autonomic neuropathy with intellectual disability. Eur J Paediatr Neurol. 2016;20(1):69–79. doi: 10.1016/j.ejpn.2015.10.003. [DOI] [PubMed] [Google Scholar]
- 32.Yang GL, Fu DL, Lang X, Wang YT, Cheng SR, Fang SL, Luo YZ. Mutations in MC1R gene determine black coat color phenotype in Chinese sheep. Sci World J. 2013;2013:675382. doi: 10.1155/2013/675382. [DOI] [PMC free article] [PubMed] [Google Scholar]
- 33.Hancock AM, Witonsky DB, Gordon AS, Eshel G, Pritchard JK, Coop G, Di Rienzo A. Adaptations to climate in candidate genes for common metabolic disorders. PLoS Genet. 2008;4(2):e32. doi: 10.1371/journal.pgen.0040032. [DOI] [PMC free article] [PubMed] [Google Scholar]
- 34.Lee YH, Petkova AP, Konkar AA, Granneman JG. Cellular origins of cold-induced brown adipocytes in adult mice. FASEB J. 2015;29(1):286–299. doi: 10.1096/fj.14-263038. [DOI] [PMC free article] [PubMed] [Google Scholar]
- 35.Hao Q, Hansen JB, Petersen RK, Hallenborg P, Jorgensen C, Cinti S, Larsen PJ, Steffensen KR, Wang HB, Collins S, et al. ADD1/SREBP1c activates the PGC1-alpha promoter in brown adipocytes. Bba-Mol Cell Biol L. 2010;1801(4):421–429. doi: 10.1016/j.bbalip.2009.11.008. [DOI] [PubMed] [Google Scholar]
- 36.Bauters D, Bedossa P, Lijnen HR, Hemmeryckx B. Functional role of ADAMTS5 in adiposity and metabolic health. PLoS One. 2018;13(1):e0190595. doi: 10.1371/journal.pone.0190595. [DOI] [PMC free article] [PubMed] [Google Scholar]
- 37.Bauters D, Cobbaut M, Geys L, Van Lint J, Hemmeryckx B, Lijnen HR. Loss of ADAMTS5 enhances brown adipose tissue mass and promotes browning of white adipose tissue via CREB signaling. Mol Metab. 2017;6(7):715–724. doi: 10.1016/j.molmet.2017.05.004. [DOI] [PMC free article] [PubMed] [Google Scholar]
- 38.Zhao FP, Wei C, Zhang L, Liu J, Wang G, Zeng T, Du L. A genome scan of recent positive selection signatures in three sheep populations. J Integr Agric. 2016;15(1):162–174. doi: 10.1016/S2095-3119(15)61080-2. [DOI] [Google Scholar]
- 39.Wei CH, Wang HH, Liu G, Wu MM, Cao JXV, Liu Z, Liu RZ, Zhao FP, Zhang L, Lu J, et al. Genome-wide analysis reveals population structure and selection in Chinese indigenous sheep breeds. BMC Genomics. 2015;16:194. doi: 10.1186/s12864-015-1384-9. [DOI] [PMC free article] [PubMed] [Google Scholar]
- 40.Ling YH, Xiang H, Zhang G, Ding JP, Zhang ZJ, Zhang YH, Han JL, Ma YH, Zhang XR. Identification of complete linkage disequilibrium in the DSG4 gene and its association with wool length and crimp in Chinese indigenous sheep. Genet Mol Res. 2014;13(3):5617–5625. doi: 10.4238/2014.July.25.17. [DOI] [PubMed] [Google Scholar]
- 41.E GX, Zhao YJ, Ma YH, Cao GL, He JN, Na RS, Zhao ZQ, Jiang CD, Zhang JH, Arlvd S, et al. Desmoglein 4 diversity and correlation analysis with coat color in goat. Genet Mol Res. 2016;15(1):15017814. doi: 10.4238/gmr.15017814. [DOI] [PubMed] [Google Scholar]
- 42.Meyer B, Bazzi H, Zidek V, Musilova A, Kurtz TW, Nurnberg P, Pravenec M, Christiano AM. A spontaneous mutation in the desmoglein 4 gene underlies hypotrichosis in a new lanceolate hair rat model. Differentiation. 2004;72(9–10):541–547. doi: 10.1111/j.1432-0436.2004.07209007.x. [DOI] [PubMed] [Google Scholar]
- 43.Rufaut NW, Pearson AJ, Nixon AJ, Wheeler TT, Wilkins RJ. Identification of differentially expressed genes during a wool follicle growth cycle induced by prolactin. J Investig Dermatol. 1999;113(6):865–872. doi: 10.1046/j.1523-1747.1999.00775.x. [DOI] [PubMed] [Google Scholar]
- 44.Li Y, Zhou GX, Zhang R, Guo JZ, Li C, Martin G, Chen YL, Wang XL. Comparative proteomic analyses using iTRAQ-labeling provides insights into fiber diversity in sheep and goats. J Proteome. 2018;172:82–88. doi: 10.1016/j.jprot.2017.10.008. [DOI] [PubMed] [Google Scholar]
- 45.Kang XL, Liu G, Liu YF, Xu QQ, Zhang M, Fang MY. Transcriptome profile at different physiological stages reveals potential mode for curly fleece in Chinese tan sheep. PLoS One. 2013;8(8):e71763. doi: 10.1371/journal.pone.0071763. [DOI] [PMC free article] [PubMed] [Google Scholar]
- 46.Kang XL, Liu YF, Zhang JB, Xu QQ, Liu CK, Fang MY. Characteristics and expression profile of KRT71 screened by suppression subtractive hybridization cDNA library in curly fleece Chinese tan sheep. DNA Cell Biol. 2017;36(7):552–564. doi: 10.1089/dna.2017.3718. [DOI] [PubMed] [Google Scholar]
- 47.Wright D. The genetic architecture of domestication in animals. Bioinform Biol Insights. 2015;9(Suppl 4):11–20. doi: 10.4137/BBI.S28902. [DOI] [PMC free article] [PubMed] [Google Scholar]
- 48.Haase B, Brooks SA, Tozaki T, Burger D, Poncet PA, Rieder S, Hasegawa T, Penedo C, Leeb T. Seven novel KIT mutations in horses with white coat colour phenotypes. Anim Genet. 2009;40(5):623–629. doi: 10.1111/j.1365-2052.2009.01893.x. [DOI] [PubMed] [Google Scholar]
- 49.Naval-Sanchez M, Nguyen Q, McWilliam S, Porto-Neto LR, Tellam R, Vuocolo T, Reverter A, Perez-Enciso M, Brauning R, Clarke S, et al. Sheep genome functional annotation reveals proximal regulatory elements contributed to the evolution of modern breeds. Nat Commun. 2018;9(1):859. doi: 10.1038/s41467-017-02809-1. [DOI] [PMC free article] [PubMed] [Google Scholar]
- 50.Talenti A, Bertolini F, Williams J, Moaeen-ud-Din M, Frattini S, Coizet B, Pagnacco G, Reecy J, Rothschild MF, Crepaldi P, et al. Genomic analysis suggests KITLG is responsible for a Roan pattern in two Pakistani goat breeds. J Hered. 2018;109(3):315–319. doi: 10.1093/jhered/esx093. [DOI] [PubMed] [Google Scholar]
- 51.Li WB, Sartelet A, Tamma N, Coppieters W, Georges M, Charlier C. Reverse genetic screen for loss-of-function mutations uncovers a frameshifting deletion in the melanophilin gene accountable for a distinctive coat color in Belgian blue cattle. Anim Genet. 2016;47(1):110–113. doi: 10.1111/age.12383. [DOI] [PubMed] [Google Scholar]
- 52.Hepp D, Goncalves GL, Moreira GRP, Freitas TRO, Martins CTDC, Weimer TA, Passos DT. Identification of the e allele at the extension locus (MC1R) in Brazilian creole sheep and its role in wool color variation. Genet Mol Res. 2012;11(3):2997–3006. doi: 10.4238/2012.May.22.5. [DOI] [PubMed] [Google Scholar]
- 53.Niemi M, Sajantila A, Vilkki J. Temporal variation in coat colour (genotypes) supports major changes in the Nordic cattle population after Iron age. Anim Genet. 2016;47(4):495–498. doi: 10.1111/age.12445. [DOI] [PubMed] [Google Scholar]
- 54.Takeda K, Hozumi H, Ohba K, Yamamoto H, Shibahara S. Regional fluctuation in the functional consequence of LINE-1 insertion in the Mitf gene: the black spotting phenotype arisen from the Mitfmi-bw mouse lacking melanocytes. PLoS One. 2016;11(3):e0150228. doi: 10.1371/journal.pone.0150228. [DOI] [PMC free article] [PubMed] [Google Scholar]
- 55.Korberg IB, Sundstrom E, Meadows JRS, Pielberg GR, Gustafson U, Hedhammar A, Karlsson EK, Seddon J, Soderberg A, Vila C, et al. A simple repeat polymorphism in the MITF-M promoter is a key regulator of White spotting in dogs. PLoS One. 2014;9(8):e104363. doi: 10.1371/journal.pone.0104363. [DOI] [PMC free article] [PubMed] [Google Scholar]
- 56.Cohen-Zinder M, Seroussi E, Larkin DM, Loor JJ, Everts-van der Wind A, Lee JH, Drackley JK, Band MR, Hernandez AG, Shani M, et al. Identification of a missense mutation in the bovine ABCG2 gene with a major effect on the QTL on chromosome 6 affecting milk yield and composition in Holstein cattle. Genome Res. 2005;15(7):936–944. doi: 10.1101/gr.3806705. [DOI] [PMC free article] [PubMed] [Google Scholar]
- 57.de Mello F, Cobuci JA, Martins MF, Silva MVGB, Neto JB. Association of the polymorphism g.8514C > T in the osteopontin gene (SPP1) with milk yield in the dairy cattle breed Girolando. Anim Genet. 2012;43(5):647–648. doi: 10.1111/j.1365-2052.2011.02312.x. [DOI] [PubMed] [Google Scholar]
- 58.Gao YH, Jiang JP, Yang SH, Hou YL, Liu GE, Zhang SG, Zhang Q, Sun DX. CNV discovery for milk composition traits in dairy cattle using whole genome resequencing. BMC Genomics. 2017;18:265. doi: 10.1186/s12864-017-3636-3. [DOI] [PMC free article] [PubMed] [Google Scholar]
- 59.Toral PG, Hervas G, Suarez-Vega A, Arranz JJ, Frutos P. Isolation of RNA from milk somatic cells as an alternative to biopsies of mammary tissue for nutrigenomic studies in dairy ewes. J Dairy Sci. 2016;99(10):8461–8471. doi: 10.3168/jds.2016-11184. [DOI] [PubMed] [Google Scholar]
- 60.Suarez-Vega A, Gutierrez-Gil B, Arranz JJ. Transcriptome expression analysis of candidate milk genes affecting cheese-related traits in 2 sheep breeds. J Dairy Sci. 2016;99(8):6381–6390. doi: 10.3168/jds.2016-11048. [DOI] [PubMed] [Google Scholar]
- 61.Bionaz M, Loor JJ. Gene networks driving bovine milk fat synthesis during the lactation cycle. BMC Genomics. 2008;9:366. doi: 10.1186/1471-2164-9-366. [DOI] [PMC free article] [PubMed] [Google Scholar]
- 62.Lee JN, Wang Y, Xu YO, Li YC, Tian F, Jiang MF. Characterisation of gene expression related to milk fat synthesis in the mammary tissue of lactating yaks. J Dairy Res. 2017;84(3):283–288. doi: 10.1017/S0022029917000413. [DOI] [PubMed] [Google Scholar]
- 63.Dyer LM, Kepple JD, Ai LB, Kim WJ, Stanton VL, Reinhard MK, Backman LRF, Streitfeld WS, Babu NR, Treiber N, et al. ATM is required for SOD2 expression and homeostasis within the mammary gland. Breast Cancer Res Tr. 2017;166(3):725–741. doi: 10.1007/s10549-017-4424-0. [DOI] [PMC free article] [PubMed] [Google Scholar]
- 64.Liu JJ, Liang AX, Campanile G, Plastow G, Zhang C, Wang Z, Salzano A, Gasparrini B, Cassandro M, Yang LG. Genome-wide association studies to identify quantitative trait loci affecting milk production traits in water buffalo. J Dairy Sci. 2018;101(1):433–444. doi: 10.3168/jds.2017-13246. [DOI] [PubMed] [Google Scholar]
- 65.Boulet AM, Capecchi MR. Multiple roles of Hoxa11 and Hoxd11 in the formation of the mammalian forelimb zeugopod. Development. 2004;131(2):299–309. doi: 10.1242/dev.00936. [DOI] [PubMed] [Google Scholar]
- 66.Raines AM, Magella B, Adam M, Potter SS. Key pathways regulated by HoxA9,10,11/HoxD9,10,11 during limb development. BMC Dev Biol. 2015;15:28. doi: 10.1186/s12861-015-0078-5. [DOI] [PMC free article] [PubMed] [Google Scholar]
- 67.Fan B, Onteru SK, Du ZQ, Garrick DJ, Stalder KJ, Rothschild MF. Genome-wide association study identifies loci for body composition and structural soundness traits in pigs. PLoS One. 2011;6(2):e14726. doi: 10.1371/journal.pone.0014726. [DOI] [PMC free article] [PubMed] [Google Scholar]
- 68.Kang DJ, Zhou GX, Zhou SW, Zeng J, Wang XL, Jiang Y, Yang YX, Chen YL. Comparative transcriptome analysis reveals potentially novel roles of Homeobox genes in adipose deposition in fat-tailed sheep. Sci Rep-Uk. 2017;7:14491. [DOI] [PMC free article] [PubMed]
- 69.Tetens J, Widmann P, Kuhn C, Thaller G. A genome-wide association study indicates LCORL/NCAPG as a candidate locus for withers height in German warmblood horses. Anim Genet. 2013;44(4):467–471. doi: 10.1111/age.12031. [DOI] [PubMed] [Google Scholar]
- 70.Setoguchi K, Watanabe T, Weikard R, Albrecht E, Kuhn C, Kinoshita A, Sugimoto Y, Takasuga A. The SNP c.1326T > G in the non-SMC condensin I complex, subunit G (NCAPG) gene encoding a p.Ile442Met variant is associated with an increase in body frame size at puberty in cattle. Anim Genet. 2011;42(6):650–655. doi: 10.1111/j.1365-2052.2011.02196.x. [DOI] [PubMed] [Google Scholar]
- 71.Lindholm-Perry AK, Sexten AK, Kuehn LA, Smith TPL, King DA, Shackelford SD, Wheeler TL, Ferrell CL, Jenkins TG, Snelling WM, et al. Association, effects and validation of polymorphisms within the NCAPG-LCORL locus located on BTA6 with feed intake, gain, meat and carcass traits in beef cattle. BMC Genet. 2011;12:103. doi: 10.1186/1471-2156-12-103. [DOI] [PMC free article] [PubMed] [Google Scholar]
- 72.Abo-Ismail MK, Lansink N, Akanno E, Karisa BK, Crowley JJ, Moore SS, Bork E, Stothard P, Basarab JA, Plastow GS. Development and validation of a small SNP panel for feed efficiency in beef cattle. J Anim Sci. 2018;96(2):375–397. doi: 10.1093/jas/sky020. [DOI] [PMC free article] [PubMed] [Google Scholar]
- 73.Fossat N, Radziewic T, Jones V, Tourle K, Tam PPL. Conditional restoration and inactivation of Rbm47 reveal its tissue-context requirement for viability and growth. Genesis. 2016;54(3):115–122. doi: 10.1002/dvg.22920. [DOI] [PubMed] [Google Scholar]
- 74.Roepke TK, King EC, Reyna-Neyra A, Paroder M, Purtell K, Koba W, Fine E, Lerner DJ, Carrasco N, Abbott GW. Kcne2 deletion uncovers its crucial role in thyroid hormone biosynthesis. Nat Med. 2009;15(10):1186–U1117. doi: 10.1038/nm.2029. [DOI] [PMC free article] [PubMed] [Google Scholar]
- 75.Kemp JP, Medina-Gomez C, Estrada K, St Pourcain B, Heppe DHM, Warrington NM, Oei L, Ring SM, Kruithof CJ, Timpson NJ, et al. Phenotypic dissection of bone mineral density reveals skeletal site specificity and facilitates the identification of novel loci in the genetic regulation of bone mass attainment. PLoS Genet. 2014;10(6):e1004423. doi: 10.1371/journal.pgen.1004423. [DOI] [PMC free article] [PubMed] [Google Scholar]
- 76.Sward K, Stenkula KG, Rippe C, Alajbegovic A, Gomez MF, Albinsson S. Emerging roles of the myocardin family of proteins in lipid and glucose metabolism. J Physiol-London. 2016;594(17):4741–4752. doi: 10.1113/JP271913. [DOI] [PMC free article] [PubMed] [Google Scholar]
- 77.Bansal SK, Gupta N, Sankhwar SN, Rajender S. Differential genes expression between fertile and infertile spermatozoa revealed by transcriptome analysis. PLoS One. 2015;10(5):e0127007. doi: 10.1371/journal.pone.0127007. [DOI] [PMC free article] [PubMed] [Google Scholar]
- 78.Li Z, Lu JL, Sun XW, Pang QH, Zhao YW. Molecular cloning, mRNA expression, and localization of the G-protein subunit Galphaq in sheep testis and epididymis. Asian Austral J Anim. 2016;29(12):1702–1709. doi: 10.5713/ajas.15.1037. [DOI] [PMC free article] [PubMed] [Google Scholar]
- 79.Bao JQ, Zhang J, Zheng HL, Xu C, Yan W. UBQLN1 interacts with SPEM1 and participates in spermiogenesis. Mol Cell Endocrinol. 2010;327(1–2):89–97. doi: 10.1016/j.mce.2010.06.006. [DOI] [PMC free article] [PubMed] [Google Scholar]
- 80.San Agustin JT, Pazour GJ, Witman GB. Intraflagellar transport is essential for mammalian spermiogenesis but is absent in mature sperm. Mol Biol Cell. 2015;26(24):4358–4372. doi: 10.1091/mbc.E15-08-0578. [DOI] [PMC free article] [PubMed] [Google Scholar]
- 81.Puri P, Myers K, Kline D, Vijayaraghavan S. Proteomic analysis of bovine sperm YWHA binding partners identify proteins involved in signaling and metabolism. Biol Reprod. 2008;79(6):1183–1191. doi: 10.1095/biolreprod.108.068734. [DOI] [PMC free article] [PubMed] [Google Scholar]
- 82.Chen L, Liu K, Zhao ZS, Blair HT, Zhang P, Li DQ, Ma RLZ. Identification of sheep ovary genes potentially associated with off-season reproduction. J Genet Genomics. 2012;39(4):181–190. doi: 10.1016/j.jgg.2012.03.002. [DOI] [PubMed] [Google Scholar]
- 83.Meng YH, Zhang WL, Zhou JH, Liu MY, Chen JH, Tian S, Zhuo M, Zhang Y, Zhong Y, Du HL, et al. Genome-wide analysis of positively selected genes in seasonal and non-seasonal breeding species. PLoS One. 2015;10(5):e0126736. doi: 10.1371/journal.pone.0126736. [DOI] [PMC free article] [PubMed] [Google Scholar]
- 84.Drouilhet L, Mansanet C, Sarry J, Tabet K, Bardou P, Woloszyn F, Lluch J, Harichaux G, Viguie C, Monniaux D, et al. The highly prolific phenotype of Lacaune sheep is associated with an ectopic expression of the B4GALNT2 gene within the ovary. PLoS Genet. 2013;9(9):e1003809. doi: 10.1371/journal.pgen.1003809. [DOI] [PMC free article] [PubMed] [Google Scholar]
- 85.Yurchenko A, Daetwyler HD, Yudin N, Schnabel RD, Vander Jagt CJ, Soloshenko V, Lhasaranov B, Popov R, Taylor JF, Larkin DM. Scans for signatures of selection in Russian cattle breed genomes reveal new candidate genes for environmental acclimation and adaptation. Sci Rep-Uk. 2018;8(1):12984. [DOI] [PMC free article] [PubMed]
- 86.Zhao FP, McParland S, Kearney F, Du LX, Berry DP. Detection of selection signatures in dairy and beef cattle using high-density genomic information. Genet Sel Evol. 2015;47:49. doi: 10.1186/s12711-015-0127-3. [DOI] [PMC free article] [PubMed] [Google Scholar]
- 87.Soini K, Ovaska U, Kantanen J. Spaces of conservation of local breeds: the case of Yakutian cattle. Sociol Ruralis. 2012;52(2):170–191. doi: 10.1111/j.1467-9523.2012.00551.x. [DOI] [Google Scholar]
- 88.Sambrook J, Russell DW, Sambrook J. The condensed protocols from molecular cloning : a laboratory manual. Cold Spring Harbor: Cold Spring Harbor Laboratory Press; 2006. [Google Scholar]
- 89.Purcell S, Neale B, Todd-Brown K, Thomas L, Ferreira MA, Bender D, Maller J, Sklar P, de Bakker PI, Daly MJ, et al. PLINK: a tool set for whole-genome association and population-based linkage analyses. Am J Hum Genet. 2007;81(3):559–575. doi: 10.1086/519795. [DOI] [PMC free article] [PubMed] [Google Scholar]
- 90.Zheng X, Levine D, Shen J, Gogarten SM, Laurie C, Weir BS. A high-performance computing toolset for relatedness and principal component analysis of SNP data. Bioinformatics. 2012;28(24):3326–3328. doi: 10.1093/bioinformatics/bts606. [DOI] [PMC free article] [PubMed] [Google Scholar]
- 91.Behr AA, Liu KZ, Liu-Fang G, Nakka P, Ramachandran S. Pong: fast analysis and visualization of latent clusters in population genetic data. Bioinformatics. 2016;32(18):2817–2823. doi: 10.1093/bioinformatics/btw327. [DOI] [PMC free article] [PubMed] [Google Scholar]
- 92.Fariello MI, Boitard S, Naya H, SanCristobal M, Servin B. Detecting signatures of selection through haplotype differentiation among hierarchically structured populations. Genetics. 2013;193(3):929–941. doi: 10.1534/genetics.112.147231. [DOI] [PMC free article] [PubMed] [Google Scholar]
- 93.Scheet P, Stephens M. A fast and flexible statistical model for large-scale population genotype data: applications to inferring missing genotypes and haplotypic phase. Am J Hum Genet. 2006;78(4):629–644. doi: 10.1086/502802. [DOI] [PMC free article] [PubMed] [Google Scholar]
- 94.Boitard S, Boussaha M, Capitan A, Rocha D, Servin B. Uncovering adaptation from sequence data: lessons from genome resequencing of four cattle breeds. Genetics. 2016;203(1):433–450. doi: 10.1534/genetics.115.181594. [DOI] [PMC free article] [PubMed] [Google Scholar]
- 95.Storey JD, Tibshirani R. Statistical significance for genomewide studies. Proc Natl Acad Sci U S A. 2003;100(16):9440–9445. doi: 10.1073/pnas.1530509100. [DOI] [PMC free article] [PubMed] [Google Scholar]
- 96.Ma Y, Ding X, Qanbari S, Weigend S, Zhang Q, Simianer H. Properties of different selection signature statistics and a new strategy for combining them. Heredity (Edinb) 2015;115(5):426–436. doi: 10.1038/hdy.2015.42. [DOI] [PMC free article] [PubMed] [Google Scholar]
- 97.Lotterhos KE, Card DC, Schaal SM, Wang LY, Collins C, Verity B. Composite measures of selection can improve the signal-to-noise ratio in genome scans. Methods Ecol Evol. 2017;8(6):717–727. doi: 10.1111/2041-210X.12774. [DOI] [Google Scholar]
- 98.Garud NR, Messer PW, Buzbas EO, Petrov DA. Recent selective sweeps in north American Drosophila melanogaster show signatures of soft sweeps. PLoS Genet. 2015;11(2):e1005004. doi: 10.1371/journal.pgen.1005004. [DOI] [PMC free article] [PubMed] [Google Scholar]
- 99.Weir BS, Cockerham CC. Estimating F-statistics for the analysis of population-structure. Evolution. 1984;38(6):1358–1370. doi: 10.1111/j.1558-5646.1984.tb05657.x. [DOI] [PubMed] [Google Scholar]
- 100.Tajima F. Statistical-method for testing the neutral mutation hypothesis by DNA polymorphism. Genetics. 1989;123(3):585–595. doi: 10.1093/genetics/123.3.585. [DOI] [PMC free article] [PubMed] [Google Scholar]
- 101.Nei M, Li WH. Mathematical-model for studying genetic-variation in terms of restriction endonucleases. Proc Natl Acad Sci USA. 1979;76(10):5269–5273. doi: 10.1073/pnas.76.10.5269. [DOI] [PMC free article] [PubMed] [Google Scholar]
- 102.Delaneau O, Zagury JF, Marchini J. Improved whole-chromosome phasing for disease and population genetic studies. Nat Methods. 2013;10(1):5–6. doi: 10.1038/nmeth.2307. [DOI] [PubMed] [Google Scholar]
- 103.Petit M, Astruc JM, Sarry J, Drouilhet L, Fabre S, Moreno CR, Servin B. Variation in recombination rate and its genetic determinism in sheep populations. Genetics. 2017;207(2):767–784. doi: 10.1534/genetics.117.300123. [DOI] [PMC free article] [PubMed] [Google Scholar]
- 104.Li H, Handsaker B, Wysoker A, Fennell T, Ruan J, Homer N, Marth G, Abecasis G, Durbin R, Proc GPD The sequence alignment/map format and SAMtools. Bioinformatics. 2009;25(16):2078–2079. doi: 10.1093/bioinformatics/btp352. [DOI] [PMC free article] [PubMed] [Google Scholar]
- 105.Tange O. Gnu parallel-the command-line power tool. USENIX Mag. 2011;36(1):42–47. [Google Scholar]
- 106.Verity R, Collins C, Card DC, Schaal SM, Wang L, Lotterhos KE. Minotaur: a platform for the analysis and visualization of multivariate results from genome scans with R shiny. Mol Ecol Resour. 2017;17(1):33–43. doi: 10.1111/1755-0998.12579. [DOI] [PubMed] [Google Scholar]
- 107.Kasprzyk A. BioMart: driving a paradigm change in biological data management. Database-Oxford. 2011;2011:bar049. doi: 10.1093/database/bar049. [DOI] [PMC free article] [PubMed] [Google Scholar]
- 108.Jiang Y, Xie M, Chen W, Talbot R, Maddox JF, Faraut T, Wu C, Muzny DM, Li Y, Zhang W, et al. The sheep genome illuminates biology of the rumen and lipid metabolism. Science. 2014;344(6188):1168–1173. doi: 10.1126/science.1252806. [DOI] [PMC free article] [PubMed] [Google Scholar]
Associated Data
This section collects any data citations, data availability statements, or supplementary materials included in this article.
Supplementary Materials
Overlapping regions under putative selection detected by both the DCMS and hapFLK approaches. (XLSX 106 kb)
Putatively selected regions in genomes of 15 Russian sheep breeds as detected by the hapFLK and DCMS approaches. (XLSX 300 kb)
Additional candidate genes top-ranked in selected regions of 15 Russian sheep breeds. (XLSX 11 kb)
Data Availability Statement
Genotyping datasets are available from authors upon a reasonable request.