

Graphical abstract
Keywords: RNA modification, m6A, Feature extraction and selection, Support vector machine, Webserver
Abstract
N6-methyladenosine (m6A) is the methylation of the adenosine at the nitrogen-6 position, which is the most abundant RNA methylation modification and involves a series of important biological processes. Accurate identification of m6A sites in genome-wide is invaluable for better understanding their biological functions. In this work, an ensemble predictor named iRNA-m6A was established to identify m6A sites in multiple tissues of human, mouse and rat based on the data from high-throughput sequencing techniques. In the proposed predictor, RNA sequences were encoded by physical-chemical property matrix, mono-nucleotide binary encoding and nucleotide chemical property. Subsequently, these features were optimized by using minimum Redundancy Maximum Relevance (mRMR) feature selection method. Based on the optimal feature subset, the best m6A classification models were trained by Support Vector Machine (SVM) with 5-fold cross-validation test. Prediction results on independent dataset showed that our proposed method could produce the excellent generalization ability. We also established a user-friendly webserver called iRNA-m6A which can be freely accessible at http://lin-group.cn/server/iRNA-m6A. This tool will provide more convenience to users for studying m6A modification in different tissues.
1. Introduction
RNA modification occurs in all living organisms, and is one of the most evolutionarily conserved properties of RNAs [1]. It is critical post-transcriptional regulator for gene expression and can affect the activity, localization as well as stability of RNAs. Studies have demonstrated that RNA modification correlates with various of diseases [2]. A recent noteworthy example is N6-methyladenosine (m6A), which could affect the translation and stability of the modified transcripts, thus providing a mechanism to coordinate the regulation of groups of transcripts during cell state maintenance and transition [3]. m6A refers to methylation of the adenosine base at the nitrogen-6 position. It is dynamically reversible and can be regulated in time and space by methyltransferases and demethylases. The distribution of m6A is nonrandom and asymmetric in a way that majority of m6A sites are highly enriched within CDS, 3′ UTR, stop codon, and long introns [4], and are also found in long non-coding RNAs [5].
m6A is one of the most common and abundant modifications on RNA molecules present in eukaryotes [6]. It has been recognized as the most prominent in its range of the regulation functions in eukaryotic mRNA, leading to the significant efforts paid particularly in recent years with invention and application of high-throughput sequencing [7], [8] as well as advances in modern molecular and genetic technologies. Correct recognition of m6A sites contributes to elucidate the biological functions of m6A and the underlying mechanisms. However, the limitations including expensive experimental materials and long experimental period of high-throughput sequencing and wet experiments make it difficult to identify m6A sites at a whole-genome scale. Therefore, computational tools are required to accurately identify m6A modification sites and to help reduce the costs associated with high-throughput sequencing.
Recent years, with the development of bioinformatics and the accumulation of biological experimental data, some computational predictors have been developed to recognize m6A sites in eukaryotic organism [9], [10], [11], [12], [13], [14], [15], [16], [17], [18], [19], [20], [21]. More than 20 computational approaches developed for identifying m6A sites based on sequences have been summarized in recent review [22]. They introduced prediction model construction in a variety of aspects, including benchmark dataset construction, features employed and software availability and utility. Despite significant research efforts being devoted to the development of computational methods for RNA-modification site prediction, to our best of knowledge, few computational tools were developed especially for predicting m6A in different tissues.
In view of the aforementioned descriptions, the present study is devoted to developing a computational tool that can identify m6A modification sites in various tissues of human, mouse and rat. We firstly collected experimentally confirmed m6A sequences and non-m6A sequences to build benchmark dataset based on the experiment results by Zhang et al. [23]. Subsequently, three kinds of sequence encoding features algorithms were proposed to formulate samples. mRMR was proposed to optimize these features. Then, the obtained optimal features were inputted into the SVM to discriminate m6A sequences from non-m6A sequences. The independent datasets were performed to investigate the prediction capability of the proposed method. Finally, on the basis of the proposed method, we established an ensemble predictor called iRNA-m6A. The flowchart of this work is shown in Fig. 1.
Fig. 1.

Overall framework of iRNA-m6A.
2. Materials and methods
2.1. Benchmark dataset
Constructing an objective and rigorous benchmark dataset is a key step for establishing a reliable and robust model of m6A sites prediction [24]. Zhang et al. [23] developed m6A-REF-seq protocol to identify the modification sites in the different tissues of human (brain, liver, and kidney), mouse (brain, liver, heart, testis, and kidney) and rat (brain, liver, and kidney). This method is an antibody-independent, high-throughput, and single-base detection method based on m6A sensitive RNA endoribonuclease, which provides a new perspective for single-based m6A identification at the transcriptome level. Due to the high quality of these data, the benchmark dataset was also constructed on such data and download form the paper of Zhang et al. [23]. To further improve the quality of the data, we only selected the fragment that the length of the segment is 41 nt with the m6A site in the center as positive samples. To avoid redundancy and reduce homology bias, positive samples with more than 80% sequence similarity were removed using the CD-HIT program [25], [26].
The negative samples (non-m6A sites) for the above mentioned tissues in three genomes were collected by satisfying the requirement that the 41 nt long sequences with Adenine in the center. At the same time, these samples were not proved to be methylated by experiments. By doing so, large number of negative samples were obtained. If a model is established on an unbalanced benchmark dataset, its performance will bias [27]. Thus, we randomly extracted negative samples with the same number of positive samples in each of the tissues.
To objectively evaluate the proposed models, we separated the dataset into two parts: one is used to train the model, another is independent dataset for examining the performance of the proposed models. Details about these benchmark datasets were shown in Table 1.
Table 1.
The benchmark datasets for predicting RNA m6A sites.
| Species | Tissues | Positive | Negative | ||
|---|---|---|---|---|---|
| Training | Testing | Training | Testing | ||
| Human | Brain | 4605 | 4604 | 4605 | 4604 |
| Liver | 2634 | 2634 | 2634 | 2634 | |
| Kidney | 4574 | 4573 | 4574 | 4573 | |
| Mouse | Brain | 8025 | 8025 | 8025 | 8025 |
| Liver | 4133 | 4133 | 4133 | 4133 | |
| Kidney | 3953 | 3952 | 3953 | 3952 | |
| Heart | 2201 | 2200 | 2201 | 2200 | |
| Testis | 4704 | 4706 | 4707 | 4706 | |
| Rat | Brain | 2352 | 2351 | 2352 | 2351 |
| Liver | 1762 | 1762 | 1762 | 1762 | |
| Kidney | 3433 | 3432 | 3433 | 3432 | |
2.2. Sample formulation
Most of machine learning methods can only handle the data with same vector [28], [29], [30], [31], [32], thus, we applied diverse feature extraction algorithms to encode the RNA m6A site sequences describes as follows.
2.2.1. Physical-chemical property matrix
The first feature extraction algorithm applied in this paper is physical-chemical property matrix which used physicochemical properties of dinucleotides to characterize RNA sequences [33], [34], [35]. Suppose the length of an RNA sequence is L nt as following formula:
| (1) |
There are 44 = 16 different dimers in an RNA sequence. Each dimer in a RNA sequence has different physical-chemical (pc) properties. In the study, we considered six pc properties [36]: (1) pc1: rise; (2) pc2: roll; (3) pc3: shift; (4) pc4: slide; (5) pc5: tilt; (6) pc6: twist, which can be obtained from http://lin-group.cn/server/iRNA-m6A/download. Finally, a RNA sequence sample can be transformed into PC matrix as following.
| (2) |
Based on Eq. (2), auto-covariance (AC) and cross-covariance (CC) [37] were used to transform the matrix to a length-fixed feature vector.
According to the concept of AC, the value was defined as the number of dinucleotides to separate two subsequences for the same pc property, which can be expressed as:
| (3) |
where m is the number of pc property including 1, 2, …, 6. λ is an integer between 0 and L − 1. is the mean of the data along the mth row in the matrix of Eq. (3), as given by
| (4) |
As we can see from Eq. (3), by means of the auto-covariance approach, we can generate 6 components associated with the physical-chemical properties of an RNA sample in Eq. (1).
According to the concept of CC, the correlation between two subsequences each belonging to a different PC property can be formulated by
| (5) |
where = 1, 2…, 6; =1, 2…, 6 and ≠ . So that there are 65 components associated with the physical-chemical properties of an RNA sample in Eq. (1).
According to the formulas of auto-covariance and cross-covariance, a RNA sequence sample can generate a vector of (6 + 65) = 36 dimension.
2.2.2. Mono-nucleotide binary encoding
The second feature extraction technique is to transfer nucleotide to a string of characters which is consisted by 0 and 1 formulated as:
| (6) |
For example, the RNA sequence ‘GGAUUCGA’ can be expressed as [00100010 … .…1000]T. Therefore, a RNA sample of 41 nt in length is converted into a 164 (441) dimension vector in this study.
2.2.3. Nucleotide chemical property
The third feature description strategy used three coordinates (x, y, z) to represent the chemical properties of the four nucleotides, and the value of 0 and 1 was assigned to the three coordinates [38]. The x coordinate stands for the ring structure, y for the hydrogen bond, and z for the chemical functionality, a nucleotide in RNA sequence can be encoded by , where
| (7) |
Therefore, A, C, G and U can be represented by the coordinates (1, 1, 1), (0, 0, 1), (1, 0, 0) and (0, 1, 0), respectively. Furthermore, the density of nucleotide for extracting nucleotide composition surrounding the modification sites was defined as
| (8) |
where L is the sequence length, |Ni| is the length of the ith prefix string in the sequence.
From what has been discussed above, each nucleotide was presented by chemical properties and nucleotide frequency, which was converted into a 4-dimensional vector. Accordingly, a RNA sample of L nt long will be encoded by a (4L) dimensional vector.
2.3. Model training
Support vector machines (SVM) is a binary classification model and a supervised machine learning method based on statistical learning theory [39], [40], [41], [42], [43], which is widely employed in the recent bioinformatics researches [44], [45], [46], [47], [48], [49], [50], [51], [52]. The basic principle of SVM is to transform the input vector into a high-dimension Hilbert space and find a separating hyperplane to separate samples of different categories. SVM has rigorous mathematical theories, which makes it show the incomparable superiority of other algorithms in solving small sample and high-dimensional data problems [53], [54], [55], [56], [57], [58], [59].
In this study, the implementation of the SVM was conducted by the open source software library LIBSVM developed by Lin [60], which can be downloaded from the website (www.csie.ntu.edu.tw/~cjlin/libsvm). We chose the radial basis kernel function (RBF) to obtain the classification hyperplane, and used the grid search method to optimize the regularization parameter c and kernel parameter g based on 5-fold cross-validation test.
2.4. Feature selection technique
High dimension vector may lead to the large calculation, overfitting and low robust of proposed model [61], [62]. Consequently, feature selection is an indispensable step to exclude noise and improve computational efficiency of the proposed models [63], [64], [65]. We applied mRMR algorithm to acquire optimal feature subset. The mRMR is performed easily and efficiently as well as could achieve robust model. It is a filter-based feature selection method proposed by Peng et al. [66]. The probability density functions are defined as p(x) and p(y) for corresponding two random variables x and y, and p (x, y) is the joint probability density. The mutual information between them can be defined as
| (9) |
According to mutual information, finding a feature subset S with m optimal features is the purpose of feature screening that has the largest dependency on the target class c. The maximum relevance has the following form:
| (10) |
The minimum redundancy is defined as:
| (11) |
The final selection criteria are formulated as:
| (12) |
It can be seen the essence of mRMR is to use a standard (relevance-redundancy) to rank features to obtain the purest feature subset.
2.5. Evaluation metrics
The following indexes [67], [68], [69], [70]: sensitivity (Sn), specificity (Sp), overall accuracy (Acc), and Matthews correlation coefficient (MCC) [71], [72], [73] were used to objectively evaluate the performance of proposed models defined as Eq. (13).
| (13) |
In addition, the AUC (area under the receiver operating characteristic curve) was also calculated to objectively evaluate the proposed model [74]. The AUC ranges from 0 to 1. A model with a higher AUC indicates a better performance.
Cross-validation test is a statistical analysis method for assessing a classifier [75], [76], [77], [78], [79], [80], [81], [82], [83], [84], [85]. The basic idea of cross-validation is that the dataset is divided into several data subsets, in which one is used as testing set and the remained subsets as training set. Using training set to train classifier and testing set is used to test the obtained model. This process is repeated utile all data subset was selected as testing set. In this study, to save computational time and source, we used 5-fold cross-validation to examine the anticipated success rates of the predictor on training data. Once the model was established, the independent data was used to evaluate the performance of the model.
3. Results and discussion
3.1. Sequence composition analysis
The potential oligonucleotide distribution patterns of sequences around modification site is an effective step to understand why the site is modified and reveal the biological functions of modifications [86]. In this work, the tool Two Sample Logos [87] (http://www.twosamplelogo.org/cgi-bin/tsl/tsl.cgi) was used to investigate the nucleotide distribution surrounding m6A sites. Fig. 2 was plotted to show the statistical difference of nucleotide occurrence between positive and negative samples by Two Sample Logos for different tissues of three species. In each figure, the top panel of the x axis is for m6A site-containing sequences, whereas the bottom panel of the x axis is for non-m6A site-containing sequences. As shown in Fig. 2, the m6A sequences are significantly different (t test, p value < 0.05) from non-m6A samples in terms of nucleotide distribution. In addition, the flanking sequences of m6A among three species of different tissues all reveal some bias toward GC-rich elements but the flanking of non-m6A are AU-rich regions. Thus, it is reasonable to extract the information of the sequences to construct m6A classification model.
Fig. 2.

The nucleotide distribution surrounding m6A and non-m6A sites.
3.2. Classification models building
According to the data and features described in the materials and methods, we built models for m6A identification following three steps:
First, determining the optimal parameter of in physical-chemical property matrix. For each dataset, we calculated and compared the results by changing from 1 to 5 by using SVM in 5-fold cross-validation test. Then, the best value can be determined.
Second, building classification models based on the fusion features descripted by three feature extraction methods [88], [89]. We fused these features extracted by physical-chemical property matrix, mono-nucleotide binary encoding and nucleotide chemical property. And 11 classification models were constructed by using SVM in 5-fold cross-validation test. We noticed that the prediction accuracies of these models are almost concentrated in the range of 70% to 80%, and the values of AUC are between 0.75 and 0.90. Consequently, we looked forward to further improving the performance of models through feature selection.
Third, selecting the best features by using mRMR. We used mRMR algorithm to calculate the contribution value of each feature, and ranked the features according to the contribution values from large to small. Based on the incremental feature selection (IFS) strategy, we could obtain the optimal feature subsets for different tissues which could produce the maximum accuracies. The performance metrics of the final models obtained after the feature screening were exhibited in Table 2 and corresponding ROC curves were plotted in Fig. 3. Compared with original results, the prediction performances were not significantly improved for the most of new models. However, the dimension of the optimal feature subsets has been greatly reduced to reach the goal of eliminating the redundant features and reducing calculation time. Therefore, the 11 final prediction models were constructed after feature selecting by mRMR.
Table 2.
The performance of models before and after feature selection.
| Species | Tissues | lambda | mRMR | Dimension | Acc (%) | Sn(%) | Sp (%) | MCC | AUC |
|---|---|---|---|---|---|---|---|---|---|
| Human | Brain | 2 | No | 400 | 70.97 | 73.81 | 67.56 | 0.41 | 0.7789 |
| Yes | 206 | 71.26 | 74.79 | 66.19 | 0.41 | 0.7756 | |||
| Liver | 3 | No | 436 | 79.42 | 79.65 | 78.63 | 0.58 | 0.8683 | |
| Yes | 126 | 80.13 | 81.32 | 78.13 | 0.59 | 0.8738 | |||
| Kidney | 2 | No | 400 | 78.50 | 80.72 | 76.83 | 0.58 | 0.8658 | |
| Yes | 92 | 78.99 | 80.85 | 76.34 | 0.57 | 0.8634 | |||
| Mouse | Brain | 2 | No | 400 | 78.13 | 79.81 | 76.45 | 0.56 | 0.8612 |
| Yes | 129 | 78.75 | 79.32 | 76.90 | 0.58 | 0.8701 | |||
| Liver | 2 | No | 400 | 70.26 | 75.39 | 65.81 | 0.41 | 0.7781 | |
| Yes | 86 | 70.59 | 74.93 | 65.59 | 0.41 | 0.7743 | |||
| Kidney | 2 | No | 400 | 79.70 | 81.18 | 77.84 | 0.59 | 0.8777 | |
| Yes | 184 | 79.98 | 82.60 | 77.31 | 0.60 | 0.8726 | |||
| Heart | 2 | No | 400 | 72.19 | 73.78 | 69.15 | 0.43 | 0.7896 | |
| Yes | 88 | 72.76 | 75.24 | 68.97 | 0.44 | 0.7948 | |||
| Testis | 4 | No | 472 | 74.05 | 77.42 | 70.43 | 0.48 | 0.8190 | |
| Yes | 97 | 74.40 | 78.14 | 70.02 | 0.48 | 0.8156 | |||
| Rat | Brain | 2 | No | 400 | 75.06 | 76.06 | 72.79 | 0.49 | 0.8245 |
| Yes | 72 | 75.96 | 77.00 | 73.47 | 0.50 | 0.8282 | |||
| Liver | 3 | No | 436 | 80.05 | 82.92 | 77.30 | 0.60 | 0.8758 | |
| Yes | 109 | 80.90 | 83.09 | 76.33 | 0.60 | 0.8766 | |||
| Kidney | 4 | No | 472 | 81.11 | 82.70 | 79.03 | 0.62 | 0.8839 | |
| Yes | 124 | 81.78 | 82.46 | 80.05 | 0.63 | 0.8877 |
Fig. 3.

The ROC curves for optimal feature subsets of 11 final models.
3.3. Performance evaluation on independent dataset
To further investigate the robustness and stability of the proposed model, we established the independent datasets for each tissue as shown in Table 1. If the proposed model is suitable for the independent dataset, there is the minimal over fitting occurs. The examined results on 11 independent datasets generated by above models were listed in Table 3. We observed that the accuracies on independent datasets are similar to the results on training set by synthesizing all the evaluation metrics, indicating that our classification models are capable enough to identify the m6A sites for an unknown sequence.
Table 3.
The generalization performance of our model on independent dataset.
| Species | Tissues | Acc (%) | Sn (%) | Sp (%) | MCC | AUC |
|---|---|---|---|---|---|---|
| Human | Brain | 71.1 | 69.50 | 72.98 | 0.42 | 0.7845 |
| Liver | 79.01 | 78.19 | 79.87 | 0.58 | 0.8681 | |
| Kidney | 77.76 | 77.13 | 78.42 | 0.56 | 0.8565 | |
| Mouse | Brain | 78.26 | 77.20 | 79.41 | 0.57 | 0.8613 |
| Liver | 68.79 | 67.82 | 69.86 | 0.38 | 0.762 | |
| Kidney | 79.31 | 78.37 | 80.32 | 0.59 | 0.8697 | |
| Heart | 71.3 | 70.52 | 72.13 | 0.43 | 0.7878 | |
| Testis | 73.54 | 72.19 | 75.08 | 0.47 | 0.8182 | |
| Rat | Brain | 75.14 | 73.93 | 76.48 | 0.50 | 0.8265 |
| Liver | 79.85 | 77.74 | 82.31 | 0.60 | 0.8761 | |
| Kidney | 81.42 | 80.18 | 82.77 | 0.63 | 0.8968 |
3.4. Cross-species/tissues validation
In the study, we collected 11 benchmark datasets of different tissues from three species. It is necessary to demonstrate whether a model trained with the data from one tissue could recognize the m6A sites in other tissues. Therefore, we applied the knowledge of transfer information [90] to study the relationships of interacting tissues and designed following experiment. The 11 tissues-specific models were first constructed by training datasets from 11 different tissues, respectively. Subsequently, for each model, the 11 tissues’ training datasets were regarded as independent testing datasets to evaluate the performance of the models. A heat map was drawn in Fig. 4 to describe the prediction performance of cross-species/tissues validation based on the AUC values. The models in rows were tested on the other datasets in columns. For the convenience to observe, the different tissues of same species were marked by black box dashed.
Fig. 4.

The heat map showing the values of AUC in cross-tissues prediction. Once a tissues-specific model was established on its own training dataset in rows, it was validated on the data from the same tissue as well as the independent data from the other datasets in columns.
Overall, there is a well-conserved distribution of m6A at the sequence level in mammals as all calculated AUC values were greater than 0.7 in the heat map. Especially, the datasets of human (liver and kidney), mouse (brain and kidney) and rat (brain, liver and kidney) have obtained superior results (AUCs > 0.8) in almost all models, which indicated the sequences of tissues in these species can be identified potential m6A sites in any models. However, when the 11 models were tested by using the human (brain), mouse (liver, heart and testis) as independent datasets, most of the AUC values produced were below 0.8. These results may be due to the differences of orthologous genes modified by m6A in different tissues of the three species [23].
3.5. Compared with published method
It is necessary to compare our proposed method with other published methods to highlight the superiority of the pipeline in this study. Considering the computing resources, the human and mouse benchmark datasets from iRNA-3typeA [21] are more suitable. According to the workflow in Fig. 1, the fusion features descripted by three feature extraction methods were obtained at first. Secondly, the best features set was selected by using mRMR. Third, the m6A classification models were built by SVM. Finally, we compared the results produced by iRNA-m6A with them obtained by iRNA-3typeA by jackknife test based on same benchmark datasets. Table 4 showed the comparison. It is obvious that iRNA-m6A is superior than iRNA-3typeA for identifying m6A. Therefore, the pipeline of this paper was further validated to be effective.
Table 4.
Comparative results for identifying m6A on published database.
| Species | Methods | Acc (%) | Sn (%) | Sp (%) | MCC |
|---|---|---|---|---|---|
| Human | iRNA-3typeA | 90.38 | 81.68 | 99.11 | 0.82 |
| iRNA-m6A | 97.12 | 94.34 | 99.91 | 0.94 | |
| Mouse | iRNA-3typeA | 88.39 | 77.79 | 100.00 | 0.80 |
| iRNA-m6A | 89.17 | 78.34 | 100.00 | 0.80 |
3.6. Web-server
Based on the 11 benchmark datasets showed in Table 1, a predictor called iRNA-m6A was established. The step-by-step guide on the web-server is provided as follows:
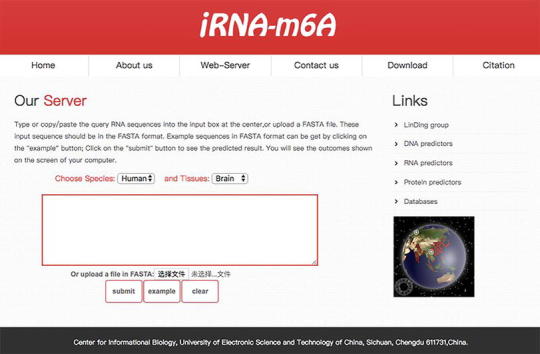
Step 1. Open the web-server at http://lin-group.cn/server/iRNA-m6A/service.html and you will see the webserver page. Click on the “Home” button to see a brief introduction about the server.
Step 2. Select “Species” and corresponding “tissues” from the drop-down menu, input the query RNA sequences into the input box or directly upload the FASTA format file. Note that the length of each sequence should be greater than 41nt long.
Step 3. Click the “Submit” button, the predicted results (Yes/No) will appear at a new page.
4. Conclusion
Because of the crucial roles of m6A in many biological processes [1], [2], [3], [4], [6], consequently, accurate identification of m6A sites in genome is essential for fundamentally revealing its regulatory mechanism and providing key clues for drug development as well [91]. The efficient and reliable computational methods can obtain high-precision prediction results and guide for wet-experimental scholars. In the present work, a new predictor, called iRNA-m6A, was developed to identify m6A sites in various tissues of different species, which included 11 m6A classification models based on SVM in 5-fold cross-validation test. Moreover, the results of independent dataset test demonstrated these proposed models were robust and reliable. Finally, we developed a webserver at http://lin-group.cn/server/iRNA-m6A, where users can submit RNA sequences in FASTA format and we can provide the potential m6A sites within the submitted RNA sequences. We anticipate the computational m6A identification platform will be useful for facilitating to reveal the functional mechanisms of m6A sites.
CRediT authorship contribution statement
Fu-Ying Dao: Methodology, Software, Visualization, Writing - original draft. Hao Lv: Conceptualization, Data curation, Methodology, Software. Yu-He Yang: Data curation, Methodology. Hasan Zulfiqar: Data curation. Hui Gao: Methodology, Writing - review & editing. Hao Lin: Conceptualization, Writing - review & editing, Supervision.
Declaration of Competing Interest
The authors declare that they have no known competing financial interests or personal relationships that could have appeared to influence the work reported in this paper.
Acknowledgments
This work was supported by the National Nature Scientific Foundation of China (61772119).
References
- 1.Sun X., Zhao L., Zou Q., Wang Z. Identification of microRNA genes and their mRNA targets in Festuca arundinacea. Appl Biochem Biotechnol. 2014;172:3875–3887. doi: 10.1007/s12010-014-0805-6. [DOI] [PubMed] [Google Scholar]
- 2.Frye M., Harada B.T., Behm M., He C. RNA modifications modulate gene expression during development. Science. 2018;361:1346–1349. doi: 10.1126/science.aau1646. [DOI] [PMC free article] [PubMed] [Google Scholar]
- 3.Dominissini D., Nachtergaele S., Moshitch-Moshkovitz S., Peer E., Kol N., Ben-Haim M.S. The dynamic N(1)-methyladenosine methylome in eukaryotic messenger RNA. Nature. 2016;530:441–446. doi: 10.1038/nature16998. [DOI] [PMC free article] [PubMed] [Google Scholar]
- 4.Meyer K.D., Saletore Y., Zumbo P., Elemento O., Mason C.E., Jaffrey S.R. Comprehensive analysis of mRNA methylation reveals enrichment in 3' UTRs and near stop codons. Cell. 2012;149:1635–1646. doi: 10.1016/j.cell.2012.05.003. [DOI] [PMC free article] [PubMed] [Google Scholar]
- 5.Yang D., Qiao J., Wang G., Lan Y., Li G., Guo X. N6-Methyladenosine modification of lincRNA 1281 is critically required for mESC differentiation potential. Nucl Acids Res. 2018;46:3906–3920. doi: 10.1093/nar/gky130. [DOI] [PMC free article] [PubMed] [Google Scholar]
- 6.Nilsen T.W. Molecular biology. Internal mRNA methylation finally finds functions. Science. 2014;343:1207–1208. doi: 10.1126/science.1249340. [DOI] [PubMed] [Google Scholar]
- 7.Reuter J.A., Spacek D.V., Snyder M.P.J.M.C. High-throughput sequencing technologies. Mol Cell. 2015;58:586–597. doi: 10.1016/j.molcel.2015.05.004. [DOI] [PMC free article] [PubMed] [Google Scholar]
- 8.Li H., Ta N., Long C., Zhang Q., Li S., Liu S. The spatial binding model of the pioneer factor Oct4 with its target genes during cell reprogramming. Comput Struct Biotechnol J. 2019;17:1226–1233. doi: 10.1016/j.csbj.2019.09.002. [DOI] [PMC free article] [PubMed] [Google Scholar]
- 9.Qiang X., Chen H., Ye X., Su R., Wei L. M6AMRFS: robust prediction of N6-methyladenosine sites with sequence-based features in multiple species. Front Genet. 2018;9:495. doi: 10.3389/fgene.2018.00495. [DOI] [PMC free article] [PubMed] [Google Scholar]
- 10.Wei L., Chen H., Su R. M6APred-EL: a sequence-based predictor for identifying N6-methyladenosine sites using ensemble learning. Mol Ther Nucl Acids. 2018;12:635–644. doi: 10.1016/j.omtn.2018.07.004. [DOI] [PMC free article] [PubMed] [Google Scholar]
- 11.Chen W., Xing P., Zou Q. Detecting N(6)-methyladenosine sites from RNA transcriptomes using ensemble support vector machines. Sci Rep. 2017;7:40242. doi: 10.1038/srep40242. [DOI] [PMC free article] [PubMed] [Google Scholar]
- 12.Xing P., Su R., Guo F., Wei L. Identifying N(6)-methyladenosine sites using multi-interval nucleotide pair position specificity and support vector machine. Sci Rep. 2017;7:46757. doi: 10.1038/srep46757. [DOI] [PMC free article] [PubMed] [Google Scholar]
- 13.Zou Q., Xing P., Wei L., Liu B. Gene2vec: gene subsequence embedding for prediction of mammalian N6-methyladenosine sites from mRNA. RNA. 2019;25:205–218. doi: 10.1261/rna.069112.118. [DOI] [PMC free article] [PubMed] [Google Scholar]
- 14.Nazari I., Tahir M., Tayara H., Chong K.T. iN6-methyl (5-step): identifying RNA N6-methyladenosine sites using deep learning mode via Chou's 5-step rules and Chou's general PseKNC. Chemometr Intell Lab Syst. 2019;193 [Google Scholar]
- 15.Akbar S., Hayat M. iMethyl-STTNC: identification of N6-methyladenosine sites by extending the idea of SAAC into Chou's PseAAC to formulate RNA sequences. J Theor Biol. 2018;455:205–211. doi: 10.1016/j.jtbi.2018.07.018. [DOI] [PubMed] [Google Scholar]
- 16.Zhang J., Feng P., Lin H., Chen W. Identifying RNA N(6)-methyladenosine sites in Escherichia coli genome. Front Microbiol. 2018;9:955. doi: 10.3389/fmicb.2018.00955. [DOI] [PMC free article] [PubMed] [Google Scholar]
- 17.Chen W., Tang H., Lin H. MethyRNA: a web server for identification of N(6)-methyladenosine sites. J Biomol Struct Dyn. 2017;35:683–687. doi: 10.1080/07391102.2016.1157761. [DOI] [PubMed] [Google Scholar]
- 18.Chen K., Wei Z., Zhang Q., Wu X., Rong R., Lu Z. WHISTLE: a high-accuracy map of the human N6-methyladenosine (m6A) epitranscriptome predicted using a machine learning approach. Nucl Acids Res. 2019;47 doi: 10.1093/nar/gkz074. [DOI] [PMC free article] [PubMed] [Google Scholar]
- 19.Liu Z., Xiao X., Yu D.J., Jia J., Qiu W.R., Chou K.C. pRNAm-PC: predicting N(6)-methyladenosine sites in RNA sequences via physical-chemical properties. Anal Biochem. 2016;497:60–67. doi: 10.1016/j.ab.2015.12.017. [DOI] [PubMed] [Google Scholar]
- 20.Chen W., Tran H., Liang Z., Lin H., Zhang L. Identification and analysis of the N(6)-methyladenosine in the Saccharomyces cerevisiae transcriptome. Sci Rep. 2015;5:13859. doi: 10.1038/srep13859. [DOI] [PMC free article] [PubMed] [Google Scholar]
- 21.Chen W., Feng P., Yang H., Ding H., Lin H., Chou K.C. iRNA-3typeA: identifying three types of modification at RNA's adenosine sites, molecular therapy. Nucl Acids. 2018;11:468–474. doi: 10.1016/j.omtn.2018.03.012. [DOI] [PMC free article] [PubMed] [Google Scholar]
- 22.Chen Z., Zhao P., Li F., Wang Y., Smith A.I., Webb G.I. Comprehensive review and assessment of computational methods for predicting RNA post-transcriptional modification sites from RNA sequences. Brief Bioinf. 2019 doi: 10.1093/bib/bbz112. [DOI] [PubMed] [Google Scholar]
- 23.Zhang Z., Chen L.Q., Zhao Y.L., Yang C.G., Roundtree I.A., Zhang Z. Single-base mapping of m(6)A by an antibody-independent method. Sci Adv. 2019;5:eaax0250. doi: 10.1126/sciadv.aax0250. [DOI] [PMC free article] [PubMed] [Google Scholar]
- 24.Chen W., Nie F., Ding H. Recent advances of computational methods for identifying bacteriophage virion proteins. Protein Pept Lett. 2019 doi: 10.2174/0929866526666190410124642. [DOI] [PubMed] [Google Scholar]
- 25.Li W., Godzik A. Cd-hit: a fast program for clustering and comparing large sets of protein or nucleotide sequences. Bioinformatics. 2006;22:1658–1659. doi: 10.1093/bioinformatics/btl158. [DOI] [PubMed] [Google Scholar]
- 26.Zou Q., Lin G., Jiang X., Liu X., Zeng X. Sequence clustering in bioinformatics: an empirical study. Brief Bioinf. 2020;21:1–10. doi: 10.1093/bib/bby090. [DOI] [PubMed] [Google Scholar]
- 27.Wang R., Wang Z., Wang J., Li S. SpliceFinder: ab initio prediction of splice sites using convolutional neural network. BMC Bioinf. 2019;20:652. doi: 10.1186/s12859-019-3306-3. [DOI] [PMC free article] [PubMed] [Google Scholar]
- 28.Liu M.L., Su W., Guan Z.X., Zhang D., Chen W., Liu L. An overview on predicting protein subchloroplast localization by using machine learning. Methods Curr Protein Peptide Sci. 2020 doi: 10.2174/1389203721666200117153412. [DOI] [PubMed] [Google Scholar]
- 29.Zhang Z.M., Guan Z.X., Wang F., Zhang D., Ding H. Applications of machine learning methods in predicting nuclear receptors and their families. Med Chem. 2019 doi: 10.2174/1573406415666191004125551. [DOI] [PubMed] [Google Scholar]
- 30.Ding H., Li D. Identification of mitochondrial proteins of malaria parasite using analysis of variance. Amino Acids. 2015;47:329–333. doi: 10.1007/s00726-014-1862-4. [DOI] [PubMed] [Google Scholar]
- 31.Liu B., Gao X., Zhang H. BioSeq-Analysis2.0: an updated platform for analyzing DNA, RNA, and protein sequences at sequence level and residue level based on machine learning approaches. Nucl Acids Res. 2019;47 doi: 10.1093/nar/gkz740. [DOI] [PMC free article] [PubMed] [Google Scholar]
- 32.Li C.-C., Liu B. MotifCNN-fold: Protein Fold Recognition based on Fold-specific Features Extracted by Motif-based Convolutional Neural Networks. Brief Bioinf. 2019 doi: 10.1093/bib/bbz133. [DOI] [PubMed] [Google Scholar]
- 33.Zuo Y., Li Y., Chen Y., Li G., Yan Z., Yang L. PseKRAAC: a flexible web server for generating pseudo K-tuple reduced amino acids composition. Bioinformatics. 2017;33:122–124. doi: 10.1093/bioinformatics/btw564. [DOI] [PubMed] [Google Scholar]
- 34.Wang J., Du P.F., Xue X.Y., Li G.P., Zhou Y.K., Zhao W. VisFeature: a stand-alone program for visualizing and analyzing statistical features of biological sequences. Bioinformatics. 2020;36:1277–1278. doi: 10.1093/bioinformatics/btz689. [DOI] [PubMed] [Google Scholar]
- 35.Wang G., Luo X., Wang J., Wan J., Xia S., Zhu H. MeDReaders: a database for transcription factors that bind to methylated DNA. Nucl Acids Res. 2018;46:D146–D151. doi: 10.1093/nar/gkx1096. [DOI] [PMC free article] [PubMed] [Google Scholar]
- 36.Perez A., Noy A., Lankas F., Luque F.J., Orozco M. The relative flexibility of B-DNA and A-RNA duplexes: database analysis. Nucl Acids Res. 2004;32:6144–6151. doi: 10.1093/nar/gkh954. [DOI] [PMC free article] [PubMed] [Google Scholar]
- 37.Kashdan E., Duncan D., Parnell A., Schattler H. Mathematical methods in systems biology. Math Biosci Eng. 2016;13:i–ii. doi: 10.3934/mbe.201606i. [DOI] [PubMed] [Google Scholar]
- 38.Chen W., Yang H., Feng P., Ding H., Lin H. iDNA4mC: identifying DNA N4-methylcytosine sites based on nucleotide chemical properties. Bioinformatics. 2017;33:3518–3523. doi: 10.1093/bioinformatics/btx479. [DOI] [PubMed] [Google Scholar]
- 39.Joachims T. SVM Light: Support Vector Machine. 1999.
- 40.Zheng L., Huang S., Mu N., Zhang H., Zhang J., Chang Y. Zuo, RAACBook: a web server of reduced amino acid alphabet for sequence-dependent inference by using Chou's five-step rule. Database (Oxford) 2019;2019:baz131. doi: 10.1093/database/baz131. [DOI] [PMC free article] [PubMed] [Google Scholar]
- 41.Pan Y., Liu D., Deng L. Accurate prediction of functional effects for variants by combining gradient tree boosting with optimal neighborhood properties. PLoS One. 2017;12 doi: 10.1371/journal.pone.0179314. [DOI] [PMC free article] [PubMed] [Google Scholar]
- 42.Xiao Y., Zhang J., Deng L. Prediction of lncRNA-protein interactions using HeteSim scores based on heterogeneous networks. Sci Rep. 2017;7:3664. doi: 10.1038/s41598-017-03986-1. [DOI] [PMC free article] [PubMed] [Google Scholar]
- 43.Zhao Y., Wang F., Juan L. MicroRNA promoter identification in Arabidopsis using multiple histone markers. Biomed Res Int. 2015;2015 doi: 10.1155/2015/861402. [DOI] [PMC free article] [PubMed] [Google Scholar]
- 44.Chao L., Jin S., Wang L., Guo F., Zou Q. AOPs-SVM: a sequence-based classifier of antioxidant proteins using a support vector machine. Front Bioeng Biotechnol. 2019;7:224. doi: 10.3389/fbioe.2019.00224. [DOI] [PMC free article] [PubMed] [Google Scholar]
- 45.Wang Y., Shi F.Q., Cao L.Y., Dey N., Wu Q., Ashour A.S. Morphological segmentation analysis and texture-based support vector machines classification on mice liver fibrosis microscopic images. Curr Bioinform. 2019;14:282–294. [Google Scholar]
- 46.Liu B., Li C., Yan K. DeepSVM-fold: Protein fold recognition by combining Support Vector Machines and pairwise sequence similarity scores generated by deep learning networks. Brief Bioinf. 2019 doi: 10.1093/bib/bbz098. [DOI] [PubMed] [Google Scholar]
- 47.Manavalan B., Basith S., Shin T.H., Lee D.Y., Wei L., Lee G. 4mCpred-EL: an ensemble learning framework for identification of DNA N(4)-methylcytosine sites in the mouse genome. Cells. 2019;8 doi: 10.3390/cells8111332. [DOI] [PMC free article] [PubMed] [Google Scholar]
- 48.Yu L., Zhao J., Gao L. Predicting potential drugs for breast cancer based on miRNA and tissue specificity. Int J Biol Sci. 2018;14:971–980. doi: 10.7150/ijbs.23350. [DOI] [PMC free article] [PubMed] [Google Scholar]
- 49.Jiang Q., Jin S., Jiang Y., Liao M., Feng R., Zhang L. Alzheimer's disease variants with the genome-wide significance are significantly enriched in immune pathways and active in immune cells. Mol Neurobiol. 2017;54:594–600. doi: 10.1007/s12035-015-9670-8. [DOI] [PubMed] [Google Scholar]
- 50.Liu G., Zhang Y., Wang L., Xu J., Chen X., Bao Y. Alzheimer's disease rs11767557 variant regulates EPHA1 gene expression specifically in human whole blood. J Alzheimers Dis. 2018;61:1077–1088. doi: 10.3233/JAD-170468. [DOI] [PubMed] [Google Scholar]
- 51.Cheng L., Wang P., Tian R., Wang S., Guo Q., Luo M. LncRNA2Target v2. 0: a comprehensive database for target genes of lncRNAs in human and mouse. Nucl Acids Res. 2019;47:D140–D144. doi: 10.1093/nar/gky1051. [DOI] [PMC free article] [PubMed] [Google Scholar]
- 52.Tang H., Cao R.Z., Wang W., Liu T.S., Wang L.M., He C.M. A two-step discriminated method to identify thermophilic proteins. Int J Biomath. 2017;10 [Google Scholar]
- 53.Chao L., Wei L., Zou Q. SecProMTB: a SVM-based classifier for secretory proteins of mycobacterium tuberculosis with imbalanced data set. Proteomics. 2019;19 doi: 10.1002/pmic.201900007. [DOI] [PubMed] [Google Scholar]
- 54.Yan K., Wen J., Liu J.-X., Xu Y., Liu B. Protein Fold Recognition by Combining Support Vector Machines and Pairwise Sequence Similarity Scores. IEEE ACM T COMPUT BI. 2020 doi: 10.1109/TCBB.2020.2966450. [DOI] [PubMed] [Google Scholar]
- 55.Yu L., Yao S.Y., Gao L., Zha Y.H. Conserved disease modules extracted from multilayer heterogeneous disease and gene networks for understanding disease mechanisms and predicting disease treatments. Front Genet. 2019;9:754. doi: 10.3389/fgene.2018.00745. [DOI] [PMC free article] [PubMed] [Google Scholar]
- 56.Liu G., Hu Y., Han Z., Jin S., Jiang Q. Genetic variant rs17185536 regulates SIM1 gene expression in human brain hypothalamus. Proc Natl Acad Sci USA. 2019;116:3347–3348. doi: 10.1073/pnas.1821550116. [DOI] [PMC free article] [PubMed] [Google Scholar]
- 57.Liu G., Xu Y., Jiang Y., Zhang L., Feng R., Jiang Q. PICALM rs3851179 variant confers susceptibility to Alzheimer’s disease in Chinese population. Mol Neurobiol. 2016;54(5):3131–3136. doi: 10.1007/s12035-016-9886-2. [DOI] [PubMed] [Google Scholar]
- 58.Zhao X., Jiao Q., Li H., Wu Y., Wang H., Huang S. ECFS-DEA: an ensemble classifier-based feature selection for differential expression analysis on expression profiles. BMC Bioinf. 2020;21:43. doi: 10.1186/s12859-020-3388-y. [DOI] [PMC free article] [PubMed] [Google Scholar]
- 59.Stephenson N., Shane E., Chase J., Rowland J., Ries D., Justice N. Survey of machine learning techniques in drug discovery. Curr Drug Metab. 2018;20(3):185–193. doi: 10.2174/1389200219666180820112457. [DOI] [PubMed] [Google Scholar]
- 60.Chang C.C, Lin C.J. A library for support vector machines. ACM T Intel Syst Tec. 2011;2(27):1–27. [Google Scholar]
- 61.Liu B, Zhu Y.L, Yan K. Fold-LTR-TCP: protein fold recognition based on triadic closure principle. Brief Bioinf. 2019 doi: 10.1093/bib/bbz139. [DOI] [PubMed] [Google Scholar]
- 62.Yang W., Deng L. PreDBA: a heterogeneous ensemble approach for predicting protein-DNA binding affinity. Sci Rep. 2020;10:1–11. doi: 10.1038/s41598-020-57778-1. [DOI] [PMC free article] [PubMed] [Google Scholar]
- 63.Zou Q., Wan S., Ju Y., Tang J., Zeng X. Pretata: predicting TATA binding proteins with novel features and dimensionality reduction strategy. BMC Syst Biol. 2016;10:114. doi: 10.1186/s12918-016-0353-5. [DOI] [PMC free article] [PubMed] [Google Scholar]
- 64.Deng L., Li W., Zhang J. LDAH2V: Exploring meta-paths across multiple networks for lncRNA-disease association prediction. IEEE/ACM Trans Comput Biol Bioinf. 2019 doi: 10.1109/TCBB.2019.2946257. [DOI] [PubMed] [Google Scholar]
- 65.Zheng N., Wang K., Zhan W., Deng L. Targeting virus-host protein interactions: feature extraction and machine learning approaches. Curr Drug Metab. 2019;20:177–184. doi: 10.2174/1389200219666180829121038. [DOI] [PubMed] [Google Scholar]
- 66.H. Peng, F. Long, C.J.I.T.o.p.a. Ding, m. intelligence, Feature selection based on mutual information criteria of max-dependency, max-relevance, and min-redundancy, 27 (2005) 1226–1238. [DOI] [PubMed]
- 67.Basith S., Manavalan B., Shin T.H., Lee G. SDM6A: a web-based integrative machine-learning framework for predicting 6mA sites in the rice genome. Mol Ther Nucl Acids. 2019;18:131–141. doi: 10.1016/j.omtn.2019.08.011. [DOI] [PMC free article] [PubMed] [Google Scholar]
- 68.Basith S., Manavalan B., Hwan Shin T., Lee G. Machine intelligence in peptide therapeutics: a next-generation tool for rapid disease screening. Med Res Rev. 2020 doi: 10.1002/med.21658. [DOI] [PubMed] [Google Scholar]
- 69.Bao Y., Marini S., Tamura T., Kamada M., Maegawa S., Hosokawa H. Toward more accurate prediction of caspase cleavage sites: a comprehensive review of current methods, tools and features. Brief Bioinf. 2018 doi: 10.1093/bib/bby041. [DOI] [PMC free article] [PubMed] [Google Scholar]
- 70.Li F.Y., Li C., Wang M.J., Webb G.I., Zhang Y., Whisstock J.C. GlycoMine: a machine learning-based approach for predicting N-, C- and O-linked glycosylation in the human proteome. Bioinformatics. 2015;31:1411–1419. doi: 10.1093/bioinformatics/btu852. [DOI] [PubMed] [Google Scholar]
- 71.Jiao Y., Du P. Performance measures in evaluating machine learning based bioinformatics predictors for classifications. Quant Biol. 2016;4:320–330. [Google Scholar]
- 72.Akbar S., Hayat M., Iqbal M., Tahir M. iRNA-PseTNC: identification of RNA 5-methylcytosine sites using hybrid vector space of pseudo nucleotide composition. Front Comput Sci. 2020;14:451–460. [Google Scholar]
- 73.Akbar S., Rahman A.U., Hayat M., Sohail M. cACP: Classifying anticancer peptides using discriminative intelligent model via Chou’s 5-step rules and general pseudo components. Chemometr Intell Lab Syst. 2020;196 [Google Scholar]
- 74.J.A. Hanley, B.J.J.R. McNeil, The meaning and use of the area under a receiver operating characteristic (ROC) curve, 143 (1982) 29–36. [DOI] [PubMed]
- 75.Chen W., Feng P., Liu T., Jin D. Recent advances in machine learning methods for predicting heat shock proteins. Curr Drug Metab. 2018;20:224–228. doi: 10.2174/1389200219666181031105916. [DOI] [PubMed] [Google Scholar]
- 76.Manavalan B., Basith S., Shin T.H., Wei L., Lee G. Meta-4mCpred: a sequence-based meta-predictor for accurate DNA 4mC site prediction using effective feature representation. Mol Ther Nucl Acids. 2019;16:733–744. doi: 10.1016/j.omtn.2019.04.019. [DOI] [PMC free article] [PubMed] [Google Scholar]
- 77.Manavalan B., Basith S., Shin T.H., Wei L., Lee G. mAHTPred: a sequence-based meta-predictor for improving the prediction of anti-hypertensive peptides using effective feature representation. Bioinformatics. 2019;35:2757–2765. doi: 10.1093/bioinformatics/bty1047. [DOI] [PubMed] [Google Scholar]
- 78.Charoenkwan P., Kanthawong S., Schaduangrat N., Yana J., Shoombuatong W. PVPred-SCM: improved prediction and analysis of phage virion proteins using a scoring card method. Cells. 2020;9 doi: 10.3390/cells9020353. [DOI] [PMC free article] [PubMed] [Google Scholar]
- 79.Laengsri V., Nantasenamat C., Schaduangrat N., Nuchnoi P., Prachayasittikul V., Shoombuatong W. TargetAntiAngio: a sequence-based tool for the prediction and analysis of anti-angiogenic peptides. Int J Mol Sci. 2019;20:2950. doi: 10.3390/ijms20122950. [DOI] [PMC free article] [PubMed] [Google Scholar]
- 80.Schaduangrat N., Nantasenamat C., Prachayasittikul V., Shoombuatong W. ACPred: a computational tool for the prediction and analysis of anticancer peptides. Molecules. 2019;24:1973. doi: 10.3390/molecules24101973. [DOI] [PMC free article] [PubMed] [Google Scholar]
- 81.Schaduangrat N., Nantasenamat C., Prachayasittikul V., Shoombuatong W. Meta-iAVP: a sequence-based meta-predictor for improving the prediction of antiviral peptides using effective feature representation. Int J Mol Sci. 2019;20:5743. doi: 10.3390/ijms20225743. [DOI] [PMC free article] [PubMed] [Google Scholar]
- 82.Cheng L., Hu Y., Sun J., Zhou M., Jiang Q. DincRNA: a comprehensive web-based bioinformatics toolkit for exploring disease associations and ncRNA function. Bioinformatics. 2018;34:1953–1956. doi: 10.1093/bioinformatics/bty002. [DOI] [PubMed] [Google Scholar]
- 83.Liu G., Jin S., Hu Y., Jiang Q. Disease status affects the association between rs4813620 and the expression of Alzheimer's disease susceptibility gene TRIB3. Proc Natl Acad Sci USA. 2018;115:E10519–E10520. doi: 10.1073/pnas.1812975115. [DOI] [PMC free article] [PubMed] [Google Scholar]
- 84.Liu G., Wang T., Tian R., Hu Y., Han Z., Wang P. Alzheimer's disease risk variant rs2373115 regulates GAB2 and NARS2 expression in human brain tissues. J Mol Neurosci. 2018;66:37–43. doi: 10.1007/s12031-018-1144-9. [DOI] [PubMed] [Google Scholar]
- 85.Zhao Y., Wang F., Chen S., Wan J., Wang G. Methods of MicroRNA promoter prediction and transcription factor mediated regulatory network. Biomed Res Int. 2017;2017:7049406. doi: 10.1155/2017/7049406. [DOI] [PMC free article] [PubMed] [Google Scholar]
- 86.Smith Z.D., Meissner A. DNA methylation: roles in mammalian development. Nat Rev Genet. 2013;14:204–220. doi: 10.1038/nrg3354. [DOI] [PubMed] [Google Scholar]
- 87.Vacic V., Iakoucheva L.M., Radivojac P. Two Sample Logo: a graphical representation of the differences between two sets of sequence alignments. Bioinformatics. 2006;22:1536–1537. doi: 10.1093/bioinformatics/btl151. [DOI] [PubMed] [Google Scholar]
- 88.Ali F., Ahmed S., Swati Z.N.K., Akbar S. DP-BINDER: machine learning model for prediction of DNA-binding proteins by fusing evolutionary and physicochemical information. J Comput Aided Mol Des. 2019;33:645–658. doi: 10.1007/s10822-019-00207-x. [DOI] [PubMed] [Google Scholar]
- 89.Akbar S., Hayat M., Iqbal M., Jan M.A. iACP-GAEnsC: evolutionary genetic algorithm based ensemble classification of anticancer peptides by utilizing hybrid feature space. Artif Intell Med. 2017;79:62–70. doi: 10.1016/j.artmed.2017.06.008. [DOI] [PubMed] [Google Scholar]
- 90.Mazo C., Bernal J., Trujillo M., Alegre E. Transfer learning for classification of cardiovascular tissues in histological images. Comput Methods Programs Biomed. 2018;165:69–76. doi: 10.1016/j.cmpb.2018.08.006. [DOI] [PubMed] [Google Scholar]
- 91.Liu H., Zhang W., Zou B., Wang J., Deng Y., Deng L. DrugCombDB: a comprehensive database of drug combinations toward the discovery of combinatorial therapy. Nucl Acids Res. 2020;48:D871–D881. doi: 10.1093/nar/gkz1007. [DOI] [PMC free article] [PubMed] [Google Scholar]