Abstract
Recognition of microbe-associated molecular patterns (MAMPs) via plasma membrane (PM)-resident pattern recognition receptors (PRRs) triggers the first line of inducible defense against invading pathogens1–3. Receptor-like cytoplasmic kinases (RLCKs) are convergent regulators that associate with multiple PRRs in plants4. The mechanisms underlying PM-tethered RLCK activation remain elusive. We report here that, upon MAMP perception, RLCK BOTRYTIS-INDUCED KINASE 1 (BIK1) is monoubiquitinated following phosphorylation, then released from the flagellin receptor FLAGELLIN SENSING 2 (FLS2)-BRASSINOSTEROID INSENSITIVE 1-ASSOCIATED KINASE 1 (BAK1) complex, and internalized dynamically into endocytic compartments. Arabidopsis E3 ubiquitin ligases RING-H2 FINGER A3A (RHA3A) and RHA3B mediate the monoubiquitination of BIK1, which is essential for the subsequent BIK1 release from the FLS2-BAK1 complex and immune signaling activation. Ligand-induced monoubiquitination and endosomal puncta of BIK1 exhibit spatial and temporal dynamics distinct from those of PRR FLS2. Our study reveals the intertwined regulation of PRR-RLCK complex activation by protein phosphorylation and ubiquitination, and elucidates that ligand-induced monoubiquitination contributes to the release of BIK1 family RLCKs from the PRR complex and activation of PRR signaling.
Prompt activation of PRRs upon microbial infection is essential for hosts to defend against pathogen attacks1–3. The arabidopsis BIK1 family RLCKs are immune regulators associated with multiple PRRs, including the bacterial flagellin receptor FLS2, and co-receptor BAK1/SERKs5,6. Upon ligand perception, BIK1 is phosphorylated by BAK1 and subsequently dissociates from the FLS2-BAK1 complex7. Downstream of the PRR complex, BIK1 phosphorylates PM-resident NADPH oxidases to regulate reactive oxygen species (ROS) production8,9, and cyclic nucleotide-gated channels to trigger a rise of cytosolic calcium10. However, it remains elusive how BIK1 activation and dynamic association with the PRR complex is regulated.
Ligand-induced increase of BIK1 puncta
We observed that BIK1-GFP localized to both the periphery of epidermal pavement cells and intracellular puncta using arabidopsis transgenic plants expressing functional 35S::BIK1-GFP by spinning disc confocal microscopy (SDCM) (Fig. 1a, Extended Data Fig. 1a, b). BIK1-GFP colocalized with the FM4–64-stained PM (Fig. 1b, star), and frequently within endosomal compartments (Fig. 1b, arrowheads). Time-lapse SDCM shows that BIK1-GFP puncta were highly mobile, disappearing (red circle), appearing (yellow circle), and moving rapidly in and out of the plane of view (white circle) (Extended Data Fig. 1c). The abundance of BIK1-GFP puncta was increased over time (3–17 and 18–32 min) after treatment with flagellin peptide flg22 (Fig. 1c; Extended Data Fig. 1d–p). The timing of the ligand-induced increase in BIK1-GFP puncta differed from that of FLS2-GFP, in which puncta numbers were significantly increased 35 min after flg22 treatment (Fig. 1d)11–13. Ligand-induced endocytosis of FLS2 contributes to the degradation of the activated FLS2 receptor and attenuation of the signaling11–14, whereas increased abundance of BIK1-GFP puncta precedes that of FLS2-GFP (Fig. 1c, d).
Figure 1. MAMP-induced BIK1 endocytosis and monoubiquitination.
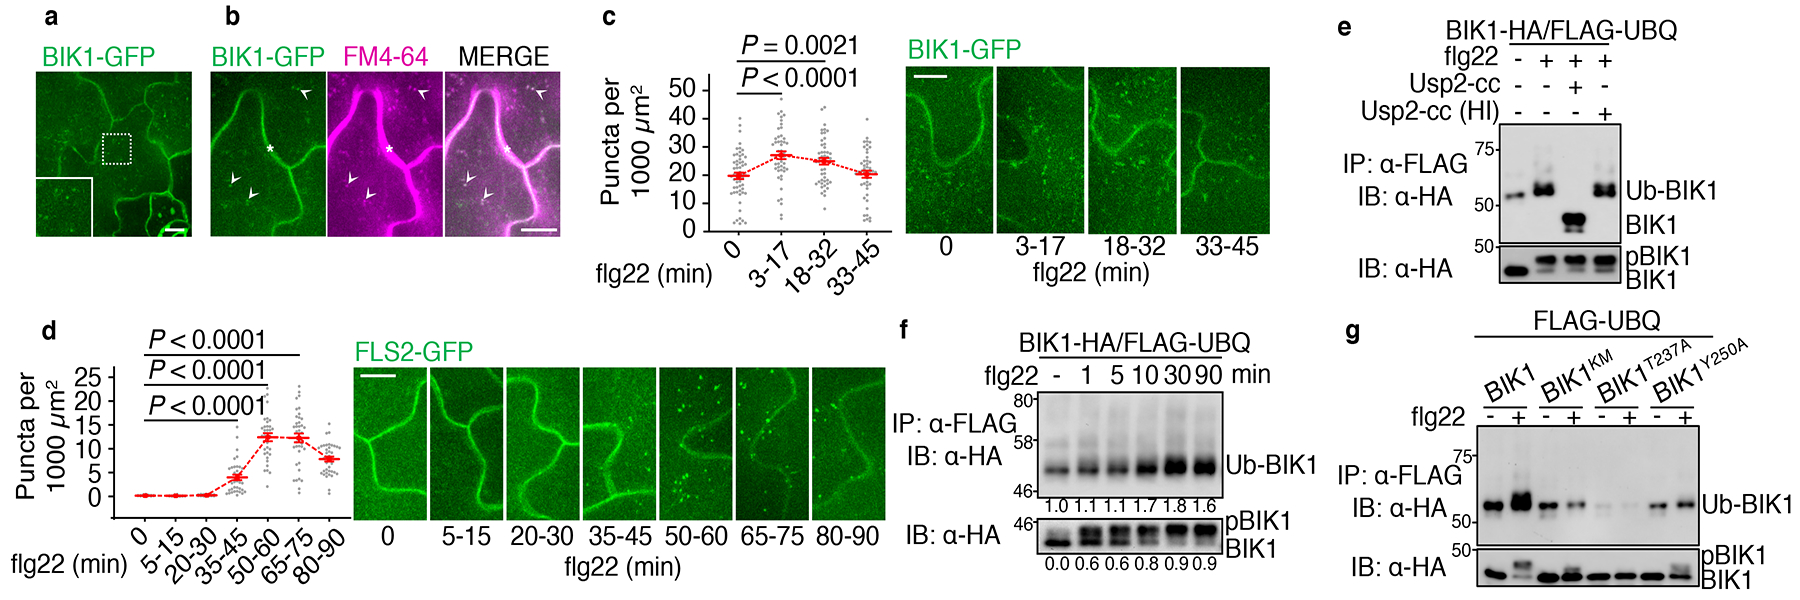
a. BIK1-GFP localizes to cell periphery and intracellular puncta (zoom insert) in maximum intensity projections of cotyledon epidermal cells. Scale bar, 10 μm. b. BIK1-GFP colocalizes with FM4–64 in PM (star) and intracellular puncta (arrowheads). Scale bar, 5 μm. BIK1-GFP/FM4–64 Pearson’s correlation coefficient = 0.55 ± 0.14 (n=35). c-d. BIK1 and FLS2 puncta increase after 1 μM flg22 treatment. Data are shown as overlay of dot plot and means ± SEM. n=56, 48, 49, 47 images for 0, 3–17, 18–32, 33–45 min respectively for BIK1-GFP (c) and n=24, 15, 21, 36, 34, 39, 39 images for 0, 5–15, 20–30, 35–45, 50–60, 65–75, 80–90 min respectively for FLS2-GFP (d). Scale bar, 5 μm. e. Flg22 induces BIK1 monoubiquitination. Protoplasts from WT plants were transfected with BIK1-HA and FLAG-UBQ, and treated with 100 nM flg22 for 30 min. After IP with α-FLAG agarose (IP: α-FLAG), ubiquitinated BIK1 was detected by immunoblot (IB) using α-HA antibody (IB: α-HA) (Lane 1 & 2) or with GST-Usp2-cc treatment (Lane 3). Heat inactivated (HI) Usp2-cc is a control (Lane 4). Bottom panel shows BIK1-HA protein expression. Molecular weight (kDa) was labeled on the left of all immunoblots. f. Time course of flg22-induced BIK1 phosphorylation and ubiquitination. Protoplasts expressing FLAG-UBQ and BIK1-HA were treated with 100 nM flg22 for the indicated time. BIK1 band intensities were quantified with Image Lab (Bio-Rad). Quantification of BIK1 phosphorylation (underneath bottom panel) is the ratio of intensities of the upper bands (pBIK1) to the sum intensities of shifted and non-shifted bands (pBIK1+BIK1). Quantification of BIK1 ubiquitination (underneath upper panel) is the relative intensity (fold change) of Ub-BIK1 bands (no treatment as 1.0). g. BIK1 variants with impaired phosphorylation compromise flg22-induced ubiquitination. All experiments were repeated at least three times with similar results.
Ligand-induced BIK1 monoubiquitination
Ligand-induced FLS2 degradation is mediated by U-box E3 ligases PUB12 and PUB13 that polyubiquitinate FLS215–17. We tested whether BIK1 is ubiquitinated upon flg22 treatment with an in vivo ubiquitination assay in arabidopsis protoplasts co-expressing FLAG epitope-tagged ubiquitin (FLAG-UBQ) and HA epitope-tagged BIK1 (Fig. 1e; Extended Data Fig. 2a). The results showed that flg22 treatment induced BIK1 ubiquitination (Fig. 1e), as ubiquitinated BIK1 was detected with an α-HA immunoblot upon immunoprecipitation with an α-FLAG antibody. The flg22-induced BIK1 ubiquitination was also observed in pBIK1::BIK1-HA transgenic plants (Extended Data Fig. 2b). The strong and discrete band of ubiquitinated BIK1 indicates monoubiquitination (Fig. 1e; Extended Data Fig. 2a, b) compared to polyubiquitination of BAK1 and FLS2 with a ladder-like smear of protein migration (Extended Data Fig. 2c, d). The apparent molecular mass of ubiquitinated BIK1 (~52 kDa) is ~8 kDa larger than that of unmodified BIK1 (44 kDa), supporting the attachment of a single ubiquitin to BIK1. Incubation with the catalytic domain of the deubiquitinase Usp2 (Usp2-cc), but not its heat-inactivated form, reduced the molecular mass by ~8 kDa (Fig. 1e). In addition, a similar ubiquitination pattern of BIK1 was observed when we used the UBQK0 variant, in which all seven lysine (K) residues in UBQ were changed to arginine (R), thus preventing polyubiquitination chain formation (Extended Data Fig. 2e, f). Notably, flg22-induced BIK1 ubiquitination was blocked by treatment with the ubiquitination inhibitor PYR-41, but not by the proteasome inhibitor MG132, and was not observed in the fls2 or bak1–4 mutants (Extended Data Fig. 2g–i). In addition to flg22, other MAMPs, including elf18, pep1, and chitin, also induced monoubiquitination of BIK1 (Extended Data Fig. 2j), in line with the notion that BIK1 is a convergent component downstream of multiple PRRs4. Monoubiquitination of the BIK1 family RLCKs PBL1 and PBL10, but not another RLCK BSK1, was enhanced upon flg22 treatment (Extended Data Fig. 2k, l), suggesting that MAMP perception induces monoubiquitination of BIK1 family RLCKs.
Upon flg22 perception, BIK1 is phosphorylated, as detected by an immunoblot mobility shift within 1 min, with a plateau around 10 min (Fig. 1f)5. However, flg22-induced BIK1 ubiquitination becomes apparent only at 10 min after treatment and reaches a plateau around 30 min (Fig. 1f), suggesting that flg22-induced BIK1 ubiquitination may occur after its phosphorylation. Consistently, BIK1 phosphorylation deficient mutants, including a kinase-inactive mutant (BIK1KM) and two phosphorylation site mutants (BIK1T237A and BIK1Y250A) largely compromised flg22-induced ubiquitination (Fig. 1g). In addition, the kinase inhibitor K252a blocked flg22-induced BIK1 ubiquitination (Extended Data Fig. 3a). Moreover, PM localization is required for BIK1 ubiquitination as BIK1G2A, a mutation at the myristoylation motif essential for PM localization, was unable to be ubiquitinated upon flg22 treatment (Extended Data Fig. 3b, c). Taken together, these data suggest that flg22-induced BIK1 phosphorylation is a prerequisite for its monoubiquitination at the PM.
BIK1 ubiquitination by RHA3A and RHA3B
There are 30 lysine residues in BIK1, all of which could potentially be ubiquitinated. We individually mutated 28 lysine residues to arginine except K105/K106 (located in the ATP-binding pocket and required for kinase activity), and screened for flg22-induced ubiquitination. None of the individual K-to-R mutants blocked BIK1 ubiquitination without altering its kinase activity (Extended Data Fig. 3d). BIK1K204R, which compromised flg22-induced BIK1 monoubiquitination, also showed reduced phosphorylation in vivo and in vitro (Extended Data Fig. 3d, e). To identify BIK1-associated regulators, we carried out a yeast two-hybrid screen using BIK1G2A as a bait, and identified RHA3A (AT2G17450) encoding a functionally uncharacterized E3 ubiquitin ligase with a RING-H2 finger domain and an N-terminal transmembrane domain (Fig. 2a). We confirmed the interaction of BIK1 with RHA3A using an in vitro pull-down assay (Fig. 2b), an in vivo co-immunoprecipitation (Co-IP) assay in arabidopsis protoplasts (Extended Data Fig. 4a), and Co-IP in transgenic plants expressing both genes under their native promoters (Fig. 2c; Extended Data Fig. 4b). RHA3B, encoded by AT4G35480, the closest homolog of RHA3A bearing 66% amino acid identity (Fig. 2a), also co-immunoprecipitated with BIK1 (Extended Data Fig. 4c). Flg22 treatment did not affect BIK1 interaction with RHA3A or RHA3B (called RHA3A/B henceforth) (Extended Data Fig. 4a, c). Moreover, RHA3A/B co-immunoprecipitated with FLS2 (Extended Data Fig. 4d).
Figure 2. E3 ligases RHA3A/B interact with and monoubiquitinate BIK1.
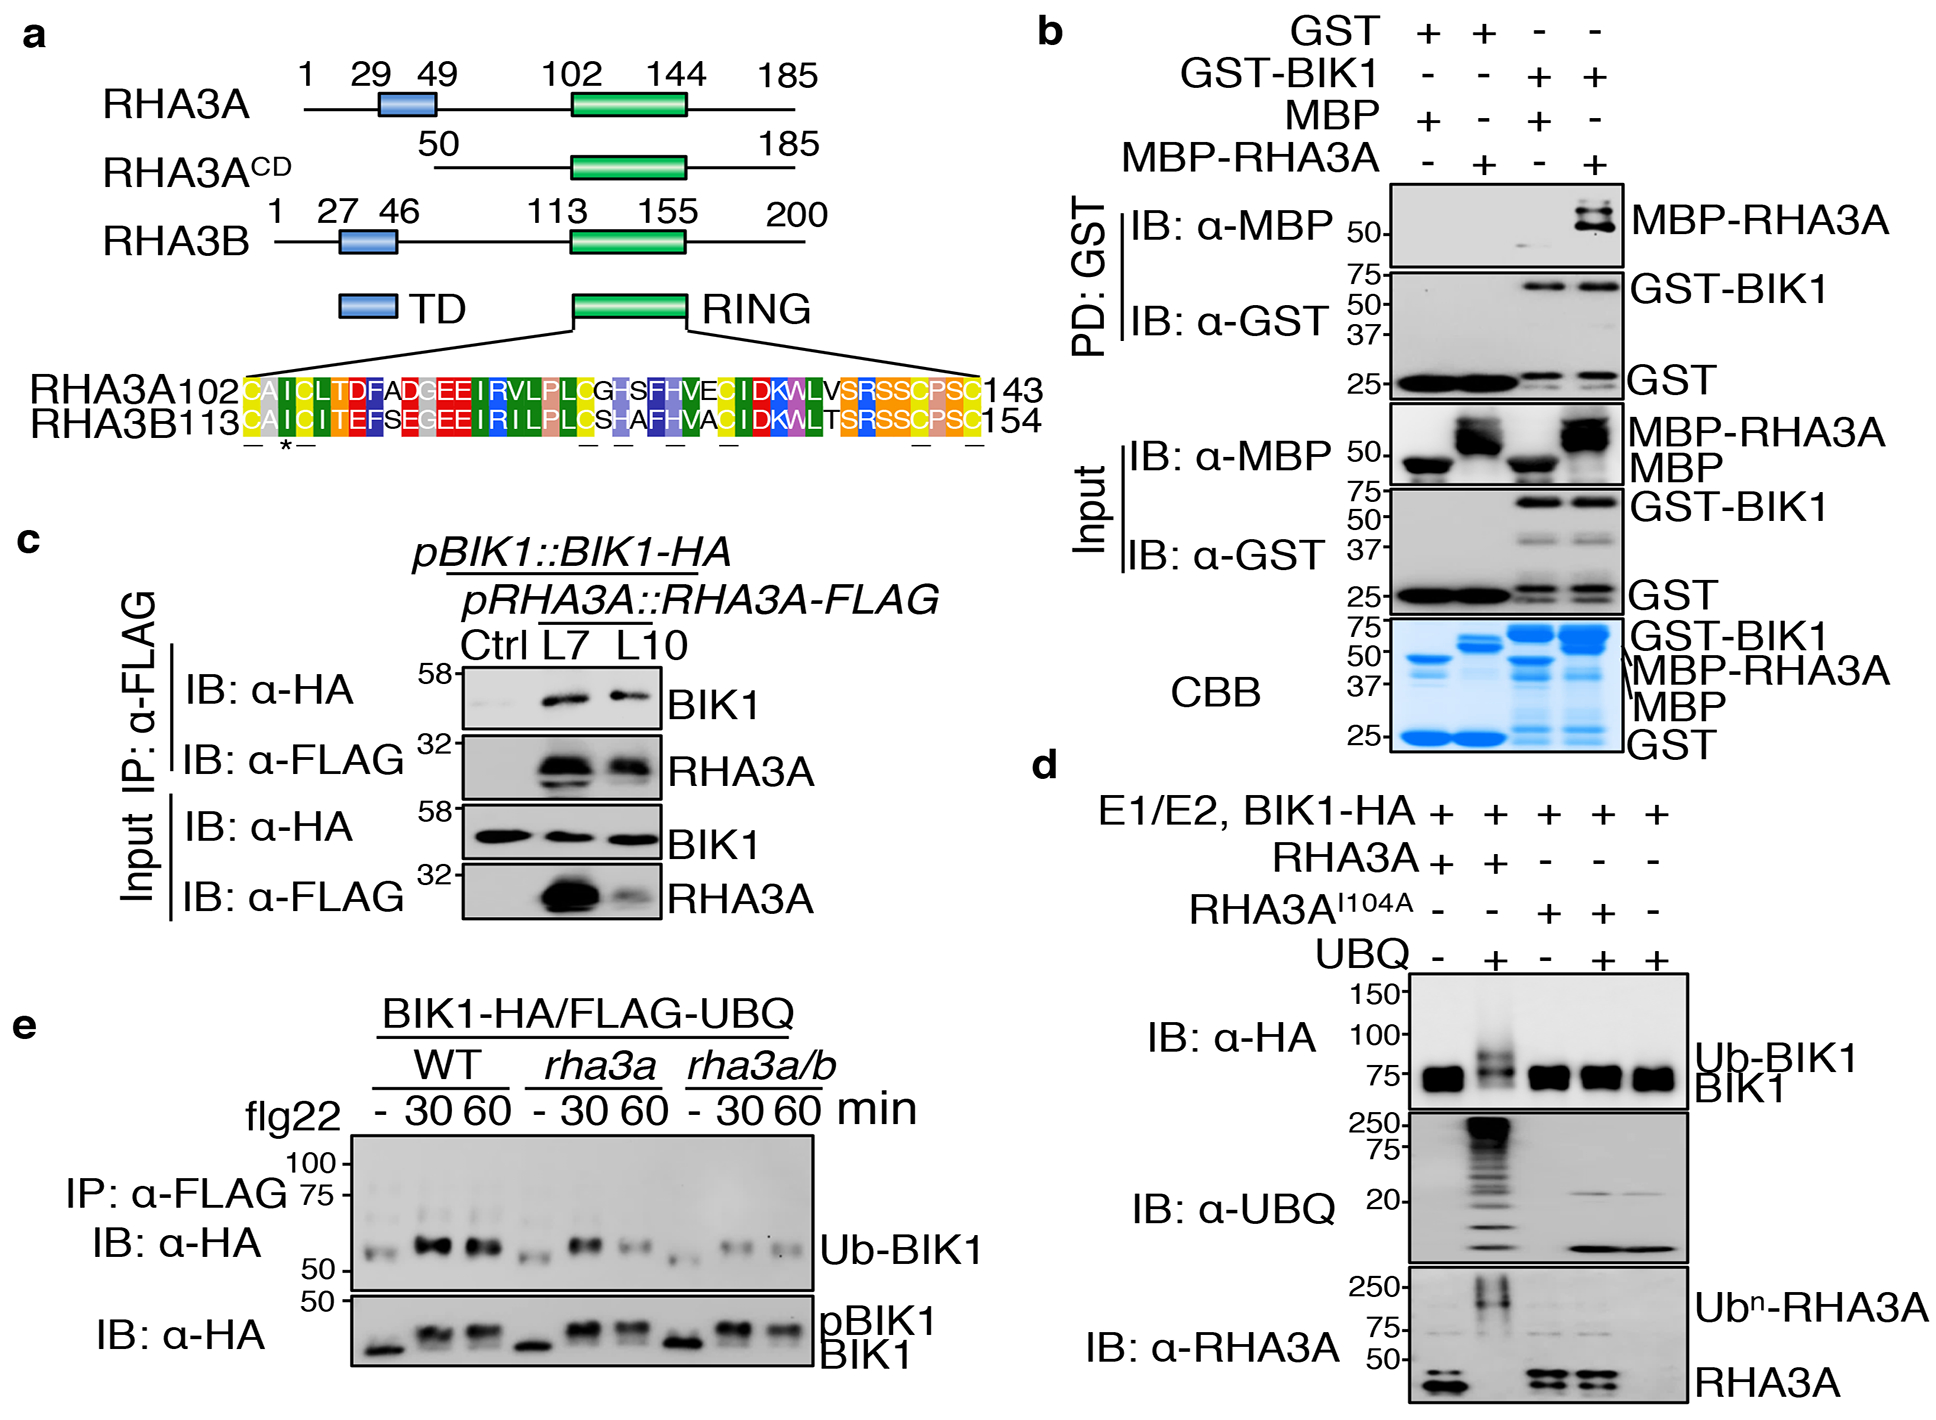
a. Domain organization of RHA3A/B. TD: transmembrane domain; RING: E3 catalytic domain; RHA3ACD: cytoplasmic domain. Amino acid positions and the sequence of RING domain are shown. Cysteine (C) and histidine (H) residues which coordinate zinc are underlined. Isoleucine (I) involved in E2-RING interaction is labeled with *. b. BIK1 interacts with RHA3A. GST or GST-BIK1 proteins immobilized on glutathione sepharose beads were incubated with MBP or MBP-RHA3ACD-HA proteins. Washed beads were subjected to IB with α-MBP or α-GST (top two panels). Input proteins are shown by IB (middle two panels) and Coomassie Brilliant Blue (CBB) staining (bottom). c. BIK1 associates with RHA3A. Transgenic plants carrying pBIK1::BIK1-HA and pRHA3A::RHA3A-FLAG (Line 7 and 10) were used for Co-IP assay with α-FLAG agarose and immunoprecipitated proteins were immunoblotted with α-HA or α-FLAG (top two panels). Bottom two panels show BIK1-HA and RHA3A-FLAG expression. d. RHA3A ubiquitinates BIK1. GST-RHA3ACD or its I104A mutant was used in the ubiquitination reaction containing GST-BIK1-HA, E1, E2, and ATP. e. RHA3A/B are required for BIK1 ubiquitination. The rha3a/b and rha3a plants were used for protoplast isolation followed by transfection of BIK1-HA and FLAG-UBQ. The experiments were repeated three times with similar results.
An in vitro ubiquitination assay demonstrated that RHA3A had autoubiquitination activity and monoubiquitinated itself (Extended Data Fig. 5a, b). Importantly, glutathione-S-transferase (GST)-RHA3A, but not GST-RHA3AI104A with substitution of a conserved isoleucine (I) residue, monoubiquitinated GST-BIK1-HA as evidenced by an additional discrete band that migrated ~8kD larger (Fig. 2d). The available rha3a and rha3b T-DNA insertion lines did not show significant reduction of the corresponding transcripts (Extended Data Fig. 5c). We thus generated artificial microRNAs (amiRNAs) of RHA3A/B18, and co-expression of amiR-RHA3A and amiR-RHA3B, but not amiR-RHA3A alone, suppressed flg22-induced BIK1 monoubiquitination in protoplast transient assays (Extended Data Fig. 5d, e). Flg22-induced BIK1 monoubiquitination, but not phosphorylation, was also reduced in transgenic plants expressing amiR-RHA3A and amiR-RHA3B driven by the native promoters (Extended Data Fig. 5f, g). Furthermore, we generated rha3a and rha3a/b mutants using the CRISPR/Cas9 system (Extended Data Fig. 5h). Flg22-induced BIK1 monoubiquitination was reduced in rha3a/b (Fig. 2e). The data together indicate that RHA3A/B modulate flg22-induced BIK1 monoubiquitination.
RHA3A-mediated BIK1 ubiquitination sites
To identify RHA3A-mediated BIK1 ubiquitination sites, we performed liquid chromatography-tandem mass spectrometry (LC-MS/MS) analysis of in vitro ubiquitinated BIK1. Among ten lysine residues identified (Fig. 3a, b; Extended Data Fig. 6a–i), K106 residing in the ATP-binding pocket blocked BIK1 kinase activity when mutated7. Among the other nine lysine sites, all six lysine (K95, K170, K186, K286, K337, and K358) with available structural information are located on the BIK1 surface (Fig. 3c)19. Furthermore, six ubiquitinated lysine residues were detected by LC-MS/MS of in vivo ubiquitinated BIK1-GFP upon flg22 treatment, and they all overlap with those detected in in vitro RHA3A-BIK1 ubiquitination reactions (Extended Data Fig. 7a–h). Individual lysine mutations did not affect BIK1 ubiquitination in vivo (Extended Data Fig. 3d), whereas combined mutations of the N-terminal five lysine (BIK1N5KR) or C-terminal four lysine (BIK1C4KR) partially compromised flg22-induced BIK1 ubiquitination, and BIK19KR with all nine lysine mutated largely blocked flg22-induced BIK1 monoubiquitination in vivo (Fig. 3d) and RHA3A-mediated in vitro ubiquitination (Fig. 3e). BIK19KR exhibited similar activities as BIK1 with regard to its in vitro kinase activities (Fig. 3f), flg22-induced BIK1 phosphorylation, and association with RHA3A in protoplasts (Extended Data Fig. 8a, b). Furthermore, 35S::BIK19KR-HA/WT transgenic plants had normal flg22-induced MAPK activation and ROS production (Extended Data Fig. 8c, d). Collectively, the data indicate that RHA3A monoubiquitinates BIK1 and that BIK1 phosphorylation does not require monoubiquitination. Notably, BIK1 monoubiquitination may not be restricted to a single lysine, and multiple lysine residues could serve as monoubiquitin conjugation sites. Alternatively, monoubiquitination might be the primary form of BIK1 modification, whereas polyubiquitinated BIK1 could be short-lived.
Figure 3. Identification of RHA3A-mediated BIK1 ubiquitination sites.
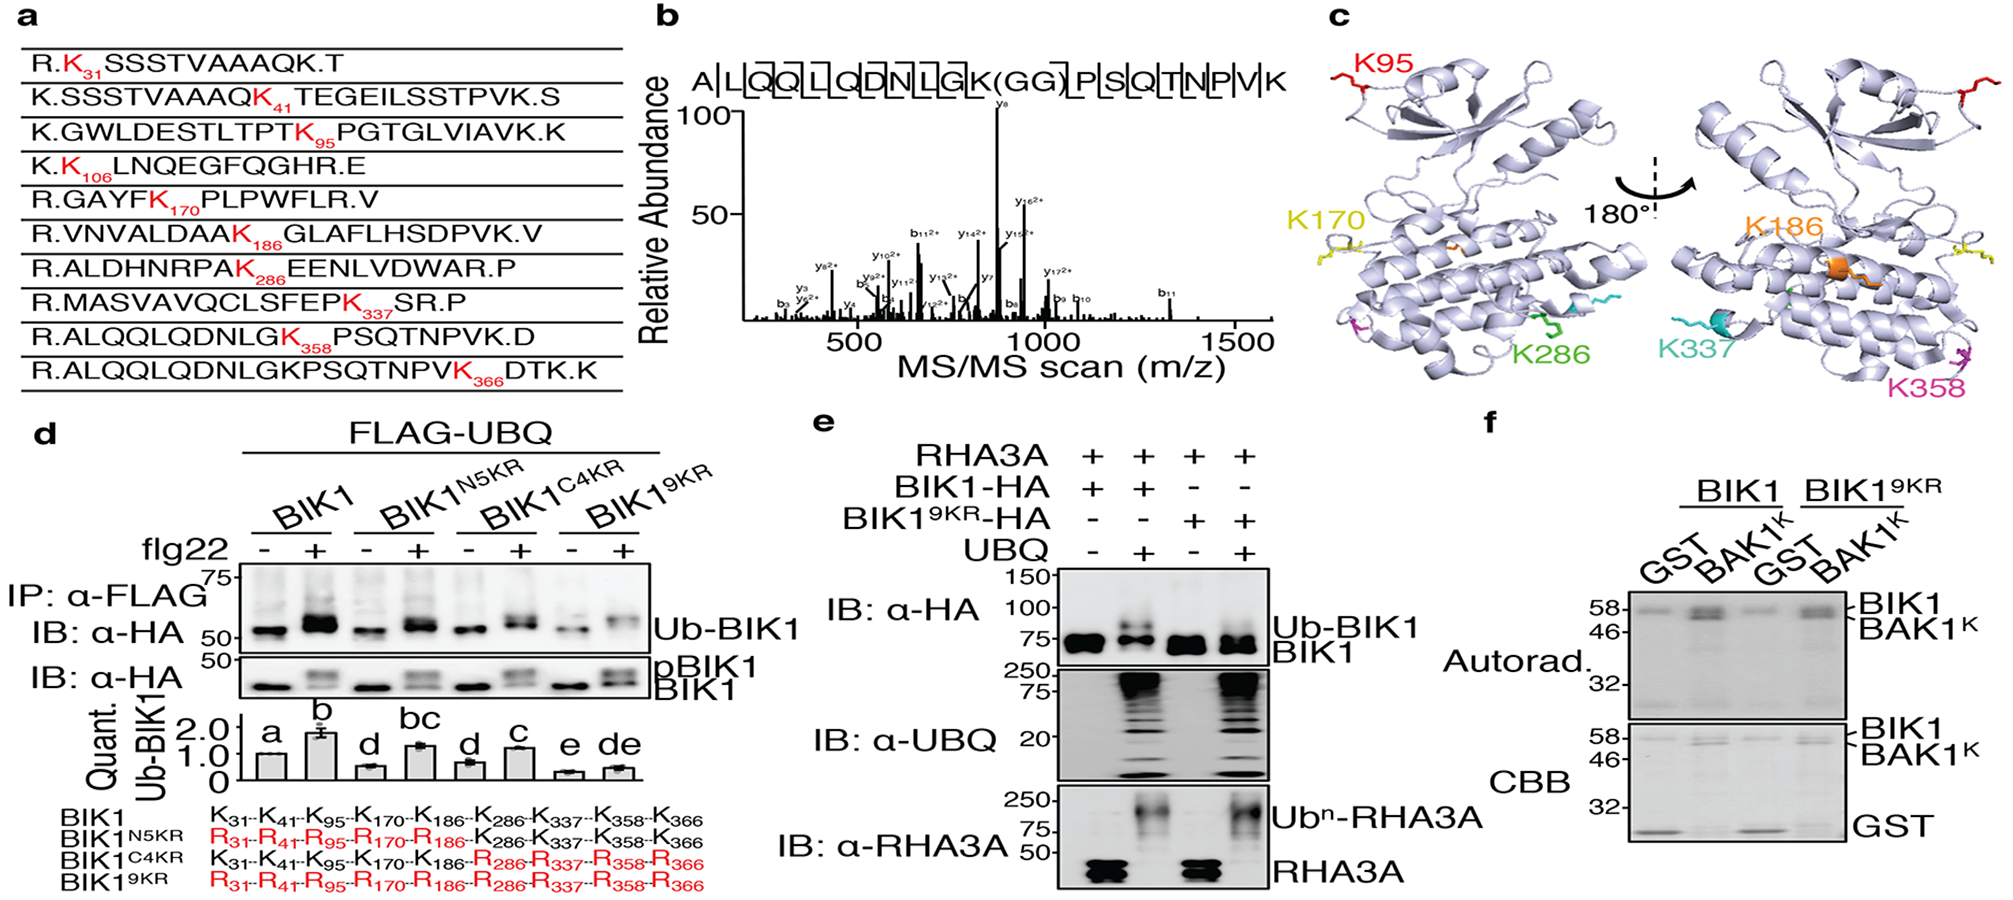
a. BIK1 is ubiquitinated by RHA3A at multiple lysine residues. Ubiquitinated lysine residues with a diglycine remnant by LC-MS/MS analysis are marked as red with amino acid positions. b. MS/MS spectrum of the peptide containing K358 is shown. c. Structure of BIK1 labeled with six lysine identified as ubiquitination sites. Structural information was obtained from protein data bank (PDB ID: 5TOS) and analyzed by PyMOL. d. BIK19KR is compromised in flg22-induced ubiquitination. FLAG-UBQ and HA-tagged BIK1 mutants were expressed in protoplasts followed by 100 nM flg22 for 30 min. Quantification of BIK1 ubiquitination fold change is shown as overlay of dot plot and means ± SEM (middle). Different letters indicate significant difference with others (P<0.05, One-way ANOVA, n=3). Mutated lysine for BIK1 mutants are in red (bottom). e. RHA3A is unable to ubiquitinate BIK19KR. The assay was performed as in Fig. 2d. f. BIK19KR exhibits normal in vitro kinase activity. The kinase assay was performed using GST-BIK1 or GST-BIK19KR as the kinase and GST or GST-BAK1K (kinase domain) as the substrate. The experiments except MS analyses were repeated three times with similar results.
BIK1 monoubiquitination in immunity
BIK19KR, which eliminates BIK1 monoubiquitination but not phosphorylation, enabled us to examine the function of BIK1 monoubiquitination without compromised kinase activity. We generated BIK19KR transgenic plants driven by the BIK1 native promoter in bik1 (pBIK1::BIK19KR-HA/bik1) (Extended Data Fig. 8e, f). Unlike pBIK1::BIK1-HA/bik1 transgenic plants, pBIK1::BIK19KR-HA/bik1 transgenic plants exhibited a reduced flg22-triggered ROS burst similar to the bik1 mutant (Fig. 4a). Moreover, pBIK1::BIK19KR-HA/bik1 transgenic plants were more susceptible to the bacterial pathogen Pseudomonas syringae pv. tomato (Pst) DC3000 hrcC− compared to wild-type (WT) or pBIK1::BIK1-HA/bik1 transgenic plants (Fig. 4b). In addition, amiR-RHA3A/B transgenic plants exhibited compromised flg22-triggered ROS production and enhanced susceptibility to Pst DC3000 (Fig. 4c, d) and Pst DC3000 hrcC−, and to the fungal pathogen, Botrytis cinerea (Extended Data Fig. 8g, h). Similar results were obtained with the rha3a/b mutants (Extended Data Fig. 8i, j). Together, the data indicate that RHA3A/B-mediated monoubiquitination of BIK1 plays a role in regulating ROS production and plant immunity.
Figure 4. RHA3A/B-mediated BIK1 monoubiquitination contributes to its function in immunity and endocytosis.
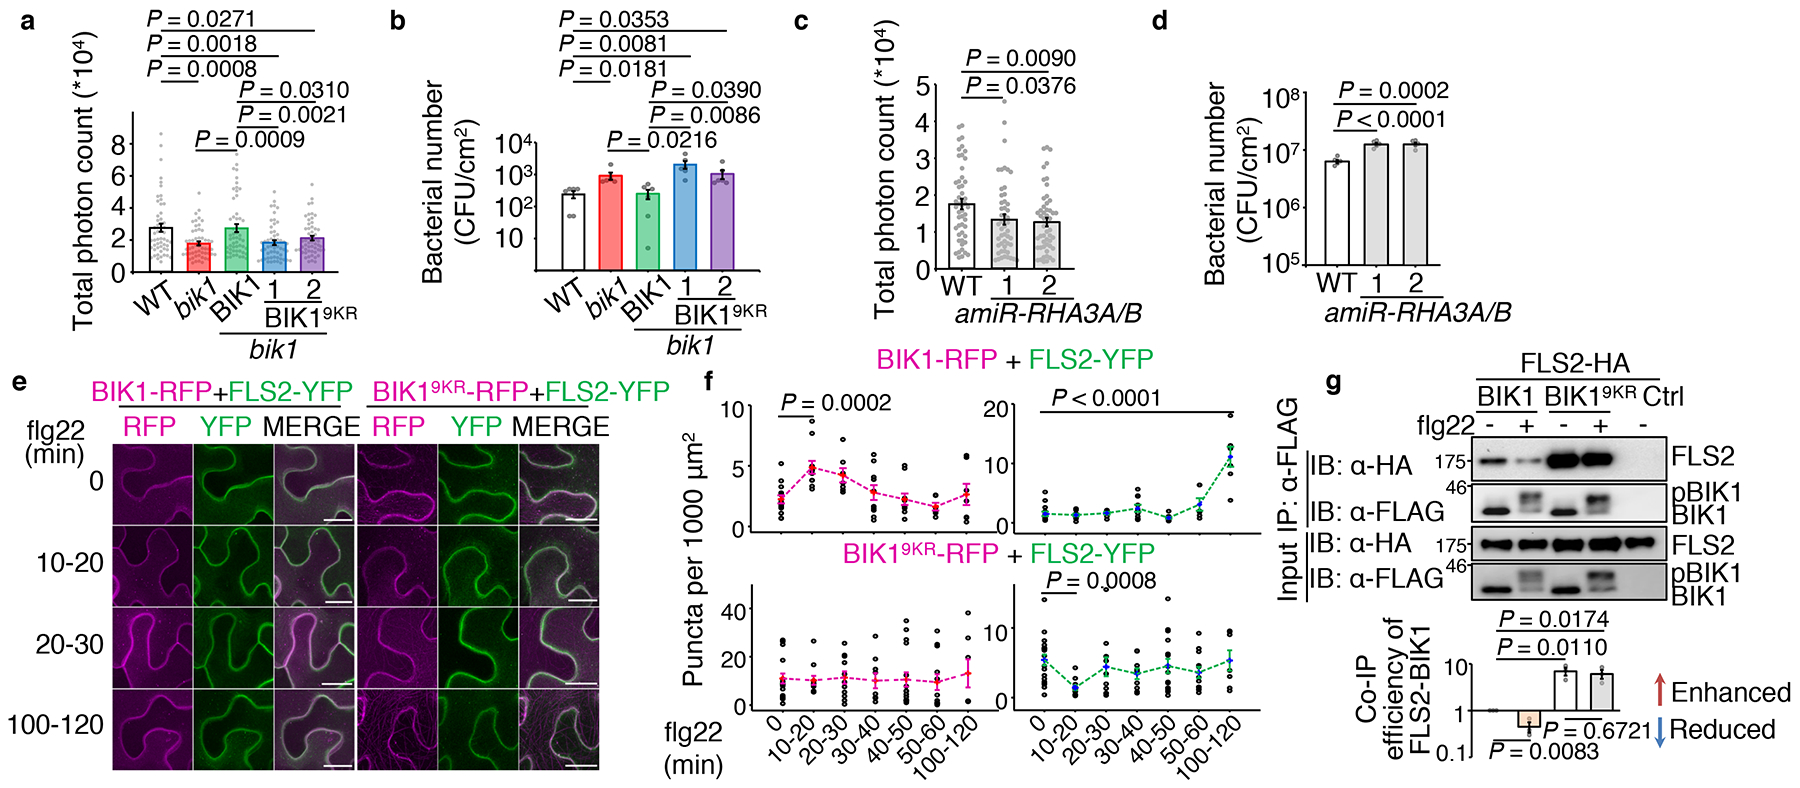
a. The pBIK1::BIK19KR-HA/bik1 transgenic plants (Line 1 & 2) cannot complement bik1 for flg22-induced ROS production. Data are shown as overlay of dot plot and means of total photon count ± SEM (One-way ANOVA, WT, BIK1/bik1: n=53; bik1: n=54; BIK19KR/bik1: n=55). In all panels, data are shown as overlay of dot plot and means ± SEM, lines beneath p values indicate relevant pair-wise comparisons. b. The pBIK1::BIK19KR-HA/bik1 transgenic plants show increased bacterial growth of Pst DC3000 hrcC−. Plants were spray-inoculated and bacterial growth was measured at four days post-inoculation (dpi). One-way ANOVA, n=6. c. The amiRNA-RHA3A/B plants show reduced flg22-induced ROS production. One-way ANOVA, n=51. d. The amiRNA-RHA3A/B plants show increased bacterial growth of Pst DC3000. Plants were hand-inoculated and bacterial growth was measured at two dpi. One-way ANOVA, n=5. e. f. Flg22-induced BIK1, BIK19KR, and FLS2 endocytosis in N. benthamiana leaf epidermal cells. BIK1-TagRFP or BIK19KR-TagRFP was co-expressed with FLS2-YFP followed by 100 μM flg22 treatment and imaged at the indicated time points by a confocal microscopy (e). Scale bars, 20 μm. Quantification of BIK1-TagRFP (magenta) and FLS2-YFP (green) puncta is shown in (f). One-way ANOVA, additional images and n values are shown in Extended Data Fig. 9c. g. BIK19KR does not enable flg22-induced BIK1 dissociation from FLS2. Co-IP was performed using protoplasts expressing FLS2-HA and BIK1-FLAG, or BIK19KR-FLAG, followed by 1 μM flg22 treatment for 15 min (top). BIK1 interaction with FLS2 was quantified as intensity from IP: α-FLAG, IB: α-HA divided by intensity from IP: α-FLAG, IB: α-FLAG (bottom). Data are shown as means ± SEM of fold change (no treatment as 1.0) (One-way ANOVA, n=3). All experiments were repeated three times with similar results.
BIK1 monoubiquitination in endocytosis
Since perception of flg22 moderately increased the BIK1-GFP positive endosomal puncta (Fig. 1c), we tested whether BIK1 monoubiquitination is involved in flg22-triggered BIK1 endocytosis. Apparently, fewer FM4–64-labelled puncta were observed with BIK19KR-GFP than with BIK1-GFP after 10 or 15 min flg22 treatment (Extended Data Fig. 9a, b). In addition, we compared the flg22-triggered endocytosis of BIK1-TagRFP and BIK19KR-TagRFP co-expressing FLS2-YFP in Nicotiana benthamiana. Similar to transgenic plants (Fig. 1c, d), endosomal puncta of BIK1-TagRFP increased at 10–20 min, whereas FLS2-YFP puncta increased only after 60 min flg22 treatment (Fig. 4e, f; Extended Data Fig. 9c). A large portion (~90%) of flg22-induced BIK1-TagRFP puncta did not co-localize with FLS2-YFP puncta (Extended Data Fig. 9d), suggesting that BIK1 and FLS2 are likely not internalized together. This is in line with different ubiquitination characteristics of BIK1 and FLS2 (mono vs. poly, 10 min vs. 1 hr). In contrast to BIK1, BIK19KR-TagRFP was more abundant in puncta before treatment, but the number of puncta did not increase after flg22 treatment (Fig. 4e, f; Extended Data Fig. 9c), indicating that BIK19KR-TagRFP internalization does not respond to PRR activation. In addition, colocalization of BIK19KR-TagRFP with ARA6-YFP, a plant specific Rab GTPase residing on late endosomes20, was significantly reduced when compared to that of BIK1-TagRFP (Extended Data Fig. 9e, f). Notably, flg22-induced FLS2-YFP endocytosis was absent in the presence of BIK19KR-TagRFP (Fig. 4e, f). Altogether, our data support the conclusion that ligand-induced BIK1 monoubiquitination contributes to its internalization from PM. Interestingly, whereas flg22 treatment induced a phosphorylation-dependent BIK1 dissociation from FLS25,6,21, flg22-triggered BIK1 dissociation from FLS2 was largely absent in the case of BIK19KR (Fig. 4g), which is consistent with the data that BIK19KR impaired FLS2 internalization (Fig. 4e, f). In addition, we observed an increased association between BIK19KR and FLS2 without flg22 treatment (Fig. 4g). Treatment with the ubiquitination inhibitor PYR-41 also blocked flg22-induced BIK1 dissociation from FLS2 and enhanced BIK1-FLS2 association (Extended Data Fig. 10a). Our data indicate that ligand-induced BIK1 monoubiquitination plays an important role in BIK1 dissociation from the PM-localized PRR complex, its endocytosis and immune signaling activation (Extended Data Fig. 10b).
Discussion
The BIK1 family RLCKs are central players in plant PRR signaling with many layers of regulation4,22. BIK1 stability is critical to maintain immune homeostasis. Plant U-box proteins PUB25 and PUB26 polyubiquitinate BIK1 and regulate its stability in the steady state23. This module only regulates non-activated BIK1 homeostasis without affecting ligand-activated BIK123. Our study identified a role of RHA3A/B in monoubiquitinating BIK1 and activating PRR signaling, which is distinct from that of PUB25/26. BIK19KR protein levels in transgenic plants and protoplasts are comparable with BIK1 (Extended Data Fig. 10c, d), suggesting that BIK1 monoubiquitination may not regulate its stability. The nature of protein ubiquitination, including monoubiquitination and polyubiquitination, dictates distinct fates of substrates, such as proteasome-mediated protein degradation, nonproteolytic functions of protein kinase activation, and membrane trafficking24. Ligand-induced polyubiquitination of FLS2 by PUB12/13 promotes FLS2 degradation, thereby attenuating immune signaling15,16, whereas ligand-induced monoubiquitination of BIK1 triggers BIK1 dissociation from PRR complexes and intracellular signaling activation. Thus, differential ubiquitination and endocytosis of distinct PRR-RLCK complex components likely serve as cues to fine-tune plant immune responses.
METHODS
Plant materials and growth conditions
Arabidopsis thaliana accession Col-0 (wild type, WT), mutants fls2, bak1–4, bik1, transgenic pBIK1::BIK1-HA in the bik1 background, and pFLS2::FLS2-GFP in the Col-0 background were described previously7,13. p35S::BIK-GFP and p35S::BIK19KR-GFP in the Col-0 background, pBIK1::BIK19KR-HA transgenic plants in the bik1 background, p35S::BIK1-HA, p35S::BIK19KR-HA transgenic plants in the Col-0 background, pBIK1::BIK1-HA in the Col-0 background, pBIK1::BIK1-HA/ pRHA3A::RHA3A-FLAG double transgenic plants in the Col-0 background and pRHA3A::amiR-RHA3A-pRHA3B::amiR-RHA3B transgenic plants in the Col-0 background were generated in this study (see below for details). All arabidopsis plants were grown in soil (Metro Mix 366, Sunshine LP5 or Sunshine LC1, Jolly Gardener C/20 or C/GP) in a growth chamber at 20–23°C, 50% relative humidity and 75 μE m−2s−1 light with a 12-hr light/12-hr dark photoperiod for four weeks before pathogen infection assay, protoplast isolation, and ROS assay. For confocal microscopy imaging, seeds were sterilized, maintained for 2 days at 4°C in the dark, and germinated on vertical half-strength Murashige and Skoog (1/2 MS) medium [1% (wt/vol) sucrose] agar plates, pH 5.8, at 22°C in a 16-hr light/8-hr dark cycle for 5 days with a light intensity of 75 μE m−2 s −1. For FM4–64 staining, whole seedlings were incubated for 15 min in 3 ml of 1/2 MS liquid medium containing 2 μM FM4–64, washed twice by dipping into deionized water before adding the elicitors (flg22, 100 nM). Wild-type tobacco (N. benthamiana) plants were grown under 14 h of light and 10 hr of darkness at 25 °C.
Statistical analyses
Data for quantification analyses are presented as mean ± standard error of mean (SEM). The statistical analyses were performed by Student’s t-test or one-way analysis of variance (ANOVA) test. Number of replicates is shown in the figure legends.
Plasmid construction and generation of transgenic plants
FLS2, BAK1, BIK1, PBL1, PBL10 or BSK1 tagged with HA, FLAG or GFP in a plant gene expression vector pHBT used for protoplast assays, and FLS2CD, BAK1CD, BAK1K, PUB13, BIK1, or BIK1KM fused with GST or MBP used for E. coli fusion protein isolation were described previously5,7. BIK1 point mutations in pHBT vector were generated by site-directed mutagenesis with primers listed in the Supplemental Table 1 (Table S1) using the pHBT-BIK1-HA construct as the template. BIK1N5KR was constructed by sequentially mutating K41, K95, K170 and K186 into arginine on BIK1K31R. BIK1C4KR was constructed by sequentially mutating K337, K358 and K366 on BIK1K286R. pHBT-BIK1N5KR and pHBT-BIK1C4KR were then digested with XbaI and StuI and ligated together to generate pHBT-BIK19KR-HA. BIK19KR was sub-cloned into pHBT-FLAG or pHBT-GFP with BamHI and StuI digestion to generate pHBT-BIK19KR-FLAG or pHBT-BIK19KR-GFP. BIK19KR was sub-cloned into the binary vector pCB302-pBIK1::BIK1-HA or pCB302–35S::BIK1-HA with BamHI and StuI digestion to generate pCB302-pBIK1::BIK19KR-HA, or pCB302–35S::BIK19KR-HA. BIK1-GFP or BIK19KR-GFP was sub-cloned into pCB302 with BamHI and PstI digestion to generate pCB302–35S::BIK1-GFP and pCB302–35S::BIK19KR-GFP. BIK1K204R, or BIK19KR was sub-cloned into a modified GST (pGEX4T-1, Pharmacia) vector with BamHI and StuI digestion to generate pGST-BIK1K204R, and pGST-BIK19KR respectively. BIK1-HA or BIK19KR-HA was further sub-cloned into the pGST vector as following: digestion with PstI, blunting end by T4 DNA polymerase, digestion with BamHI and ligation into a BamHI/StuI digested pGST vector to generate pGST-BIK1-HA and pGST-BIK19KR-HA.
The RHA3A gene (AT2G17450) was cloned by PCR amplification from Col-0 cDNAs with primers containing BamHI at the 5’ end and StuI at the 3’ end, followed by BamHI and StuI digestion and ligation into the pHBT vector with an HA or FLAG tag at the C-terminus. The RHA3B gene (AT4G35480) was cloned similarly as RHA3A using BamHI and SmaI-containing primers. The pHBT-RHA3AI104A was generated by site-directed mutagenesis with primers listed in the Supplemental Table 1. The RHA3ACD (amino acid 50–186) or RHA3ACD/I104A were cloned by PCR amplification from RHA3A or RHA3AI104A with BamHI and StuI-containing primers. RHA3ACD and RHA3ACD/I104A were sub-cloned into pGST or a modified pMBP (pMAL-c2, NEB) vector with BamHI and StuI digestion for E. coli fusion protein isolation. The promoter of RHA3A or RHA3B was PCR-amplified from genomic DNAs of Col-0 with primers containing SacI and BamHI, and ligated into pHBT. The fragment of pRHA3A::RHA3A-FLAG was digested by SacI and EcoRI, and ligated into pCAMBIA2300.
Artificial mircoRNA (amiRNA) constructs were generated as previously described18. In brief, amiRNA candidates were designed according to the website http://wmd3.weigelworld.org/cgi-bin/webapp.cgi. Three candidates were chosen for each gene with RHA3A for amiRNA480: TTTTGTCAATACACTCCACGG; amiRNA211: TCAACGCAGATAAGAGCGCTA; amiRNA109: TCAAGTAATCTTGACGGTCGT, and RHA3B for amiRNA444: TTATGCATATTGCACACTCCG; amiRNA113: TAATCTAGAGGAGCGAGTCAG; amiRNA214: TCTACGCATACGAGAGCGCAT. Primers for cloning amiRNAs were generated according to the wmd3 website (http://wmd3.weigelworld.org/cgi-bin/webapp.cgi). The cognate fragments were cloned into the pHBT-amiRNA-ICE1 vector18. The pCB302-pRHA3A::amiRNA-RHA3A-pRHA3B::amiRNA-RHA3B was constructed as following: the promoter of RHA3A was PCR amplified from pRHA3A::RHA3A-FLAG, digested with SacI and BamHI and ligated with pHBT-amiR-RHA3A to generate pHBT-pRHA3A::amiR-RHA3A. The pRHA3A::amiR-RHA3A fragment was further released by SacI and PstI digestion and ligated into pCB302 vector to generate pCB302-pRHA3A::amiRNA-RHA3A. The pHBT-pRHA3B::amiR-RHA3B was constructed similarly followed by PCR amplification using primer containing SacI sites at both the 5’ and 3’ends, subsequent digestion with SacI and ligation into the pCB302-pRHA3A::amiRNA-RHA3A vector. Tandem pRHA3A/B-amiRNA-RHA3A/B in the same direction was confirmed by digestion and selected for further experiments.
The rha3a/b mutant was generated by the CRISPR/Cas9 system following the published protocol25. Briefly, primers containing guide RNA (gRNA) sequences of RHA3A and RHA3B were used in PCR to insert both gRNA sequences into the pDT1T2 vector. The pDT1T2 vector containing both gRNAs was further PCR amplified, digested with BsaI and ligated into a binary vector pHEE401E. Agrobacterium tumefaciens-mediated floral dip was used to transform the pHEE401E vector into Col-0 plants. Genomic DNAs from hygromycin (25 μg/ml) positive plants were extracted, PCR amplified with gene-specific primers and sequenced by Sanger sequencing.
The monomer ubiquitin of arabidopsis ubiquitin gene 10 (UBQ10, At4g05320) carrying lysine-to-arginine mutations at all the seven lysine residues (UBQK0: 5’-ATGCAGATCTTTGTTAGGACTCTCACCGGAAGGACTATCACCCTCGAGGTGGAAAGCTCTGACACCATCGACAACGTTAGGGCCAGGATCCAGGATAGGGAAGGTATTCCTCCGGATCAGCAGAGGCTTATCTTCGCCGGAAGGCAGTTGGAGGATGGCCGCACGTTGGCGGATTACAATATCCAGAGGGAATCCACCCTCCACTTGGTCCTCAGGCTCCGTGGTGGTTAA-3’) was synthesized and cloned into a pUC57 vector by GenScript USA Incorporation. UBQK0 was then amplified by PCR with primers listed in the Table S1 and further sub-cloned into a modified pHBT vector with BamHI and PstI digestion to generate pHBT-FLAG-UBQK0.
Plasmids used for the transient expression in N. benthamiana were constructed as reported previously26. Briefly, FLS2, BIK1, and BIK19KR were PCR amplified and recombined into a pDONR207-YFP, pDONR207-TagRFP, and pDONR207-GFP vector by In-Fusion® HD Cloning (TaKaRa Bio). The pDONR207 vectors were subsequently transferred to a destination vector pmAEV (derived from binary vector pCAMBIA with a 35S promoter) using the Gateway® LR reaction (Thermo Fisher scientific lnc.).
DNA fragments cloned into the final constructs were confirmed via Sanger sequencing. Agrobacterium tumefaciens-mediated floral dip was used to transform the above binary vectors into bik1 or Col-0 plants. The transgenic plants were selected by Glufosinate-ammonium (Basta, 50 μg/ml) for the pCB302 vector or kanamycin (50 μg/ml) for the pCAMBIA2300 vector. Multiple transgenic lines were analyzed by immunoblot (IB) for protein expression. Two lines with 3:1 segregation ratios for antibiotic resistance in the T3 generation were selected to obtain homozygous seeds for further studies. The amiR-RHA3A/B transgenic plants resistant to Basta in T2 generation were used for assays.
Yeast two-hybrid screen
The cDNA library constructed in a modified pGADT7 vector (Clontech) was previously described15. BIK1G2A from pHBT-BIK1G2A-HA was sub-cloned into a modified pGBKT7 vector with BamHI and StuI digestion. pGBK-BIK1G2A was transformed into the yeast AH109 strain. The resulting yeast transformants were then transformed with the cDNA library and screened in the synthetic defined media (SD) without Trp, Leu, His, Ade (SD-T-L-H-A) and SD-T-L-H containing 1 mM 3-amino-1, 2, 4-triazole (3-AT). The confirmed yeast colonies were subjected to plasmid isolation and sequencing.
Pathogen infection assays
Pseudomonas syringae pv. tomato (Pst) DC3000 was cultured overnight at 28°C in the King’s B medium supplemented with rifamycin (50 μg/ml). Bacteria were collected by centrifugation at 3,000 g, washed and re-suspended to the density of 106 cfu/ml with 10 mM MgCl2. Leaves from four-week-old plants were hand-inoculated with bacterial suspension using a needleless syringe. To measure in planta bacterial growth, five to six sets of two leaf discs of 6 mm in diameter were punched and grounded in 100 μl of ddH2O. Serial dilutions were plated on TSA plates (1% tryptone, 1% sucrose, 0.1% glutamatic acid and 1.8% agar) containing 25 μg/ml rifamycin. Plates were incubated at 28°C and bacterial colony forming units (cfu) were counted 2 days after incubation. For spray inoculation, Pst DC3000 or Pst DC3000 hrcC− bacteria were collected and re-suspended to 5 × 10⁸ cfu/ml with 10 mM MgCl2, silwet L-77 (0.02%) and sprayed onto leaf surface. Plants were covered with a transparent plastic dome to keep humidity after spray. After incubation, the 3rd pair of true leaves was detached, soaked in 70% ethanol for 30 seconds, rinsed in water and bacterial growth was measured similarly as above.
Protoplast transient expression and co-immunoprecipitation (Co-IP) assays
Protoplast isolation and transient expression assay have been described previously27. For protoplast-based Co-IP assay, protoplasts were transfected with a pair of constructs (the empty vectors as controls, 100 μg DNA for 500 μl protoplasts at the density of 2 × 10⁵/ml for each sample) and incubated at room temperature for 6–10 hr. After treatment of flg22 with indicated concentration and time points, protoplasts were collected by centrifugation and lysed in 300 μl Co-IP buffer (150 mM NaCl, 50 mM Tris-HCl, pH7.5, 5 mM EDTA, 0.5% Triton, 1 × protease inhibitor cocktail, before use, adding 2.5 μl 0.4 M DTT, 2 μl 1 M NaF and 2 μl 1 M Na3VO3 for 1 ml IP buffer) by vortexing. After centrifugation at 10,000 g for 10 min at 4°C, 30 μl of supernatant was collected for input controls and 7 μl of α-FLAG-agarose beads were added into the remaining supernatant and incubated at 4 °C for 1.5 hr. Beads were collected and washed three times with washing buffer (150 mM NaCl, 50 mM Tris-HCl, pH7.5, 5 mM EDTA, 0.5% Triton) and once with 50 mM Tris-HCl, pH7.5. Immunoprecipitates were analyzed by IB with indicated antibodies. The amiRNA candidate screens were performed as previously described18.
In vivo ubiquitination assay
FLAG-tagged UBQ (FLAG-UBQ) or a vector control (40 μg DNA) was co-transfected with the target gene with an HA tag (40 μg DNA) into 400 μl protoplasts at the density of 2 × 10⁵/ml for each sample and protoplasts were incubated at room temperature for 6–10 hr. After treatment with 100 nM flg22 at the indicated time points, protoplasts were collected for Co-IP assay in Co-IP buffer containing 1% Triton X-100. PYR-41 (Sigma, Cat # N2915) was added at the indicated concentrations and time points in the figure legends.
Recombinant protein isolation and in vitro kinase assays
Fusion proteins were produced from E. coli BL21 at 16°C using LB medium with 0.25 mM isopropyl β-D-1-thiogalactopyranoside (IPTG). Glutathione S-transferase (GST) fusion proteins were purified with Pierce glutathione agarose (Thermo Scientific), and maltose binding protein (MBP) fusion proteins were purified using amylose resin (New England Biolabs) according to the standard protocol from companies. The in vitro kinase assays were performed with 0.5 μg kinase proteins and 5 μg substrate proteins in 30 μl kinase reaction buffer (10 mM Tris-HCl, pH7.5, 5 mM MgCl2, 2.5 mM EDTA, 50 mM NaCl, 0.5 mM DTT, 50 μM ATP and 1 μCi [γ −32P] ATP). After gentle shaking at room temperature for 2 hr, samples were denatured with 4 × SDS loading buffer and separated by 10% SDS-PAGE gel. Phosphorylation was analyzed by autoradiography.
In vitro ubiquitination assay
Ubiquitination assays were performed as previously described with modifications28. Reactions containing 1 μg of substrates, 1 μg of HIS6-E1 (AtUBA1), 1 μg of HIS6-E2 (AtUBC8), 1 μg of GST-E3, 1 μg of ubiquitin (Boston Biochem, Cat # U-100AT-05M) in the ubiquitination reaction buffer (20 mM Tris-HCl, pH 7.5, 5 mM MgCl2, 0.5 mM DTT, 2 mM ATP) were incubated at 30°C for 3 hr. The ubiquitinated proteins were detected by IB with indicated antibodies. The rabbit monoclonal α-RHA3A antibody was generated according to company’s standard protocol against the peptide: AGGDSPSPNKGLKKC (GenScript, USA).
In vitro deubiquitination assay
Mouse Usp2-cc was cloned by PCR amplification from mouse cDNAs with primers containing BamHI at the 5’ end and SmaI at the 3’ end, followed by BamHI and SmaI digestion and ligation into the pGST vector to construct pGST-Usp2-cc. GST-Usp2-cc fusion proteins were produced in E. coli BL21, and purified with Pierce glutathione agarose (Thermo Scientific) according to the standard protocol from company. Deubiquitination (DUB) assays were performed as previously described with modifications29. Briefly, an in vitro ubiquitination assay was performed overnight at 28°C as described above. The reaction was aliquoted into individual tubes containing Usp2-cc or heat-inactivated (HI) (95°C for 5 min) Usp2-cc as a control in the DUB reaction buffer (50 mM Tris-HCl, pH 7.5, 50 mM NaCl and 5 mM DTT) and incubated at 28°C for 5 hr. Samples were then denatured and analyzed by immunoblotting.
For in vitro DUB assay with flg22-induced ubiquitinated BIK1, BIK1-HA and FLAG-UBQ were expressed in arabidopsis protoplasts treated with 100 nM flg22 for 30 min. The ubiquitinated BIK1-HA proteins were immunoprecipitated as described above. After washing with 50 mM Tris-HCl, agarose beads were washed once with DUB dilution buffer (25 mM Tris-HCl, pH 7.5, 150 mM NaCl and 10 mM DTT) and mixed with GST-Usp2-cc in DUB reaction buffer. After overnight incubation, beads were denatured in SDS buffer and analyzed by immunoblotting.
MAPK assay
Five eleven-day-old arabidopsis seedlings per treatment grown on vertical plates with 1/2 MS medium were transferred into water for overnight before flg22 treatment. Seedlings were collected, drilled and lysed in 100 μl Co-IP buffer. Protein samples with 1 × SDS buffer were separated in 10% SDS-PAGE gel to detect pMPK3, pMPK6 and pMPK4 by IB with α-pERK1/2 antibody (Cell Signaling, Cat# 9101).
Detection of ROS production
The 3rd or 4th pair of true leaves from 4- to 5-week-old soil-grown arabidopsis plants were punched into leaf discs with the diameter of 5 mm. Leaf discs were incubated in 100 μl of ddH2O with gentle shaking overnight. Water was replaced with 100 μl of reaction solution containing 50 μM luminol, 10 μg/ml horseradish peroxidase (Sigma-Aldrich) supplemented with or without 100 nM flg22. Luminescence was measured with a luminometer (GloMax®-Multi Detection System, Promega) with a setting of 1 min as the interval for a period of 40–60 min. Detected values of ROS production were indicated as means of Relative Light Units (RLU).
In vitro GST pull-down assay
GST or GST-BIK1 agarose beads were obtained after elution and washed with 1 × PBS (137 mM NaCl, 2.7 mM KCl, 15 mM Na2HPO4, 4.4 mM KH2PO4) for three times. HA tagged MBP-RHA3ACD or MBP proteins (2 μg) were pre-incubated with 10 μl of prewashed glutathione agarose beads in 300 μl pull-down incubation buffer (20 mM Tris-HCl, pH 7.5, 100 mM NaCl, 0.1 mM EDTA, and 0.2% Triton X-100) for 30 min at 4°C. 5 μl of GST or GST-BIK1 agarose beads were pre-incubated with 20 μg of Bovin Serum Albumin (BSA, Sigma, Cat # A7906) in 300 μl incubation buffer for 30 min at 4°C with gentle shaking. The supernatant containing MBP-RHA3ACD or MBP was incubated with pre-incubated GST or GST-BIK1 agarose beads for 1 hr at 4°C with gentle shaking. The agarose beads were precipitated and washed three times in pull-down wash buffer (20 mM Tris-HCl, pH 7.5, 300 mM NaCl, 0.1 mM EDTA, and 0.5% Triton X-100). The pulled-down proteins were analyzed by IB with an α-MBP antibody (Biolegend, Cat # 906901).
Mass spectrometry analysis of ubiquitination sites
The in vitro ubiquitination reactions with GST-RHA3ACD and GST-BIK1 or GST-BIK1K204R were performed as mentioned above with overnight incubation. Reactions were loaded on an SDS-PAGE gel (7.5%) and ran for a relatively short time untill the ubiquitinated bands can be separated from the original GST-BIK1 (GST-BIK1 band ran less than 0.5 cm from the separating gel). Ubiquitinated bands were sliced, trypsin digested before LC-MS/MS analysis on an LTQ-Orbitrap hybrid mass spectrometer (Thermo Fisher) as previously described30. The MS/MS spectra were analyzed with SEQUEST software, and images were exported from SEQUEST.
In vivo BIK1 ubiquitination sites were identified as following: 20 ml of WT arabidopsis protoplasts with a concentration of 2 ×10⁵ per ml were transfected with BIK1-GFP and FLAG-UBQ and the protoplasts were treated with 200nM flg22 for 30 min after 7 hr incubation. GFP-trap-Agarose beads (Chromotek, Cat # gta-20) were incubated with cell lysates in the ratio of 10 μl beads per 4 ×10⁵ cells for 1 hr at 4°C and beads were pooled from 10 tubes, washed using IP buffer for 3 times, and denatured in SDS buffer. Samples were separated by 10% SDS-PAGE and stained with GelCode Blue Stain Reagent (Thermo Fisher Cat # 24590). Ubiquitinated bands were sliced and analyzed as mentioned above.
Confocal microscopy and image analysis
For the laser scanning confocal microscopy, images were taken using a Leica SP8X inverted confocal microscope equipped with a HC PL APO CS2 40×/1.10 and 63×/1.20 water-corrected objective. The excitation wavelength was 488 nm for both GFP, and FM4–64 (ThermoFisher T13320), 514 nm for YFP and 555 nm for TagRFP by using the white light laser. Emission was detected at 500–530 nm for GFP, 570–670 nm for FM4–64, 519–549 nm for YFP, and 569–635 nm for TagRFP by using Leica hybrid detectors. Autofluorescence was removed by adjusting the time gate window between 0.8 and 6 ns. Intensities were manipulated with the ImageJ software.
For spinning disc confocal microscopy (SDCM), image series were captured using a custom Olympus IX-71 inverted microscope (Center Valley, PA) equipped with a Yokogawa CSU-X1 5000 rpm spinning disc unit (Tokyo, Japan) and 60x-silicon oil objective (Olympus UPlanSApo 60x/1.30 Sil) as previously described11. For the custom SDCM system, GFP and FM4–64 were excited with a 488-nm diode laser and fluorescence was collected through a series of Semrock Brightline 488-nm single-edge dichroic beamsplitter and bandpass filters: 500–550 nm for GFP, and 590–625 nm for FM4–64. Camera exposure time was set to 150 msec. For each image series, 67 consecutive images at a z-step interval of 0.3 μm (20 μm total depth) were captured using Andor iQ2 software (Belfast, United Kingdom). Images captured by custom SDCM were processed with the Fiji distribution of ImageJ 1.51 (https://fiji.sc/) software, and BIK1-GFP and FLS2-GFP endosomal puncta were quantified as number of puncta per 1000 μm2 as previously described11,31, with the exception that puncta were detected within a size distribution of 0.1–2.5 μm2. For colocalization of BIK1-GFP with FM4–64 by custom SDCM, cotyledons were stained with 2.5 μM FM4–64 for 10 min, washed twice, and imaged after a 5-min chase.
For quantification of flg22-induced BIK1-GFP and BIK19KR-GFP-containing endosomal puncta over time, the maximum number of FM4–64 labeled spots per image area was set to 100%, and the percentage of GFP-colocalizing spots per time interval relative to the maximum was calculated; 20–25 images per time interval, captured from 5 individual plants per genotype were used for quantification.
For transient expression in N. benthamiana, Agrobacterium strain C58 carrying the constructs of interest was co-infiltrated in the abaxial side of tobacco leaves as described previously32. 48–72 hr after infiltration, multiple infiltrated leaves were infiltrated with 100 μM flg22 and imaged at the indicated time points. The number of puncta per 1000 μm2 was quantified as previously described11,31. The percentage of BIK1 and FLS2 colocalization was calculated by dividing the number of BIK1-FLS2 colocalizing puncta by the total number of BIK1 puncta. The BIK1-ARA6 percentage of colocalization was calculated by dividing the number of BIK1-ARA6 or BIK19KR-ARA6 colocalizing puncta by the total number of ARA6 puncta.
qRT-PCR analysis
Total RNA was isolated from leaves of four-week-old plants with TRIzol reagent (Invitrogen). One μg of total RNA was treated with RNase-free DNase I (New England Biolabs) followed by complementary DNA (cDNA) synthesis with M-MuLV reverse transcriptase (New England Biolabs) and oligo(dT) primer. qRT-PCR analysis was performed using iTaq SYBR green Supermix (Bio-Rad) with primers listed in Supplemental Table 1 in a Bio-Rad CFX384 Real-Time PCR System. The expression of RHA3A and RHA3B was normalized to the expression of ACTIN2.
Data availability
The data supporting the findings of this study are available within the paper and its Supplementary Information files. Source Data (gels and graphs) for Figs. 1–4 and Extended Data Figs. 1–10 are provided with the paper.
Extended Data
Extended Data Figure 1. BIK1-GFP is functional in plants and undergoes endocytosis.
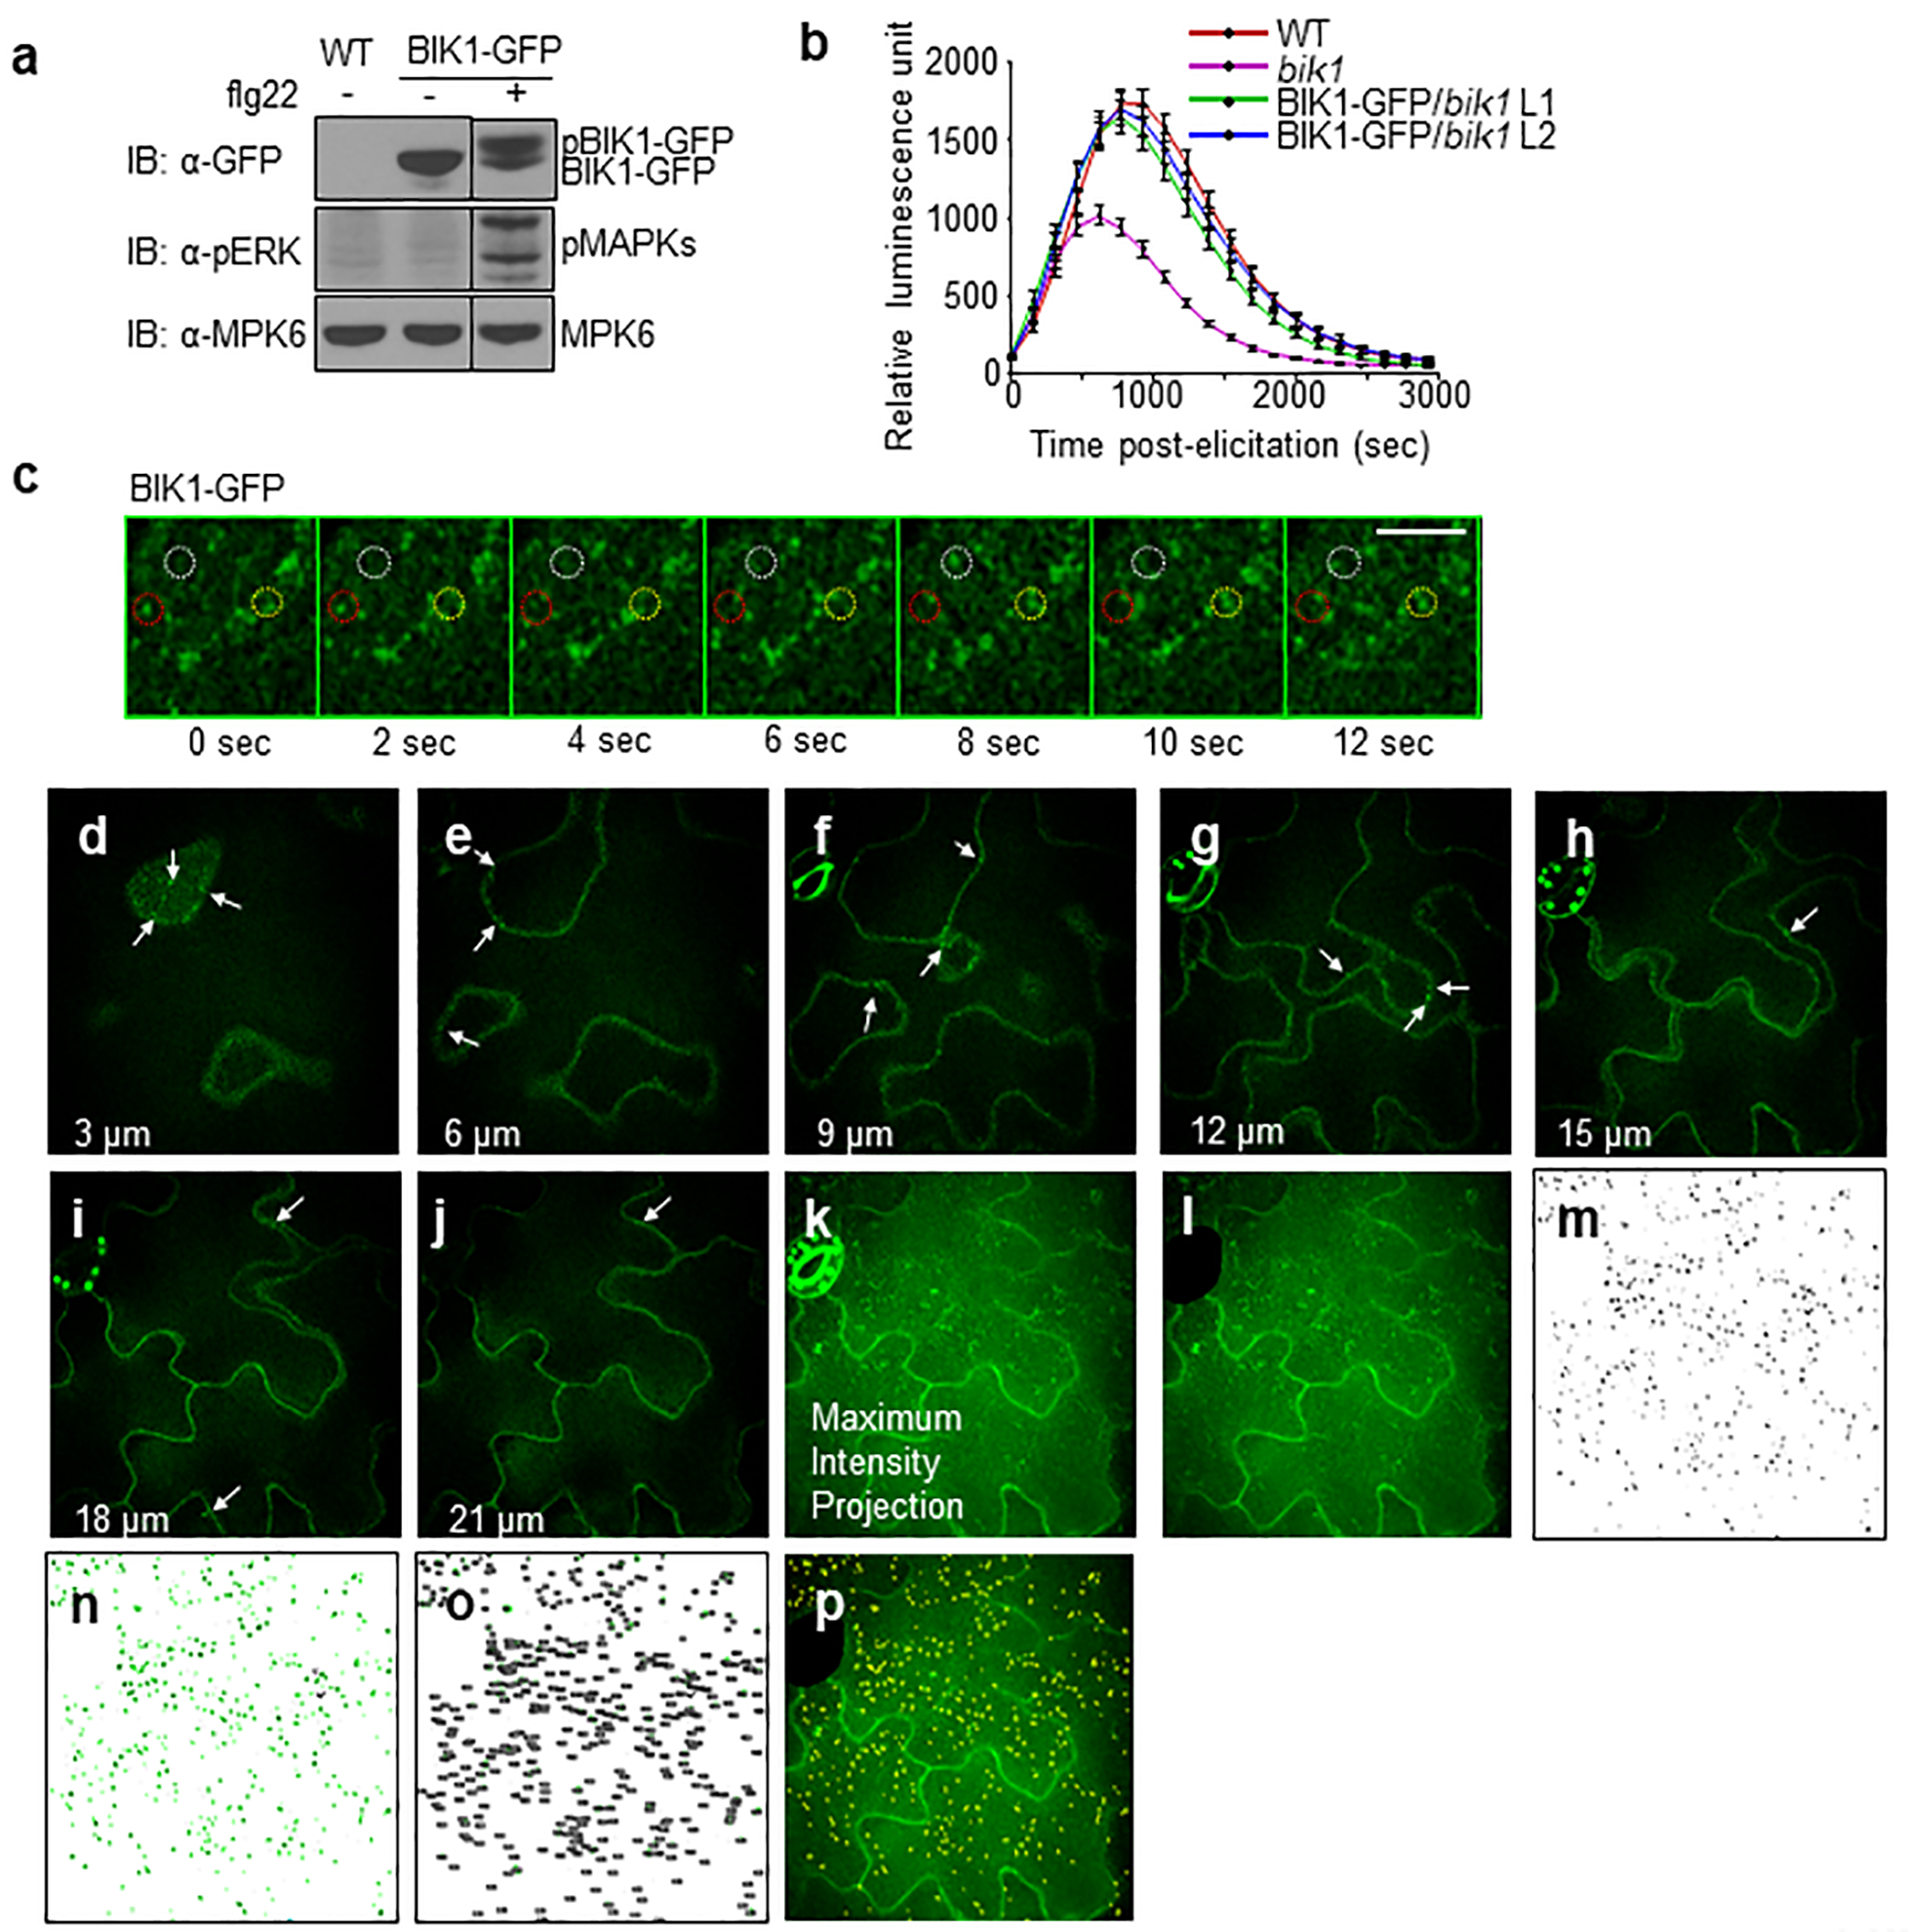
a. BIK1-GFP is functional as confirmed by BIK1 phosphorylation in 35S::BIK1-GFP expressing Col-0 cotyledons after 1 μM flg22 treatment. MPK6 is a loading control and the black stippled line indicates discontinuous segments from the same gel. b. BIK1-GFP restored ROS production in bik1 upon flg22 treatment. Leaf discs from WT, bik1 and BIK1-GFP complementation (Line 1 and 2) were treated with 100 nM flg22 for ROS measurement using a luminometer over 50 min. Data are shown as means ± SEM (WT, bik1: n = 42; BIK1-GFP/bik1 n =45). c. Time-lapse SDCM shows that BIK1-GFP endosomal puncta are highly mobile with puncta that disappear (red circle), appear (yellow circle), and rapidly move in and out of the plane of view (white circle). Scale bar, 5 μm. d-k. BIK1-GFP localizes to endosomal puncta and PM in cross-sectional images of epidermal cells. The abaxial epidermal cells of cotyledons expressing BIK1-GFP were imaged with SDCM with a Z-step of 0.3 μm. A subset of the cross-sectional images is shown at the indicated depth (3, 6, 9, 12, 15, 18 and 21 μm) along with the maximum-intensity projection of all 67 images through epidermis. BIK1-GFP localizes to both PM and endosomal puncta (white arrows) within all sections. k-p. Quantification method for BIK1-GFP puncta within maximum-intensity projections of SDCM images. k. Maximum-intensity projections (MIP) were generated using Fiji distribution of ImageJ 1.51 (https://fiji.sc/) for each Z-series captured by SDCM imaging of BIK1-GFP cotyledons. l. Regions of MIP with non-pavement cells (e.g. stomata) are removed from the image using the Line Draw and Crop functions. The total surface area (μm2) of the image is measured using the Analyze Measure function. m. Puncta within the cropped MIP are recognized using a customized model generated and applied with the Trainable Weka Segmentation plug-in for Fiji. The same model is applied to all images to generate binary images showing the physical location of each BIK1-GFP puncta (black). n-o. Puncta within the size range of 0.1–2.5 μm2 are highlighted in green (n) and counted (o) using the Analyze Particles function in Fiji. BIK1-GFP endocytosis is quantified as the number of puncta per 1000 μm2. p. An overlay of the BIK1-GFP puncta (yellow highlight) over the cropped MIP confirms correct identification of puncta. The experiments in a-c were repeated three times with similar results.
Extended Data Figure 2. MAMP-triggered BIK1 family RLCK monoubiquitination.
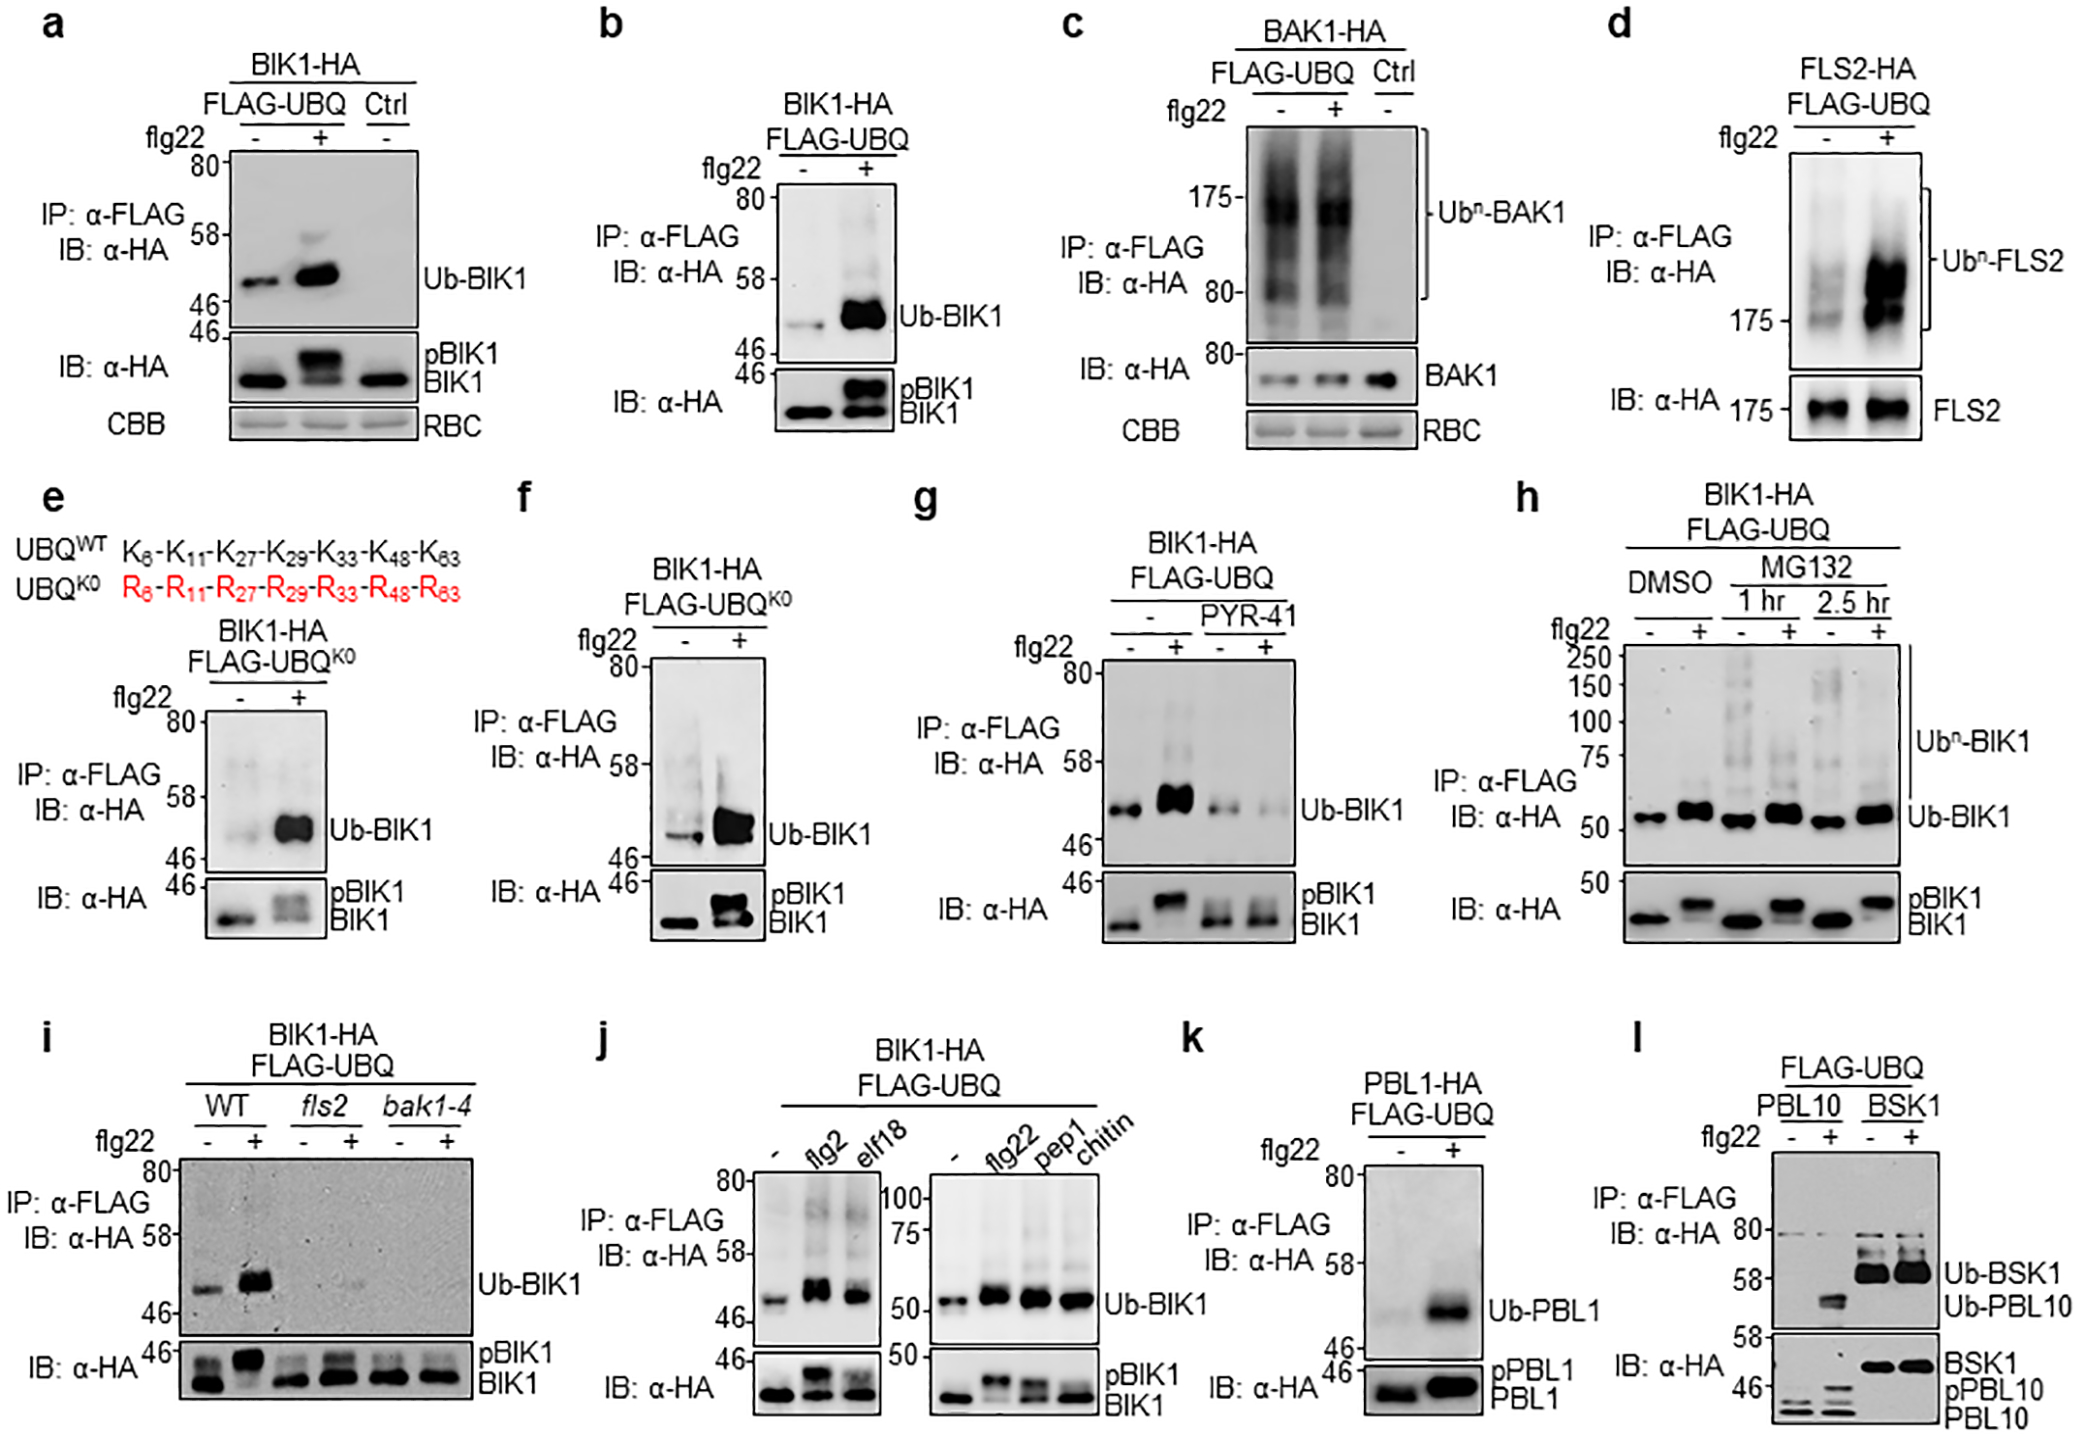
a. Flg22 induces monoubiquitination of BIK1. Protoplasts from WT plants were transfected with BIK1-HA and FLAG-UBQ or a vector (Ctrl), and followed by treatment with 100 nM flg22 for 30 min. After IP with α-FLAG, ubiquitinated BIK1 was detected by IB using α-HA antibody (top). The middle panel shows BIK1-HA proteins and the bottom shows Coomassie Brilliant Blue (CBB) staining for RuBisCO (RBC). b. Flg22 induces BIK1 monoubiquitination in pBIK1::BIK1-HA transgenic plants. Protoplasts from pBIK1::BIK1-HA/bik1 transgenic plants were transfected with FLAG-UBQ and followed by 100 nM flg22 treatment for 30 min. After IP with α-FLAG agarose, ubiquitinated BIK1 was detected by IB with α-HA antibody (top). The bottom panel shows BIK1-HA proteins. c. BAK1 is constitutively polyubiquitinated in vivo. Protoplasts from WT plants were transfected with BAK1-HA and FLAG-UBQ or control, and followed by 100 nM flg22 treatment for 30 min. IP was carried out with α-FLAG agarose (IP: α-FLAG). Ubiquitinated BAK1 (Ub-BAK1) proteins were detected as a smear with α-HA IB (IB: α-HA) (Top). The middle panel shows BAK1-HA proteins and the bottom is CBB staining for RBC. d. Flg22 induces FLS2 polyubiquitination. Protoplasts from WT plants were transfected with FLS2-HA and FLAG-UBQ and followed by 100 nM flg22 treatment for 30 min. e, f. Monoubiquitination of BIK1 with UBQK0. Protoplasts from pBIK1::BIK1-HA (e) or 35S::BIK1-HA (f) transgenic plants were transfected with FLAG-UBQK0 (all lysine residues mutated to arginine) and followed by 100 nM flg22 treatment for 30 min. The mutations of lysine-to-arginine in UBQK0 are shown on top with amino-acid positions labeled (e). g. PYR-41 blocks flg22-induced BIK1 monoubiquitination. PYR-41 (50 μM) was added 30 min prior to flg22 treatment. h. Flg22 induces BIK1 monoubiquitination in the presence of MG132. MG132 (2 μM) was added 1 hr or 2.5 hr before adding flg22. i. Flg22-induced BIK1 monoubiquitination depends on FLS2 and BAK1. Protoplasts isolated from WT, fls2 and bak1–4 plants were transfected with BIK1-HA and FLAG-UBQ, and followed by treatment with 100 nM flg22 for 30 min. j. Elf18, pep1 and chitin induce BIK1 monoubiquitination. 1 μM elf18, 200 nM pep1 or 100 μg/ml chitin was added for 30 min. k. BIK1 homolog PBL1 is monoubiquitinated upon flg22 treatment. PBL1-HA and FLAG-UBQ were expressed in protoplasts. l. Flg22 induces monoubiquitination of BIK1 family RLCK PBL10, but not BSK1. HA-tagged PBL10 or BSK1 was expressed with FLAG-UBQ in WT protoplasts. The experiments were repeated at least three times with similar results.
Extended Data Figure 3. Plasma membrane localization and phosphorylation are required for BIK1 ubiquitination.
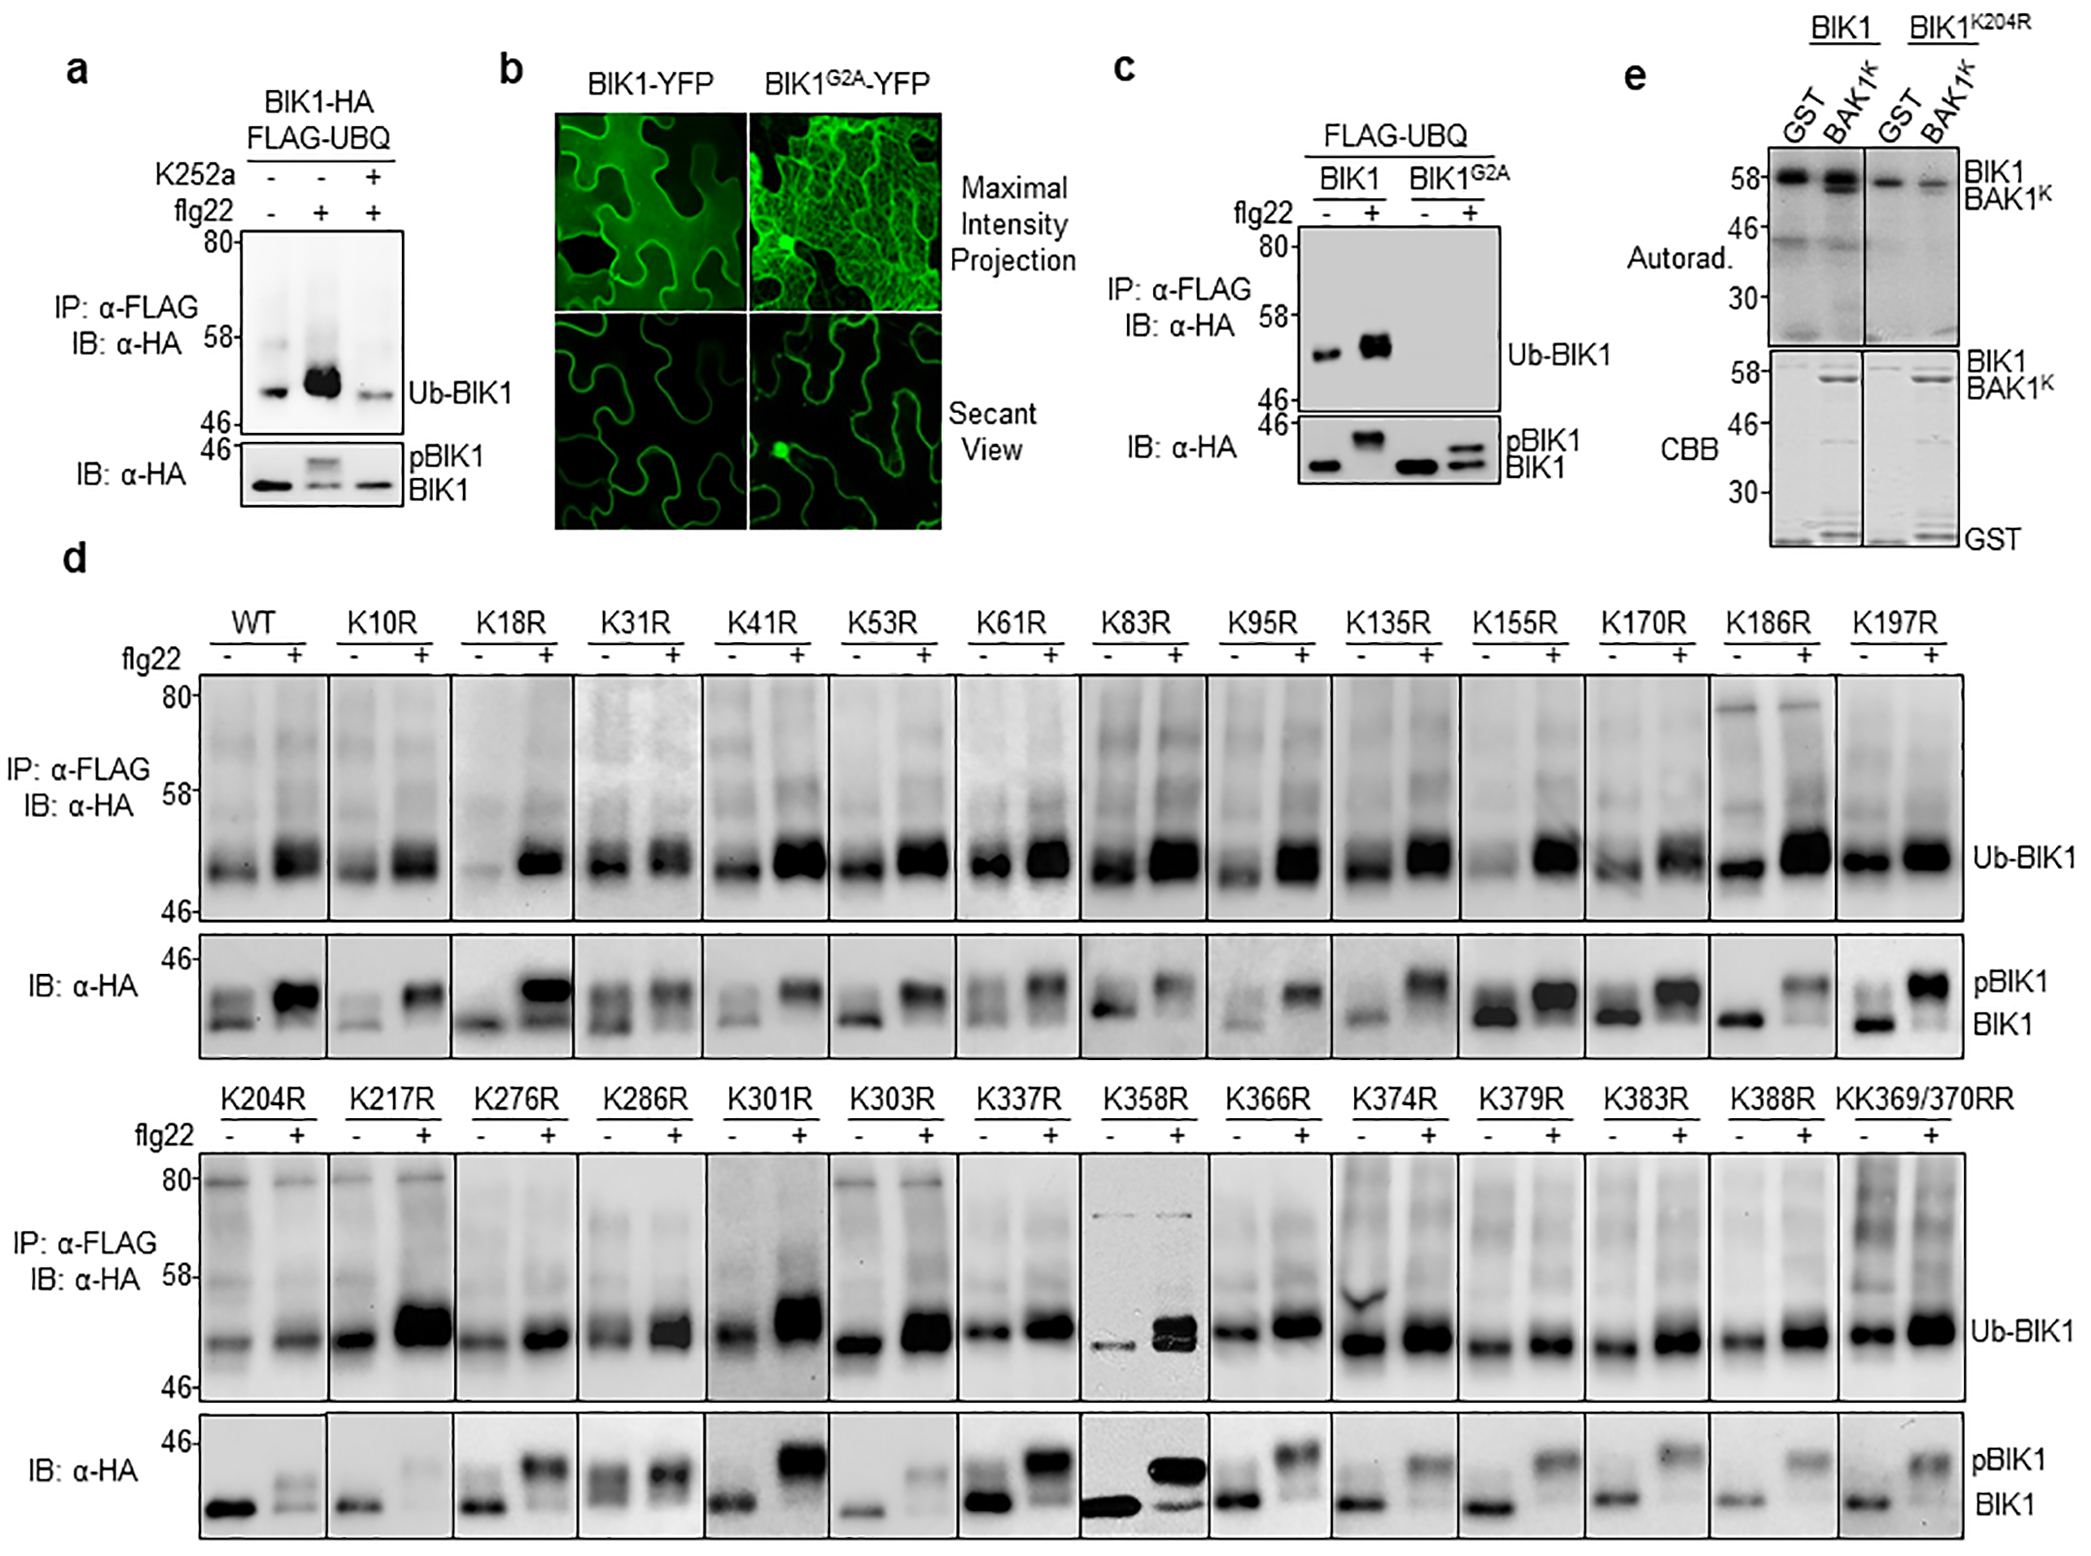
a. The kinase inhibitor K252a blocks flg22-induced BIK1 ubiquitination. Protoplasts transfected with FLAG-UBQ and BIK1-HA were treated with 1 μM K252a for 30 min prior to 100 nM flg22 treatment. b. BIK1G2A no longer localizes to PM. BIK1-YFP or BIK1G2A-YFP was expressed in N. benthamiana for imaging analysis. c. BIK1G2A compromises flg22-induced monoubiquitination. BIK1-HA or BIK1G2A-HA was co-expressed with FLAG-UBQ in protoplasts. d. Single K-to-R mutations of BIK1 fail to block flg22-induced ubiquitination without altering kinase activity. HA-tagged BIK1 WT or mutants was co-expressed with FLAG-UBQ in protoplasts. e. BIK1K204R exhibits reduced autophosphorylation and phosphorylation activity on BAK1. An in vitro kinase assay was performed using GST-BIK1 or GST-BIK1K204R as a kinase and GST or GST-BAK1K (BAK1 kinase domain without detectable autophosphorylation activity) as a substrate with [γ−32P] ATP. Proteins were separated with SDS-PAGE and analyzed by autoradiography (Autorad.) (top). Protein loading is shown by CBB staining (bottom). The experiments were repeated at least twice with similar results.
Extended Data Figure 4. RHA3A/B interacts with BIK1 in vivo.
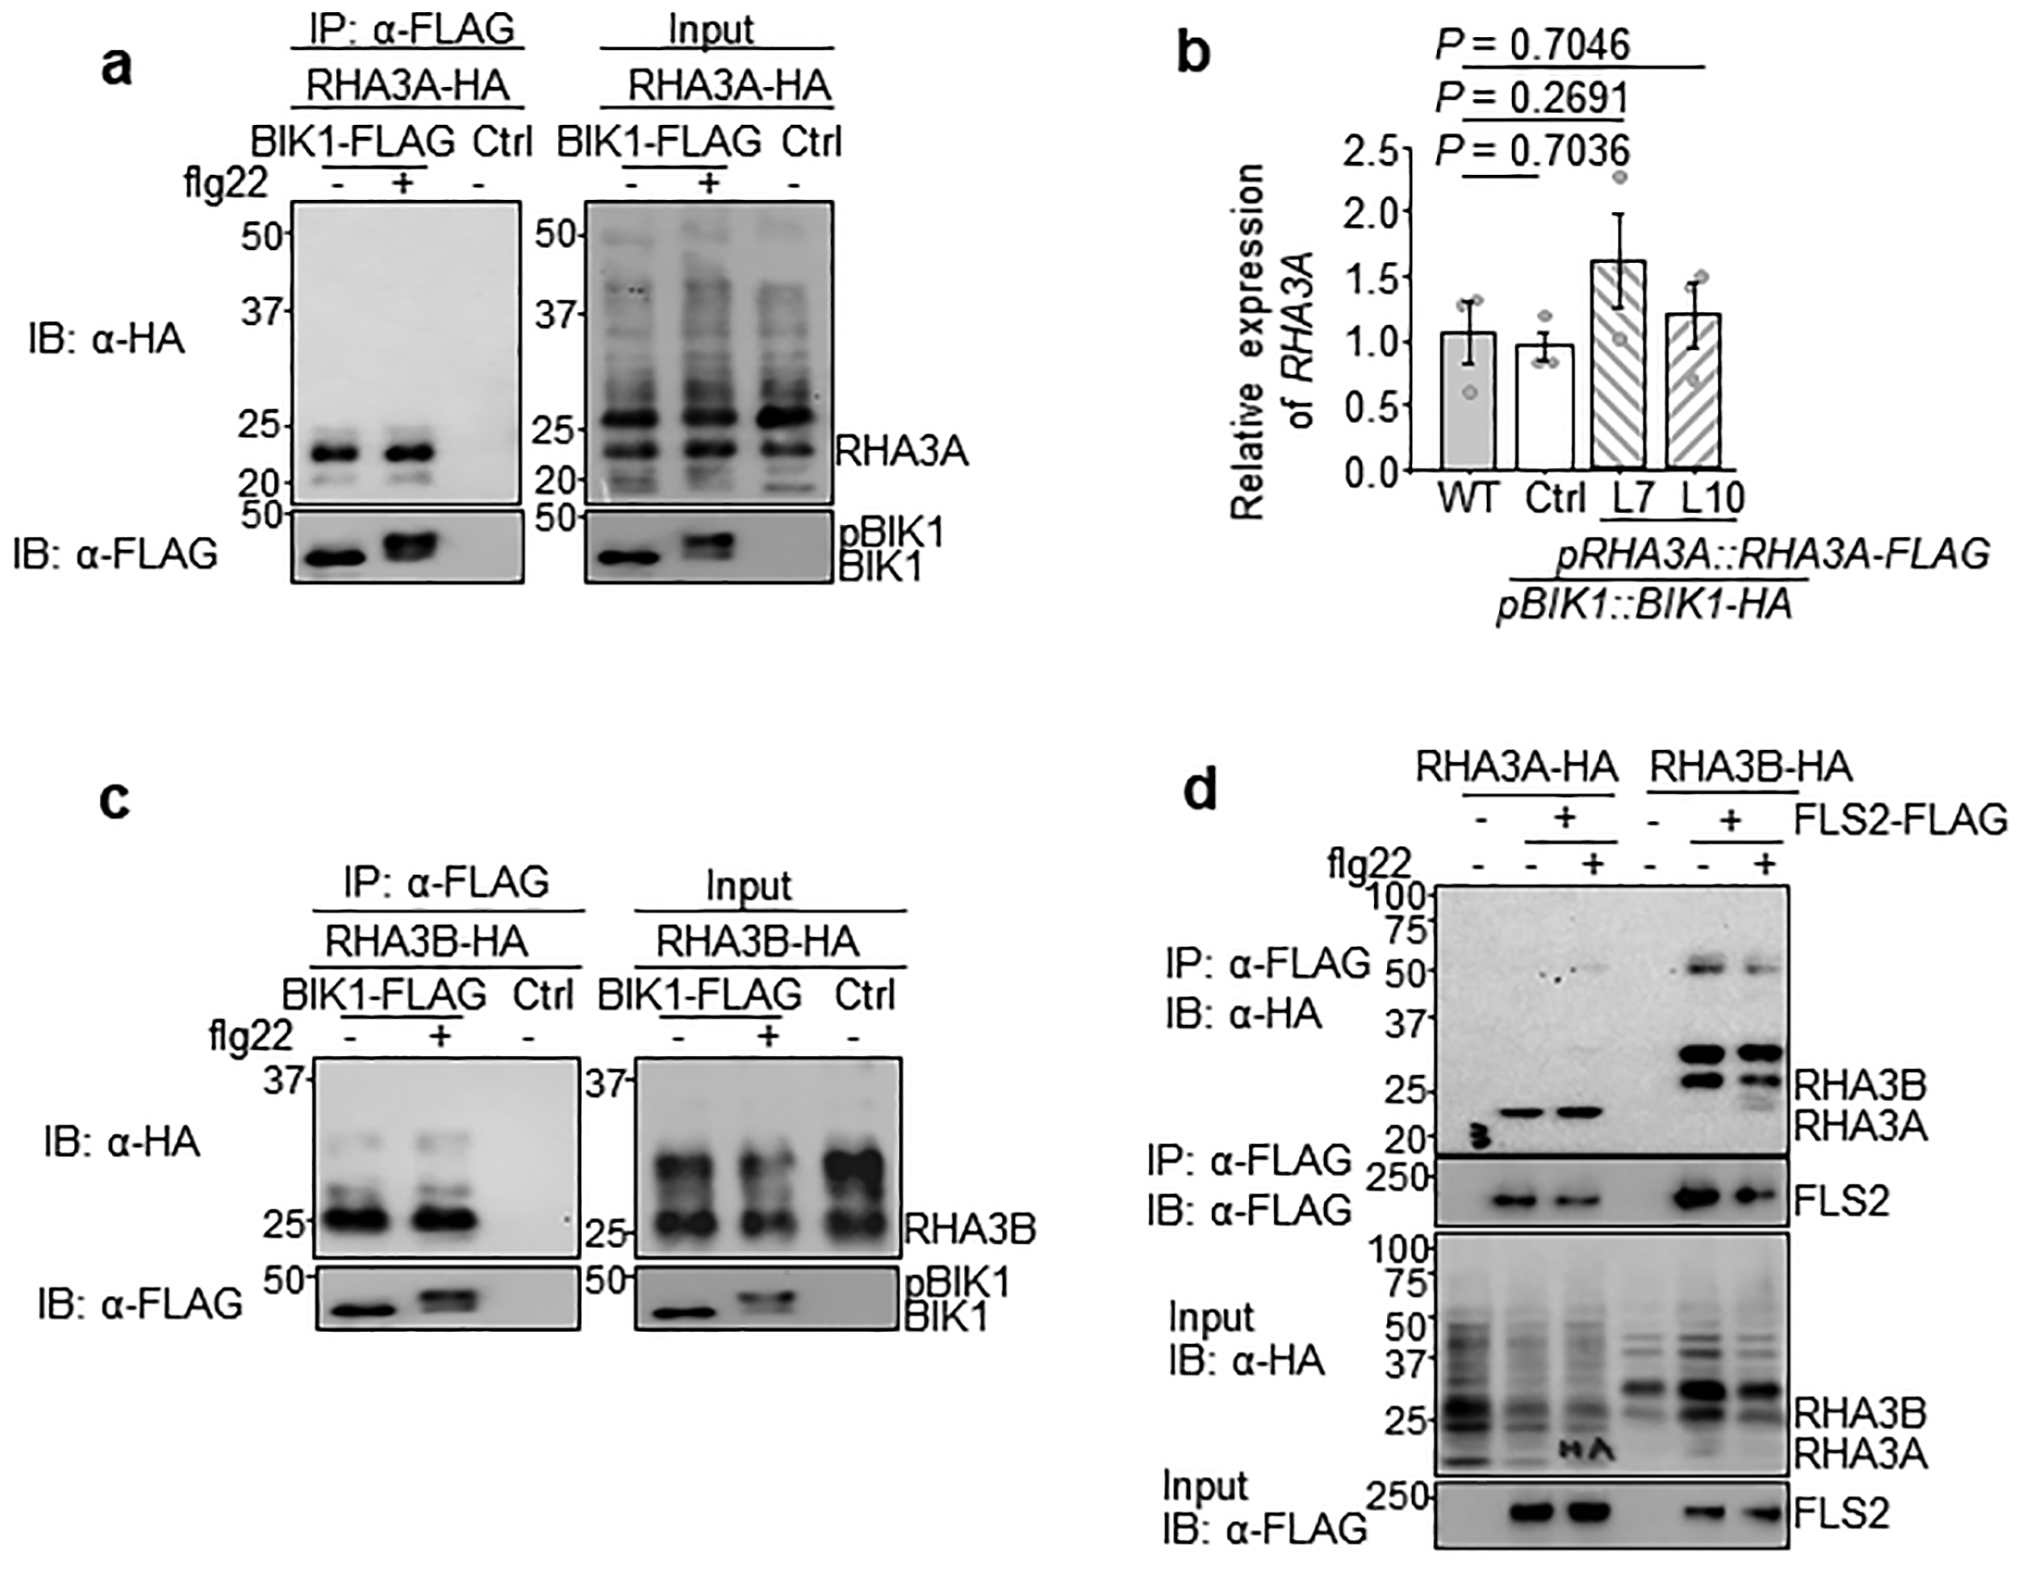
a. BIK1 interacts with RHA3A in a Co-IP assay. RHA3A-HA was co-expressed with BIK1-FLAG or Ctrl in protoplasts followed by 100 nM flg22 treatment for 15 min. The Co-IP assay was carried out with α-FLAG agarose and immunoprecipitated proteins were immunoblotted with α-HA or α-FLAG antibody (left). The right panels show BIK1-FLAG and RHA3A-HA proteins. b. RHA3A expression in pRHA3A::RHA3A-FLAG/pBIK1::BIK1-HA transgenic plants. qRT-PCR was carried out to detect RHA3A transcripts using ACTIN2 as a control. The relative gene expression from WT (set as 1), pBIK1::BIK1-HA (Ctrl) and two independent transgenic lines (line 7 and 10) is shown. Data are shown as means ± SEM (One-way ANOVA, n=3). c. BIK1 associates with RHA3B independent of flg22 treatment. RHA3B-HA was co-expressed with BIK1-FLAG or Ctrl in protoplasts followed by 100 nM flg22 treatment for 15 min. Co-IP assay was carried out with α-FLAG agarose and immunoprecipitated proteins were immunoblotted with α-HA or α-FLAG antibody (left). Right panels show BIK1-FLAG and RHA3B-HA proteins before IP. d. FLS2 interacts with RHA3A and RHA3B in a Co-IP assay. The experiments were repeated three times with similar results.
Extended Data Figure 5. RHA3A/B ubiquitinate BIK1 in vivo.
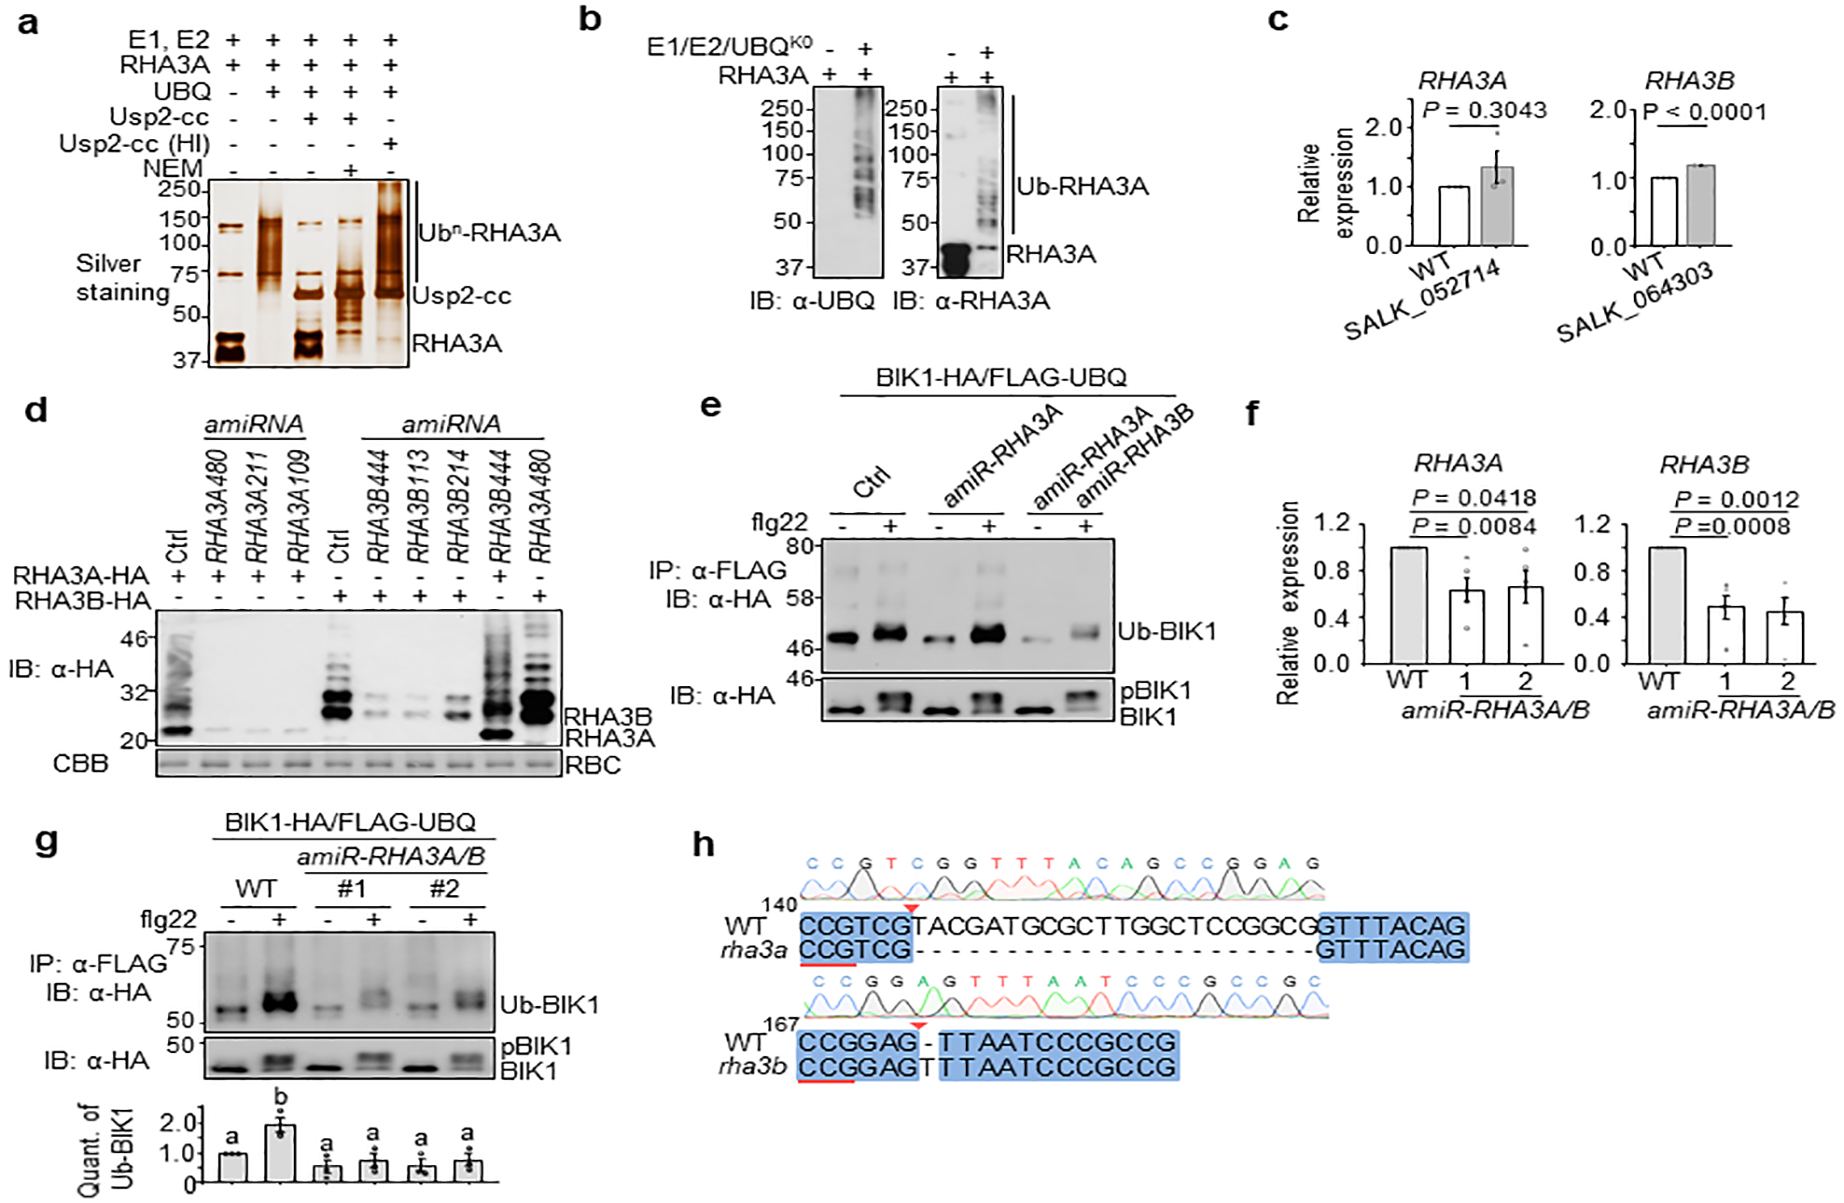
a. GST-RHA3ACD possesses E3 ligase activity in vitro. The in vitro ubiquitination assay was performed with GST-RHA3ACD followed by deubiquitination reactions with GST-Usp2-cc. N-Ethylmaleimide (NEM) (10 mM), an inhibitor of deubiquitinases, and heat-inactivated (HI, 95°C for 5 min) Usp2-cc are controls. Samples were analyzed by SDS-PAGE and silver staining. b. GST-RHA3ACD possesses multi-monoubiquitination activity in vitro. Ubiquitination assay was done similarly as (a) except using the ubiquitin mutant with all lysine residues mutated to arginine (UBQK0). Ubiquitinated proteins were detected by IB with α-UBQ (left) or α-RHA3A (right) antibody. c. RHA3 expression in T-DNA insertion mutants. RHA3A expression in T-DNA knockout line SALK_052714 and RHA3B expression in SALK_064303 were analyzed as in Extended Data Fig. 4b. Data are shown as means ± SEM of fold change (WT as 1.0) (Two-tailed Student’s t-test, n=3). d. Screen for the optimal amiR-RHA3A and amiR-RHA3B. Protoplasts were transfected with RHA3A-HA or RHA3B-HA with Ctrl, amiR-RHA3A or amiR-RHA3B. RHA3A or RHA3B proteins were examined by IB with α-HA antibody. e. RHA3A and RHA3B are required for BIK1 ubiquitination in vivo. BIK1 ubiquitination assay was carried out by co-expressing Ctrl, artificial microRNA targeting RHA3A (amiR-RHA3A) or together with microRNA targeting RHA3B (amiR-RHA3A amiR-RHA3B). f. RHA3A and RHA3B expression in amiR-RHA3A/B transgenic plants. qRT-PCR was carried out to detect RHA3A and RHA3B transcripts with ACTIN2 as a control. Fold changes of the gene expression from two independent transgenic lines (line 1 & 2) are shown. Data are shown as means ± SEM (One-way ANOVA, n=5). g. RHA3A and RHA3B are required for BIK1 ubiquitination in transgenic plants. Protoplasts from amiR-RHA3A/B transgenic plants were transfected with BIK1-HA and FLAG-UBQ for ubiquitination assay. Quantification of BIK1 ubiquitination in amiR-RHA3A/B transgenic plants is shown on bottom. Intensity of Ub-BIK1 or BIK1 bands was quantified with Image Lab (Bio-Rad). The amount of BIK1 ubiquitination is the relative intensity of Ub-BIK1 band to BIK1 band (no treatment in WT as 1.0). Data are shown as means ± SEM. Different letters indicate significant difference with others (P < 0.05, One-way ANOVA, n=3). h. Sequencing analysis of RHA3A and RHA3B genes in the CRISPR/Cas9 rha3a/b mutant. PCR fragments corresponding to RHA3A and RHA3B in rha3a/b were amplified, sequenced, and aligned to WT coding sequences. Reverse-complement of the PAM sequence is underlined with red, and arrow indicates the theoretical Cas9 cleavage sites. The experiments were repeated three times with similar results.
Extended Data Figure 6. BIK1 in vitro ubiquitination sites identified by mass spectrometry.
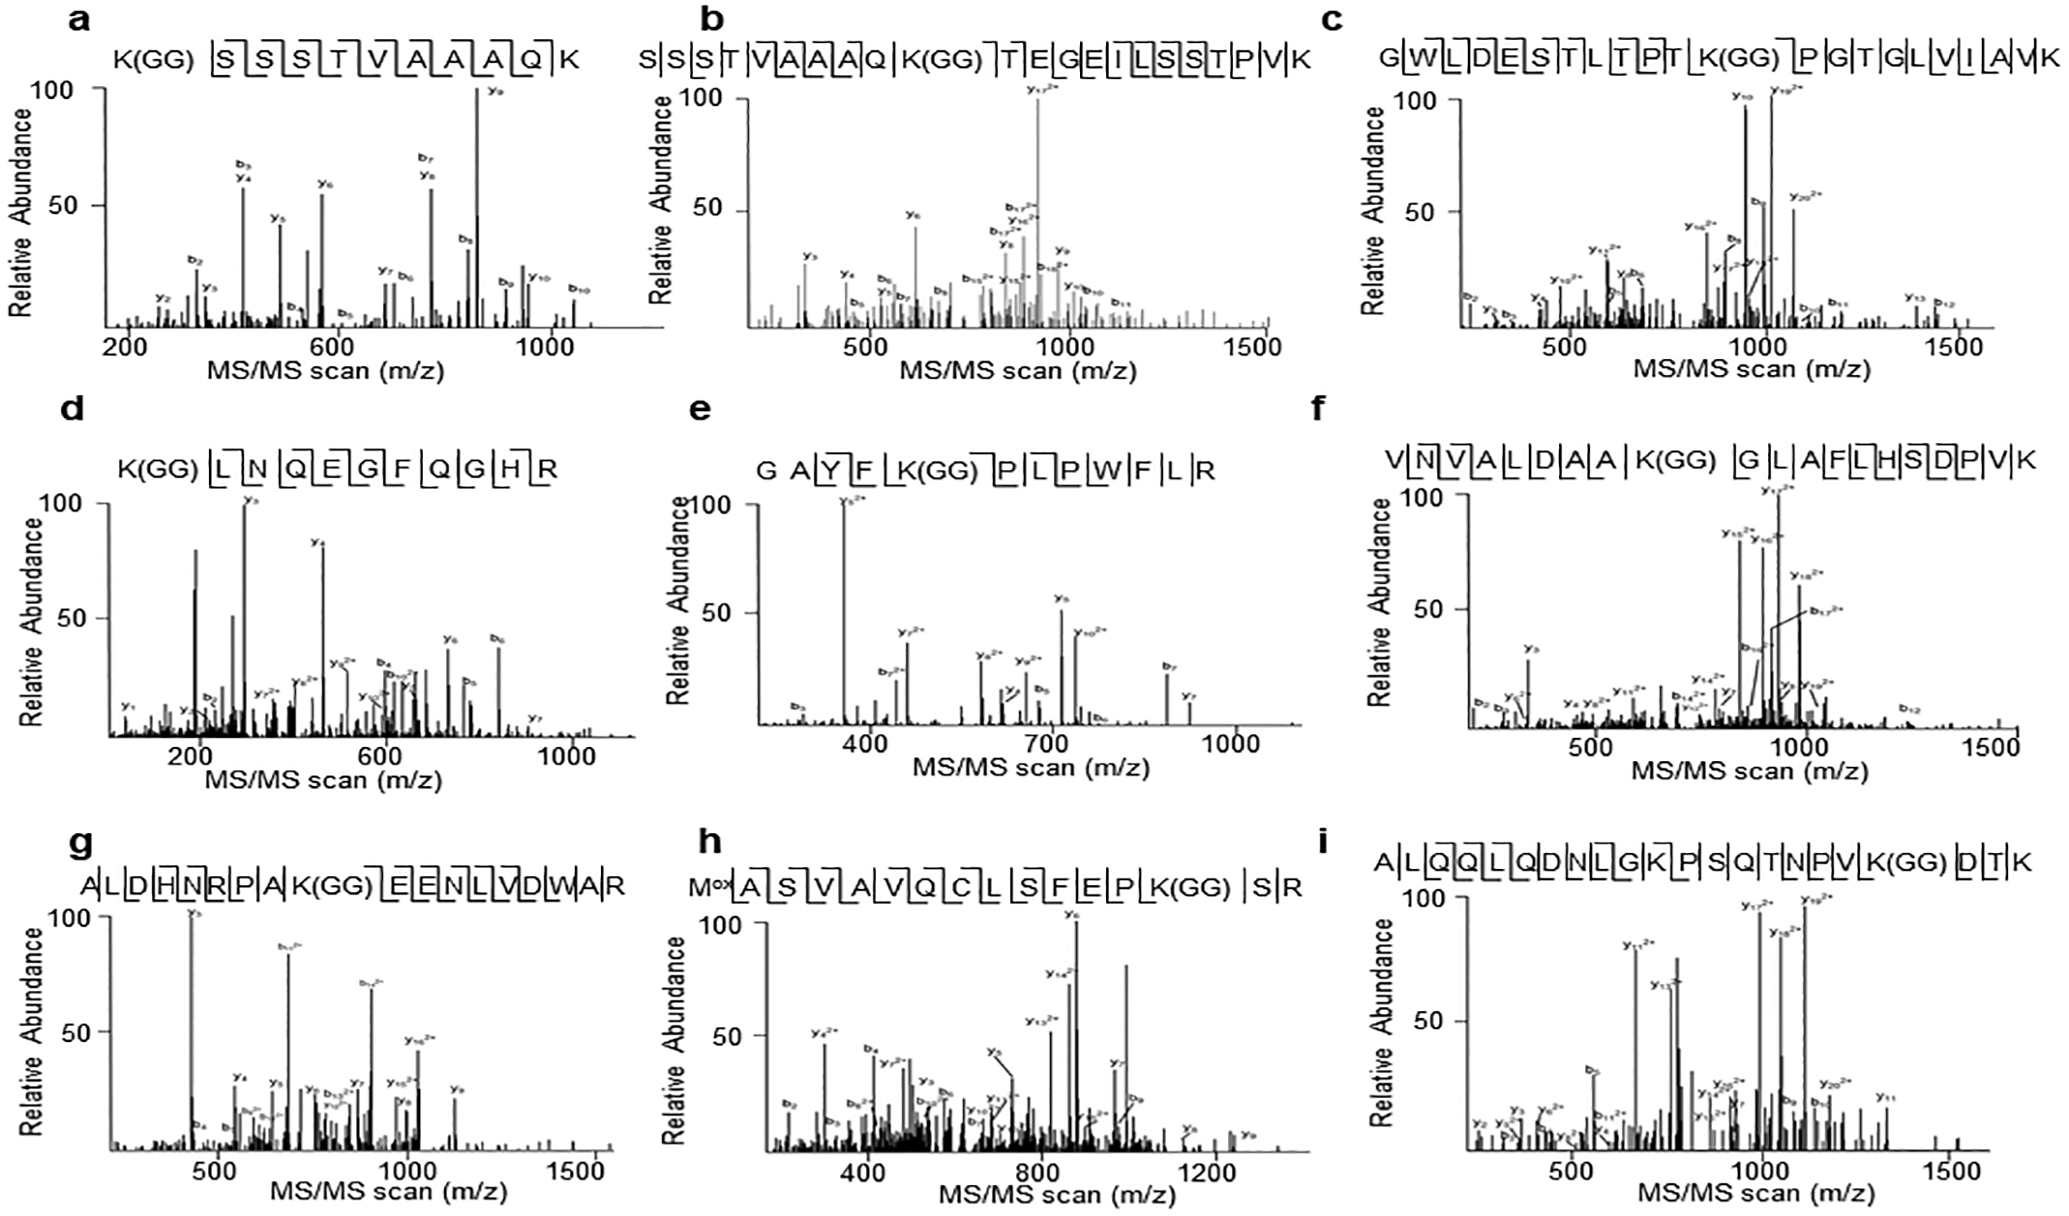
MS/MS spectrums of peptides containing ubiquitinated lysine residues of BIK1 are shown from a to i. a. K31; b. K41; c. K95; d. K106; e. K170; f. K186; g. K286; h. K337; i. K366. MS spectrums are outputs from the SEQUEST program. MS analysis was performed once.
Extended Data Figure 7. BIK1 in vivo ubiquitination sites identified by mass spectrometry.
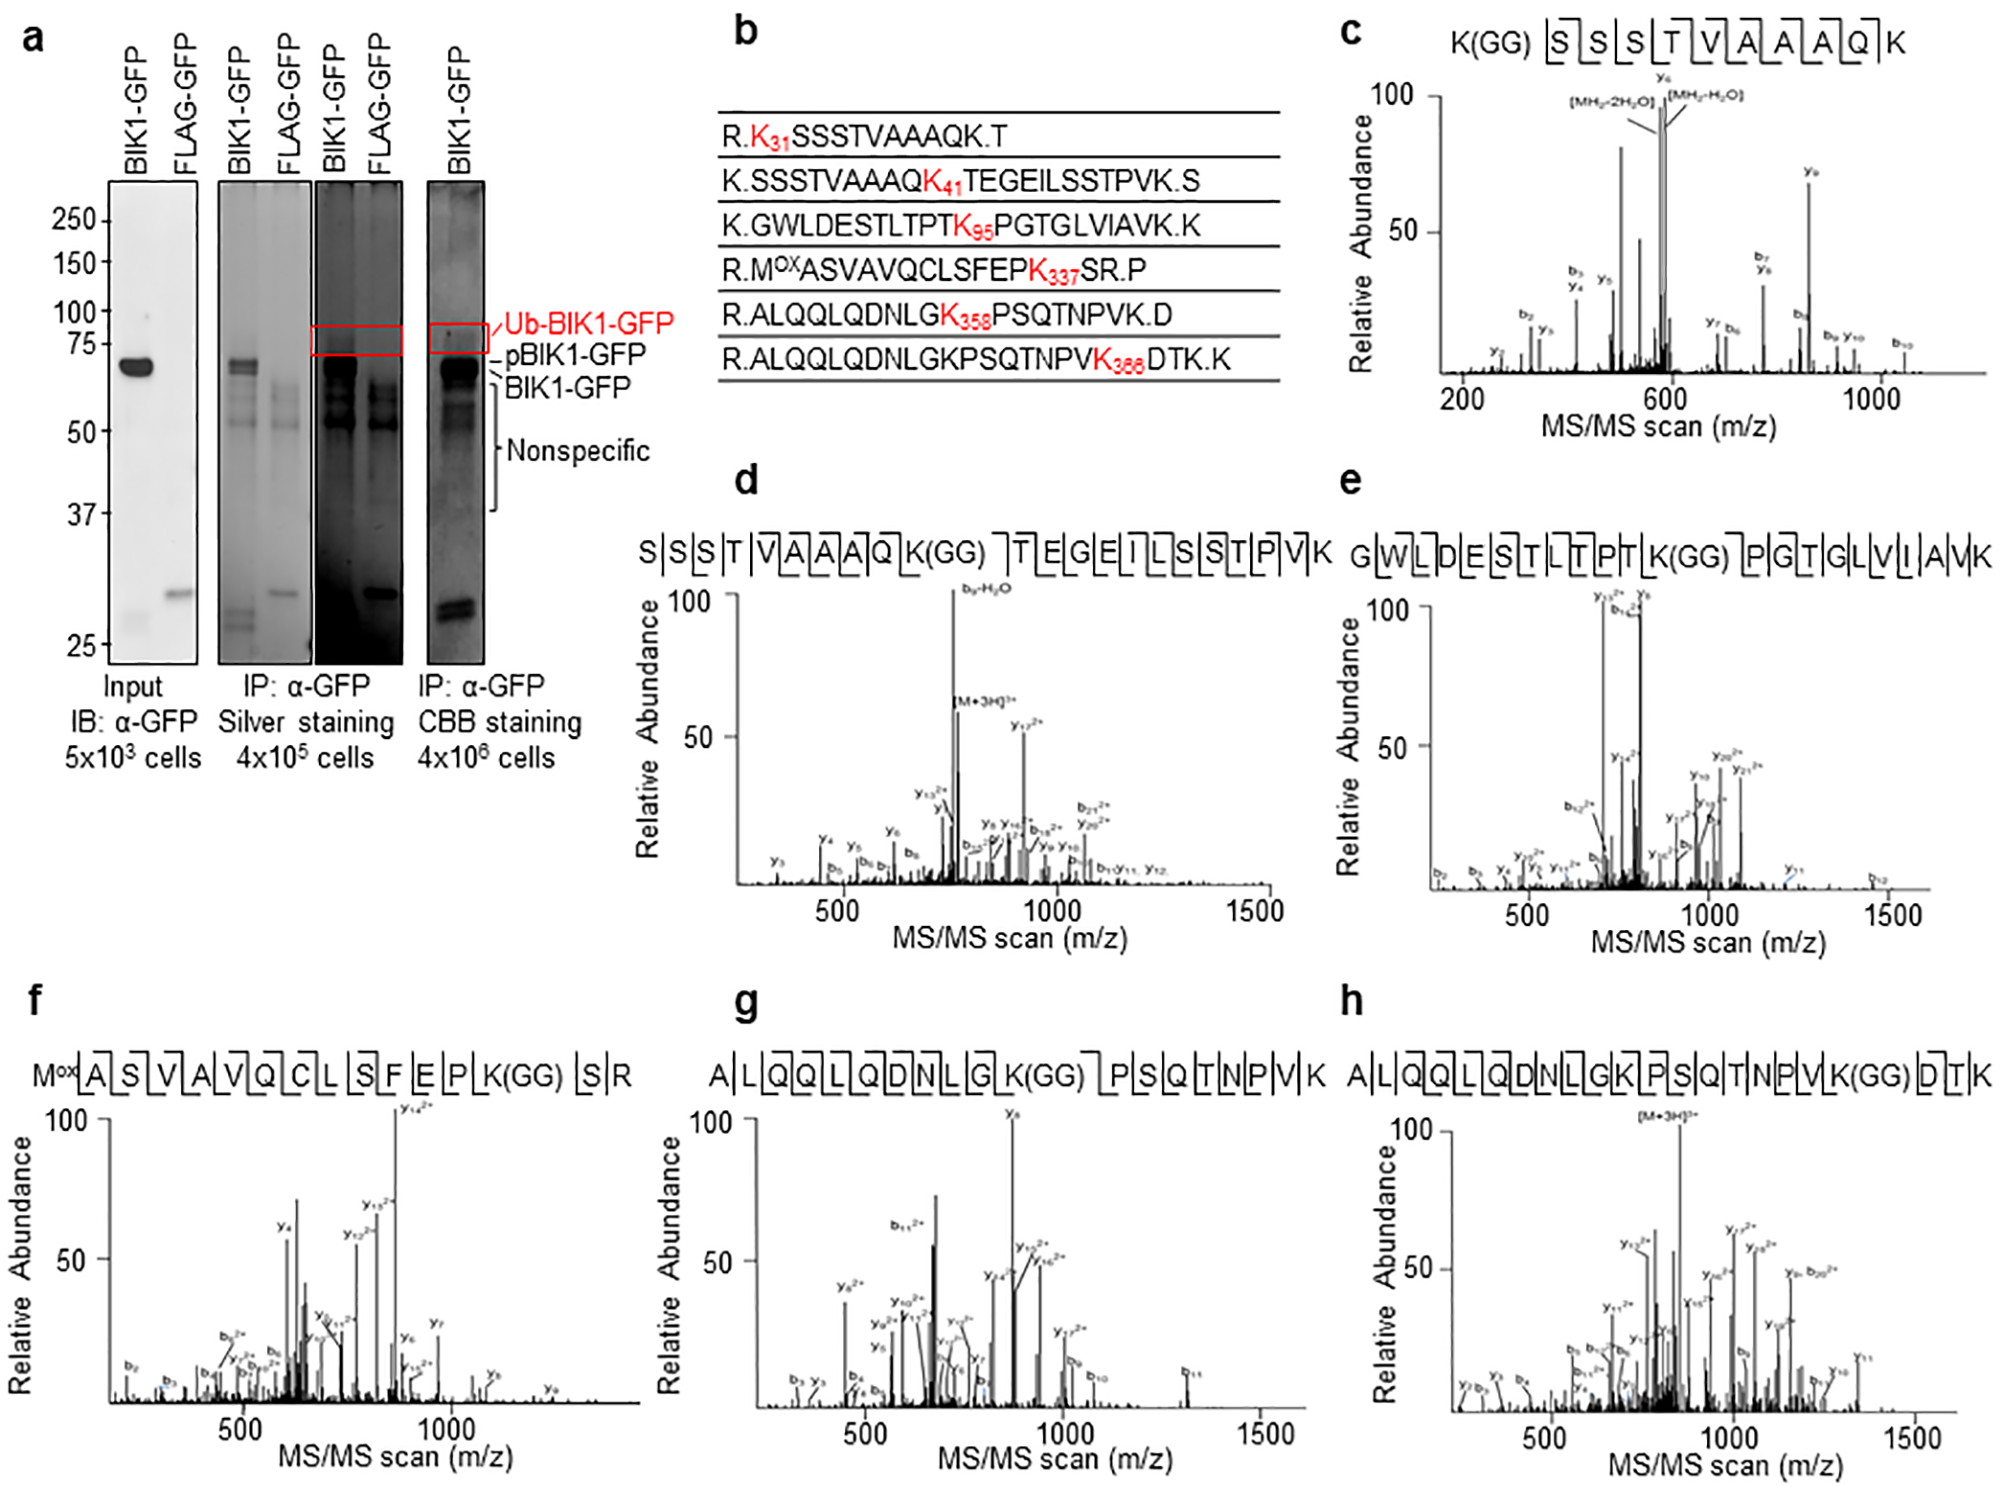
a. Ubiquitinated BIK1-GFP in planta was immunoprecipitated for LC-MS/MS analysis. BIK1-GFP and FLAG-UBQ were co-expressed in WT protoplasts (~4 × 10⁶ cells) followed by 200 nM flg22 treatment for 30 min. Ubiquitinated BIK1 was immunoprecipitated by GFP-trap-agarose, separated by SDS-PAGE, digested by trypsin and subjected to LC-MS/MS analysis. Portions of cell lysates were examined for BIK1-GFP expression (left), and immunoprecipitates were analyzed by SDS-PAGE following silver staining (middle, right for longer exposure of the same gel) and SDS-PAGE following CBB staining (right). The highlighted area was cut and analyzed by MS. b. BIK1 is ubiquitinated in vivo. Ubiquitinated lysine containing a diglycine remnant by LC-MS/MS analysis are marked as red with amino acid positions. c to h. MS/MS spectrums of peptides containing ubiquitinated lysine of BIK1 are shown. c. K31; d. K41; e. K95; f. K337; g. K358; h. K366. MS spectrums are outputs from the SEQUEST program. MS analysis was performed once.
Extended Data Figure 8. BIK1 monoubiquitination is required for plant defense and flg22 signaling.
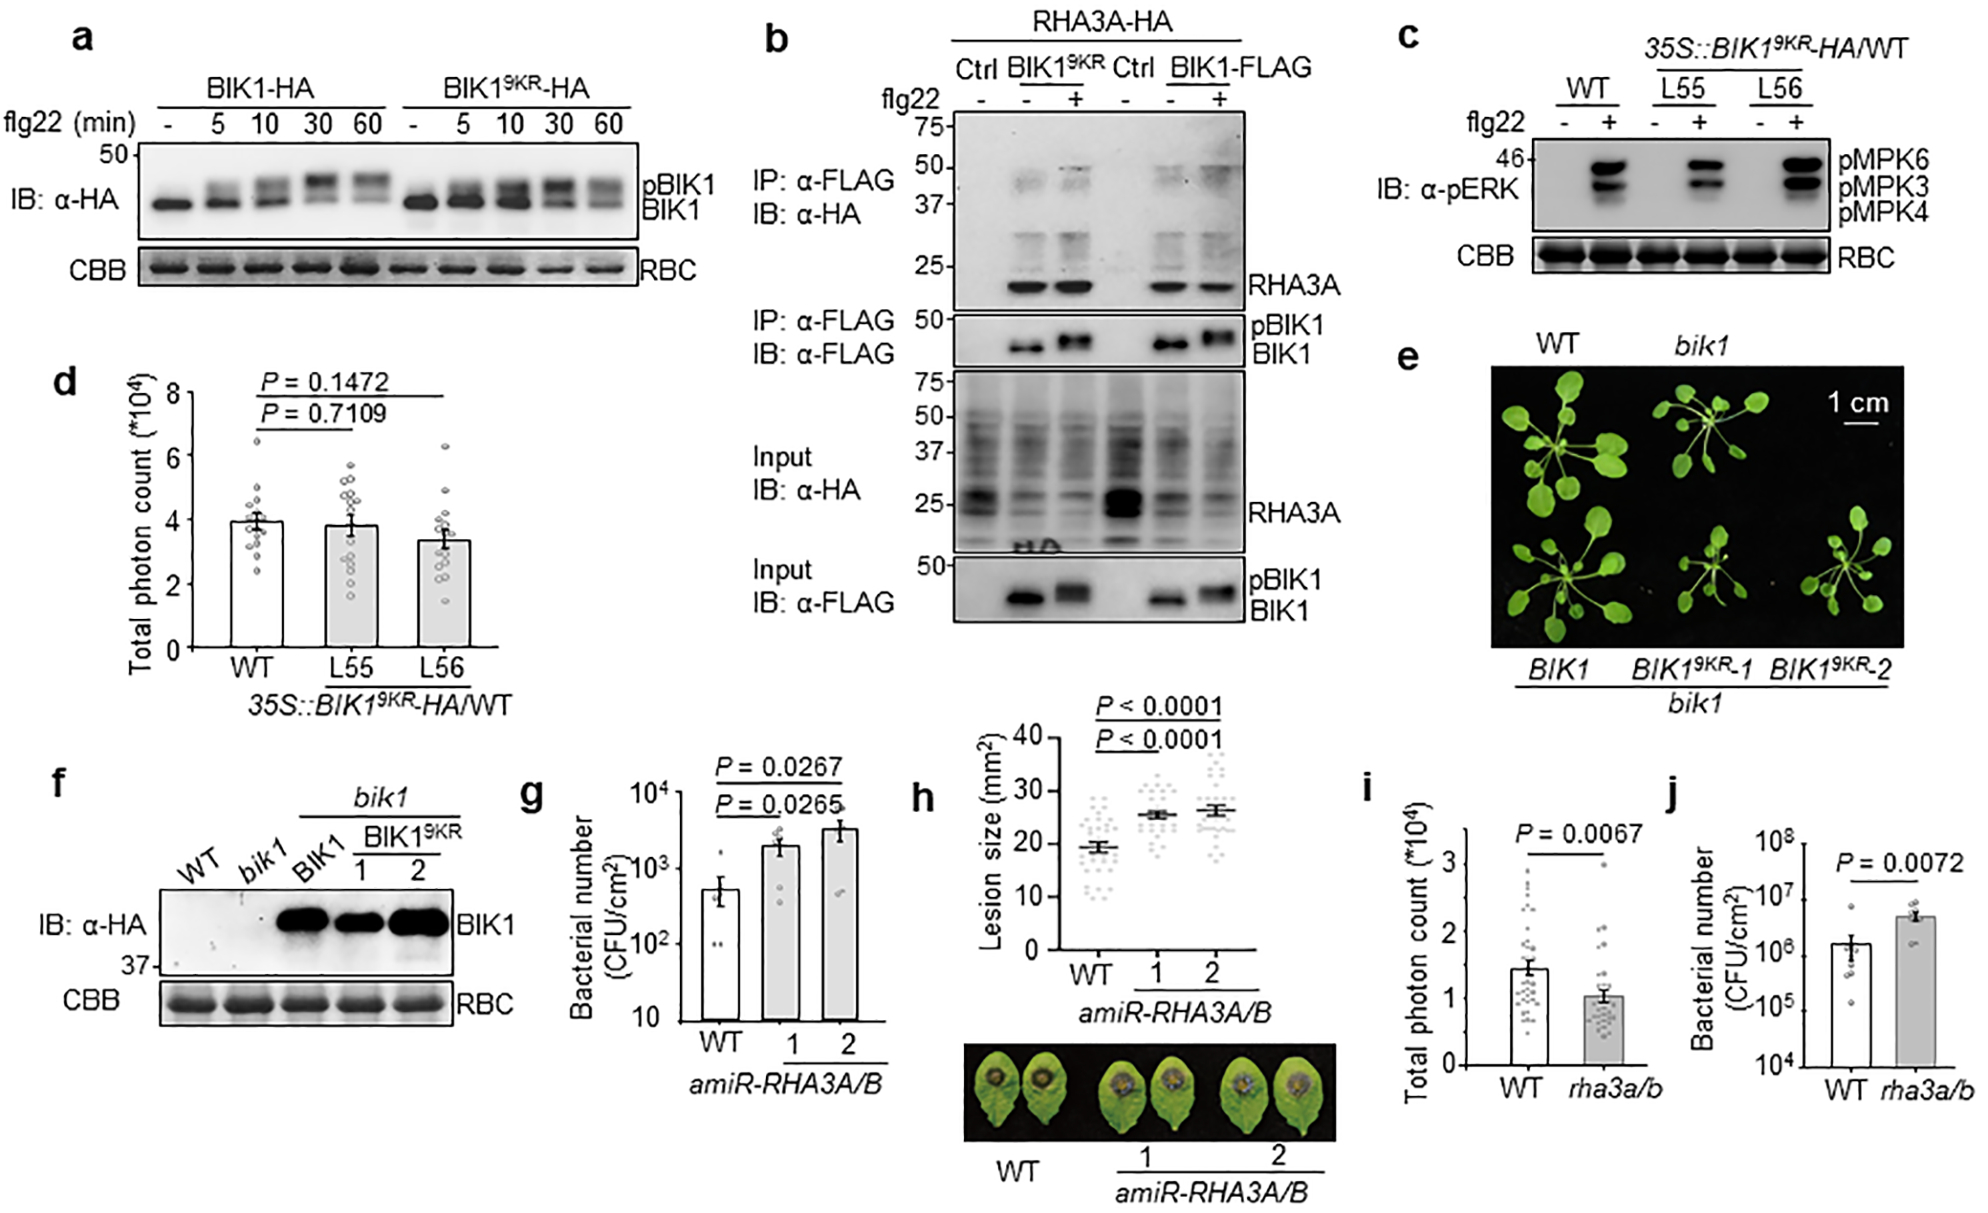
a. BIK19KR undergoes phosphorylation similar to BIK1 upon flg22 treatment. BIK1-HA or BIK19KR-HA was expressed in WT protoplasts followed by 100 nM flg22 treatment for indicated time points. Band-shift of BIK1 was examined by IB with α-HA antibody. b. BIK19KR interacts with RHA3A in a Co-IP assay. RHA3A-HA was co-expressed with BIK1-FLAG or BIK19KR-FLAG in protoplasts followed by 100 nM flg22 treatment for 15 min. Co-IP assay was carried out with α-FLAG agarose and immunoprecipitated proteins were immunoblotted with α-HA or α-FLAG antibody (top two panels). Bottom two panels show BIK1-FLAG/BIK19KR-FLAG and RHA3A-HA proteins. c. Transgenic plants with BIK19KR overexpression in WT background show similar MAPK activation as WT. Eleven-day-old seedlings of WT or 35S::BIK19KR-HA/WT transgenic plants (Line 55 and 56) were treated with 200 nM flg22 for 15 min. MAPK activation was analyzed with α-pERK antibody (top), and protein loading is shown by CBB staining for RBC (bottom). d. Transgenic plants with BIK19KR overexpression in WT background show similar flg22-induced ROS production as WT. Leaf discs from the indicated genotypes were treated with 100 nM flg22, and ROS production was measured as relative luminescence units by a luminometer over 50 min. Data are shown as overlay of dot plot and means of total photon count ± SEM (One-way ANOVA, n=16). e. Growth phenotype of pBIK1::BIK1-HA/bik1 and pBIK1::BIK19KR-HA/bik1 transgenic plants. Five-week-old soil-grown plants are shown. Scale bar, 1 cm. f. Expression of BIK1-HA or BIK19KR-HA in transgenic plants. Total proteins from leaves of four-week-old transgenic plants were subjected to α-HA IB (top). Bottom panel shows CBB staining for RBC. g. RHA3A and RHA3B play a role in disease resistance to Pst DC3000 hrcC− infection. Plants were spray-inoculated with Pst DC3000 hrcC− and bacterial growth was measured at four days post-inoculation (dpi). Data are shown as overlay of dot plot and means ± SEM (One-way ANOVA, n=6). h. RHA3A and RHA3B play a role in disease resistance to Botrytis. Four-week-old plant leaves were deposited with 10 μL of B. cinerea BO5 at a concentration of 2.5×10⁵ spores per mL. Disease symptom was recorded, and the lesion diameter was measured at two dpi. Data are shown as overlay of dot plot and means ± SEM (One-way ANOVA, n=34). i. ROS production is reduced in rha3a/b. Leaf discs from WT or rha3a/b were treated with 100 nM flg22 for ROS production over 50 min. Data are shown as overlay of dot plot and means of total photon count ± SEM (Two-tailed Student’s t-test, n=36 for WT and n=32 for rha3a/b). j. RHA3A and RHA3B play a role in disease resistance to Pst DC3000. Plants were spray-inoculated with Pst DC3000 and bacterial growth was measured at three dpi. Data are shown as overlay of dot plot and means ± SEM (Two-tailed Student’s t-test, n=9). The experiments were repeated three times with similar results.
Extended Data Figure 9. The BIK19KR mutation impairs flg22-induced BIK1 endocytosis.
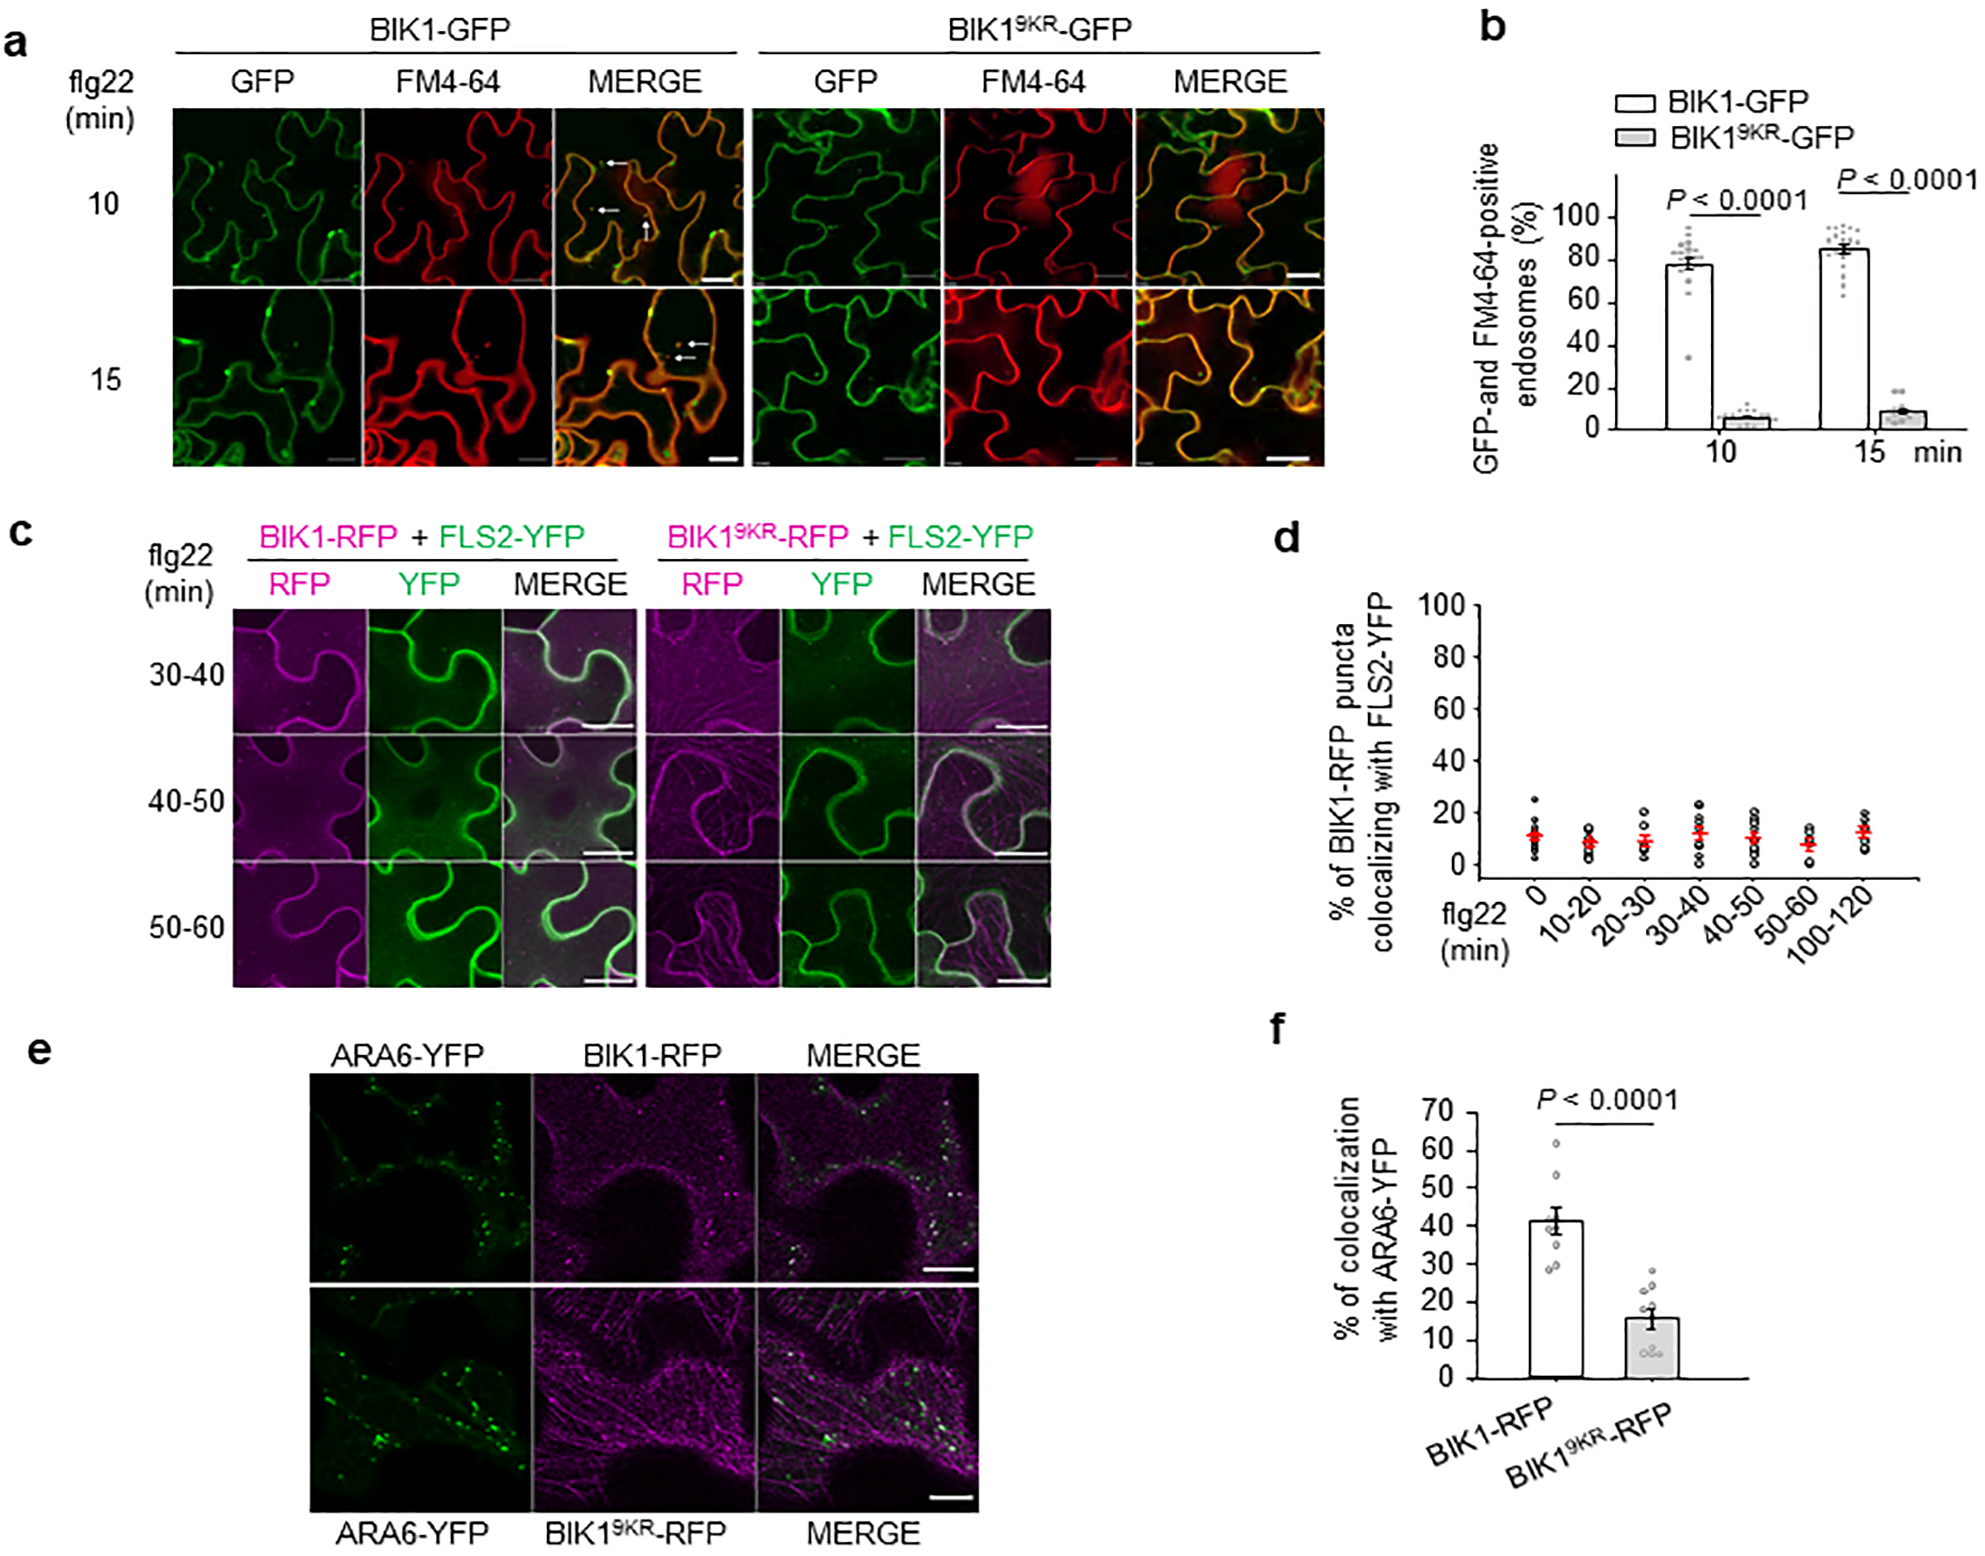
a. b. BIK19KR-GFP-labelled puncta colocalize less with FM4–64 than BIK1-GFP upon flg22 treatment. Five-day-old seedlings of 35S::BIK1-GFP or 35S::BIK19KR-GFP were pretreated with FM4–64 (2 μM) for 15 min and elicited with 100 nM flg22 for the indicated time points and fluorescence was detected in epidermis by a confocal microscopy (a). White arrow points to colocalized endosomes. Scale bars, 20 μm. Percentage of BIK1-GFP or BIK19KR-GFP and FM4–64 positive endosomes over time per 100% of image area is shown in (b). Data are shown as overlay of dot plot and means ± SEM (Two-tailed Student’s t-test, n = 21 images for BIK1-GFP and n= 16, 15 images for 10, 15 min respectively for BIK19KR-GFP). c. Flg22-induced BIK1, BIK19KR and FLS2 endocytosis in N. benthamiana. BIK1-TagRFP (BIK1-RFP) or BIK19KR-TagRFP (BIK19KR-RFP) was co-expressed with FLS2-YFP in N. benthamiana, infiltrated with 100 μM flg22 and imaged at the indicated time points by a confocal microscopy. The images of 30–40, 40–50 and 50–60 min after flg22 treatment from Fig. 4e are shown here. Scale bars, 20 μm. For BIK1-RFP/FLS2-YFP, n= 14, 11, 7, 10, 10, 6, 7 images for 0, 10–20, 20–30, 30–40, 40–50, 50–60, 100–120 min; for BIK19KR-RFP/FLS2-YFP, n= 19, 11, 11, 9, 16, 12, 7 images for 0, 10–20, 20–30, 30–40, 40–50, 50–60, 100–120 min respectively. d. Percentage of BIK1-RFP puncta colocalizing with FLS2-YFP after flg22 treatment for the indicated time points in Fig. 4e and Extended Data Fig. 9c. Data are shown as overlay of dot plot and means ± SEM (n= 14, 11, 7, 10, 10, 6, 7 images for 0, 10–20, 20–30, 30–40, 40–50, 50–60, 100–120 min respectively). e-f BIK19KR-RFP shows reduced co-localization with ARA6-YFP. BIK1-RFP or BIK19KR-RFP was transiently expressed with ARA6-YFP in N. benthamiana, and the images were taken 48–72 hr after infiltration (e). Scale bars, 10 μm. Percentage of BIK1-RFP puncta colocalizing with ARA6-YFP is shown in f. Data are shown as overlay of dot plot and means ± SEM (Two-tailed Student’s t-test, n= 9 images for BIK1-RFP; n= 10 images for BIK19KR-RFP). The experiments were repeated three times with similar results.
Extended Data Figure 10. Monoubiquitination mediates BIK1 release from PM upon ligand perception.
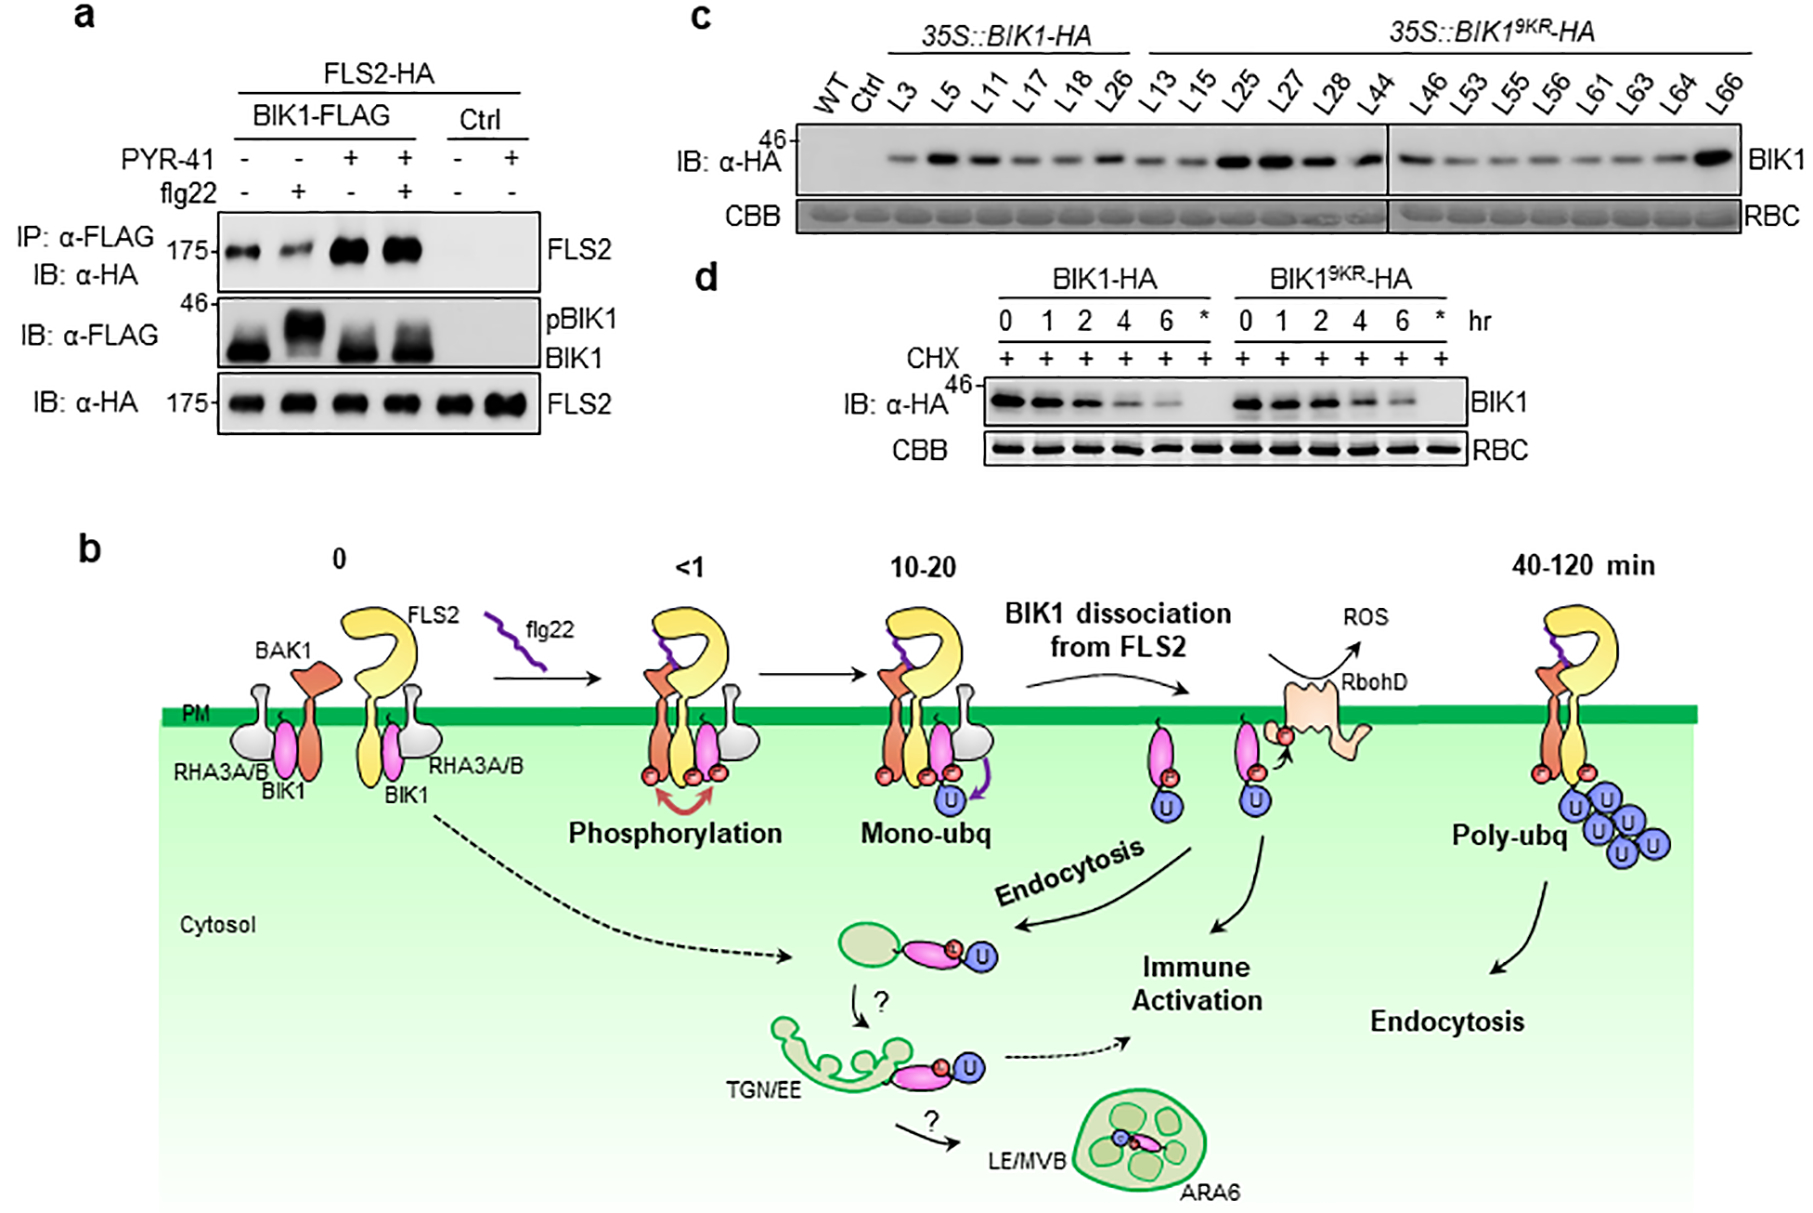
a. PYR-41 impairs flg22-induced BIK1 dissociation from FLS2. FLS2-HA was co-expressed with BIK1-FLAG or Ctrl in protoplasts. After pretreatment with 50 μM PYR-41 for 30 min, protoplasts were stimulated with 100 nM flg22 for 15 min. Co-IP and IB were performed as in Fig. 4g. b. A working model of RHA3A/B-mediated BIK1 monoubiquitination in plant immunity. During non-activated, steady state condition (0 min), BIK1 remains hypo-phosphorylated and associates with FLS2 and BAK1. Upon flg22 perception, FLS2 dimerizes with BAK1, which stimulates BIK1 phosphorylation (<1 min). The phosphorylated BIK1 is monoubiquitinated by E3 ligases RHA3A and RHA3B, leading to BIK1 dissociation from FLS2-BAK1 complex, accompanied by endocytosis (10–20 min). Ligand-induced BIK1 monoubiquitination contributes to the activation of ROS and other defense responses. FLS2 is polyubiquitinated and endocytosed 40 min after flg22 perception for signaling attenuation. c. BIK19KR shows comparable protein level as BIK1 in transgenic plants. 35S::BIK1-HA or 35S::BIK19KR-HA transgenic plants in WT background were used for IB detecting BIK1 proteins by α-HA antibody. Ctrl is empty vector transgenic plants. d. BIK1 and BIK19KR protein stability after cycloheximide treatment. BIK1-HA or BIK19KR-HA was expressed in WT protoplasts for 12 hr followed by 500 μg/ml cycloheximide (CHX) treatment for the indicated time. BIK1 or BIK19KR proteins were analyzed by IB with α-HA antibody. * indicates CHX was added right after transfection, thus blocking protein synthesis. The experiments were repeated three times with similar results.
Supplementary Material
Acknowledgements
We thank Dr. Qijun Chen (China Agricultural University, China) for the CRISPR/Cas9 system, Drs. Jianfeng Li (Sun Yat-Sen University, China) and Jen Sheen (Harvard Medical School, USA) for the amiRNA system, Dr. Paul de Figueiredo (Texas A&M University, USA) for mouse cDNA, Drs. Timothy Devarenne, Martin Dickman, Craig Kaplan and Tatyana Igumenova (Texas A&M University, USA), and the members in Shan and He laboratories for discussion and comments on this work. The work was supported by NIH (R01GM097247) and the Robert A. Welch foundation (A-1795) to L.S., National Science Foundation (NSF) (MCB-1906060) and NIH (R01GM092893) to P.H, NSF (IOS-1147032) to A.H, the Special Research Fund (BOF15/24J/048) to E. R., and NIH (R01GM114260) to J.P. The authors have declared no conflict of interests.
Footnotes
Competing interests The authors declare no competing interests.
References
- 1.Couto D & Zipfel C Regulation of pattern recognition receptor signalling in plants. Nat Rev Immunol 16, 537–552, (2016). [DOI] [PubMed] [Google Scholar]
- 2.Yu X, Feng B, He P & Shan L From Chaos to Harmony: Responses and Signaling upon Microbial Pattern Recognition. Annu Rev Phytopathol 55, 109–137, (2017). [DOI] [PMC free article] [PubMed] [Google Scholar]
- 3.Spoel SH & Dong X How do plants achieve immunity? Defence without specialized immune cells. Nat Rev Immunol 12, 89–100, (2012). [DOI] [PubMed] [Google Scholar]
- 4.Liang X & Zhou JM Receptor-Like Cytoplasmic Kinases: Central Players in Plant Receptor Kinase-Mediated Signaling. Annu Rev Plant Biol 69, 267–299, (2018). [DOI] [PubMed] [Google Scholar]
- 5.Lu D et al. A receptor-like cytoplasmic kinase, BIK1, associates with a flagellin receptor complex to initiate plant innate immunity. Proc Natl Acad Sci U S A 107, 496–501, (2010). [DOI] [PMC free article] [PubMed] [Google Scholar]
- 6.Zhang J et al. Receptor-like cytoplasmic kinases integrate signaling from multiple plant immune receptors and are targeted by a Pseudomonas syringae effector. Cell Host Microbe 7, 290–301, (2010). [DOI] [PubMed] [Google Scholar]
- 7.Lin W et al. Tyrosine phosphorylation of protein kinase complex BAK1/BIK1 mediates Arabidopsis innate immunity. Proc Natl Acad Sci U S A 111, 3632–3637, (2014). [DOI] [PMC free article] [PubMed] [Google Scholar]
- 8.Li L et al. The FLS2-associated kinase BIK1 directly phosphorylates the NADPH oxidase RbohD to control plant immunity. Cell Host Microbe 15, 329–338, (2014). [DOI] [PubMed] [Google Scholar]
- 9.Kadota Y et al. Direct regulation of the NADPH oxidase RBOHD by the PRR-associated kinase BIK1 during plant immunity. Mol Cell 54, 43–55, (2014). [DOI] [PubMed] [Google Scholar]
- 10.Tian W et al. A calmodulin-gated calcium channel links pathogen patterns to plant immunity. Nature 572, 131–135, (2019). [DOI] [PubMed] [Google Scholar]
- 11.Smith JM et al. Loss of Arabidopsis thaliana Dynamin-Related Protein 2B reveals separation of innate immune signaling pathways. PLoS Pathog 10, e1004578, (2014). [DOI] [PMC free article] [PubMed] [Google Scholar]
- 12.Beck M, Zhou J, Faulkner C, MacLean D & Robatzek S Spatio-temporal cellular dynamics of the Arabidopsis flagellin receptor reveal activation status-dependent endosomal sorting. Plant Cell 24, 4205–4219, (2012). [DOI] [PMC free article] [PubMed] [Google Scholar]
- 13.Robatzek S, Chinchilla D & Boller T Ligand-induced endocytosis of the pattern recognition receptor FLS2 in Arabidopsis. Genes Dev 20, 537–542, (2006). [DOI] [PMC free article] [PubMed] [Google Scholar]
- 14.Smith JM, Salamango DJ, Leslie ME, Collins CA & Heese A Sensitivity to Flg22 Is Modulated by Ligand-Induced Degradation and de Novo Synthesis of the Endogenous Flagellin-Receptor FLAGELLIN-SENSING2. Plant Physiology 164, 440–454, (2014). [DOI] [PMC free article] [PubMed] [Google Scholar]
- 15.Lu DP et al. Direct Ubiquitination of Pattern Recognition Receptor FLS2 Attenuates Plant Innate Immunity. Science 332, 1439–1442, (2011). [DOI] [PMC free article] [PubMed] [Google Scholar]
- 16.Zhou J et al. The dominant negative ARM domain uncovers multiple functions of PUB13 in Arabidopsis immunity, flowering, and senescence. J Exp Bot 66, 3353–3366, (2015). [DOI] [PMC free article] [PubMed] [Google Scholar]
- 17.Zhou J et al. Regulation of Arabidopsis brassinosteroid receptor BRI1 endocytosis and degradation by plant U-box PUB12/PUB13-mediated ubiquitination. Proc Natl Acad Sci U S A 115, E1906–E1915, (2018). [DOI] [PMC free article] [PubMed] [Google Scholar]
- 18.Li JF, Zhang D & Sheen J Epitope-tagged protein-based artificial miRNA screens for optimized gene silencing in plants. Nat Protoc 9, 939–949, (2014). [DOI] [PMC free article] [PubMed] [Google Scholar]
- 19.Lal NK et al. The Receptor-like Cytoplasmic Kinase BIK1 Localizes to the Nucleus and Regulates Defense Hormone Expression during Plant Innate Immunity. Cell Host Microbe 23, 485–497 e485, (2018). [DOI] [PMC free article] [PubMed] [Google Scholar]
- 20.Ueda T, Yamaguchi M, Uchimiya H & Nakano A Ara6, a plant-unique novel type Rab GTPase, functions in the endocytic pathway of Arabidopsis thaliana. EMBO J 20, 4730–4741, (2001). [DOI] [PMC free article] [PubMed] [Google Scholar]
- 21.Lin W et al. Inverse modulation of plant immune and brassinosteroid signaling pathways by the receptor-like cytoplasmic kinase BIK1. Proc Natl Acad Sci U S A 110, 12114–12119, (2013). [DOI] [PMC free article] [PubMed] [Google Scholar]
- 22.Lin W, Ma X, Shan L & He P Big roles of small kinases: the complex functions of receptor-like cytoplasmic kinases in plant immunity and development. J Integr Plant Biol 55, 1188–1197, (2013). [DOI] [PMC free article] [PubMed] [Google Scholar]
- 23.Wang J et al. A Regulatory Module Controlling Homeostasis of a Plant Immune Kinase. Mol Cell 69, 493–504 e496, (2018). [DOI] [PubMed] [Google Scholar]
- 24.Zhou B & Zeng L Conventional and unconventional ubiquitination in plant immunity. Mol Plant Pathol 18, 1313–1330, (2017). [DOI] [PMC free article] [PubMed] [Google Scholar]
- 25.Wang ZP et al. Egg cell-specific promoter-controlled CRISPR/Cas9 efficiently generates homozygous mutants for multiple target genes in Arabidopsis in a single generation. Genome Biol 16, 144, (2015). [DOI] [PMC free article] [PubMed] [Google Scholar]
- 26.Tao K, Waletich JR, Arredondo F & Tyler BM Manipulating Endoplasmic Reticulum-Plasma Membrane Tethering in Plants Through Fluorescent Protein Complementation. Frontiers in plant science 10, 635, (2019). [DOI] [PMC free article] [PubMed] [Google Scholar]
- 27.He P, Shan L & Sheen J The use of protoplasts to study innate immune responses. Methods Mol Biol 354, 1–9, (2007). [DOI] [PubMed] [Google Scholar]
- 28.Zhou J, He P & Shan L Ubiquitination of plant immune receptors. Methods Mol Biol 1209, 219–231, (2014). [DOI] [PMC free article] [PubMed] [Google Scholar]
- 29.Hospenthal MK, Mevissen TET & Komander D Deubiquitinase-based analysis of ubiquitin chain architecture using Ubiquitin Chain Restriction (UbiCRest). Nature Protocols 10, 349–361, (2015). [DOI] [PMC free article] [PubMed] [Google Scholar]
- 30.Xu P et al. Quantitative proteomics reveals the function of unconventional ubiquitin chains in proteasomal degradation. Cell 137, 133–145, (2009). [DOI] [PMC free article] [PubMed] [Google Scholar]
- 31.Leslie ME & Heese A Quantitative Analysis of Ligand-Induced Endocytosis of FLAGELLIN-SENSING 2 Using Automated Image Segmentation. Plant Pattern Recognition Receptors: Methods and Protocols 1578, 39–54, (2017). [DOI] [PubMed] [Google Scholar]
- 32.Boruc J et al. Functional modules in the Arabidopsis core cell cycle binary protein-protein interaction network. Plant Cell 22, 1264–1280, (2010). [DOI] [PMC free article] [PubMed] [Google Scholar]
Associated Data
This section collects any data citations, data availability statements, or supplementary materials included in this article.
Supplementary Materials
Data Availability Statement
The data supporting the findings of this study are available within the paper and its Supplementary Information files. Source Data (gels and graphs) for Figs. 1–4 and Extended Data Figs. 1–10 are provided with the paper.


