Abstract
Background:
Lysine lipoylation which is a rare and highly conserved post-translational modification of proteins has been considered as one of the most important processes in the biological field. To obtain a comprehensive understanding of regulatory mechanism of lysine lipoylation, the key is to identify lysine lipoylated sites. The experimental methods are expensive and laborious. Due to the high cost and complexity of experimental methods, it is urgent to develop computational ways to predict lipoylation sites.
Methodology:
In this work, a predictor named LipoSVM is developed to accurately predict lipoylation sites. To overcome the problem of an unbalanced sample, synthetic minority over-sampling technique (SMOTE) is utilized to balance negative and positive samples. Furthermore, different ratios of positive and negative samples are chosen as training sets.
Results:
By comparing five different encoding schemes and five classification algorithms, LipoSVM is constructed finally by using a training set with positive and negative sample ratio of 1:1, combining with position-specific scoring matrix and support vector machine. The best performance achieves an accuracy of 99.98% and AUC 0.9996 in 10-fold cross-validation. The AUC of independent test set reaches 0.9997, which demonstrates the robustness of LipoSVM. The analysis between lysine lipoylation and non-lipoylation fragments shows significant statistical differences.
Conclusion:
A good predictor for lysine lipoylation is built based on position-specific scoring matrix and support vector machine. Meanwhile, an online webserver LipoSVM can be freely downloaded from https://github.com/stars20180811/LipoSVM.
Keywords: Lysine lipoylation, prediction, amino acids, support vector machine, post-translational modifications, scoring matrix
1. INTRODUCTION
Protein post-translational modifications (PTMs) refer to the chemical modifications of proteins after translation. Studies have shown that the production of PTMs mainly through the splicing of the peptide chain backbone, adds new groups to specific amino acid side chains, or chemically modifying existing groups [1]. PTMs play key roles in regulating various biological functions, such as protein activity, stability and interaction profiles [2]. Lysine is not only the most modified amino acid but it is also the amino acid that is affected by a wide range of PTMs among the 20 standard amino acids [3]. Common lysine post-translational modifications include acetylation [4], methylation [5], ubiquitination [6], sumoylation [7] and phosphorylation [8].
Lipoylation is one of the rare PTMs that involves the covalent attachment of lipoamide to a lysine residue via an amide bond [9-12]. Different from other post-translational modifications that rely on local amino acid motifs, lipoylated substrate is not significantly affected by conservative amino acid mutations on both sides of modified lysine [13]. So far, only four lipoylated multimeric metabolic enzymes have been found in mammals and one in bacteria [14, 15]. Despite the rare occurrence, it plays an important role in many key metabolic processes and protein interactions. For example, AoDH which is the only lipoylated protein complex found in bacteria plays roles in the catabolism of the acetoin energy storage molecule in acetyl-CoA and acetaldehyde [16]. And the lipoylated enzyme KDH regulates the binding of a surrogate carbon source to glucose in the TCA cycle, catalyzing the removal of alpha-ketoglutaric acid to form succinyl-CoA [17]. In addition, many studies have demonstrated that lipoylated complexes are inextricably linked to disease, including Warburg effect [18-20], HIV infection [21, 22] and herpesvirus [23]. Based on the various studies mentioned above, it is evident that deciphering the biological function of lipoylation may help in revealing the underlying molecular causes of these diseases. In addition, lipoylation with high evolutionary conservation and lipoylated enzymes are critically linked to the development of disease and the maintenance of health [14, 15]. Based on the above findings, it is evident that deciphering the biological functions of lipoylation may help in revealing the underlying molecular causes of these diseases. And understanding the mechanism of lipoylated complexes is critical, which helps in the diagnosis and treatment of diseases.
The first condition for understanding the mechanism of lipoylation is to identify the lipoylation sites. Traditional molecular biology and biochemistry techniques, such as nuclear magnetic resonance spectroscopy [24], protein purification [25], and western blotting using antibody against lipoic acid [14] provide valuable insights into the function of lipoylated proteins. Moreover, mass spectrometry provides a means of studying the lipoylation status of specific lysine residues in different cell types, tissues and biological environments [26]. All of these methods have the drawbacks of low throughput, extensive time-consumption and high-cost. Hence, it is necessary to predict the lipoylation sites through computational approaches that are convenient and high throughput.
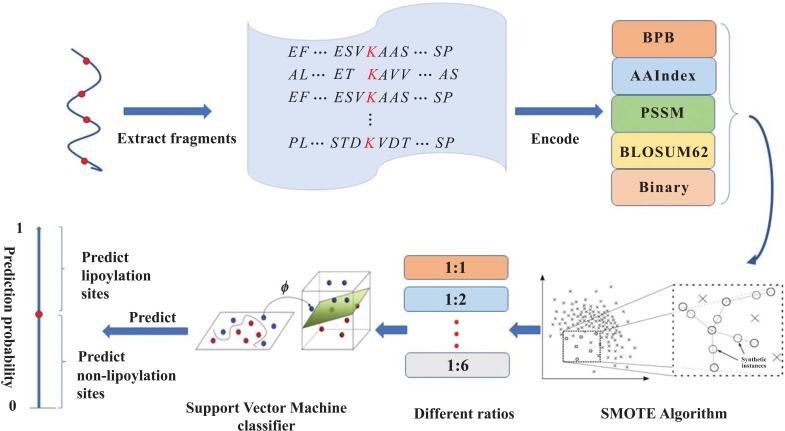
In this work, a widely used algorithm SVM is implemented to construct predictors. To reduce the negative impact of unbalanced data on classifier performance, the positive samples were oversampled by synthetic minority over-sampling (SMOTE) [27]. Subsequently, different ratios of positive and negative samples are selected as training sets, respectively. And five different encoding schemes including bi-profile Bayes (BPB), AAindex, position-specific scoring matrix (PSSM), BLOSUM62 matrix and binary are implemented. In addition, comparisons with other algorithms K-Nearest Neighbor (KNN), Decision Tree, Logistic Regression (LR) and Naive Bayes show the effectiveness of Support Vector Machine (SVM) in predicting lipoylation sites in proteins. A comparison with existing tools has been implemented to demonstrate the effectiveness of LipoSVM. A flowchart of the LipoSVM is given in Fig. (1).
Fig. (1).
The computational framework of the predictor. Step 1, a window of various lengths with center lysine (K) is used to extract fragments from lipoylated proteins. Step 2, five different encoding schemes described in Section 2.2 are utilized to code fragments. Step 3, SMOTE is applied to oversampling. Step 4, the different ratios of positive and negative training sets are used to train models. Step 5, LipoSVM is adopted to predict independent test samples.
2. MATERIALS AND METHODS
2.1. Benchmark Dataset
575 proteins with 593 experimentally annotated lysine lipoylation sites were retrieved from UniProt (http://www.uniprot.org/) by searching the keywords “lipoylation” and “lipoylated protein”. These proteins are scanned by a sliding window whose center is lysine (K). The missing amino acids are filled with pseudo amino acid “X”. In this work, the optimal window length is 17. As a result, 593 lipoylated fragments and 2183 non-lipoylated fragments are obtained. A fragment was assigned with experimentally validated lysine lipoylation site in positive dataset S + or in negative dataset S. In general, the training set with high homology could cause over-fitting which impairs the generalization of a predictor. Therefore, if there are more than 40% of residues if the two compared fragments are same, only one of them should be retained. After removing the redundant fragments, 53 positive and 1028 negative fragments were obtained (Supplementary Table 1 (4.3MB, pdf) ).
2.2. Feature Constructions
As existing machine-learning algorithms cannot process sequence samples directly, therefore, to represent the biological sequence samples with an effective mathematical expression is an essential step [28]. In this work, bi-profile Bayes (BPB), AAindex, position-specific scoring matrix (PSSM), BLOSUM62 matrix and binary are utilized to convert protein fragments into vectors with different dimensions.
2.2.1. Bi-profile bayes (BPB)
BPB is also known as the bilateral Bayes algorithm which was proposed by Shao et al. [29]. It encodes positive and negative samples with the position information of amino acids. First, according to the known positive and negative samples, a frequency matrix FP of each amino acid at each position in the positive samples and a frequency matrix FN at each position of the negative samples are obtained. FP is calculated as follows:

where Pi,j is the frequency of i-th amino acid in j-th position for a given positive dataset. L is the length of a protein fragment. FN can be obtained in the same way.
2.2.2. Physicochemical and Biochemical Properties
AAindex is a database of numerical indices representing various physicochemical and biochemical properties of amino acids and the pairs of amino acids [30]. There are 566 entries in amino acid index database (http://www.genome.jp/dbget-bin/www_bfind?aaindex). In some instances, the values are not reported for all amino acids [30]. Thus, 14 common physicochemical properties (Supplementary Table 2 (4.3MB, pdf) ) from Amino Acid Index Database are selected for the characterization of amino acids.
2.2.3. Position-specific Scoring Matrix (PSSM)
To obtain information about sequential evolution, the position-specific scoring matrix [31] can be utilized. By combining matrix VPSSM obtained via two-sample t-test [32] with position weight matrixes FP and FN, the following PSSM matrix which is used for encoding can be constructed (the detailed process is shown in Supplementary S3 (4.3MB, pdf) ).

where Mi,j>0, can be calculated as follows:

If Mi,j>0, the probability that the i-th amino acid in the i-th position appears in the positive fragments is greater. Otherwise, it is more likely to be in the negative fragments.
2.2.4. BLOSUM62 Matrix
BLOSUM matrices have belonged to the most common substitution matrix series for protein homology search and sequence alignments [33]. The essential characteristics of protein evolution can be learned the from analysis of aligned protein sequences. Thus, a row of BLOSUM62 matrix is applied to represent an amino acid.
2.2.5. Binary
The small range of amino acids around the lipoylation site is the main sequence feature of lysine lipoylated fragment and has been shown to be useful for predicting lipoylation sites [34]. These amino acids can be represented by binary encoding. Therefore, each of the 21 amino acids (20 amino acids plus the pseudo amino acid “X”) are encoded as a 21-dimensional vector containing only 0 and 1.
2.3. Imbalance Data Processing
The imbalance of positive and negative samples in the training set has a massive impact on predictor performance. In the process of data preprocessing, over-sampling and under-sampling are the common means to deal with the unbalanced issues. Since only 53 positive samples are obtained, therefore, the oversampling method is preferred. SMOTE is a powerful oversampling method that has achieved great success in solving class imbalance [35]. The pseudo-code of the SMOTE algorithm is shown in Supplementary S4 (4.3MB, pdf) . The number of positive samples reaches 212 after SMOTE. Then, 50 positive and 50 negative samples are randomly selected as the independent test set.
2.4. Algorithm
Support Vector Machine (SVM) is a universal classification algorithm and it is widely used in the field of biological computing [36, 37]. The main idea of SVM is to find a hyperplane that maximizes the distance between classification boundary points. For a given training dataset  where n is the number of training set, yi represents sample label. Then the optimal hyperplane,

where  represents the weight vector, b denotes that the bias is constructed in division samples. The kernel function such as linear kernel function, polynomial function, radial basis function (RBF), and sigmoid kernel function [38] are needed to map data into high-dimension space. LIBSVM is utilized to construct the predictor. C-support vector classification (C-SVC) is chosen as a formulation, and RBF is chosen as the kernel function. The built predictor for lysine lipoylation with SVM is called LipoSVM.
2.5. Model Evaluation
In general, performance evaluations of predictors in statistical prediction are K-fold cross-validation test, jackknife test, and independent dataset test [37]. 10-fold cross-validation and an independent dataset test are chosen to validate these models. To obtain a reliable estimation, the 10-fold cross-validation is repeated 10 times.
Accuracy (Acc), specificity (Sp), sensitivity (Sn), area under the ROC curve (AUC) and Matthews Correlation Coefficient (MCC) are widely-accepted measurements [39]. In the following formula, accuracy indicates that the percentage of the test set should be correctly predicted. The specificity (also called the true negative rate) represents the proportion of negatives that are correctly predicted. The sensitivity (also called the true positive rate or the recall) measures the proportion of positives that are correctly predicted. The MCC is considered a balanced measure and can be used even if the size of the class is very different.
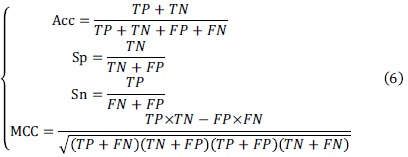
where TP denotes the number of true positive samples, TN denotes the number of true negative samples, FP denotes the number of falsepositive samples, FN denotes the number of false-negative samples.
3. RESULTS AND DISCUSSION
3.1. Performance of LipoSVM
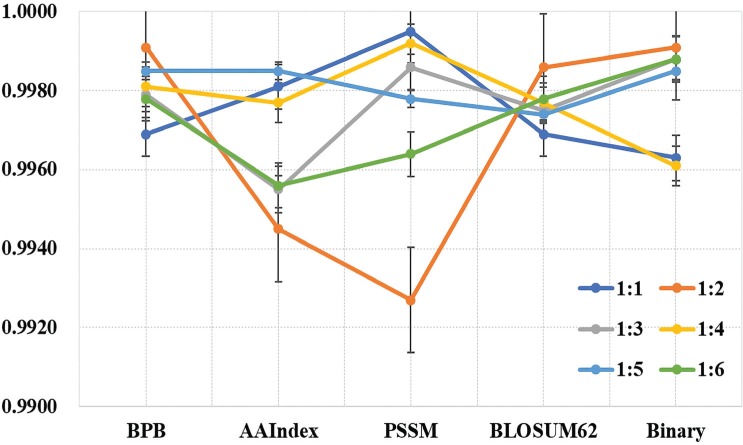
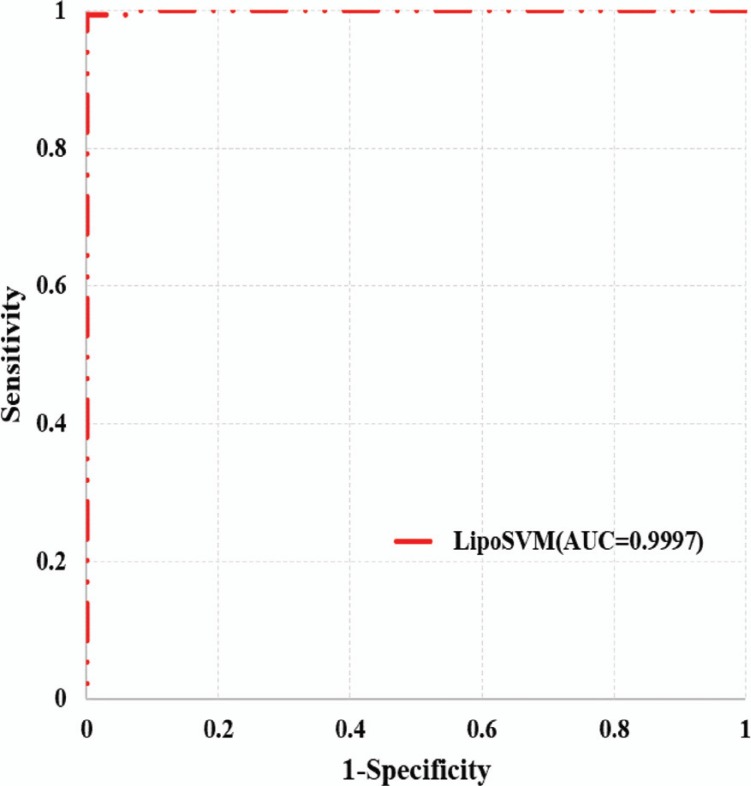
To obtain an optimal predictor, different parameters including window size, proportion of positive and negative samples, penalty factor and kernel parameter have been adjusted. The results show that when the window length is 17 (determined by the highest MCC value), the performance is optimal in 10-fold cross-validation (Table 1). Since the ratio of positive samples to negative samples in the training set is about 1:6, positive and negative samples from 1:1 to 1:6 as training sets were randomly selected. The results show that the variance of MCC between different encoding schemes is the smallest when the ratio is 1:5. However, when the ratio is 1:1, model with PSSM encoding scheme has better performance than others (Table 2, Fig. 2) which further indicates the necessity to mitigate the impact of category imbalance. Furthermore, the AUC value of independent test set reaches to 0.9997 which demonstrates the generalization performance of LipoSVM (Fig. 3).
Table 1. Performance of various window lengths in a 10-fold cross-validation.
| - | ACC (%) | Sp (%) | Sn (%) | MCC | AUC |
|---|---|---|---|---|---|
| 9 | 99.64 | 99.61 | 99.94 | 0.9889 | 0.9979 |
| 11 | 99.85 | 99.84 | 98.77 | 0.9931 | 0.9989 |
| 13 | 99.72 | 99.79 | 98.89 | 0.9819 | 0.9992 |
| 15 | 99.86 | 99.84 | 99.96 | 0.9959 | 0.9995 |
| 17 | 99.96 | 99.98 | 100.00 | 0.9990 | 0.9997 |
| 19 | 99.92 | 99.97 | 99.40 | 0.9965 | 0.9964 |
| 21 | 99.93 | 99.89 | 99.44 | 0.9968 | 0.9978 |
Table 2. Performance of models with different ratios and encoding schemes.
| Ratio | Encoding Schemes | ACC (%) | Sp (%) | Sn (%) | MCC | AUC |
|---|---|---|---|---|---|---|
| 1:1 | BPB | 99.84±0.21 | 99.88±0.25 | 99.81±0.28 | 0.9969±0.0041 | 0.9989±0.0031 |
| AAIndex | 99.91±0.14 | 99.88±0.23 | 99.94±0.18 | 0.9981±0.0028 | 0.9992±0.0008 | |
| PSSM | 99.98±0.18 | 99.96±0.09 | 99.99±0.24 | 0.9992±0.0013 | 0.9996±0.0027 | |
| BLOSUM62 | 99.84±0.25 | 99.91±0.18 | 99.69±0.50 | 0.9969±0.0050 | 0.9979±0.0012 | |
| Binary | 99.81±0.31 | 99.89±0.22 | 99.63±0.63 | 0.9963±0.0062 | 0.9989±0.0011 | |
| 1:2 | BPB | 99.96±0.12 | 99.97±0.09 | 99.94±0.19 | 0.9991±0.0028 | 0.9997±0.0012 |
| AAIndex | 99.75±0.39 | 99.99±0.02 | 99.26±1.16 | 0.9945±0.0087 | 0.9986±0.0018 | |
| PSSM | 99.67±0.19 | 99.51±0.28 | 99.98±0.11 | 0.9927±0.0042 | 0.9958±0.0013 | |
| BLOSUM62 | 99.94±0.13 | 99.99±0.03 | 99.81±0.40 | 0.9986±0.0029 | 0.9979±0.0014 | |
| Binary | 99.96±0.12 | 99.97±0.09 | 99.94±0.19 | 0.9991±0.0028 | 0.9995±0.0020 | |
| 1:3 | BPB | 99.92±0.08 | 99.96±0.08 | 99.81±0.28 | 0.9979±0.0020 | 0.9983±0.0017 |
| AAIndex | 99.83±0.11 | 99.98±0.06 | 99.38±0.39 | 0.9955±0.0029 | 0.9979±0.0032 | |
| PSSM | 99.95±0.12 | 99.93±0.14 | 99.99±0.04 | 0.9986±0.0027 | 0.9999±0.0021 | |
| BLOSUM62 | 99.91±0.23 | 99.99±0.04 | 99.63±0.92 | 0.9975±0.0062 | 0.9979±0.0012 | |
| Binary | 99.95±0.07 | 99.99±0.05 | 99.81±0.28 | 0.9988±0.0019 | 0.9994±0.0032 | |
| 1:4 | BPB | 99.94±0.08 | 99.98±0.04 | 99.75±0.30 | 0.9981±0.0026 | 0.9987±0.0025 |
| AAIndex | 99.92±0.11 | 99.99±0.02 | 99.63±0.56 | 0.9977±0.0035 | 0.9985±0.0013 | |
| PSSM | 99.97±0.05 | 99.97±0.06 | 99.99±0.09 | 0.9992±0.0015 | 0.9994±0.0011 | |
| BLOSUM62 | 99.92±0.11 | 99.99±0.04 | 99.63±0.56 | 0.9977±0.0035 | 0.9978±0.0015 | |
| Binary | 99.88±0.16 | 99.99±0.06 | 99.38±0.83 | 0.9961±0.0052 | 0.9972±0.0026 | |
| 1:5 | BPB | 99.96±0.07 | 99.99±0.04 | 99.81±0.28 | 0.9985±0.0024 | 0.9992±0.0015 |
| AAIndex | 99.96±0.08 | 99.99±0.05 | 99.75±0.49 | 0.9985±0.0030 | 0.9982±0.0036 | |
| PSSM | 99.94±0.05 | 99.92±0.06 | 99.99±0.04 | 0.9978±0.0018 | 0.9979±0.0012 | |
| BLOSUM62 | 99.93±0.10 | 99.99±0.10 | 99.57±0.62 | 0.9974±0.0037 | 0.9977±0.0035 | |
| Binary | 99.96±0.07 | 99.99±0.08 | 99.75±0.41 | 0.9985±0.0024 | 0.9987±0.0026 | |
| 1:6 | BPB | 99.95±0.04 | 99.99±0.12 | 99.63±0.30 | 0.9978±0.0018 | 0.9979±0.0019 |
| AAIndex | 99.89±0.14 | 99.98±0.04 | 99.38±0.87 | 0.9956±0.0053 | 0.9967±0.0024 | |
| PSSM | 99.91±0.00 | 99.90±0.00 | 99.99±0.04 | 0.9964±0.0000 | 0.9991±0.0012 | |
| BLOSUM62 | 99.95±0.10 | 99.99±0.09 | 99.63±0.74 | 0.9978±0.0043 | 0.9978±0.0033 | |
| Binary | 99.97±0.04 | 99.99±0.06 | 99.79±0.29 | 0.9988±0.0017 | 0.9983±0.0019 |
Fig. (2).
The values of MCC with different ratio data sets and encoding schemes. The X-axis represents different encoding schemes, the Y-axis has average values of MCC and the black bars represent standard error.
Fig. (3).
ROC curve of an independent test set on 100 samples which are randomly selected from positive and negative samples.
3.2. The Comparison of Different Features
In this work, five encoding schemes which contain evolutionary information, sequence location information, amino acid composition information, and physicochemical properties are applied to encode protein fragments. BPB is utilized to obtain a 34-dimensional feature vector, a 238-dimensional feature vector through 14 physicochemical properties from AAindex. Along with a 17-dimensional feature vector by PSSM and a 357-dimensional feature vector by binary or BLOSUM62 matrix encoding scheme. As shown in Table 2 and Fig. (2), the contribution of different encoding schemes to classifier performance is discrepant. Although the model is optimal under PSSM and 1:1 ratio, the variance of MCC between different ratios is the largest in this encoding method. In contrast, the variance of MCC of BLOSUM62 matrix is the smallest, followed by BPB, Binary and AAindex. The results show that it is pivotal to express the biological sequences with mathematical expressions that truly reflect their intrinsic correlation with prediction targets.
3.3. Analysis between Lysine Lipoylation and Non-Lipoylation Fragments
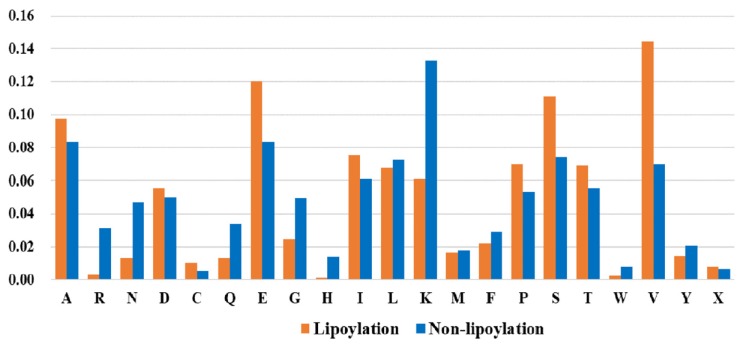
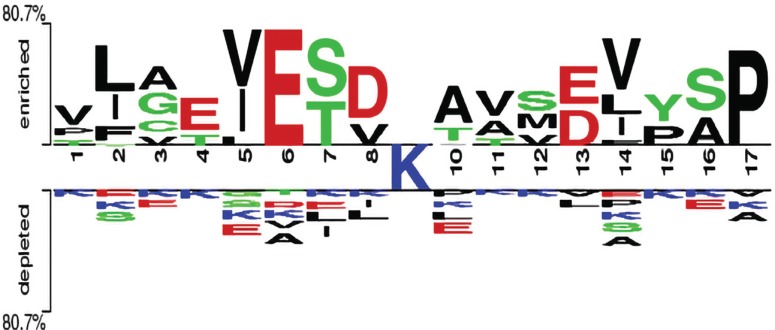
To intuitively understand the difference between positive and negative samples, the composition of various amino acids in lipoylated and non-lipoylated fragments is calculated (Fig. 4). Besides, Two Sample Logo [32] is used to analyze the occurrence of amino acide around lysine lipoylation and non-lipoylation (Fig. 5) sites. From Fig. (4), it can be observed that there is a certain difference in the percentage of the amino acids between the lipoylated and non-lipoylated fragments. Among the lipoylated protein fragments, valine (V) has the highest proportion, followed by glutamic (E) and Serine (S), while non-lipoylated protein fragments have the highest percentage of lysine (K), followed alanine (A) and glutamic (E). It is clear that valine (V) and lysine (K) ratios are significantly different in positive and negative samples, which are the key amino acids to distinguish positive and negative samples. From Fig. (5), it further illustrates that the compositional and positional information of lipoylated and non-lipoylated fragments show significant statistical difference.
Fig. (4).
The proportion of different amino acids between lysine lipoylation and non-lipoylation fragments. The X-axis represents different amino acids, and the Y-axis is the percentage of different amino acids.
Fig. (5).
Two Sample Logo (p<0.05) of compositional bias around the lysine lipoylation and non-lipoylation sites.
3.4. Comparison of Different Algorithms and the Existing Predictor LipoPred
To verify the effectiveness of the SVM algorithm, it was compared with other algorithms including K-Nearest Neighbor (KNN), Decision Tree, Logistic Regression (LR) and Naive Bayes. It can be seen from Table 3 that the model obtained by SVM is superior to the model obtained by other algorithms. The models trained by KNN are the worst because KNN only relies on several points in the nearest neighbor to classify. Essentially, there is no training process. In addition, this predictor is superior to the existing predictor LipoPred [40] which with ACC 0.9994 and MCC 0.9930.
Table 3. Performance of models with different algorithms and encoding schemes.
| Algorithms | Encoding Schemes | ACC (%) | Sp (%) | Sn (%) | MCC | AUC |
|---|---|---|---|---|---|---|
| SVM | BPB | 99.84±0.21 | 99.88±0.25 | 99.81±0.28 | 0.9969±0.0041 | 0.9989±0.0031 |
| AAIndex | 99.91±0.14 | 99.88±0.23 | 99.94±0.18 | 0.9981±0.0028 | 0.9992±0.0008 | |
| PSSM | 99.98±0.18 | 99.96±0.09 | 99.99±0.24 | 0.9992±0.0013 | 0.9996±0.0027 | |
| BLOSUM62 | 99.84±0.25 | 99.91±0.18 | 99.69±0.50 | 0.9969±0.0050 | 0.9979±0.0012 | |
| Binary | 99.81±0.31 | 99.89±0.22 | 99.63±0.63 | 0.9963±0.0062 | 0.9989±0.0011 | |
| KNN | BPB | 98.84±0.21 | 99.69±0.41 | 99.99±0.14 | 0.9969±0.0041 | 0.9996±0.0001 |
| AAIndex | 84.26±1.61 | 69.01±3.34 | 99.51±0.77 | 0.7198±0.0258 | 0.9603±0.0109 | |
| PSSM | 99.13±0.38 | 98.27±0.77 | 99.98±0.29 | 0.9829±0.0076 | 0.9959±0.0014 | |
| BLOSUM62 | 90.99±1.31 | 81.97±2.62 | 99.99±0.36 | 0.8336±0.0224 | 0.9818±0.0049 | |
| Binary | 83.46±1.64 | 66.91±3.28 | 99.98±0.63 | 0.7092±0.0261 | 0.9648±0.0122 | |
| Decision | BPB | 97.99±0.62 | 97.59±0.80 | 98.39±0.88 | 0.9600±0.0124 | 0.9804±0.0078 |
| Tree | AAIndex | 96.60±1.26 | 93.64±2.21 | 99.57±0.62 | 0.9339±0.0242 | 0.9674±0.0128 |
| PSSM | 97.31±0.63 | 96.23±0.97 | 98.39±1.00 | 0.9466±0.0127 | 0.9743±0.0085 | |
| BLOSUM62 | 97.72±0.96 | 95.86±1.89 | 99.57±0.39 | 0.9551±0.0184 | 0.9791±0.0087 | |
| Binary | 96.60±0.62 | 93.52±1.08 | 99.69±0.41 | 0.9339±0.0119 | 0.9684±0.0079 | |
| Logistic | BPB | 99.91±0.20 | 99.88±0.25 | 99.94±0.18 | 0.9981±0.0039 | 0.9993±0.0017 |
| Regression | AAIndex | 99.51±0.25 | 99.01±0.49 | 99.98±0.83 | 0.9902±0.0049 | 0.9989±0.0102 |
| PSSM | 99.54±0.21 | 99.07±0.41 | 99.97±0.48 | 0.9908±0.0041 | 0.9991±0.0076 | |
| BLOSUM62 | 99.72±0.29 | 99.44±0.58 | 99.98±0.62 | 0.9945±0.0058 | 0.9994±0.0076 | |
| Binary | 99.94±0.12 | 99.88±0.25 | 99.99±0.07 | 0.9988±0.0025 | 0.9996±0.0108 | |
| Naïve | BPB | 99.54±0.32 | 99.57±0.62 | 99.51±0.25 | 0.9908±0.0063 | 0.9995±0.0004 |
| Bayes | AAIndex | 98.73±0.59 | 99.81±0.28 | 97.65±1.16 | 0.9750±0.0116 | 0.9964±0.0043 |
| PSSM | 99.96±0.72 | 99.99±0.04 | 99.99±0.35 | 0.9991±0.0140 | 0.9994±0.0091 | |
| BLOSUM62 | 97.78±0.94 | 99.13±0.63 | 96.42±1.43 | 0.9560±0.0187 | 0.9949±0.0033 | |
| Binary | 98.86±0.59 | 99.99±0.14 | 97.72±1.17 | 0.9775±0.0115 | 0.9883±0.0061 |
CONCLUSION
Protein lysine lipoylation is a key post-transcriptional modification in cell regulation. To fully understand the molecular mechanisms of biological processes associated with lipoylation, a preliminary but critical step is to identify lipoylated substrate and corresponding lipoylation sites. It is desirable and necessary to achieve large-scale identification of lipoylated proteins through computational ways. To overcome this challenge, SMOTE is first implemented to balance positive and negative datasets. Subsequently, the different ratios of positive and negative samples are selected as training sets. By comparing different encoding schemes and ratios, the optimal predictor LipoSVM is obtained. The comparison with other classification algorithms and the existing predictor LipoPred for lysine lipoylation proves the effectiveness of LipoSVM. The results show that machine learning can replace redundant experimental methods to identify acetylation sites with high accuracy and throughput, which contributes to the research of lipoylation proteins.
ACKNOWLEDGEMENTS
We thanked Dr. Jun Ding who helped in data processing.
AUTHOR’S CONTRIBUTIONS
J.C and Y.Y conceived and designed the experiments. M.W, H.W, P.L and L.L performed the experiments and data analysis. M.W and Y.X wrote the paper. L.L developed the webserver. J.C, Y.Y and M.W revised the manuscript. All the authors read and agreed on the final manuscript.
ETHICS APPROVAL AND CONSENT TO PARTICIPATE
Not applicable.
HUMAN AND ANIMAL RIGHTS
No Animals/Humans were used for studies that are the basis of this research.
CONSENT FOR PUBLICATION
Not applicable.
AVAILABILITY OF DATA AND MATERIALS
The data supporting the findings of the article is available in the UniProt at http://www.uniprot.org/.
FUNDING
This work was supported by grants from the Natural Science Foundation of China (11671032).
CONFLICT OF INTEREST
The authors declare no conflict of interest, financial or otherwise.
SUPPLEMENTARY MATERIAL
Supplementary material is available on the publisher’s web site along with the published article.
REFERENCES
- 1.Wu M., Yang Y., Wang H., Xu Y. A deep learning method to more accurately recall known lysine acetylation sites. BMC Bioinformatics. 2019;20(1):49. doi: 10.1186/s12859-019-2632-9. [DOI] [PMC free article] [PubMed] [Google Scholar]
- 2.Doerig C., Rayner J.C., Scherf A., Tobin A.B. Post-translational protein modifications in malaria parasites. Nat. Rev. Microbiol. 2015;13(3):160–172. doi: 10.1038/nrmicro3402. [DOI] [PubMed] [Google Scholar]
- 3.Azevedo C., Saiardi A. Why always lysine? The ongoing tale of one of the most modified amino acids. Adv. Biol. Regul. 2016;60:144–150. doi: 10.1016/j.jbior.2015.09.008. [DOI] [PubMed] [Google Scholar]
- 4.Allfrey V.G., Faulkner R., Mirsky A.E. Acetylation and Methylation of Histones and Their Possible Role in the Regulation of Rna Synthesis. Proc. Natl. Acad. Sci. USA. 1964;51:786–794. doi: 10.1073/pnas.51.5.786. [DOI] [PMC free article] [PubMed] [Google Scholar]
- 5.Ambler R.P., Rees M.W. Epsilon-N-Methyl-lysine in bacterial flagellar protein. Nature. 1959;184:56–57. doi: 10.1038/184056b0. [DOI] [PubMed] [Google Scholar]
- 6.Goldstein G., Scheid M., Hammerling U., Schlesinger D.H., Niall H.D., Boyse E.A. Isolation of a polypeptide that has lymphocyte-differentiating properties and is probably represented universally in living cells. Proc. Natl. Acad. Sci. USA. 1975;72(1):11–15. doi: 10.1073/pnas.72.1.11. [DOI] [PMC free article] [PubMed] [Google Scholar]
- 7.Matunis M.J., Coutavas E., Blobel G. A novel ubiquitin-like modification modulates the partitioning of the Ran-GTPase-activating protein RanGAP1 between the cytosol and the nuclear pore complex. J. Cell Biol. 1996;135(6 Pt 1):1457–1470. doi: 10.1083/jcb.135.6.1457. [DOI] [PMC free article] [PubMed] [Google Scholar]
- 8.Smith D.L., Chen C.C., Bruegger B.B., Holtz S.L., Halpern R.M., Smith R.A. Characterization of protein kinases forming acid-labile histone phosphates in Walker-256 carcinosarcoma cell nuclei. Biochemistry. 1974;13(18):3780–3785. doi: 10.1021/bi00715a025. [DOI] [PubMed] [Google Scholar]
- 9.Rowland E.A., Snowden C.K., Cristea I.M. Protein lipoylation: an evolutionarily conserved metabolic regulator of health and disease. Curr. Opin. Chem. Biol. 2018;42:76–85. doi: 10.1016/j.cbpa.2017.11.003. [DOI] [PMC free article] [PubMed] [Google Scholar]
- 10.Tsai C.S., Burgett M.W., Reed L.J. Alpha-keto acid dehydrogenase complexes. XX. A kinetic study of the pyruvate dehydrogenase complex from bovine kidney. J. Biol. Chem. 1973;248(24):8348–8352. [PubMed] [Google Scholar]
- 11.Reed L.J. A trail of research from lipoic acid to alpha-keto acid dehydrogenase complexes. J. Biol. Chem. 2001;276(42):38329–38336. doi: 10.1074/jbc.R100026200. [DOI] [PubMed] [Google Scholar]
- 12.Cronan J.E., Zhao X., Jiang Y. Function, attachment and synthesis of lipoic acid in Escherichia coli. Adv. Microb. Physiol. 2005;50:103–146. doi: 10.1016/S0065-2911(05)50003-1. [DOI] [PubMed] [Google Scholar]
- 13.Wallis N.G., Perham R.N. Structural dependence of post-translational modification and reductive acetylation of the lipoyl domain of the pyruvate dehydrogenase multienzyme complex. J. Mol. Biol. 1994;236(1):209–216. doi: 10.1006/jmbi.1994.1130. [DOI] [PubMed] [Google Scholar]
- 14.Perham R.N. Swinging arms and swinging domains in multifunctional enzymes: catalytic machines for multistep reactions. Annu. Rev. Biochem. 2000;69:961–1004. doi: 10.1146/annurev.biochem.69.1.961. [DOI] [PubMed] [Google Scholar]
- 15.Spalding M.D., Prigge S.T. Lipoic acid metabolism in microbial pathogens. Microbiol. Mol. Biol. Rev. 2010;74(2):200–228. doi: 10.1128/MMBR.00008-10. [DOI] [PMC free article] [PubMed] [Google Scholar]
- 16.Payne K.A., Hough D.W., Danson M.J. Discovery of a putative acetoin dehydrogenase complex in the hyperthermophilic archaeon Sulfolobus solfataricus. FEBS Lett. 2010;584(6):1231–1234. doi: 10.1016/j.febslet.2010.02.037. [DOI] [PubMed] [Google Scholar]
- 17.Nichols B.J., Denton R.M. Towards the molecular basis for the regulation of mitochondrial dehydrogenases by calcium ions. Mol. Cell. Biochem. 1995;149-150:203–212. doi: 10.1007/BF01076578. [DOI] [PubMed] [Google Scholar]
- 18.Koukourakis M.I., Giatromanolaki A., Sivridis E., Gatter K.C., Harris A.L. Pyruvate dehydrogenase and pyruvate dehydrogenase kinase expression in non small cell lung cancer and tumor-associated stroma. Neoplasia. 2005;7(1):1–6. doi: 10.1593/neo.04373. [DOI] [PMC free article] [PubMed] [Google Scholar]
- 19.Chen J.Q., Russo J. Dysregulation of glucose transport, glycolysis, TCA cycle and glutaminolysis by oncogenes and tumor suppressors in cancer cells. Biochim. Biophys. Acta. 2012;1826(2):370–384. doi: 10.1016/j.bbcan.2012.06.004. [DOI] [PubMed] [Google Scholar]
- 20.Fan J., Kang H.B., Shan C., Elf S., Lin R., Xie J., Gu T.L., Aguiar M., Lonning S., Chung T.W., Arellano M., Khoury H.J., Shin D.M., Khuri F.R., Boggon T.J., Kang S., Chen J. Tyr-301 phosphorylation inhibits pyruvate dehydrogenase by blocking substrate binding and promotes the Warburg effect. J. Biol. Chem. 2014;289(38):26533–26541. doi: 10.1074/jbc.M114.593970. [DOI] [PMC free article] [PubMed] [Google Scholar]
- 21.Hellerstein M.K., Grunfeld C., Wu K., Christiansen M., Kaempfer S., Kletke C., Shackleton C.H. Increased de novo hepatic lipogenesis in human immunodeficiency virus infection. J. Clin. Endocrinol. Metab. 1993;76(3):559–565. doi: 10.1210/jcem.76.3.8445011. [DOI] [PubMed] [Google Scholar]
- 22.Baur A., Harrer T., Peukert M., Jahn G., Kalden J.R., Fleckenstein B. Alpha-lipoic acid is an effective inhibitor of human immuno-deficiency virus (HIV-1) replication. Klin. Wochenschr. 1991;69(15):722–724. doi: 10.1007/BF01649442. [DOI] [PubMed] [Google Scholar]
- 23.Munger J., Bennett B.D., Parikh A., Feng X.J., McArdle J., Rabitz H.A., Shenk T., Rabinowitz J.D. Systems-level metabolic flux profiling identifies fatty acid synthesis as a target for antiviral therapy. Nat. Biotechnol. 2008;26(10):1179–1186. doi: 10.1038/nbt.1500. [DOI] [PMC free article] [PubMed] [Google Scholar]
- 24.Rowland E.A., Greco T.M., Snowden C.K., McCabe A.L., Silhavy T.J., Cristea I.M. Sirtuin Lipoamidase Activity Is Conserved in Bacteria as a Regulator of Metabolic Enzyme Complexes. MBio. 2017;8(5):e01096–e17. doi: 10.1128/mBio.01096-17. [DOI] [PMC free article] [PubMed] [Google Scholar]
- 25.Mathias R.A., Greco T.M., Oberstein A., Budayeva H.G., Chakrabarti R., Rowland E.A., Kang Y., Shenk T., Cristea I.M. Sirtuin 4 is a lipoamidase regulating pyruvate dehydrogenase complex activity. Cell. 2014;159(7):1615–1625. doi: 10.1016/j.cell.2014.11.046. [DOI] [PMC free article] [PubMed] [Google Scholar]
- 26.Casteel J., Miernyk J.A., Thelen J.J. Mapping the lipoylation site of Arabidopsis thaliana plastidial dihydrolipoamide S-acetyltransferase using mass spectrometry and site-directed mutagenesis. Plant Physiol. Biochem. 2011;49(11):1355–1361. doi: 10.1016/j.plaphy.2011.07.001. [DOI] [PubMed] [Google Scholar]
- 27.Blagus R., Lusa L. SMOTE for high-dimensional class-imbalanced data. BMC Bioinformatics. 2013;14:106. doi: 10.1186/1471-2105-14-106. [DOI] [PMC free article] [PubMed] [Google Scholar]
- 28.Xu Y., Wen X., Wen L.S., Wu L.Y., Deng N.Y., Chou K.C. iNitro-Tyr: prediction of nitrotyrosine sites in proteins with general pseudo amino acid composition. PLoS One. 2014;9(8):e105018. doi: 10.1371/journal.pone.0105018. [DOI] [PMC free article] [PubMed] [Google Scholar]
- 29.Shao J., Xu D., Tsai S.N., Wang Y., Ngai S.M. Computational identification of protein methylation sites through bi-profile Bayes feature extraction. PLoS One. 2009;4(3):e4920. doi: 10.1371/journal.pone.0004920. [DOI] [PMC free article] [PubMed] [Google Scholar]
- 30.Kawashima S., Pokarowski P., Pokarowska M., Kolinski A., Katayama T., Kanehisa M. AAindex: amino acid index database, progress report 2008. Nucleic Acids Res. 2008;36(Database issue):D202–D205. doi: 10.1093/nar/gkm998. [DOI] [PMC free article] [PubMed] [Google Scholar]
- 31.Hasan M.A.M., Ahmad S., Molla M.K.I. iMulti-HumPhos: a multi-label classifier for identifying human phosphorylated proteins using multiple kernel learning based support vector machines. Mol. Biosyst. 2017;13(8):1608–1618. doi: 10.1039/C7MB00180K. [DOI] [PubMed] [Google Scholar]
- 32.Vacic V., Iakoucheva L.M., Radivojac P. Two Sample Logo: a graphical representation of the differences between two sets of sequence alignments. Bioinformatics. 2006;22(12):1536–1537. doi: 10.1093/bioinformatics/btl151. [DOI] [PubMed] [Google Scholar]
- 33.Hess M., Keul F., Goesele M., Hamacher K. Addressing inaccuracies in BLOSUM computation improves homology search performance. BMC Bioinformatics. 2016;17:189. doi: 10.1186/s12859-016-1060-3. [DOI] [PMC free article] [PubMed] [Google Scholar]
- 34.Li T., Du P., Xu N. Identifying human kinase-specific protein phosphorylation sites by integrating heterogeneous information from various sources. PLoS One. 2010;5(11):e15411. doi: 10.1371/journal.pone.0015411. [DOI] [PMC free article] [PubMed] [Google Scholar]
- 35.Nakamura M., Kajiwara Y., Otsuka A., Kimura H. LVQ-SMOTE - Learning Vector Quantization based Synthetic Minority Over-sampling Technique for biomedical data. BioData Min. 2013;6(1):16. doi: 10.1186/1756-0381-6-16. [DOI] [PMC free article] [PubMed] [Google Scholar]
- 36.Gnad F., Ren S., Choudhary C., Cox J., Mann M. Predicting post-translational lysine acetylation using support vector machines. Bioinformatics. 2010;26(13):1666–1668. doi: 10.1093/bioinformatics/btq260. [DOI] [PMC free article] [PubMed] [Google Scholar]
- 37.Ju Z., He J.J. Prediction of lysine propionylation sites using biased SVM and incorporating four different sequence features into Chou’s PseAAC. J. Mol. Graph. Model. 2017;76:356–363. doi: 10.1016/j.jmgm.2017.07.022. [DOI] [PubMed] [Google Scholar]
- 38.Gao L., Ye M., Lu X., Huang D. Hybrid Method Based on Information Gain and Support Vector Machine for Gene Selection in Cancer Classification. Genomics Proteomics Bioinformatics. 2017;15(6):389–395. doi: 10.1016/j.gpb.2017.08.002. [DOI] [PMC free article] [PubMed] [Google Scholar]
- 39.Xu Y., Ding J., Wu L.Y., Chou K.C. iSNO-PseAAC: predict cysteine S-nitrosylation sites in proteins by incorporating position specific amino acid propensity into pseudo amino acid composition. PLoS One. 2013;8(2):e55844. doi: 10.1371/journal.pone.0055844. [DOI] [PMC free article] [PubMed] [Google Scholar]
- 40.Ju Z., Wang S.Y. Predicting lysine lipoylation sites using bi-profile bayes feature extraction and fuzzy support vector machine algorithm. Anal. Biochem. 2018;561-562:11–17. doi: 10.1016/j.ab.2018.09.007. [DOI] [PubMed] [Google Scholar]
Associated Data
This section collects any data citations, data availability statements, or supplementary materials included in this article.
Supplementary Materials
Supplementary material is available on the publisher’s web site along with the published article.
Data Availability Statement
The data supporting the findings of the article is available in the UniProt at http://www.uniprot.org/.


