Abstract
Road dust was investigated within Philadelphia, a major United States city with a long history of industrial activities, in order to determine pollution levels. Almost all of the investigated minor elements were enriched relative to the continental crust. Furthermore, mean concentrations of Cr, Co, Cu, and Pb were high compared to those reported in cities in other countries. Lead pollution should be investigated further in Philadelphia, where 8 of the 30 sample sites, including those heavily trafficked by civilians, were at or above the EPA’s child safety threshold for Pb in bare soil. High Spearman correlations between Zn and Cu, Zn and Cr, Cu and Cr, and Sn and V, as well as factor analysis of minor elements suggest that the primary sources of these elements were anthropogenic. Potential sources included the breakdown of alloys, non-exhaust traffic emissions, paint, smelting, and industry. We found that higher organic content in road dust may be related to higher traffic densities, which could be due to tire-wear particles. Additionally, higher mean concentrations of Fe, Cr, Cu, and Zn were found at sites with elevated traffic densities. Land use impacted some of the elements not influenced by traffic density, including Co, Sn, and Pb. Bulk mineral content was similar across different land uses and traffic densities and, thus, did not appear to be influenced by these factors. Our research emphasized the complexity of road dust and utilized a more comprehensive approach than many previous studies. This study established fundamental groundwork for future risk assessment in Philadelphia, as it identified several key pollutants in the city. Overall, this assessment serves as an informative reference point for other formerly heavily industrialized cities in the United States and abroad.
Keywords: heavy-metal pollution, industrial legacy, anthropogenic influence, land use, traffic
1. Introduction:
Currently, over half of the world’s population resides in urban areas (United Nations, 2012); trends suggest this may climb to 70% by 2050 (United Nations, 2014). The ever-expanding urban space is predicted to increase environmental pollution, creating potential human health hazards (Lim et al., 2012). Road dust can be used as an environmental proxy for exposure to elements considered toxic to human health (Li et al., 2001).
Urban road dust consists of natural and anthropogenic particles that accumulate on impervious outdoor surfaces in metropolitan environments (Shi et al., 2010). Also referred to as urban road sediment or street dust, this medium exists at the interface between the atmosphere and soils, acting as both source and sink for pollutants (Christoforidis and Stamatis, 2009). Various geochemical techniques have been used in road dust studies to determine urban pollution levels, its role as a pollutant accumulator, and its potentially toxic nature (e.g., Li et al., 2016; Robertsen et al., 2003; Wei et al., 2015). Primary sources for road dust include industrial activity, non-exhaust traffic emissions (road and rail traffic), local soils, and local geologic formations (Pant and Harrison, 2013; Thorpe and Harrison, 2008; Varrica et al., 2003).
People interact with urban road dust through three primary pathways: ingestion, epidermal contact, and inhalation (Ferreira-Baptista and De Miguel, 2005). Road dust particles smaller than 100 μm may contribute to air pollution after being resuspended by wind or passing traffic (Zhao et al., 2014). These particles can be inhaled and, if small enough, deposited in the lungs, posing a potential threat to the respiratory system (Brown et al., 2013; Kastury et al., 2017). In general, finer particles are more dangerous because, after inhalation, they travel farther into the human respiratory tract, are more difficult for the body to clear, and may be more bioavailable (Kastury et al., 2017). Ingestion was generally found to be the highest risk pathway for road dust exposure (Shi et al., 2011).
In the past, road dust has been collected for analysis throughout major cities in various settings, including areas of high and low traffic, generally utilizing vacuum systems or polyethylene brushes (e.g., Wei and Yang, 2010; Zhao et al., 2016). Worldwide road dust studies, predominantly those carried out in China, generally assess bulk heavy metal concentrations (e.g., Hu et al., 2011; Li et al., 2001; Lu et al., 2009; Shi et al., 2008; Wei et al., 2015). These studies typically investigate a single component of road dust using specific analytical techniques. Common techniques to compare bulk concentrations of heavy metals in road dust to regulatory standards are inductively coupled plasma-optical emission spectrometry (ICP-OES), inductively coupled plasma-mass spectrometry (ICP-MS), and atomic absorption spectrometry (AAS) (Wei and Yang, 2010). Many studies of urban road dust use these data to create risk indices to assess the impact of environmental pollution (e.g., Shi et al., 2011; Zhao et al., 2016).
Philadelphia, Pennsylvania is the sixth largest city in the United States (U.S.) with a population of over 1.5 million people. The average temperature of the city is 12.25°C, with an average annual precipitation of 105.28 cm and a dominant wind direction of SW (NOAA, 2019).
Given the city’s long and varied industrial history, the accumulation of harmful elements, such as lead (Pb), in road dust are a concern due to their potential health implications. Childhood Pb exposure can result in impaired cognition, diminished intellectual and academic abilities, and higher rates of neurobehavioral disorders (Council on Environmental Health, 2016; Philadelphia Childhood Lead Poisoning Prevention Advisory Group, 2017). The Council on Environmental Health (2016) advocates that the most effective method for combating this problem is to remediate Pb sources. In Philadelphia, two major Pb sources are leaded paint in old buildings and industrial activity, both of which likely contribute to road dust (Lusby et al., 2015). One of the prominent industrial sources of Pb were Pb smelters; at one point, Philadelphia had 36 Pb smelters—which was more than any other city in the U.S. (Ruderman et al., 2017). Lead smelters became important in the 19th century and, with the rise of industrialization, were unregulated (Garg and Landrigan, 2002). The smelters became more vital in the 20th century as Pb was in high demand for its use in paint, gasoline, Pb-acid batteries, plumbing pipes, and cable wires (Graney et al., 1995; Vermillion et al., 2005). Philadelphia has a complex history of industrial activity, including paint production, chemical processing, locomotive works, textile production, shipbuilding and maintenance, metal working, and tanning (e.g., Scranton, 1989). These activities could have left traces of contamination in local environmental media such as soils (e.g., Lusby et al., 2015). Soils may contribute residues from the previously mentioned industries to road dust if they are disturbed. After World War II, the city’s industrial sector declined. Modern Philadelphia features a primarily information- and service-based economy; current key industrial activities include the oil-refinery close to the Philadelphia International Airport and pharmaceutical development (Select Greater Philadelphia Council, 2016).
The local geologic formations, however, likely contribute to the city’s road dust as well. The Philadelphia metropolitan area is underlain by three principal geological formations: the Trenton Gravel, the Pennsauken and Bridgeton Formations, and the Wissahickon Formation (WF) (Fig. 1). The WF is primarily composed of oligoclase-mica schist (quartz, micas and plagioclase feldspars) and hornblende gneiss (hornblende, quartz, and feldspars) (Weiss, 1949), but serpentinite (predominantly antigorite, lizardite, and chrysotile, some olivine and pyroxene) and pegmatite (chiefly quartz, feldspars, and micas) occur in some outcrops (Weiss, 1949). The Pennsauken and Bridgeton Formations and the Trenton Gravel contain quartz sand (Paulachok, 1991). The WF has been quarried for decades by local industry, was extensively used in construction within the city, and has exposures throughout Philadelphia.
Fig. 1.
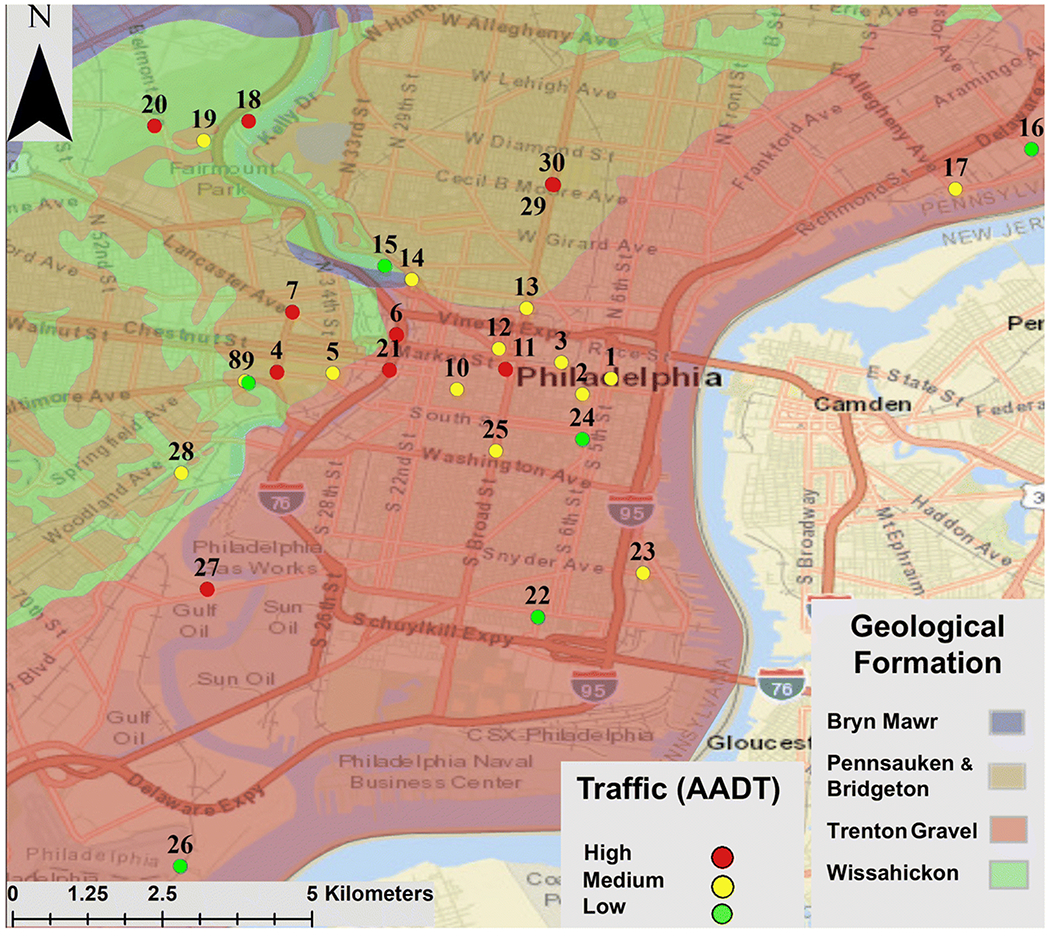
Locations of road dust sampling sites in Philadelphia. Overlay colors are the local geological formations according to the Pennsylvania Geologic Survey (2018). Map created in ArcGIS (Esri, 2017)
In this paper, we report data for the mineralogical and chemical composition, particle size, and organic content of road dust in Philadelphia. This suite of analyses allowed us to assess the composition of road dust in a more comprehensive manner than most previous studies. Furthermore, this investigation helped to contextualize previous road dust studies of historically industrial American cities (e.g., Legalley and Krekeler, 2013). Our approach considered several potential sources of road dust, including the local bedrock and industrial activities. Additionally, we investigated road dust’s compositional relationship to different traffic densities and land uses. This research approach built on previous studies, including those of other U.S. cities such as Middletown, Ohio (Dietrich et al., 2018). By adding mineral phases, organic content, and land use to this comparison, our study expands the scope of previous road dust investigations and ultimately represents an environmental hazard investigation of bulk road dust in Philadelphia.
2. Methods:
2.1. Sample Sites:
Thirty sample locations within the metropolitan area of Philadelphia were selected for this study (Fig. 1; Table 1). Sites were classified by the nature of their surroundings and average annual daily traffic (AADT) in order to explore the potential impact of current land use and traffic density on road dust composition (data from Delaware Valley Regional Planning Commission (DVRPC), 2016). We distinguished between Commercial (n=8), Industrial (n=5), Park (n=6), Residential (n=5), and Mixed use (n=6) settings. Businesses and storefronts were classified as Commercial; factories and similar locales as Industrial; green spaces as Parks; living areas as Residential, and all other sites, including university settings and some higher-traffic streets, as Mixed. Sites were separated into three traffic density categories: Low Traffic (n=6) (ADDT<6,000), Medium Traffic (n=14) (AADT 6,000-13,000), and High Traffic (n=10) (ADDT>13,000). Below, the thirty samples will be collectively referred to as “Philadelphia road dust” (PRD).
Table 1.
Sample site coordinates, brief site description, and mineral phases identified (wt%) at each site.
| Sample Site | Coordinates | Site Description | Mineral Phases (wt%) |
|---|---|---|---|
| 1 | 39.950459, −75.148089 | Side road - near Liberty Park | Quartz (80%), Dolomite (6%), Albite (11%), Almandine (3%) |
| 2 | 39.948087, −75.154043 | Commercial road | Quartz (73%), Dolomite (9%), Anorthite (13%), Calcite (5%) |
| 3 | 39.953268, −75.156346 | Commercial road | Quartz (66%), Dolomite (5%), Calcite (1%), Labradorite (24%), Phlogopite (4%) |
| 4 | 39.952216, −75.199178 | University/city road | Quartz (76%), Dolomite (4%), Albite (12%), Halloysite (8%) |
| 5 | 39.951284, −75.190590 | University road | Quartz (61%), Dolomite (1%), Andesine (17%), Diopside (21%) |
| 6 | 39.957017, −75.181871 | Near main transport station - off highway | Quartz (80%), Dolomite (7%), Anorthite (13%) |
| 7 | 39.960278, −75.197171 | Commercial road | Quartz (76%), Dolomite (7%), Anorthite (11%), Calcite (1%), Phlogopite (5%) |
| 8 | 39.949890, −75.204166 | Road near trolley portal | Quartz (87%), Dolomite (2%), Anorthite (9%), Halloysite (2%) |
| 9 | 39.949548, −75.203931 | Trolley portal | Quartz (98%), Annite (2%) |
| 10 | 39.948661, −75.170994 | Residential - near Rittenhouse apartments | Quartz (84%), Dolomite (3%), Anorthite (13%) |
| 11 | 39.951630, −75.164241 | Near City hall | Quartz (80%), Dolomite (2%), Anorthite (18%) |
| 12 | 39.954645, −75.165146 | Central Philadelphia road | Quartz (71%), Dolomite (4%), Albite (7%), Biotite (18%) |
| 13 | 39.962053, −75.161513 | Commercial road | Quartz (78%), Dolomite (5%), Anorthite (13%), Magnetite (4%) |
| 14 | 39.965588, −75.179119 | Near art museum - Fairmount Park | Quartz (71%), Dolomite (9%), Anorthite (18%), Hematite (2%), Muscovite (<1%) |
| 15 | 39.966483, −75.181890 | Behind art museum - Fairmount Park | Quartz (75%), Dolomite (7%), Anorthite (17%), Halloysite (1%) |
| 16 | 39.984811, −75.085894 | Industrial road - Port Richmond | Quartz (88%), Anorthite (11%), Halloysite (1%) |
| 17 | 39.978746, −75.097185 | Industrial road - Port Richmond | Quartz (56%), Dolomite (4%), Andesine (17%), Diopside (23%) |
| 18 | 39.988749, −75.203374 | Fairmount Park - along Schuylkill River | Quartz (77%), Dolomite (8%), Anorthite (14%), Hematite (1%) |
| 19 | 39.985714, −75.210803 | Fairmount Park - inside park | Quartz (70%), Dolomite (8%), Anorthite (22%), Illite (<1%) |
| 20 | 39.989330, −75.218534 | Fairmount Park - inside park | Quartz (66%), Dolomite (21%), Albite (10%), Calcite (1%), Hematite (2%) |
| 21 | 39.951538, −75.181789 | Walnut Street Bridge | Quartz (69%), Dolomite (9%), Albite (11%), Augite (8%), Hematite (3%) |
| 22 | 39.914883, −75.156579 | South Philadelphia | Quartz (58%), Dolomite (7%), Anorthite (14%), Andesine (21%) |
| 23 | 39.921158, −75.144703 | South Philadelphia business | Quartz (70%), Dolomite (7%), Anorthite (23%), lllite (<1%) |
| 24 | 39.941356, −75.154234 | Residential road | Quartz (84%), Dolomite (5%), Anorthite (11%) |
| 25 | 39.940093, −75.166221 | Commercial road | Quartz (83%), Dolomite (5%), Anorthite (12%) |
| 26 | 39.877175, −75.213773 | Industrial road | Quartz (80%), Dolomite (8%), Albite (12%), lllite (<1%) |
| 27 | 39.918472, −75.209211 | Industrial road | Quartz (81%), Dolomite (5%), Anorthite (14%) |
| 28 | 39.936328, −75.213334 | Industrial road | Quartz (51%), Dolomite (3%), Anorthite (10%), Actinolite (3%), Biotite (14%), Diopside (19%) |
| 29 | 39.979679, −75.157660 | High traffic road (northbound) - near University | Quartz (81%), Dolomite (4%), Anorthite (15%) |
| 30 | 39.979679, −75.157660 | High traffic road (southbound) - near University | Quartz (78%), Dolomite (3%), Anorthite (9%), Illite-Montmorillonite (10%) |
| Asphalt | 39.949890, −75.204166 | Road itself sampled | Quartz (7%). Dolomite (23%). Albite (70%) |
2.2. Sample Collection:
Collection took place between 3:00 a.m. and 8:00 a.m. over a five-week period beginning in October 2016. All sampling took place before roads were winterized in order to avoid the presence of winter weather materials in PRD. Samples were collected using a bag-less hand-held vacuum (V-6 Trigger, Dyson, Inc.) held at street level for 7.5 minutes at each site; comparable studies also utilized vacuum systems (Duong and Lee, 2011; Faiz et al., 2009; Zhao and Li, 2013; Zhao et al., 2016). The Dyson’s centrifugal technology allowed the vacuum to gather small particles with high efficiency. Samples were collected from a rectangular area, which measured 3 m by the curb-to-curb road width. We vacuumed across the full width of the road to account for potential variation in size and composition of road dust present at the curbs compared to the crown of the road (Zhu et al., 2008). Samples were collected a minimum of seven days after the last rain event (Tanner et al., 2008) to allow particles to accumulate (Egodawatta et al., 2009). Immediately after collection, samples were transferred from the vacuum’s dust bin into anti-static polyethylene bags, which were then sealed and stored in the laboratory. All samples were air dried at room temperature, in the laboratory, prior to analysis and sample weight was recorded (Table S1) (Padoan et al., 2017).
2.3. Sieving and Loss on Ignition:
All samples were dry-sieved using an 841-μm stainless steel hand-held sieve utilizing regular, circular motions. Particles that passed through the sieve were collected for analysis. This size range was used because previous studies found that most road dust particles are <850 μm across (Duong and Lee, 2011); in addition, the 841-μm mesh size is a standard sieve opening (No. 20 mesh). Furthermore, this sieve size specifically allowed us to remove most visible coarse debris, mainly litter, from our collected samples for bulk assessment. The size range chosen included particles that may have health implications (e.g., Christoforidis and Stamatis, 2009). Organic matter content was estimated using loss on ignition (LOI). Samples (2 g) were weighed using a Sartorius analytical balance before and after being placed in a muffle furnace (Thermolyne model 6000) at 500°C for 8 hours (Ball, 1964). All subsequent analyses were performed on the LOI residue; measured values were reported on the basis of total collected dust weight unless otherwise noted. While it is possible that a small portion of some metals were lost with LOI (e.g., Hg), most did not vaporize given that they (e.g., Cd, Pb, and Zn) were expected to be found primarily as metals with boiling points above 500°C or as oxides with even higher boiling points. Overall, we did not expect to find measurable concentrations of Hg due to the lack of local sources and our instrument’s detection limits. Thus, the overall effect was not significant to the interpretation of the study.
2.4. Particle Size and Volume:
Particle size and distribution were estimated via laser diffraction using a Beckman-Coulter LS 13 320 Particle Size Analyzer following standard operating procedures with sonication, debubbling, degassing, and rinsing. Particle obscuration for each sample was between 25% and 35% to ensure accurate results.
2.5. X-ray Diffraction (XRD) and X-ray Fluorescence:
Samples were powdered for four minutes prior to analysis using a vibratory Ball Mill (Spex) fitted with tungsten carbide vials. Portions of each powdered sample were analyzed with a Panalytical Epsilon-1 Benchtop X-ray Fluorescence Spectrometer. These data were utilized to help identify elements of interest for ICP-OES, for initial statistical analysis, and to provide a first estimate of the total elemental composition (Table S2).
Samples were then packed into 16-mm diameter holders. A Panalytical X’Pert Powder X-ray Diffractometer, equipped with an X’Celerator detector, spinning stage, and a Co-Kα radiation source set to 40 kV and 40 mA, was used to record the XRD pattern of each sample from 5°–80° 2θ. The Panalytical software program Highscore Plus, equipped with the International Centre for Diffraction Data’s Powder Diffraction Files-4 database, was used to identify the major phases present. Weight percentage of the mineral phases were estimated using the semi-quantitative reference intensity ratio technique (Hubbard and Snyder, 1988).
2.6. Inductively Coupled Plasma-Optical Emission Spectrometry:
In preparation for ICP-OES, a hydrochloric/nitric acid digest was used to dissolve elements that could become environmentally available (comparable to Method-3050B; United States Environmental Protection Agency (USEPA), 1996); this was similar to mixtures (aqua regia) used in previous studies (e.g., Duong and Lee, 2011; Li et al., 2013; Padoan et al., 2017). This digest was chosen because this study focused on the potential environmental hazard of PRD. Approximately 0.3 g of each sample was combined with 8 mL of nitric acid and 2 mL of hydrochloric acid and subsequently heated to 95°C for two hours.
Following digestion, samples were diluted to 500 mL and analyzed via ICP-OES (Genesis, Spectro GMBH). Seventeen pre-selected elements of interest—K, Ca, Na, Zn, Cu, P, Al, Fe, Pb, Ti, Sn, Sb, Cd, Cr, Hg, Co, and V—were analyzed. Six calibration standards (80 ppm, 40 ppm, 20 ppm, 10 ppm, 5 ppm, 1 ppm) and blank standards were created for each element using commercial element standards (SPEX CertiPrep). At least one standard reference material (Montana Soil 2710a; NIST, 2010) was included in each digestion run.
2.7. Statistical Analysis:
Only elements detected at more than half of the sample sites were included in the statistical analyses. Elements were analyzed separately by two groups, major and minor. The major elements Na, Al, P, K, Ca, Ti, and Fe were grouped as they are typical crustal elements that may have primarily geologic sources (Varrica et al., 2003). The minor elements V, Cr, Co, Cu, Zn, Cd, Sn, Sb, Hg, and Pb were combined as they likely have anthropogenic sources (Keshavarzi et al., 2015; Li et al., 2013). Descriptive statistics (mean, median, standard deviation, kurtosis, skewness, and range) were reported to give an overview of the elemental concentrations present in PRD. In this study, mean elemental concentrations were used for comparison with previous road dust investigations. The normality of element distributions was determined using a Shapiro-Wilk test. All elements, aside from Ti, were non-normally distributed. As both normally and non-normally distributed data were present, Spearman’s correlation coefficients were calculated to determine the correlations between the concentrations of elements.
Exploratory factor analysis, a multivariate assessment, followed by a varimax rotation was used to analyze the correlation in bulk elemental concentration of the samples. Below, this was simply referred to as factor analysis for simplicity. Similar studies have also utilized factor analysis (e.g., Žibret et al., 2013). The factors were estimated using the iterated principal factor method based on the Spearman correlation matrices directly instead of using the concentrations on the original scale because most elements were non-normally distributed. The enrichment of PRD relative to the continental crust and to the WF was calculated as the elemental concentration in PRD divided by the elemental concentration in the crust (or WF). The enrichment relative to the continental crust was utilized as a general point of comparison in order to potentially distinguish the sources of elements as being mainly geologic or anthropogenic.
3. Results:
3.1. Mineral Phases:
Nineteen mineral phases were found in PRD (Table 1). XRD results demonstrated that quartz (SiO2), dolomite (CaMg(CO3)2), and anorthite (CaAl2Si2O8) were present at a majority of the sample sites (Table 1), with quartz being ubiquitous. Of the 30 sample sites, 28 contained dolomite, and 20 contained anorthite, a plagioclase feldspar. Albite (NaAlSi3O8), another plagioclase feldspar, was found at 6 of the 30 sample sites. Quartz, dolomite, and plagioclase feldspars represented the dominant mineralogic components, accounting for ≥ 64 wt% of the crystalline material in PRD (Table 1; Fig. 2). The clay minerals illite ((K, H3O)(Al,Mg,Fe)2(Si,Al)4O10[(OH)2,(H2O)]) and halloysite (Al2Si2O5(OH)4) were each found at 4 different sample sites. Other identified mineral phases included magnetite (Fe3O4) and hematite (Fe2O3). Muscovite (KAl2(AlSi3O10)(F,OH)2) was found at one sample site and was distinguished from illite as muscovite flakes were visible within the individual sample.
Fig. 2.
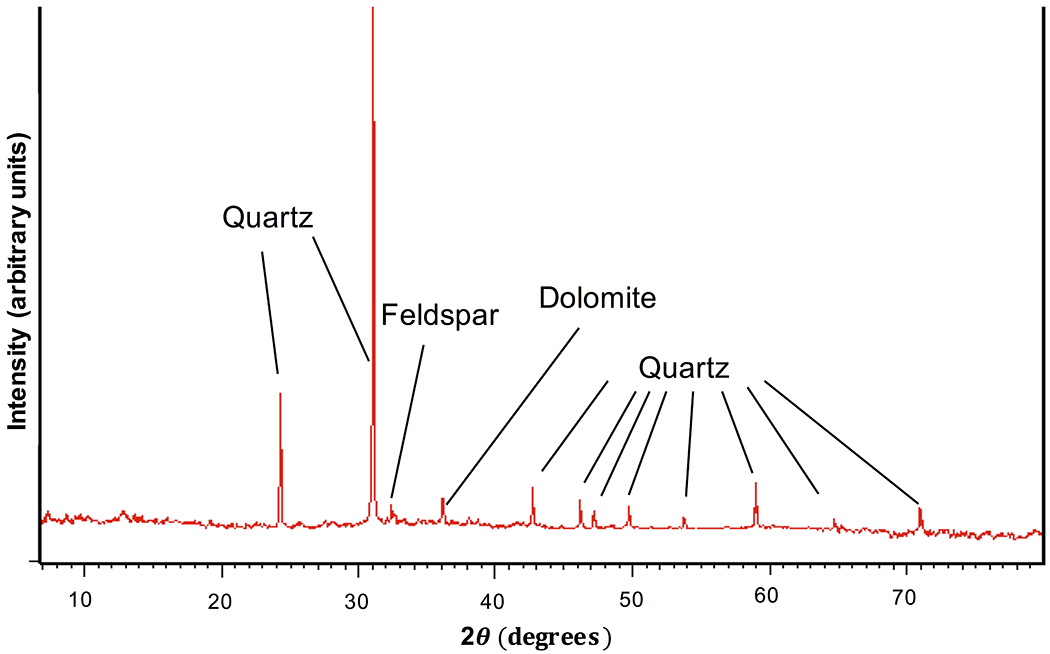
Representative diffractogram showing the most common mineral phases that were identified via X-ray diffraction. Example shown is from site 24
3.2. Elemental Composition:
Of the major elements, the highest concentrations were observed for Al, Ca, and Fe (0.78, 2.58, and 4.41 wt%, respectively) (Table 2). Mean and median values were similar for each of the major elements except for Fe, with a mean value of 4.41 wt% compared to a median 3.97 wt%.
Table 2.
Descriptive statistics of the selected major elements found in PRD, reported on the basis of total collected dust weight (in wt%). IQR stands for interquartile range.
| Element | Mean | Median | Standard Deviation | Standard Error | Kurtosis | Skewness | Min | Max | IQR |
|---|---|---|---|---|---|---|---|---|---|
| Na | 0.20 | 0.17 | 0.09 | 0.02 | 0.57 | 1.02 | 0.05 | 0.41 | 0.09 |
| Al | 0.78 | 0.76 | 0.22 | 0.04 | 3.00 | 0.15 | 0.13 | 1.34 | 0.14 |
| P | 0.07 | 0.07 | 0.02 | 0.00 | 2.03 | -1.16 | 0.02 | 0.09 | 0.01 |
| K | 0.39 | 0.37 | 0.16 | 0.03 | 8.12 | 1.86 | 0.09 | 1.03 | 0.10 |
| Ca | 2.58 | 2.43 | 0.95 | 0.17 | 4.34 | 0.77 | 0.05 | 5.70 | 0.71 |
| Ti | 0.07 | 0.07 | 0.03 | 0.00 | 1.67 | 0.32 | 0.01 | 0.14 | 0.03 |
| Fe | 4.41 | 3.97 | 2.41 | 0.44 | 3.06 | 1.42 | 0.56 | 12.34 | 2.56 |
The highest mean values for minor elements, 588 and 577 ppm, were observed for Zn and Sn, respectively (Table 3). The mean concentration of Pb in PRD was 516 ppm. Copper, Zn, Sn and Pb had large differences in mean and median values, as well as the highest standard deviations from the mean. The elements Cd, Sb, and Hg were all below the detection limit of the ICP-OES and thus not discussed in the manuscript herein (Table S1).
Table 3.
Descriptive statistics of selected minor elements found in PRD, reported on the basis of total collected dust weight (in ppm). IQR stands for interquartile range. Cadmium, Sb, and Hg were belowthe detection limit (1.5, 30, and 16.5 ppm, respectively).
| Element | Mean | Median | Standard Deviation | Standard Error | Kurtosis | Skewness | Min | Max | IQR |
|---|---|---|---|---|---|---|---|---|---|
| V | 42 | 37 | 31 | 6 | 1 | 1 | <3 | 121 | 41 |
| Cr | 119 | 82 | 120 | 22 | 12 | 3 | 19 | 645 | 116 |
| Co | 355 | 331 | 214 | 39 | 6 | 2 | 103 | 1131 | 238 |
| Cu | 374 | 261 | 349 | 64 | 3 | 2 | 16 | 1478 | 315 |
| Zn | 588 | 349 | 677 | 124 | 8 | 3 | 53 | 3035 | 391 |
| Sn | 577 | 235 | 1661 | 303 | 29 | 5 | <120 | 9339 | 126 |
| Pb | 516 | 202 | 1111 | 203 | 25 | 5 | <45 | 6147 | 373 |
3.3. Elemental Composition by Land Use:
The mean concentrations of the major elements Al, P, and Ti were similar across different land uses (Fig. 3a, Fig. 3b), whereas mean Ca concentrations varied somewhat, with the highest value recorded in Commercial areas (3.04 wt%). The greatest mean concentration of K was in Park settings (0.47 wt%). The highest mean concentration of Fe was also observed at Park sites (6.29 wt%), whereas the lowest value was found in Residential settings (2.09 wt%). The highest mean Na concentration was at Mixed land use sites (0.25 wt%), and the lowest mean concentration (0.12 wt%) was at Residential sites. Residential sites had the lowest mean concentrations for all of the major elements.
Fig. 3a.
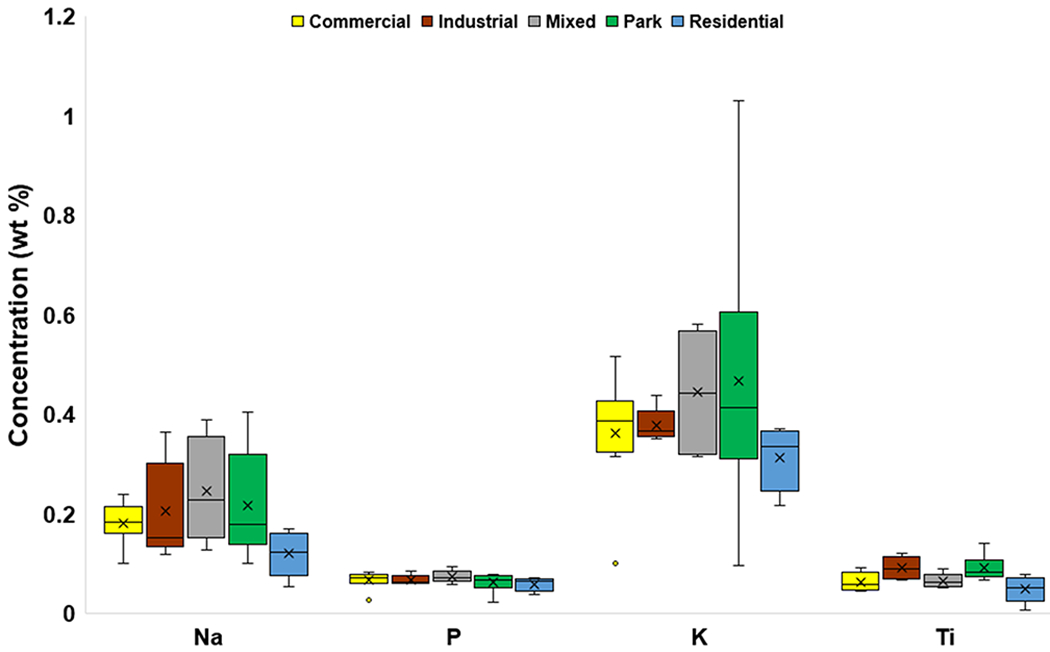
Box and whisker plots of major element (Na, P, K, Ti) concentrations (wt%) categorized by land use. The x represents mean value, whereas the horizontal line is median value. All points outside of the box (IQR) and whiskers (min. and max. values – excluding outliers) are outliers (1.5x below the 1st quartile or 1.5x above the 3rd quartile)
Fig. 3b.
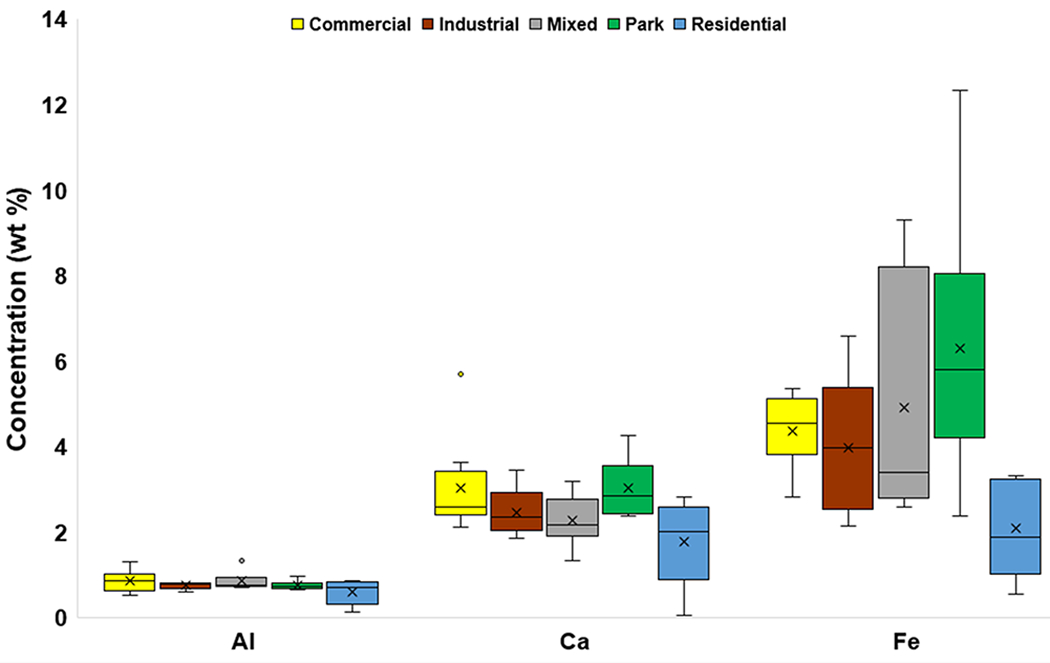
Box and whisker plots of major element (Al, Ca, Fe) concentrations (wt%) categorized by land use. The x represents mean value, whereas the horizontal line is median value. All points outside of the box (IQR) and whiskers (min. and max. values – excluding outliers) are outliers (1.5x below the 1st quartile or 1.5x above the 3rd quartile)
Mean concentrations of V were similar across different land uses, whereas those of Cr, Co, Cu, Zn, Sn, and Pb changed (Fig. 3c). The highest mean concentrations of Co and Pb (489 and 1,575 ppm, respectively) were observed in Residential and Industrial areas, respectively, whereas they were lowest in Parks (262 ppm) for Co and lowest in Mixed areas for Pb (256 ppm). The highest mean concentrations of Sn and Cr (1,801 and 218 ppm, respectively) were in Parks.
Fig. 3c.
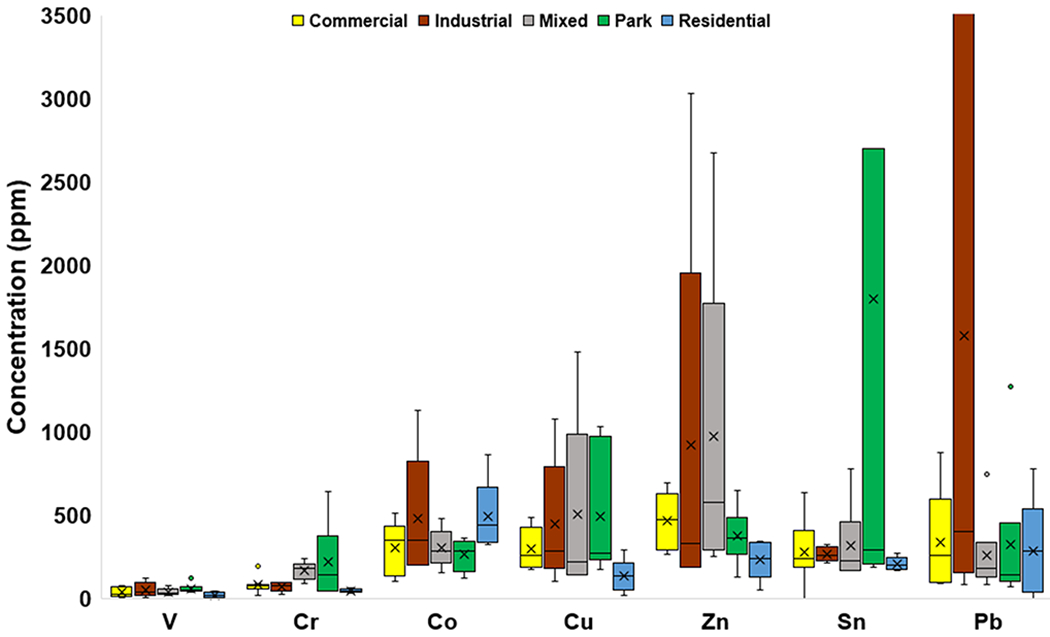
Box and whisker plots of minor element concentrations (ppm) categorized by land use. The x represents mean value, whereas the horizontal line is median value. All points outside of the box (IQR) and whiskers (min. and max. values – excluding outliers) are outliers (1.5x below the 1st quartile or 1.5x above the 3rd quartile). The graph truncates at 3,500 ppm for clarity, omitting a Pb outlier of 6,147 ppm and Sn outlier of 9,339 ppm
3.4. Mineral Phases by Land Use:
Quartz was ubiquitous across all sites (Table 1), and thus, land uses (Fig. 4). The occurrence of dolomite was nearly ubiquitous. Anorthite was present most often at Residential sites (4 of 5) and the least at Mixed sites (3 of 6). Albite was present at 2 of 6 Mixed sites and no Residential sites. Overall, illite, calcite, hematite, and halloysite were found at too few sites to establish any relation to land use.
Fig. 4.
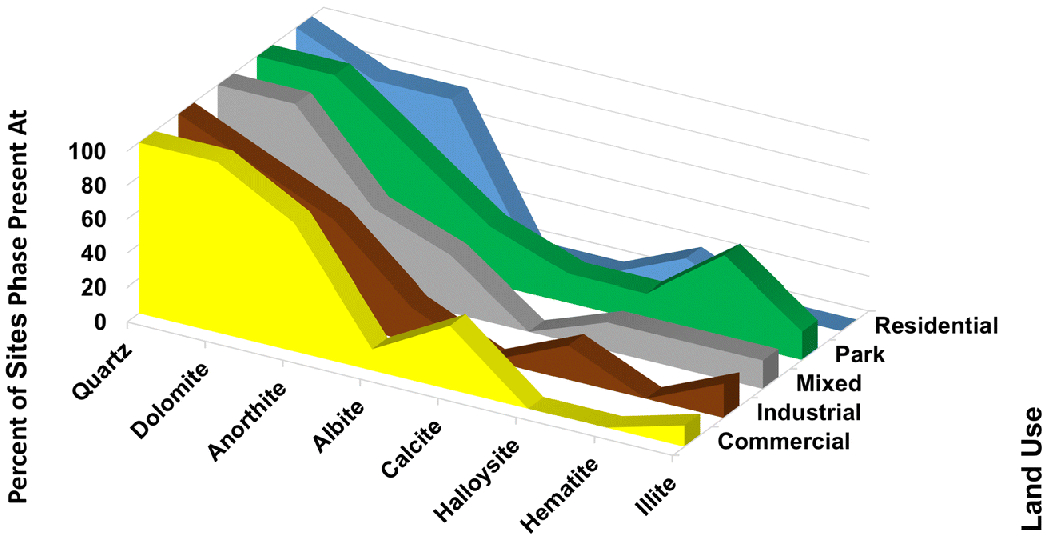
Mineral phases present at sample sites categorized by land use. Only phases present at 4 or more sites are shown
3.5. Elemental Composition by Traffic:
The mean concentrations of Na, Al, P, K, and Ti were similar across different traffic densities (Fig. 5a, Fig. 5b). Mean Fe concentrations showed distinct variation with traffic density, with the highest value at High-Traffic sites (5.64 wt%), and the lowest (2.11 wt%) at Low-Traffic sites. A higher mean Ca concentration was found for Medium-Traffic sites (2.76 wt%) than for Low-Traffic sites (2.11 wt%).
Fig. 5a.
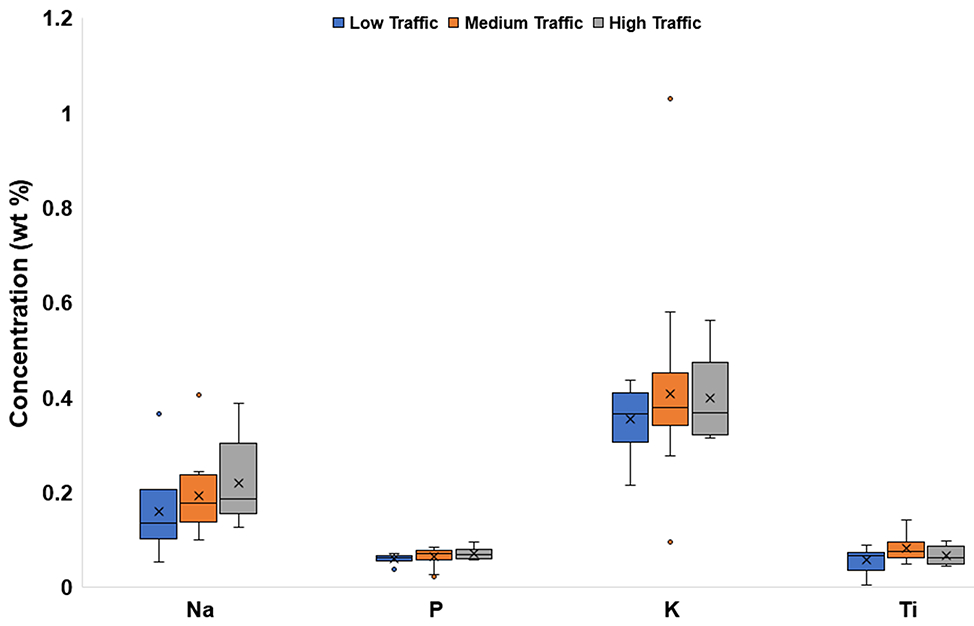
Box and whisker plots of major element (Na, P, K, Ti) concentrations (wt%) categorized by traffic density. The x represents mean value, whereas the horizontal line is median value. All points outside of the box (IQR) and whiskers (min. and max. values – excluding outliers) are outliers (1.5x below the 1st quartile or 1.5x above the 3rd quartile)
Fig. 5b.
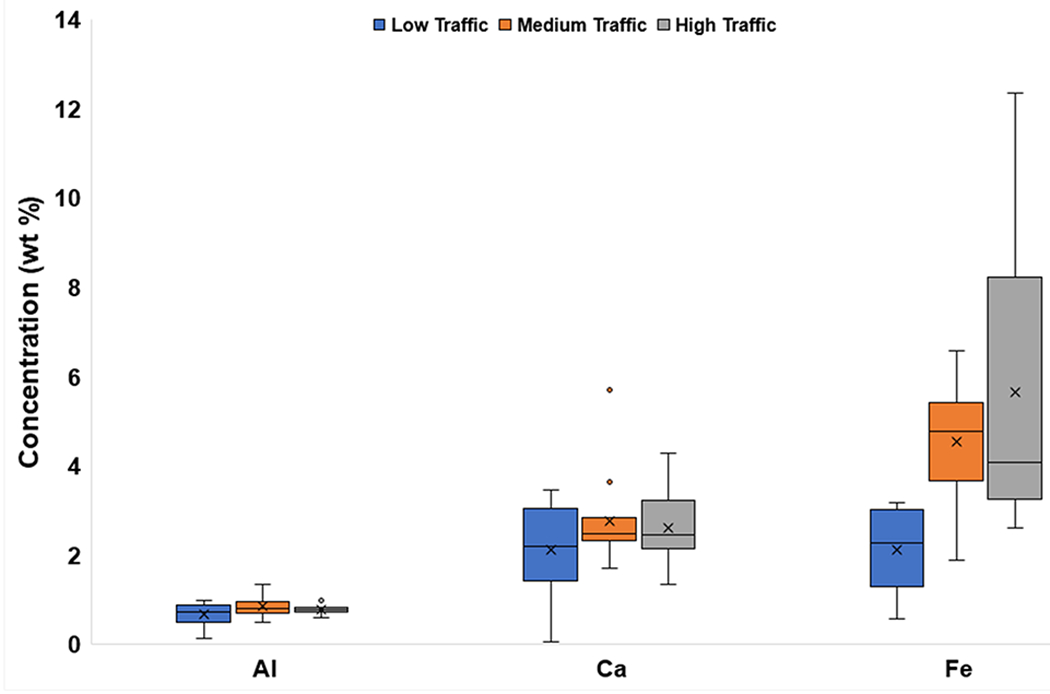
Box and whisker plots of major element (Al, Ca, Fe) concentrations (wt%) categorized by traffic density. The x represents mean value, whereas the horizontal line is median value. All points outside of the box (IQR) and whiskers (min. and max. values – excluding outliers) are outliers (1.5x below the 1st quartile or 1.5x above the 3rd quartile)
The mean concentrations of V were similar across all traffic densities, but those of all other minor elements varied with traffic density (Fig. 5c). The highest mean concentrations of Co, Sn, and Pb (584, 1,745, and 1,241 ppm, respectively) were associated with Low-Traffic sites. Conversely, the highest mean concentrations of Cr, Cu, and Zn (151, 508, and 766 ppm, respectively) were at High-Traffic sites.
Fig. 5c.
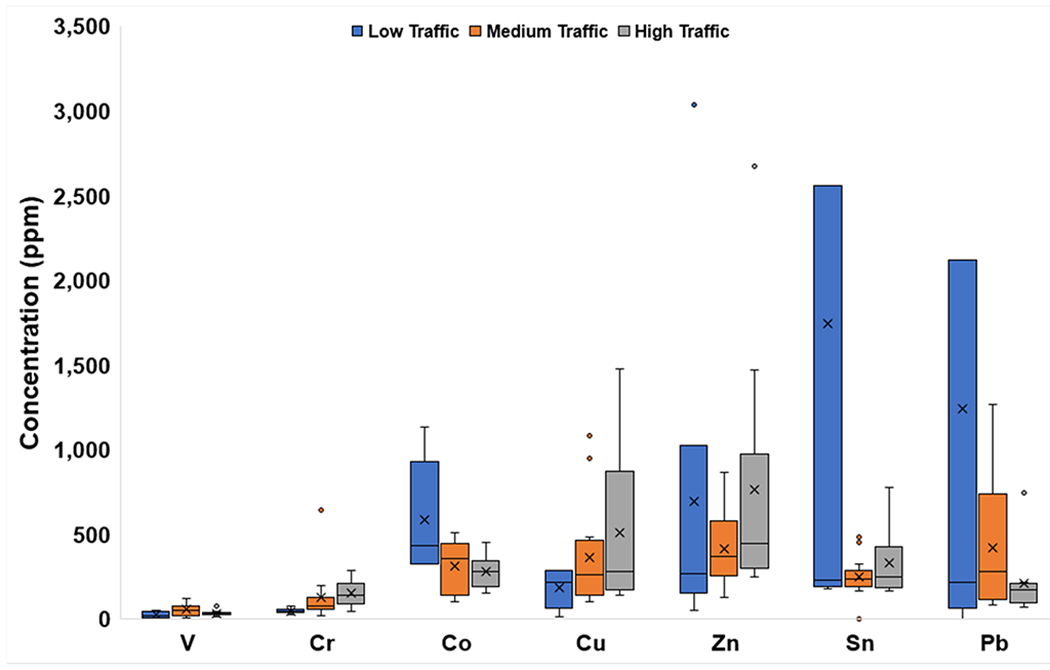
Box and whisker plots of minor element concentrations (ppm) categorized by traffic density. The x represents mean value, whereas the horizontal line is median value. All points outside of the box (IQR) and whiskers (min. and max. values – excluding outliers) are outliers (1.5x below the 1st quartile or 1.5x above the 3rd quartile). The graph truncates at 3,500 ppm for clarity, omitting a Pb outlier of 6,147 ppm and Sn outlier of 9,339 ppm
3.6. Mineral Phases by Traffic:
Quartz was present at all sites regardless of traffic density (Fig. 6). Dolomite was present at all Medium- and High-Traffic sites, and at 4 of 6 Low-Traffic sites. Anorthite and albite, whether considered together or separately, did not seem to vary with traffic density. Calcite and hematite were absent from Low-Traffic sites, but both were present at 4 of the higher-traffic sites. Illite and halloysite were found at too few sites to establish any relation to traffic.
Fig. 6.
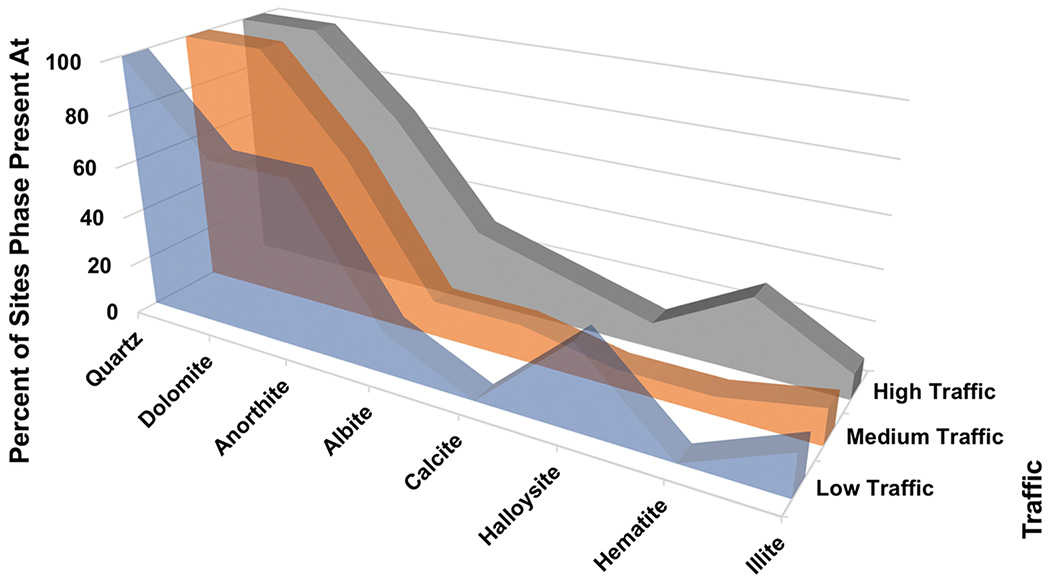
Mineral phases present at sample sites categorized by traffic density. Only phases present at 4 or more sites are shown
3.7. Statistical Analysis of Elemental Data:
The strongest statistically significant (P<0.05) Spearman correlations of major elements were observed between K and Na (0.82), P and Na (0.72), K and P (0.66), and Fe and Na (0.63) (Table 4). The strongest statistically significant Spearman correlations of minor elements were between Zn and Cu (0.64), Zn and Cr (0.50), Cu and Cr (0.49), and Sn and V (0.48) (Table 5). For completeness, the Spearman correlations between all elements were also calculated (Table S3).
Table 4.
Spearman correlations of major elements. Statistical significance (P<0.05) is shown in bold.
| Na | Al | P | K | Ca | Ti | Fe | |
|---|---|---|---|---|---|---|---|
| Na | 1.00 | ||||||
| Al | 0.33 | 1.00 | |||||
| P | 0.72 | 0.51 | 1.00 | ||||
| K | 0.82 | 0.37 | 0.66 | 1.00 | |||
| Ca | 0.41 | 0.08 | 0.17 | 0.37 | 1.00 | ||
| Ti | 0.52 | 0.24 | 0.27 | 0.46 | 0.40 | 1.00 | |
| Fe | 0.63 | 0.18 | 0.56 | 0.44 | 0.57 | 0.57 | 1.00 |
Table 5.
Spearman correlations of minor elements detected at more than half of the sample sites. Statistical significance (P<0.05) is shown in bold.
| V | Cr | Co | Cu | Zn | Sn | Pb | |
|---|---|---|---|---|---|---|---|
| V | 1.00 | ||||||
| Cr | 0.41 | 1.00 | |||||
| Co | −0.22 | −0.34 | 1.00 | ||||
| Cu | 0.38 | 0.49 | −0.31 | 1.00 | |||
| Zn | 0.22 | 0.50 | −0.12 | 0.64 | 1.00 | ||
| Sn | 0.48 | 0.11 | 0.16 | 0.26 | 0.27 | 1.00 | |
| Pb | 0.25 | −0.06 | −0.09 | 0.35 | 0.42 | 0.16 | 1.00 |
Factor analysis of the major elements in PRD revealed that three factors explained 88.18% of the cumulative variance (Table 6). Factor 1 was primarily composed of Na and K, Factor 2 was explained by Ca, Ti, and Fe, and Factor 3 by Al and P. Factor analysis of the minor elements revealed four factors, which explained 91.27% of the cumulative variance. Factor 1 was characterized by Cr, Cu, and Zn, Factor 2 by V and Cr, Factor 3 by Pb, and Factor 4 by Sn (Table 7).
Table 6.
Factor analysis results of PRD for major elements. Only elements with factor loadings >0.40 are listed.
| Variable | Factor 1 | Factor 2 | Factor 3 |
|---|---|---|---|
| Na | 0.75 | ||
| Al | 0.49 | ||
| P | 0.91 | ||
| K | 0.83 | ||
| Ca | 0.56 | ||
| Ti | 0.51 | ||
| Fe | 0.92 | ||
| Eigenvalue | 1.69 | 1.67 | 1.43 |
| Cumulative Variance | 31.18% | 61.87% | 88.18% |
Table 7.
Factor analysis results of PRD for minor elements detected at more than half of the sample sites. Only elements with factor loadings >0.40 are listed.
| Variable | Factor 1 | Factor 2 | Factor 3 | Factor 4 |
|---|---|---|---|---|
| V | 0.84 | |||
| Cr | 0.72 | 0.44 | ||
| Co | ||||
| Cu | 0.63 | |||
| Zn | 0.87 | |||
| Sn | 0.71 | |||
| Pb | 0.76 | |||
| Eigenvalue | 1.80 | 1.16 | 0.85 | 0.76 |
| Cumulative Variance | 35.87% | 59.06% | 76.09% | 91.27% |
3.8. Particle Size and Volume, and Organics:
Samples exhibited a large range in particle size (Fig. 7); the mean size across all 30 sample sites was 466 μm. Approximately 25% of the cumulative volume was smaller than 200 μm, and 10% was smaller than 100 μm.
Fig. 7.
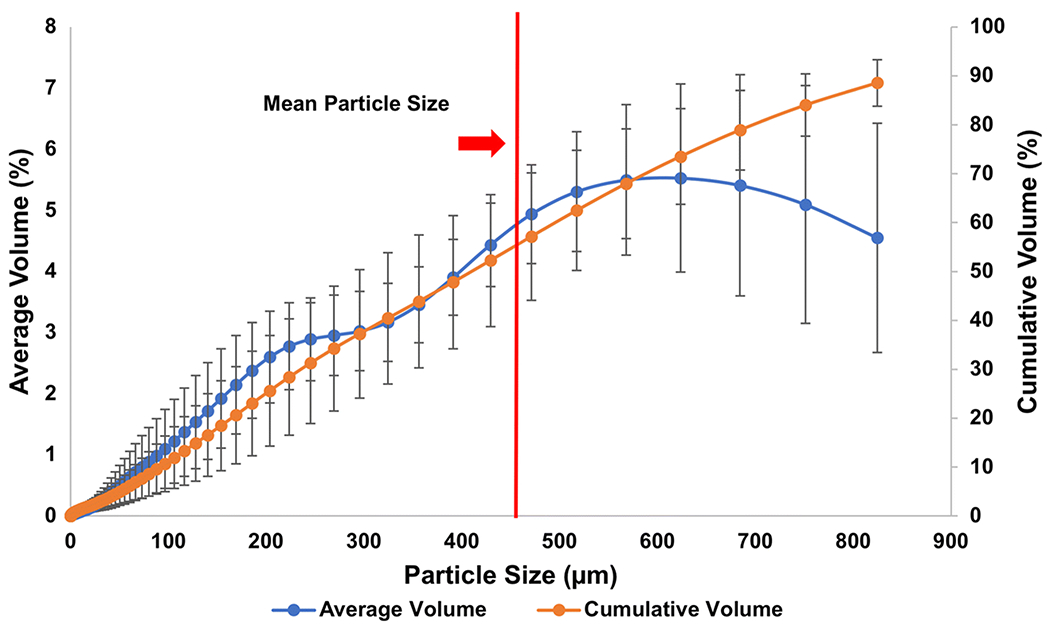
Averaged particle size distribution of all 30 sample sites. Standard volume per size fraction (blue curve) is labeled on the y-axis to the left, whereas the cumulative volume (orange curve) is labeled on the y-axis to the right; standard deviation is provided for each data point (black lines)
Mean organic concentrations ranged from 2.49 wt% in Industrial areas to 10.15 wt% in Mixed areas, which also exhibited the largest range (19.07 wt%) (Fig. 8). Low-Traffic areas had the lowest mean organic concentration (3.77 wt%) (Fig. 9), whereas the mean organic concentrations in Medium- and High-Traffic sites were 6.43 and 7.54 wt%, respectively.
Fig. 8.
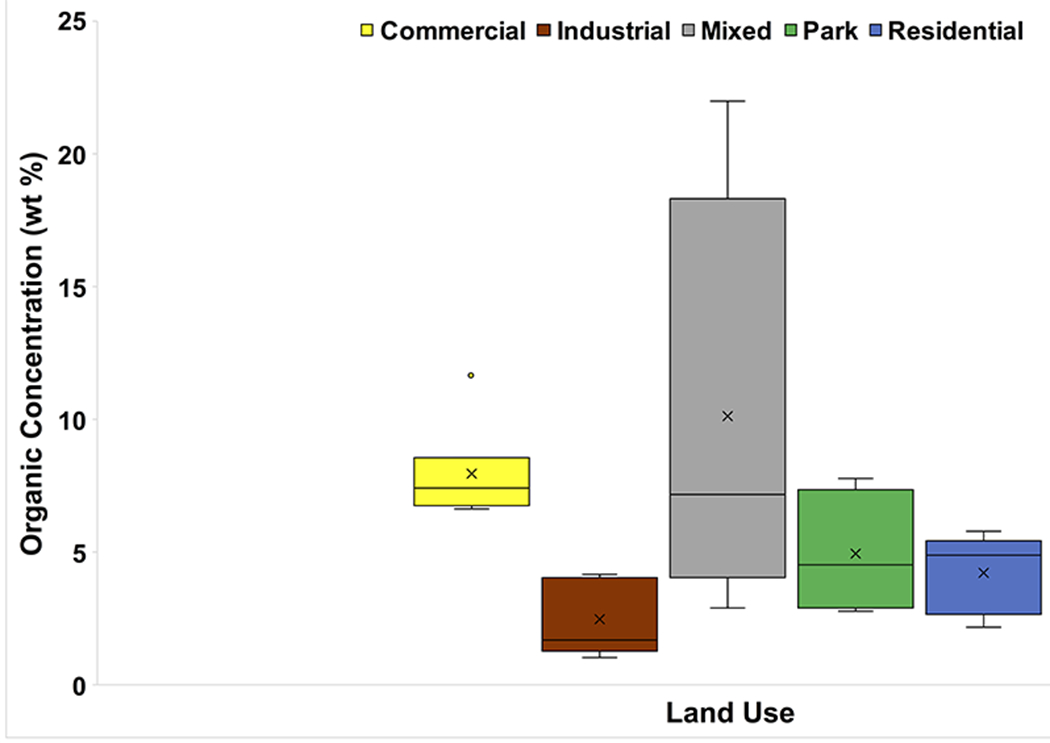
Box and whisker plot of LOI results (in wt%) categorized by land use. The x represents mean value, whereas the horizontal line is median value. All points outside of the box (IQR) and whiskers (min. and max. values – excluding outliers) are outliers (1.5x below the 1st quartile or 1.5x above the 3rd quartile)
Fig. 9.
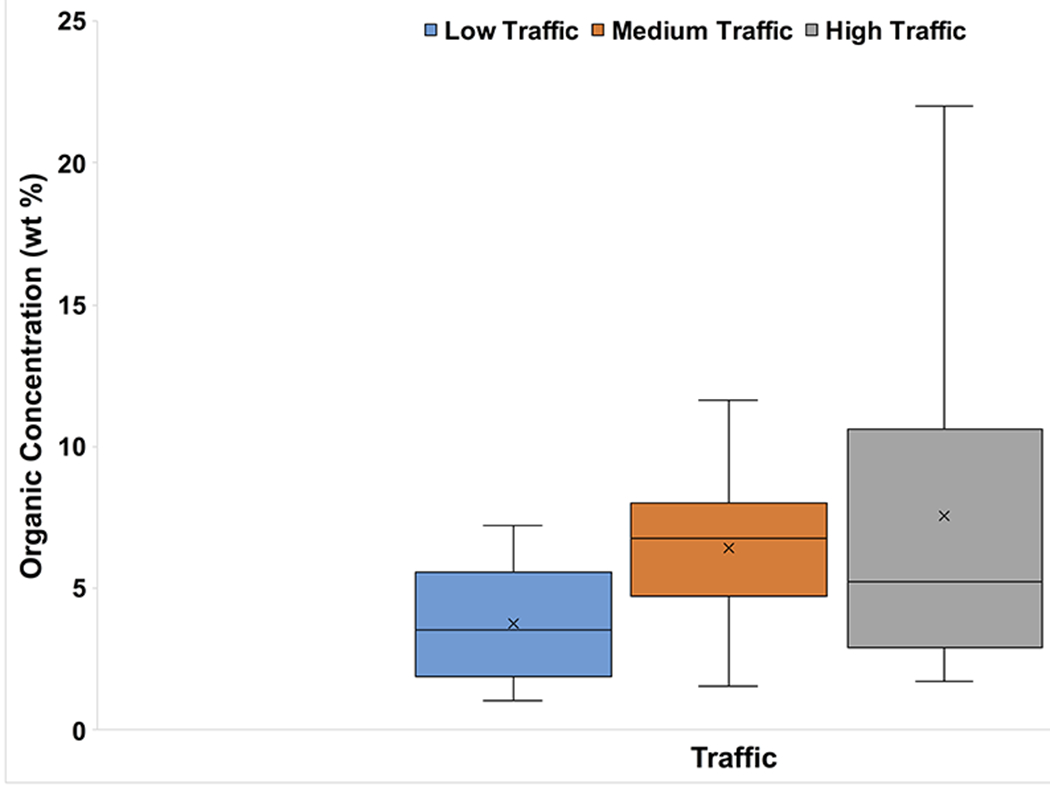
Box and whisker plot of LOI results (in wt%) categorized by traffic density. The x represents mean value, whereas the horizontal line is median value. All points outside of the box (IQR) and whiskers (min. and max. values – excluding outliers) are outliers (1.5x below the 1st quartile or 1.5x above the 3rd quartile)
4. Discussion:
4.1. Minerals:
Quartz, the feldspars anorthite and albite, as well as a variety of other phases present at less than four sample sites (mica, augite, almandine, phlogopite, and diopside) likely stem from the WF. Dolomite and calcite could come from sidewalk, road, and construction materials; asphalt could also contribute to dolomite and albite (Table 1). Illite and halloysite are common clay minerals that could be derived from local soils. The few phases unrelated to local formations could be anthropogenic. Magnetite is known to be associated with coal fly ash, the corrosion of vehicles and brake wear, and the abrasion of rails (Gieré et al., 2003; Grigoratos and Martini, 2015; Matzka and Maher, 1999). A previous study in Barcelona has found that the presence of hematite in urban areas may be due to the abrasion of railways (Querol et al., 2012).
The overall mineralogical composition of PRD was similar to the results reported by Legalley and Krekeler (2013) for road dust in Hamilton, Ohio. The bulk mineralogic composition of PRD was relatively consistent across sample sites, irrespective of traffic density, and as such, we concluded that the mineral phases present in PRD were not linked to traffic density. Similarly, land use was not connected to PRD’s mineralogic composition.
4.2. Major Elements:
Relative to the mean continental crust (Rudnick and Gao, 2003), PRD was depleted in all major elements (mean values), except for P, which exhibited an enrichment factor (EF) of 1.6 (Table 8). The mean Fe concentration of PRD was similar to that of the continental crust (EF = 0.8), whereas the mean Na, Al, K, and Ti contents were considerably lower. When normalized to the average WF composition (Weiss, 1949), PRD was found to be enriched in P (2.2), Ca (3.6), and Fe (2.0) (Fig. 10), suggesting that the local bedrock was not the only source for these elements. Philadelphia road dust was depleted relative to the WF in Na (0.1), Al (0.1), K (0.2), and Ti (0.1) (Fig. 10); despite the depletion, one source of these elements may still be the WF as the difference in extractable concentrations, using our methods, versus total concentrations used by Weiss (1949) must be considered. Furthermore, the depleted elements, aside from Ti, may be more readily leached and transported. With factor analysis, Factor 1 was accounted for by Na and K (Table 6), and may be sourced to the WF. Thus, over 31% of the variance in major element concentration could be from the WF. The strongest Spearman correlation was also connected to Na and K (0.82) (Table 4), which could reflect the high percentages of feldspars and micas in the WF (Weiss, 1949). Factor 3 was primarily associated with P, as well as Al, and the source was unclear.
Table 8.
Mean major element concentrations in PRD normalized to continental crust (Rudnick and Gao, 2003).
| Component | Normalized Road Dust |
|---|---|
| Na | 0.1 |
| Al | 0.1 |
| P | 1.6 |
| K | 0.3 |
| Ca | 0.6 |
| Ti | 0.2 |
| Fe | 0.8 |
Fig. 10.
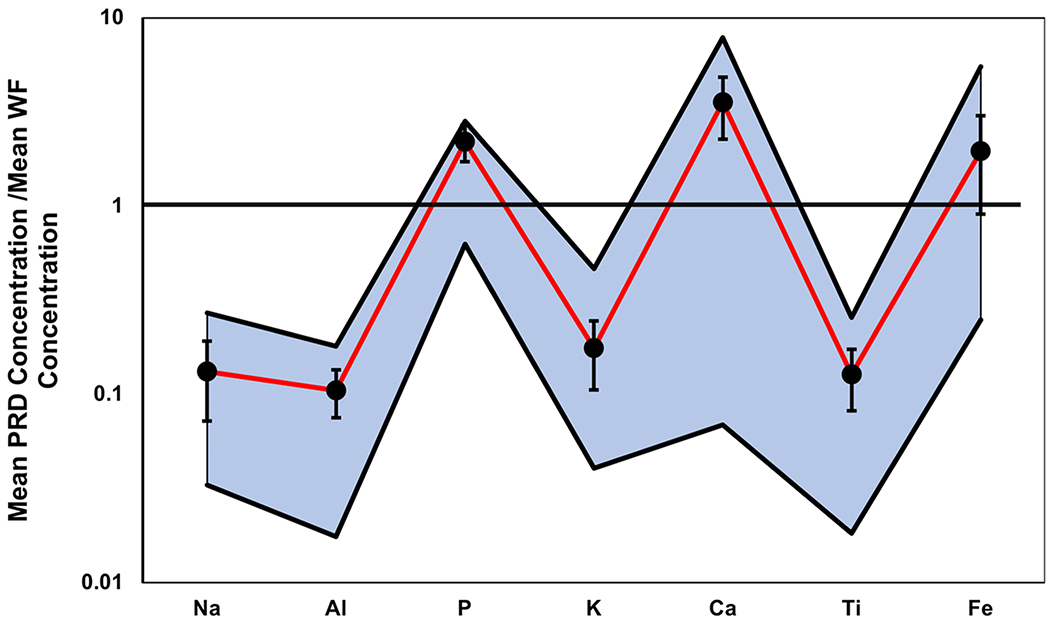
The range of Na, Al, P, K, Ca, Ti and Fe concentrations (highlighted in blue, bounded by top and bottom black lines) in PRD normalized to their respective average concentrations in the WF (Weiss, 1949). Black dots and their corresponding black bars represent the mean, normalized by the mean WF, and standard deviation of the PRD concentrations, respectively
Land use did not appear to impact the concentrations of Al, P, and Ti. However, land use may impact concentrations of Na, Ca, K, and Fe, which could have had mixed sources from local bedrock (e.g., WF), soil, and anthropogenic activity. Only the mean concentrations of Ca and Fe changed with both land use and traffic density (Fig. 3b; Fig. 5b).
Previous studies have correlated Fe in road dust to traffic due to brake wear (Apeagyei et al., 2011). Factor 2 is primarily associated with Fe, and could have mixed anthropogenic (e.g., Apeagyei et al., 2011) and natural sources as this factor, which accounted for over 30% of variance, was also related to Ca and Ti. Both Ca and Ti may be associated with brake pads (Sommer et al., 2018) (Table 6). Thus, much of this variance could be traffic-related, specifically as Fe increased in mean concentration with higher traffic densities (Fig. 5b).
High-Traffic sites had higher mean organic concentration (Fig. 9). Higher traffic may increase the organic concentration of road dust by adding increasing amounts of tire-abrasion particles; however, as noted by Sommer et al. (2018), traffic volume is not the only factor relevant in creating these particles. A follow-up study, utilizing scanning electron microscopy (SEM) to investigate tire wear in PRD, could be valuable for better understanding this aspect of our study. We originally hypothesized that the highest mean organic matter concentration would be found in Park settings and the lowest in Industrial areas. Whereas this was true for Industrial areas, it was not for Parks (Fig. 8).
4.3. Minor Elements (comparisons):
All of the minor elements analyzed in PRD were enriched, some to a considerable extent, relative to the mean continental crust (Table 9), except for Cr (EF of 0.9) and V (EF of 0.3). The highest EF was observed for Sn (339.4), followed by Pb (46.9). High enrichment factors were also found for Co (13.3) and Cu (13.9) (Table 9). Furthermore, the mean concentrations of Co, Cu and Pb in PRD were enriched relative to the international road dust average (approximately 10x, 2.5x, and 2x, respectively) (Table 10). The mean concentration of Pb in the PRD samples (516 ppm) was the second highest of the cities studied. There were eight sample sites in Philadelphia at or above the EPA’s threshold for Pb in bare soil that children can safely interact with (400 ppm), which emphasized potential health risks associated with human interaction (Table S1) (Council on Environmental Health, 2016).
Table 9.
Mean minor element concentrations in PRD normalized to continental crust (Rudnick and Gao, 2003).
| Component | Normalized Road Dust |
|---|---|
| V | 0.3 |
| Cr | 0.9 |
| Co | 13.3 |
| Cu | 13.9 |
| Zn | 8.2 |
| Sn | 339.4 |
| Pb | 46.9 |
Table 10.
International comparison of selected element concentrations (in ppm)in PRD with those reported in previous studies.
| City | Cr | Co | Cu | Zn | Cd | Sb | Hg | Pb | Reference | Method | Analytical Method | Digestive Fluid Composition* | Sieve Size (μm) |
|---|---|---|---|---|---|---|---|---|---|---|---|---|---|
| Philadelphia, USA | 119 | 355 | 374 | 588 | - | - | - | 516 | This paper | Mean | ICP | HNO3+HCl | <841 |
| Philadelphia, USA | 82 | 331 | 261 | 349 | - | - | - | 202 | This paper | Median | ICP | HNO3+HCl | <841 |
| Hamilton, USA | 28 | - | 60 | 589 | - | - | - | 297 | Legalley and Krekeler, 2013 | Mean | ICP | HNO3+HCl | <2000 |
| Middletown, USA | 160 | 8.7 | 28 | 374 | 0.2 | 1.8 | - | 85 | Dietrich et al., 2018 | Mean | ICP | HNO3 | None - ground |
| Luanda, Angola | 26 | 2.9 | 42 | 317 | 1.1 | 3.4 | 0.13 | 351 | Ferreira-Baptista and De Miguel, 2005 | Mean | ICP | HNO3+HCl+H2O | <100 |
| Ottawa, Canada | 43 | 8.3 | 66 | 113 | 0.4 | 0.9 | 0.03 | 39 | Rasmussen et al 2001 | Mean | ICP | HNO3+HCl+HF+HClO4 | 75-250 |
| Beijing, China | 85.6 | 9.4 | 42 | 214 | 1.2 | - | 0.3 | 61 | Tanner et al., 2008 | Mean | ICP | HNO3+H2O2+HF+H3BO3 | <63 |
| Beijing, China | 84.7 | - | 69.9 | 222 | 0.72 | - | - | 105 | Wei et al., 2015 | Mean | ICP | HNO3+H2O2+HF | <125 |
| Guangzhou, China | 50.3 | 5.7 | 79 | 492 | 1.3 | - | - | 185 | Duzgoren-Aydin et al., 2006 | Median | ICP | HNO3+HF | <2000 |
| Hong Kong, China | 324 | 10.2 | 534 | 4,024 | 1.8 | - | 0.6 | 240 | Tanner et al., 2008 | Mean | ICP | HNO3+H2O2+HF+H3BO3 | <63 |
| Huludao, China | - | - | 162 | 1,374 | 19.7 | - | 0.61 | 235 | Zheng et al., 2010 | Median | ICP | HNO3+HF+HClO4 | <100 |
| Nanjing, China | 126 | 10.7 | 123 | 394 | 1.1 | - | 0.12 | 103 | Hu et al., 2011 | Mean | ICP | HNO3+HCl+HF+HClO4 | <63 |
| Shanghai, China | 264 | - | 258 | 753 | 1 | - | 0.14 | 237 | Shi et al., 2010 | Mean | AAS | HNO3+HF+HClO4 | <125 |
| Urumqi, China | 54 | 11 | 95 | 294 | 1.17 | - | - | 54 | Wei et al., 2009 | Mean | ICP | HNO3+HF+H2SO4 | <149 |
| Xi’an, China | 65 | - | 72 | 295 | - | 3.7 | 0.43 | 131 | Yongming et al., 2006 | Median | AAS | HNO+HCl+HF+HClO4+H2SO4 | <1000 |
| Zhuzhou, China | 115 | 15 | 98 | 1,140 | 10.3 | 9.8 | 0.21 | 254 | Li et al., 2013 | Median | ICP | HNO3+HF | None - ground |
| Kavala, Greece | 196 | - | 124 | 272 | 0.2 | - | 0.1 | 301 | Christoforidis and Stamatis, 2009 | Mean | AAS | HNO3 | <63 |
| Amman, Jordan | 29 | 32 | 139 | 351 | 1.9 | - | - | 271 | Al-Momani, 2009 | Mean | ICP | HNO3+HF+HClO4 | <2000 |
| Oslo, Norway | - | 19 | 123 | 412 | 1.4 | 6 | - | 180 | De Miguel et al., 1997 | Mean | ICP | HNO3+HClO4+HF | <100 |
| Seoul, South Korea | - | - | 101 | 296 | 3 | - | - | 245 | Chon et al., 1995 | Mean | ICP | HNO3+HCl+HClO4 | <2000 |
| Avilés, Spain | 41.6 | 7 | 183 | 4,892 | 22.3 | 8 | 2.56 | 514 | Ordonez et al., 2003 | Mean | ICP | HNO3+HCl+H2O | <2000 |
| Madrid, Spain | 61 | 3 | 188 | 476 | - | - | - | 1,927 | De Miguel et al., 1997 | Mean | ICP | HNO3+HClO4+HF | <100 |
| Bursa, Turkey | - | - | - | 57 | 3.1 | - | - | 210 | Arslan, 2001 | Mean | AAS | HNO3+HCl | <88 |
| Birmingham, UK | - | - | 467 | 534 | 1.6 | - | - | 48 | Charlesworth et al., 2003 | Mean | AAS | HNO3+HClO4+H2SO4+LaCl3 | <1000 |
| London, UK | - | - | 80 | 372 | 2.7 | - | - | 370 | Schwar et al., 1988 | Mean | AAS | HNO3+HCl | <500 |
| Average Value | 104 | 36 | 153 | 785 | 3.8 | 4.7 | 0.48 | 290 | Mean | ||||
| Average Value (excluding this study) | 103 | 11 | 142 | 794 | 3.8 | 4.7 | 0.48 | 280 | Mean |
= Composition of primary digestion, see manuscripts for Hg digestive fluids and all details
The maximum values of Co and Pb (1,131 and 6,147 ppm, respectively) in PRD were higher than those reported in other cities studied (Table 11). The maximum Co concentration was nearly twenty times greater than the next highest reported value of 64 ppm from Witbank, South Africa (Žibret, 2013), whereas the maximum Pb concentration was more than twice the next highest concentration (3,060 ppm), reported for Xi’an, China (Yongming, 2006). These extreme values for Co and Pb were both recorded at sample site 26 (see Fig. 1 and Table S1), which also contained more Zn (3,025 ppm) than any other site in Philadelphia. Sample site 26 is close to the Philadelphia International Airport (Fig. 1), in an area that has historically been used for industrial and military activity; the context of the area could account for the extreme values found. The maximum value of Fe (12.34 wt%) in PRD was the second highest value reported for any other compared city and was recorded at sample site 18 (Table S1). The maximum values of Cr and Cu (645 and 1,478 ppm, respectively) in PRD, detected at sample sites 19 and 21, were the third highest values reported for any other compared city. Sites 18, 19, and 21 were all on busy (>12,000 AADT) roads that featured significant stop-and-go traffic; thus, high traffic activity could account for the high concentrations of traffic-related elements found at these sites. However, it was important to note that a single maximum concentration was not representative of the overall urban environment.
Table 11.
Highest concentrations of selected elements reported in comparable road dust studies.
| City | V | Cr | Co | Cu | Zn | Pb | Fe | Reference | Analytical Method | Digestive Fluid Composition* | Sieve Size (μm) |
|---|---|---|---|---|---|---|---|---|---|---|---|
| Units | ppm | ppm | ppm | ppm | ppm | ppm | wt% | ||||
| Philadelphia, USA | 121 | 645 | 1,131 | 1,478 | 3,035 | 6,147 | 12.34 | This study | ICP-OES | HNO3+HCl | <841 |
| Boston, USA | - | 530 | - | 2,130 | 1,208 | 1,639 | 10.0 | Apeagyei et al., 2011 | XRFa | - | <2000 |
| Baoji, China | 144 | 215 | 23 | 260 | 1,778 | 1,970 | - | Lu et al., 2010 | XRF | - | <1000 |
| Dongying, China | 175 | 160 | 31 | 197 | 3,273 | 523 | - | Kong et al., 2011 | ICP-MS | HCl+HF | <100 |
| Lanzhou, China | - | 62 | - | 73 | 297 | 63 | 3.39 | Wang et al., 2012 | XRF | - | <1000 |
| Urumqi, China | - | 175 | 25 | 252 | 846 | 99 | - | Wei et al., 2009 | ICP-MS | HNO3+HF+H2SO4 | <149 |
| Wuhan, China | 90 | 103 | - | 125 | 355 | 265 | 5.35 | Yang et al., 2010 | XRF | - | <1000 |
| Xi’an, China | - | 853 | - | 1,071 | 2,112 | 3,060 | - | Yongming et al., 2006 | AAS | HCl+HF+HClO4+H2SO4+HNO | <1000 |
| Alexandria, Egypt | 102 | 149 | - | 242 | 8,153 | 710 | 3.9 | Khairy et al., 2011 | FAASb | HNO3+HF+HClO4+H3BO3 | None |
| Witbank, South Africa | 4,410 | 43,000 | 64 | 300 | 1,334 | 835 | 17.4 | Žibret et al., 2013 | ICP-MS | Not Listed | <125 |
| Kayseri, Turkey | - | 81.2 | - | 144 | 733 | 312 | - | Tokalıoğlu and Kartal, 2006 | FAAS | HNO3+HCl+CH3COOH+HONH2+H2O2+NH4OAC | None - ground |
| Samsun City, Turkey | 42 | 352 | 173 | 224 | Kabadayi and Cesur, 2010 | FAAS | HNO3+HCl | None | |||
| Birmingham, UK | - | - | - | 6,688 | 3,165 | 146 | - | Charlesworth et al., 2003 | AAS | HNO3+HClO4+H2SO4+LaCl3 | <1000 |
= X-ray fluorescence
= Flame atomic absorption spectrometry
= Composition of primary digestion, see manuscripts for Hg digestive fluids and all details
Relative to one study in Hamilton, Ohio, a historically industrial city, PRD contained higher mean concentrations of Cr, Cu, and Pb (LeGalley and Krekeler, 2013), but the Zn concentrations were nearly identical (Philadelphia 588 ppm; Hamilton 589 ppm) (Table 10). Compared to Middletown, Ohio, a typical post-industrial Midwestern city noted for its steel production, PRD had higher mean Cu, Zn, and Pb concentrations (Dietrich et al., 2018), but lower mean Cr (119 ppm vs. 160 ppm) and Fe (4.41 wt% vs. 5.18 wt%) (Table 2; Table 10). Samples from the Dietrich et al., 2018 study were primarily collected in a parking lot close to an industrial source. Furthermore, their study tested all particle sizes. The Hamilton study was also a bulk assessment, but for particles <2 mm. Thus, the methods utilized could account for some of the observed differences between studies. The general results of our study were consistent with Philadelphia’s expected profile, derived from its long industrial history and former use of leaded paint and gasoline (Lusby et al., 2015; Philadelphia Childhood Lead Poisoning Prevention Advisory Group, 2017). As discussed in the introduction, the large number of smelters as well as the high concentration of industrial activities, such as metal working, tanning, and shipbuilding, may also contribute to the contamination found today. Furthermore, the lack of overall regulation on the Pb smelters, when many of them were active, could also have played a role in Pb deposition (Lusby et al., 2015). Overall, the generally high concentrations of most metals, compared to continental crust, nationally, and internationally, highlighted Philadelphia’s high metal accumulation from anthropogenic activities.
4.4. Minor Elements (sources - primarily traffic related):
The primary source of Cr, Cu, and Zn could be due to traffic-related activity, as other studies have connected these elements to metal corrosion of vehicles, brake wear, and tire abrasion, respectively (e.g., Amato et al., 2009; El Samrani et al., 2004; Liu et al., 2014; Lough et al., 2005; Smolders and Degryse, 2002; Thorpe and Harrison, 2008). Other sources of anthropogenic Cr found in previous studies include emissions from industrial plants, Cr-steel production, tanneries, coal combustion, as well as yellow paint, including that used for yellow road markings, containing PbCrO4 (Huang et al., 2009; Legalley and Krekeler, 2013; Manno et al., 2006; Sedlazeck et al., 2017; White et al., 2014). Another potential source of Cu is industrial activity such as smelting (e.g., Zhang et al., 2009). Other sources of Zn include coal combustion, waste incineration, mining, and steel processing (e.g, Zhang et al., 2012). In addition to Fe, the highest mean concentrations of Cr, Cu, and Zn (151, 508, and 766 ppm, respectively) were found at High-Traffic sites, and their mean concentrations generally increased with traffic activity (Fig. 5c). Moreover, many of the highest Spearman correlations were likely indicative of traffic activity (Table 5) (Apeagyei et al., 2011; Padoan et al., 2017). Of the significant Spearman correlations, the correlation between Zn and Cu could be associated with the use of brass and the abrasion of brake pads, and the correlation of Cu with Cr to vehicle wear (Table 5) (e.g., Padoan et al., 2017). When all elements were compared, there were a number of significant Spearman correlations between Fe and traffic-related minor elements (Cr, Cu, and Zn), which could demonstrate the influence of traffic activity (Table S3). Furthermore, with factor analysis, Factor 1 was characterized by Cr, Cu, and Zn (Table 7), which accounted for nearly 36% of the variance associated with minor elements, and further demonstrated traffic as a major source of PRD. Chromium, Cu, and Zn were found at their highest mean concentrations at Park and Mixed land-use settings (Fig. 3c); generally, land use did not appear to have a major influence on these elements.
4.5. Minor Elements (sources - primarily non-traffic related):
The remaining non-traffic associated minor elements, V, Co, Sn, and Pb, were likely anthropogenically sourced as past studies have ascribed these elements to anthropogenic activity (e.g., Barceloux & Barceloux, 1999; Domingo, 1989; Lusby et al., 2015; Žibret et al., 2013). Previous studies have found that V may be associated with steel production, alloys, catalysts, or in yellow paint pigments or ceramics (e.g., Barceloux & Barceloux, 1999). Many of these sources, including paint pigments, steel wear, and alloys, may be represented in PRD as Factor 2, primarily V, accounted for over 23% of variance of minor elements (Table 7). The disturbance of soils where V was deposited by former Philadelphia industry could be largely responsible for Factor 2 in PRD. Other studies have found Co as a byproduct of smelting (Domingo, 1989). Lead, Factor 3 (>17% of the variance), may have been associated with the erosion of old Pb paint and to the former Pb smelters in Philadelphia (e.g., Lusby et al., 2015). Tin, primarily represented by Factor 4, accounted for approximately 15% of the variance in minor elements (Table 7), and could have stemmed from a variety of sources, ranging from can coatings, solder, and ceramics, to the burning of fossil fuels (e.g., Žibret et al., 2013). Overall, many industrial sources are not easily distinguished from one another and thus, much of the variance in the study was simply attributed to industrial activity overall.
Land use may have influenced some of the minor non-traffic related elements (Co, Sn, and Pb). Some elements, such as Pb, were found at their highest mean concentrations in areas where they were likely produced (Industrial) (Fig. 3c); however, this was not the case for other elements like V, Co, and Sn (see Fig. 3c). A possible explanation for this could be the transportation of PRD across different land uses.
In the future, we plan to analyze a smaller size fraction of road dust in order to better understand the potential human health impacts of the minor elements.
5. Conclusions:
The wide variety of analytical methods utilized in this study generated a broader and more complete data set for road dust than most previous studies. The results emphasize the chemical heterogeneity of road dust and improve our ability to distinguish between the natural and anthropogenic sources that contributed to PRD. We recommend utilizing this suite of analytical methods in future road dust assessments.
Our study highlighted Philadelphia’s expected profile as a polluted area with high metal concentrations, both in a national and international context, due to the city’s long and varied industrial legacy. Critically, eight sample sites had potentially harmful (≥ 400 ppm) concentrations of Pb. Some of these sites (sites 1 and 2) are close to the city’s historic district, near the Liberty Bell, where pedestrians, including children, may interact with the road dust. Another site above the Pb threshold is the Walnut Street Bridge (site 21), where there is also a large amount of pedestrian traffic. Overall, we generally recommend that industrial areas must be remediated before future residential development takes place due to the high concentrations of Pb found at Industrial settings.
Traffic played a key role as a source of PRD, as it likely provided the elements Fe, Cr, Cu, and Zn, as implied by factor analysis and Spearman correlations. Philadelphia road dust also contained high concentrations of Fe, Cr, Cu, and Pb compared to road dust internationally. Overall, land use did not seem to have a strong impact on these elements. Traffic density must be considered in future city efforts to study road dust and other environmental media, due to the potential for traffic-related metal accumulation. Mean organic concentrations were higher at High-Traffic sites, likely stemming from tire-abrasion particles, which are an environmentally relevant concern.
Due to the nearly ubiquitous local geologic formation (WF), the bulk mineralogic content did not vary much across different land uses and traffic densities throughout the city. This demonstrates that, by considering the local bedrock geology, a majority of the mineralogic components of road dust may be predicted and accounted for—particularly those with resilient phases such as quartz.
This study adds to the growing body of international literature on road dust compositions and sources in the urban environment (e.g., Padoan et al., 2017; Wei and Yang, 2010; Wei et al., 2015). Furthermore, this investigation laid the groundwork for future risk assessment in Philadelphia. It also added context to previous studies of American cities (e.g., Apeagyei et al., 2011; Dietrich et al., 2018; LeGalley and Krekeler, 2013), serving as an additional point of reference as a historically industrial U.S. city. Future studies of PRD should include SEM examinations of road dust particles in relation to hypothesized sources.
Supplementary Material
Acknowledgements and funding:
We thank Sarah Haber for assistance with sample collection and preparation. We thank Kieran Dunne and Erynn Johnson for assistance with editing. We thank the Benjamin Franklin Fellowship, Teece Fellowship, GAPSA Travel Grant Award, and the Greg and Susan Walker Foundation for support from the University of Pennsylvania. It was further supported by grant P30-ES013508 awarded by the National Institute of Environmental Health Sciences (NIEHS). The findings are not the official opinions of NIEHS or NIH. We also thank the DUST 2018 student travel grant for support. Finally, we deeply thank our reviewers and the editor for their assistance with the improvement of the manuscript.
Footnotes
Compliance with Ethical Standards: The authors have no conflicts of interests to declare.
References
- Al-Momani IF (2009). Assessment of trace metal distribution and contamination in surface soils of Amman, Jordan. Jordan J. Chem 4, 77–87. [Google Scholar]
- Amato F, Pandolfi M, Escrig A, Querol X, Alastuey A, Pey J, Perez N, & Hopke PK (2009). Quantifying road dust resuspension in urban environment by Multilinear Engine: A comparison with PMF2. Atmos. Environ 43(17), 2770–2780. 10.1016/j.atmosenv.2009.02.039 [DOI] [Google Scholar]
- Apeagyei E, Bank MS, & Spengler JD (2011). Distribution of heavy metals in road dust along an urban-rural gradient in Massachusetts. Atmos. Environ 45(13), 2310–2323. 10.1016/j.atmosenv.2010.11.015 [DOI] [Google Scholar]
- Arslan H (2001). Heavy metals in street dust in Bursa, Turkey. J. Trace Microprobe Tech 9, 439–445. [Google Scholar]
- Ball DF (1964). Loss on Ignition As an Estimate of Organic Matter and Organic Carbon in Non Calcareous Soils. J. Soil Sci 15(1), 84–92. 10.1111/j.1365-2389.1964.tb00247.x [DOI] [Google Scholar]
- Barceloux DG, & Barceloux D (1999). Vanadium. J. Toxicol. Clinical Toxicol 37(2), 265–278. 10.1081/CLT-100102425 [DOI] [PubMed] [Google Scholar]
- Brown JS, Gordon T, Price O, & Asgharian B (2013). Thoracic and respirable particle definitions for human health risk assessment. Part. Fibre Toxicol 1–12. [DOI] [PMC free article] [PubMed] [Google Scholar]
- Charlesworth S, Everett M, McCarthy R, Ordóñez A, & de Miguel E (2003). A comparative study of heavy metal concentration and distribution in deposited street dusts in a large and a small urban area: Birmingham and Coventry, West Midlands, UK. Environ. Int 29(5), 563–573. 10.1016/S0160-4120(03)00015-1 [DOI] [PubMed] [Google Scholar]
- Chon HT, Kim KW, & Kim JY (1995). Metal contamination of soils and dusts in Seoul metropolitan city, Korea. Environ. Geochem. Health 17(3), 139–146. [DOI] [PubMed] [Google Scholar]
- Christoforidis A, & Stamatis N (2009). Heavy metal contamination in street dust and roadside soil along the major national road in Kavala’s region, Greece. Geoderma 151(3), 257–263. [Google Scholar]
- Council on Environmental Health. (2016). Prevention of Childhood Lead Toxicity. Pediatrics 138(1), 1–15. 10.1542/peds.2016-1493 [DOI] [PubMed] [Google Scholar]
- Delaware Valley Regional Planning Commision (DVRPC). “Traffic Count Viewer”. Scale Not Given. “DVRPC Traffic Count Viewer”. October 2, 2016. https://www.opendataphilly.org/dataset/traffic-count-viewer [Google Scholar]
- De Miguel E, Llamas JF, Chacón E, Berg T, Larssen S, Røyset O, & Vadset M (1997). Origin and patterns of distribution of trace elements in street dust: Unleaded petrol and urban lead. Atmos. Environ 31(17), 2733–2740. 10.1016/S1352-2310(97)00101-5 [DOI] [Google Scholar]
- Dietrich M, Huling J, & Krekeler MPS (2018). Metal pollution investigation of Goldman Park, Middletown Ohio: Evidence for steel and coal pollution in a high child use setting. Sci. Total Environ 618, 1350–1362. 10.1016/j.scitotenv.2017.09.246 [DOI] [PubMed] [Google Scholar]
- Domingo JL (1989). Cobalt in the Environment and Its Toxicological Implications BT - Reviews of Environmental Contamination and Toxicology In Ware GW (Ed.) (pp. 105–132). New York, NY: Springer New York; 10.1007/978-1-4613-8850-0_3 [DOI] [PubMed] [Google Scholar]
- Duong TT, & Lee BK (2011). Determining contamination level of heavy metals in road dust from busy traffic areas with different characteristics. J. Environ. Manage 92(3), 554–562. 10.1016/j.jenvman.2010.09.010 [DOI] [PubMed] [Google Scholar]
- Duzgoren-Aydin NS, Wong CSC, Aydin A, Song Z, You M, & Li XD (2006). Heavy metal contamination and distribution in the urban environment of Guangzhou, SE China. Environ. Geochem. Health 28, 375–391. [DOI] [PubMed] [Google Scholar]
- Egodawatta P, Thomas E, & Goonetilleke A (2009). Understanding the physical processes of pollutant build-up and wash-off on roof surfaces. Sci. Total Environ 407, 1834–1841. 10.1016/j.scitotenv.2008.12.027 [DOI] [PubMed] [Google Scholar]
- El Samrani AG, Lartiges BS, Ghanbaja J, Yvon J, & Kohler A (2004). Trace element carriers in combined sewer during dry and wet weather: an electron microscope investigation. Water Res. 38, 2063–2076. [DOI] [PubMed] [Google Scholar]
- Esri. “Worldmap” [basemap]. 1:1,000. “World Street Map”. September 10, 2017. http://www.arcgis.com/home/item.html?id=3b93337983e9436f8db950e38a8629af [Google Scholar]
- Faiz Y, Tufail M, Javed MT, & Chaudhry M (2009). Road dust pollution of Cd, Cu, Ni, Pb and Zn along Islamabad Expressway, Pakistan. Microchem. J 92, 186–192. 10.1016/j.microc.2009.03.009 [DOI] [Google Scholar]
- Ferreira-Baptista L, & De Miguel E (2005). Geochemistry and risk assessment of street dust in Luanda, Angola: A tropical urban environment. Atmos. Environ 39(25), 4501–4512. 10.1016/j.atmosenv.2005.03.026 [DOI] [Google Scholar]
- Garg A, & Landrigan PJ (2002). Children’s environmental health: new gains in science and policy. Annals of the American Academy of Political and Social Science, 584, 135–144. [Google Scholar]
- Gieré R, Carelton LE, & Lumpkin GR (2003). Micro- and nanochemistry of fly ash from a coal-fired power plant. Am. Mineral 88(11–12), 1853–1865. 10.2138/am-2003-11-1228 [DOI] [Google Scholar]
- Graney JR, Halliday AN, Keeler GJ, Nriagu JO, Robbins JA, & Norton SA (1995). Isotopic record of lead pollution in lake sediments from the Northeastern United States. Geochim. Cosmochim. Ac 59(9), 1715–1728. [Google Scholar]
- Grigoratos T, & Martini G (2015). Brake wear particle emissions: a review. Environ. Sci. Pollut. Res 22, 2491–2504. 10.1007/s11356-014-3696-8. [DOI] [PMC free article] [PubMed] [Google Scholar]
- Hu X, Zhang Y, Luo J, Wang T, Lian H, & Ding Z (2011). Bioaccessibility and health risk of arsenic, mercury and other metals in urban street dusts from a mega-city, Nanjing, China. Environ. Pollut 159, 1215–1221. [DOI] [PubMed] [Google Scholar]
- Huang S, Peng B, Yang Z, Chai L, & Zhou L (2009). Chromium accumulation, microorganism population and enzyme activities in soils around chromium-containing slag heap of steel alloy factory. Trans. Nonferrous Met. Soc. China 19, 241–248. [Google Scholar]
- Hubbard C, & Snyder R (1988). RIR - Measurement and Use in Quantitative XRD. Powder Diffr. 3(2), 74–77. doi: 10.1017/S0885715600013257 [DOI] [Google Scholar]
- Kabadayi F, & Cesur H (2010). Determination of Cu, Pb, Zn, Ni, Co, Cd, and Mn in road dusts of Samsun City. Environ. Monit. Assess 168, 241–253. [DOI] [PubMed] [Google Scholar]
- Kastury F, Smith E, Juhasz AL, & Gan J (2017). A critical review of approaches and limitations of inhalation bioavailability and bioaccessibility of metal(loid)s from ambient particulate matter or dust. Sci. Total Environ 574, 1054–1074. 10.1016/j.scitotenv.2016.09.056 [DOI] [PubMed] [Google Scholar]
- Keshavarzi B, Tazarvi Z, Rajabzadeh MA, & Najmeddin A (2015). Chemical speciation, human health risk assessment and pollution level of selected heavy metals in urban street dust of Shiraz, Iran. Atmos. Environ 119, 1–10. 10.1016/j.atmosenv.2015.08.001 [DOI] [Google Scholar]
- Khairy MA, Barakat AO, Mostafa AR, & Wade TL (2011). Multielement determination by flame atomic absorption of road dust samples in Delta Region, Egypt. Microchem. J 97, 234–242. [Google Scholar]
- Kong S, Lu B, Bai Z, Zhao X, Chen L, Han B, Li Z, Ji Y, Xu Y, Liu Y, & Jiang H (2011). Potential threat of heavy metals in re-suspended dusts on building surfaces in oilfield city. Atmos. Environ 45, 4192–4204. [Google Scholar]
- Legalley E, & Krekeler MPS (2013). A mineralogical and geochemical investigation of street sediment near a coal-fired power plant in Hamilton, Ohio: An example of complex pollution and cause for community health concerns. Environ. Pollut 176, 26–35. 10.1016/j.envpol.2012.12.012 [DOI] [PubMed] [Google Scholar]
- Li X, Poon C, & Liu PS (2001). Heavy metal concentration of urban soils and street dusts in Hong Kong. Appl. Geochem 16, 1361–1368. 10.1016/S0883-2927(01)00045-2 [DOI] [Google Scholar]
- Li Z, Feng X, Li G, Bi X, Zhu J, Qin H, Dai Z, Liu J, Li Q, & Sun G (2013). Distributions, sources and pollution status of 17 trace metal/ metalloids in the street dust of a heavily industrialized city of central China. Environ. Pollut 182, 408–416. 10.1016/j.envpol.2013.07.041 [DOI] [PubMed] [Google Scholar]
- Li F, Zhang J, Huang J, Huang D, Yang J, Song Y, & Zeng G (2016). Heavy metals in road dust from Xiandao District, Changsha City, China: characteristics, health risk assessment, and integrated source identification. Environ. Sci. and Pollut. Res 23(13), 13100–13113. 10.1007/s11356-016-6458-y [DOI] [PubMed] [Google Scholar]
- Lim SS, Vos T, Flaxman AD, Danaei G, Shibuya K, Adair-Rohani H, … & Ezzati M (2012). A comparative risk assessment of burden of disease and injury attributable to 67 risk factors and risk factor clusters in 21 regions, 1990–2010: A systematic analysis for the Global Burden of Disease Study 2010. The Lancet, 380(9859), 2224–2260. 10.1016/S0140-6736(12)61766-8 [DOI] [PMC free article] [PubMed] [Google Scholar]
- Liu E, Yan T, Birch G, & Zhu Y (2014). Pollution and health risk of potentially toxic metals in urban road dust in Nanjing, a mega-city of China. Sci. Total Environ 476–477, 522–531. 10.1016/j.scitotenv.2014.01.055 [DOI] [PubMed] [Google Scholar]
- Lough GC, Schauer JJ, Park JS, Shafer MM, DeMinter JT, & Weinstein JP (2005). Emission of metals associated with motor vehicle roadways. Environ. Sci. Technol 39, 826–836. doi: 10.1021/es048715f [DOI] [PubMed] [Google Scholar]
- Lu X, Wang L, Lei K, Huang J, & Zhai Y (2009). Contamination assessment of copper, lead, zinc, manganese and nickel in street dust of Baoji, NW China. J. Hazard. Mater 161, 1058–1062. 10.1016/j.jhazmat.2008.04.052 [DOI] [PubMed] [Google Scholar]
- Lu X, Wang L, Li LY, Lei K, Huang L, & Kang D (2010). Multivariate statistical analysis of heavy metals in street dust of Baoji, NW China. J. Hazard. Mater 173, 744–749. [DOI] [PubMed] [Google Scholar]
- Lusby G, Hall C, & Reiners J (2015). Lead Contamination of Surface Soils in Philadelphia from Lead Smelters and Urbanization. Environ. Justice 8(1), 6–14. doi: 10.1089/env.2014.0008 [DOI] [Google Scholar]
- Manno E, Varrica D, & Dongarrà G (2006). Metal distribution in road dust samples collected in an urban area close to a petrochemical plant at Gela, Sicily. Atmos. Environ 40(30), 5929–5941. 10.1016/j.atmosenv.2006.05.020 [DOI] [Google Scholar]
- Matzka J, & Maher BA (1999). Magnetic biomonitoring of roadside tree leaves: identification of spatial and temporal variations in vehicle derived particulates. Atmos. Environ 33, 4565–4569. [Google Scholar]
- NIST (National Institute of Standards and Technology). (2010). Certificate of Analysis, Standard Reference Material 2710a Montana I Soil. Highly elevated trace element concentrations. [Google Scholar]
- NOAA (National Oceanic and Atmospheric Administration). Station Name: PA PHILADELPHIA INTL AP. National Oceanic and Atmospheric Administration. Retrieved August 16th, 2019. [Google Scholar]
- Ordonez A, Loredo J, De Miguel E, & Charlesworth SM (2003). Distribution of heavy metals in the street dusts and soils of an industrial city in northern Spain. Arch. Environ. Contam. Toxicol 44, 160–170. [DOI] [PubMed] [Google Scholar]
- Padoan E, Romè C, & Ajmone-Marsan F (2017). Bioaccessibility and size distribution of metals in road dust and roadside soils along a peri-urban transect. Sci. Total Environ 601–602, 89–98. 10.1016/j.scitotenv.2017.05.180 [DOI] [PubMed] [Google Scholar]
- Pant P, & Harrison RM (2013). Estimation of the contribution of road traffic emissions to particulate matter concentrations from field measurements: A review. Atmos. Environ 77, 78–97. 10.1016/j.atmosenv.2013.04.028 [DOI] [Google Scholar]
- Paulachok GN (1991). Geohydrology and Ground-Water Resources of Philadelphia, Pennsylvania. United States Geological Survey Water-Supply Paper 2346, 1–79. [Google Scholar]
- Pennsylvania Geologic Survey. “Geologic Map”. 1:250,000. “Bedrock Geology of Pennsylvania”. January 23, 2018. https://www.dcnr.pa.gov/Geology/PublicationsAnddata/Pages/default.aspx
- Philadelphia Childhood Lead Poisoning Prevention Advisory Group. (2017). Final Report and Recommendations. City of Philadelphia Reports, 1–20. [Google Scholar]
- Querol X, Moreno T, Karanasiou A, Reche C, Alastuey A, Viana M, Font O, Gil J, de Miguel E, & Capdevila A (2012). Variability of levels and composition of PM10 and PM2.5 in the Barcelona metro system. Atmos. Chem. Phys 12, 5055–5076. 10.5194/acp-12-5055-2012 [DOI] [Google Scholar]
- Rasmussen PE, Subramanian KS, & Jessiman BJ (2001). A multi-element profile of house dust in relation to exterior dust and soils in the city of Ottawa, Canada. Sci. Total Environ 267(1–3), 125–140. 10.1016/S0048-9697(00)00775-0 [DOI] [PubMed] [Google Scholar]
- Robertson DJ, Taylor KG, & Hoon SR (2003). Geochemical and mineral magnetic characterisation of urban sediment particulates, Manchester, UK. Appl. Geochem 18(2), 269–282. 10.1016/S0883-2927(02)00125-7 [DOI] [Google Scholar]
- Ruderman W, Laker B, & Purcell D (2017). “In booming Philadelphia neighborhoods, lead-poisoned soil is resurfacing.” The Philadelphia Inquirer, Philadelphia Media Network, http://media.inquirer.com/storage/special_projects/philadelphia-lead-soil-fishtown-construction-dust.html. Accessed 19 June 2017. [Google Scholar]
- Rudnick RL, & Gao S (2003). Composition of the Continental Crust. Treatise on Geochemistry. 3, 1–64. 10.1016/B0-08-043751-6/03016-4 [DOI] [Google Scholar]
- Schwar MJR, Moorcroft JS, Laxen DPH, Thompson M, & Armorgie C (1988). Baseline metal-in-dust concentrations in Greater London. Sci. Total Environ 68, 25–43. [DOI] [PubMed] [Google Scholar]
- Scranton P Figured Tapestry: Production, markets, and power in Philadelphia textiles, 1885–1941, Cambrige University Press: New York, 1989. Print. [Google Scholar]
- Sedlazeck KP, Höllen D, Müller P, Mischitz R, & Gieré R (2017). Mineralogical and geochemical characterization of a chromium contamination in an aquifer – A combined analytical and modeling approach. Appl. Geochem 87, 44–56. 10.1016/j.apgeochem.2017.10.011 [DOI] [Google Scholar]
- Select Greater Philadelphia Council. 2016. At the heart of good buisness Greater Philadelphia. The Chamber of Commer for Greater Philadelphia Report. 1–24. [Google Scholar]
- Shi G, Chen Z, Xu S, Zhang J, Wang L, Bi C, & Teng J (2008). Potentially toxic metal contamination of urban soils and roadside dust in Shanghai, China. Environ. Pollut 156(2), 251–260. 10.1016/j.envpol.2008.02.027 [DOI] [PubMed] [Google Scholar]
- Shi G, Chen Z, Bi C, Li Y, Teng J, Wang L, & Xu S (2010). Comprehensive assessment of toxic metals in urban and suburban street deposited sediments (SDSs) in the biggest metropolitan area of China. Environ. Pollut 158(3), 694–703. [DOI] [PubMed] [Google Scholar]
- Shi G, Chen Z, Bi C, Wang L, Teng J, Li Y, & Xu S (2011). A comparative study of health risk of potentially toxic metals in urban and suburban road dust in the most populated city of China. Atmos. Environ 45, 765–771. https://doi: 10.1016/j.atmosenv.2010.08.039 [DOI] [Google Scholar]
- Smolders E, & Degryse F (2002). Fate and Effect of Zinc from Tire Debris in Soil. Environ. Sci. Technol 36(17), 3706–3710. 10.1021/es025567p [DOI] [PubMed] [Google Scholar]
- Sommer F, Dietze V, Baum A, Sauer J, Gilge S, Maschowski C, & Gieré R (2018). Tire abrasion as a major source of microplastics in the environment. Aerosol Air Qual. Res 18(8), 2014–2028. [Google Scholar]
- Tanner PA, Ma HL, & Yu PKN (2008). Fingerprinting metals in urban street dust of Beijing, Shanghai, and Hong Kong. Environ. Sci. Technol 42, 7111–7117. [DOI] [PubMed] [Google Scholar]
- Thorpe A, & Harrison RM (2008). Sources and properties of non-exhaust particulate matter from road traffic: A review. Sci. Total Environ 400, 270–282. 10.1016/j.scitotenv.2008.06.007 [DOI] [PubMed] [Google Scholar]
- Tokalıoğlu Ş, & Kartal Ş (2006) Multivariate analysis of the data and speciation of heavy metals in street dust samples from the Organized Industrial District in Kayseri (Turkey). Atmos. Environ 40, 2797–2805. [Google Scholar]
- United Nations. (2012). World Urbanization Prospects: the 2011 Revision. CD-ROM Edition. [Google Scholar]
- United Nations, Department of Economic and Social Affairs, Population Division. (2014). World urbanization prospects: the 2014 revision, highlights (ST/ESA/SER.A/352). [Google Scholar]
- USEPA. (1996). Method-3050B Acid digestion of sediments, sludges, and soils. Washington, DC. [Google Scholar]
- Varrica D, Dongarrà G, Sabatino G, & Monna F (2003). Inorganic geochemistry of roadway dust from the metropolitan area of Palermo, Italy. Environ. Geol 44(2), 222–230. 10.1007/s00254-002-0748-z [DOI] [Google Scholar]
- Vermillion B, Brugam R, Retzlaff W, & Bala I (2005). The sedimentary record of environmental lead contamination at St. Louis, Missouri (USA) area smelters. J. Paleolimnol 33(2), 189–203. [Google Scholar]
- Wang Y, Hopke PK, Xia X, Rattigan OV, Chalupa DC, & Utell MJ (2012). Source apportionment of airborne particulate matter using inorganic and organic species as tracers. Atmos. Environ 55, 525–532. 10.1016/j.atmosenv.2012.03.073 [DOI] [Google Scholar]
- Wei B, Jiang F, Li X, & Mu S (2009). Spatial distribution and contamination assessment of heavy metals in urban road dusts from Urumqi, NW China. Microchem. J 98, 147–152. https://doi:10.1016/j.microc.2009.06.001 [Google Scholar]
- Wei B, & Yang L (2010). A review of heavy metal contaminations in urban soils, urban road dusts and agricultural soils from China. Microchem. J 94, 99–107. 10.1016/j.microc.2009.09.014 [DOI] [Google Scholar]
- Wei X, Gao B, Wang P, Zhou H, & Lu J (2015). Pollution characteristics and health risk assessment of heavy metals in street dusts from different functional areas in Beijing, China. Ecotoxicol. Environ. Saf 112, 186–192. 10.1016/j.ecoenv.2014.11.005 [DOI] [PubMed] [Google Scholar]
- Weiss J (1949). Wissahickon Schist At Philadelphia, Pennsylvania. Bull. Geo. Soc. Amer 60, 1689–1726. [Google Scholar]
- White K, Detherage T, Verellen M, Tully J, & Krekeler MPS (2014). An investigation of lead chromate (crocoite-PbCrO4) and other inorganic pigments in aged traffic paint samples from Hamilton, Ohio: Implications for lead in the environment. Environ. Earth Sci 71(8), 3517–3528. 10.1007/s12665-013-2741-0 [DOI] [Google Scholar]
- Yang T, Liu Q, Li H, Zeng Q, & Chan L (2010). Anthropogenic magnetic particles and heavy metals in the road dust: magnetic identification and its implications. Atmos. Environ 44, 1175–1185. [Google Scholar]
- Yongming H, Peixuan D, Junji C, & Posmentier ES (2006). Multivariate analysis of heavy metal contamination in urban dusts of Xi’an, Central China. Sci. Total Environ 355(1–3), 176–186. 10.1016/j.scitotenv.2005.02.026 [DOI] [PubMed] [Google Scholar]
- Zhang XY, Lin FF, Wong MTF, Feng XL, & Wang K (2009). Identification of soil heavy metal sources from anthropogenic activities and pollution assessment of Fuyang County, China. Environ. Monit. Assess 154, 439–449. [DOI] [PubMed] [Google Scholar]
- Zhang X, Yang L, Li Y, Li H, Wang W, & Ye B (2012). Impacts of lead/zinc mining and smelting on the environment and human health in China. Environ. Monit. Assess 184(4), 2261–2273. 10.1007/s10661-011-2115-6 [DOI] [PubMed] [Google Scholar]
- Zhao H, & Li X (2013). Understanding the relationship between heavy metals in road-deposited sediments and washoff particles in urban stormwater using simulated rainfall. J. Hazard. Mater 246(247), 267–276. 10.1016/j.jhazmat.2012.12.035 [DOI] [PubMed] [Google Scholar]
- Zhao N, Lu X, & Chao S (2014). Level and contamination assessment of environmentally sensitive elements in smaller than 100 μm street dust particles from Xining, China. Int. J. Environ. Res. Public Health 11, 2536–2549. [DOI] [PMC free article] [PubMed] [Google Scholar]
- Zhao H, Shao Y, Yin C, Jiang Y, & Li X (2016). An index for estimating the potential metal pollution contribution to atmospheric particulate matter from road dust in Beijing. Sci. Total Environ 550, 167–175. [DOI] [PubMed] [Google Scholar]
- Zheng N, Liu J, Wang Q, & Liang Z (2010). Health risk assessment of heavy metal exposure to street dust in the zinc smelting district, Northeast of China. Sci. Total Environ 408, 726–733. 10.1016/j.gexplo.2016.04.007 [DOI] [PubMed] [Google Scholar]
- Zhu W, Bian B, & Li L (2008). Heavy metal contamination of road-deposited sediments in a medium size city of China. Environ. Monit. Assess 147, 171–181. [DOI] [PubMed] [Google Scholar]
- Žibret G, Van Tonder D, & Žibret L (2013). Metal content in street dust as a reflection of atmospheric dust emissions from coal power plants, metal smelters, and traffic. Environ. Sci. Pollut. Res 20(7), 4455–4468. 10.1007/s11356-012-1398-7 [DOI] [PubMed] [Google Scholar]
Associated Data
This section collects any data citations, data availability statements, or supplementary materials included in this article.


