Abstract
Objective
To identify glioma radiomic features associated with proliferation-related Ki-67 antigen and cellular tumour antigen p53 levels, common immunohistochemical markers for differentiating benign from malignant tumours, and to generate radiomic prediction models.
Methods
Patients with glioma, who were scanned before therapy using standard brain magnetic resonance imaging (MRI) protocols on T1 and T2 weighted imaging, were included. For each patient, regions-of-interest (ROI) were drawn based on tumour and peritumoral areas (5/10/15/20 mm), and features were identified using feature calculations, and used to create and assess logistic regression models for Ki-67 and p53 levels.
Results
A total of 92 patients were included. The best area under the curve (AUC) for the Ki-67 model was 0.773 for T2 weighted imaging in solid glioma (sensitivity, 0.818; specificity, 0.833), followed by a less reliable AUC of 0.773 (sensitivity, 0.727; specificity 0.667) in 20-mm peritumoral areas. The highest AUC for the p53 model was 0.709 (sensitivity, 1; specificity, 0.4) for T2 weighted imaging in 10-mm peritumoral areas.
Conclusion
Using T2-weighted imaging, the prediction model for Ki-67 level in solid glioma tissue was better than the p53 model. The 20-mm and 10-mm peritumoral areas in the Ki-67 and p53 model, respectively, showed predictive effects, suggesting value in further research into areas without conventional MRI features.
Keywords: Radiomics, glioma, cell proliferation, Ki-67 antigen, tumour suppressor protein p53, magnetic resonance imaging
Introduction
Glioma is the most common tumour of the central nervous system. In clinical practice, precise tumour classification assists neuro-oncologists in patient treatment and in evaluating the entire prognosis.1 Tumour grade-guided treatment for gliomas is determined using molecular markers and histopathological characteristics, and a series of molecular markers have been found that are helpful in clinical diagnosis as well as prognosis.2 To introduce the concept of using molecular parameters in constructing diagnoses of central nervous system tumours, the 2016 World Health Organisation’s classification of central nervous system tumours used molecular parameters in addition to histology to define several tumour characteristics.3 Diagnoses based on molecular pathological typing of gliomas are more accurate in determining clinical prognosis.3,4
Proliferation-related Ki-67 antigen is closely related to the cell cycle, directly reflecting cell proliferation, and is closely related to tumour progression. Ki-67 has lower expression in normal brain tissues, compared with high expression levels in glioma cells.5 Higher positive values for the Ki-67 marker index relate to higher degree of malignancy (grade) and worse prognosis,6 and low levels of Ki-67 protein are reported to be significantly correlated with mutation in the isocitrate dehydrogenase (NADP(+))1 (IDH1) gene,7 thus Ki-67 may be used as a prognostic indicator of glioma.8
The tumour protein p53 (TP53) gene is a tumour suppressor gene that affects the occurrence and development of glioma.9 Hence, p53 acts as an indicator of poor prognosis and malignant transformation, and has also been shown to be associated with radiotherapy and chemotherapy effects in patients with malignancy.10,11
Radiomics is an advanced non-invasive radiological analysis method. In glioma research, a series of prediction models are obtained by establishing the correlation between key clinical features and image features. A series of studies have shown that radiomics may be used to predict genome, protein, transcriptome and clinical prognosis.12–14
Existing research relies on the macroscopic features of conventional magnetic resonance imaging (MRI) to outline regions of interest (ROI). The aim of the present study was to outline peritumoral zones in MR images according to fixed width, and to explore prediction models established using ROIs based on these zones, and levels of Ki-67 and p53.
Patients and methods
Study population
In this retrospective study, patients with pathologically confirmed glioma, who were treated at Zhejiang Provincial People’s Hospital, were sequentially enrolled between January 2013 and September 2018. Inclusion criteria comprised: patients who underwent glioma resection and who had Ki-67 and/or p53 immunohistochemical results for resected tissue. The exclusion criteria were as follows: (1) patients who underwent preoperative craniotomy or chemoradiotherapy prior to scanning; (2) patients with a self or family history of mental disorders or diseases of the nervous system; and (3) patients with a history of craniocerebral trauma. Data regarding patient demographics, MRI images, and Ki-67 and p53 levels were obtained from clinical records.
The study was approved by the Ethics Committee of Zhejiang Provincial People’s Hospital (No. 2013KY066). All participants provided written informed consent prior to commencement of the research, and the study was conducted according to the Declaration of Helsinki.
Imaging
All patients received standardized MRI of the brain using a Discovery MR750 3.0T MR system (GE Healthcare, Waukesha, WI, USA). A common MRI protocol in T2-weighted fast spin-echo images (T2-FSE) and T1-weighted fluid-attenuated inversion recovery (T1-FLAIR) images was used.
Following acquisition, images were preprocessed using Artificial Intelligence Kit software (A.K; GE Healthcare Life Sciences) as follows: (1) Resampling, all maps were resampled to 1 mm3 (Interpolation, Linear); (2) Denoising, Gaussian 0.50. Bias Correct, MR Bias Field Correction; (3) Intensity standardization (Grey level Standardization), Desired minimum of 0.0 and desired maximum of 255.0.
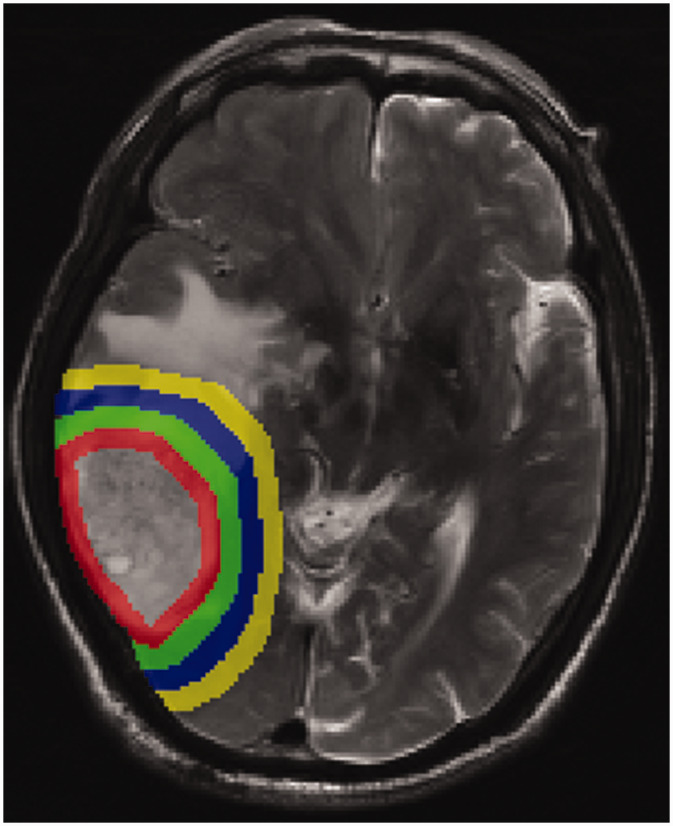
Following preprocessing, the region of interest (ROI) was drawn using ITK software (‘ITK-SNAP’; https: //www.itksnap.org/). The boundary of the tumour was determined by the T1 sequence, then the solid parts of the tumour on the T1 and T2 sequences were delineated based on this reference, and using this, the peritumoral areas were expanded by 5 mm steps. A representative image of the solid tumour components and peritumoral areas (5/10/15/20 mm) is presented in Figure 1. All segmentations were finished by a radiologist (XS) and checked by a neuroradiologist (LL). Any disagreements were resolved by integrating the opinion of a third neuroradiologist (ZD). Unresolved disagreements between radiologist and neuroradiologist were resolved by taking the overlapping ROI. All statistical tests were performed using SPSS software, version 20 (IBM, Armonk, NY, USA).
Figure 1.
Representative brain magnetic resonance image of the peritumoral areas (5/10/15/20 mm, respectively).
Feature calculation
First, the original T1-FLAIR and T2-FSE imaging and ROI images were loaded into the A.K software, then features were selected in the operation interface, including Form factor, Histogram, Haralick, grey level run-length matrix (RLM) and grey level co-occurrence matrix (GLCM), with 396 features extracted from these data. Next, a label regarding Ki-67 and p53 was added for each patient. In the model for Ki-67 level, a value of ≥10% of cells expressing Ki-67 was labelled 1 and Ki-67 <10% was labelled 0.15 In the model for p53 level, p53+ (positive) was labelled 1 and p53– (negative) was labelled 0.
Feature selection
Preprocessing steps
Abnormal values (non-calculated values or outliers) were replaced by the sample mean. (2) The ratio of actual data to training data was 0.7, and for the test data was 0.3.
Selection steps
Feature data were first assessed for normality of distribution. Differences between features with normally distributed data were analysed by Student’s t-test; and data without normal distribution were analysed by rank–sum U-test. A P value < 0.05 was considered statistically significant.
Correlation analysis was used to reduce the dimensions as follows: The extracted features were ordered 1–396. Spearman’s rank correlation coefficient (filter threshold 0.9) was performed on any of two feature columns. If the correlation coefficient was >0.9, then the means of two features were highly correlated, thus, the previous feature was retained and the other excluded.
The most meaningful features were chosen by the LASSO regression model and least absolute shrinkage in the training data. The sum of squares of residuals should be minimized, wherein the absolute sum of the selected characteristic coefficients does not exceed the tuning parameter (λ). In the LASSO model, the minimum criterion (λ) based on 10 cross validations was chosen. This method was used for regression analyses of high-dimensional data.16
Machine learning
First, training and test data were used for designing and checking the models, then, the logistic regression process was used to build the model for predicting Ki-67 and p53 level. The method was based on linear function, which was introduced into the sigmoid function as an independent variable. The classification was determined according to the probability P of output (the classification result being 1).
In the training and test groups, the area under the curve (AUC) for receiver-operator characteristic (ROC) curves was used to quantify the prediction accuracy of radiology features.
Results
A total of 92 patients were included in the study, who had the following data available: Ki-67 data, 55 patients; p53 data, 51 patients; and Ki-67 plus p53 data, 49 patients (Table 1). The ratio of Ki-67 ≥10% to Ki-67 < 10% was 6: 11 in the test data set, and 7: 12 in the training data set.
Table 1.
Clinical and demographic data from 92 patients with pathologically confirmed glioma.
| Demographic | Clinical parameter |
|||||
|---|---|---|---|---|---|---|
| Ki-67 (label 0,1)a |
Statistical significance | p53 (label 0,1)b |
Statistical significance | |||
| 0 (n = 20) | 1 (n = 35) | 0 (n = 16) | 1 (n = 35) | |||
| Age, years | 42.950 ± 16.288 | 51.343 ± 15.117 | NS | 52.750 ± 14.429 | 51.829 ± 14.557 | NS |
| Sex, male/female | 12/8 | 23/12 | NS | 12/4 | 23/12 | NS |
Data presented as n prevalence or mean ± SD.
a0 = Ki-67 <10% and 1 = Ki-67 ≥10%; b0 = p53– and 1 = p53+.
NS, no statistically significant between-group difference (P > 0.05).
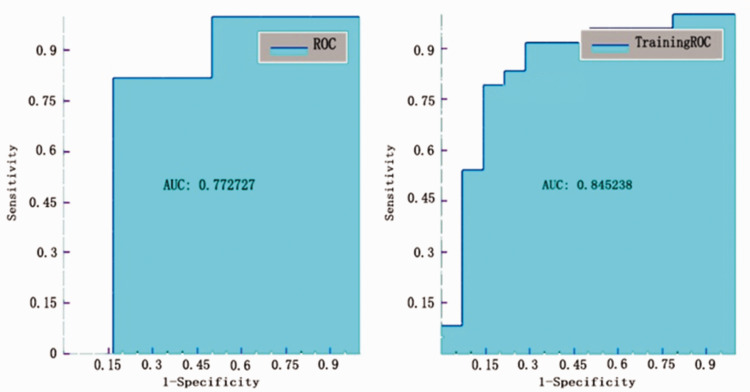
Results from testing the models using ROC curve analyses found that the best AUC value was shown for the T2 solid model to classify Ki-67 ≥10% from Ki-67 < 10%, which produced an AUC of 0.773 (Figure 2) with sensitivity, specificity, accuracy, and precision values of 0.818, 0.833, 0.824, 0.9, respectively (Table 2).
Figure 2.
Receiver operating characteristic (ROC) curve analysis of testing and training data for the Ki-67 model in the T2 solid tumour area.
Table 2.
Receiver operating curve analyses of radiomic models for predicting Ki-67 levels in patients with glioma using different regions of interest.
| MRI region |
||||||
|---|---|---|---|---|---|---|
| T1 solid | T2 solid | T2 5 mm | T2 10 mm | T2 15 mm | T2 20 mm | |
| Accuracy | 0.647 | 0.824 | 0.588 | 0.705 | 0.706 | 0.706 |
| Sensitivity | 0.727 | 0.818 | 0.818 | 0.818 | 0.727 | 0.727 |
| Specificity | 0.5 | 0.833 | 0.167 | 0.5 | 0.667 | 0.667 |
| AUC | 0.621 | 0.773 | 0.636 | 0.652 | 0.651 | 0.773 |
| Precision | 0.727 | 0.9 | 0.643 | 0.75 | 0.8 | 0.8 |
MRI, magnetic resonance imaging; AUC, area under the curve; solid, solid tumour region in T1 or T2 weighted images; 5/10/15/20 mm, peritumoral regions in T2-weighted images.
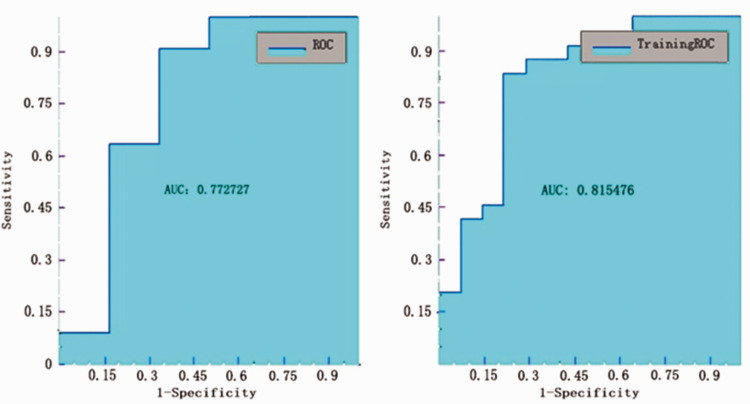
The AUC value for the T2 20-mm peritumoral area model to classify Ki-67 ≥10% from Ki-67 <10% was also found to be 0.773 (Figure 3), but with sensitivity, specificity, accuracy, and precision values of 0.727, 0.667, 0.706, 0.8, respectively (Table 2).
Figure 3.
Receiver operating characteristic (ROC) curve analysis of testing and training data for the ROC curve of testing and training data for the Ki-67 model in the T2 20-mm peritumoral areas.
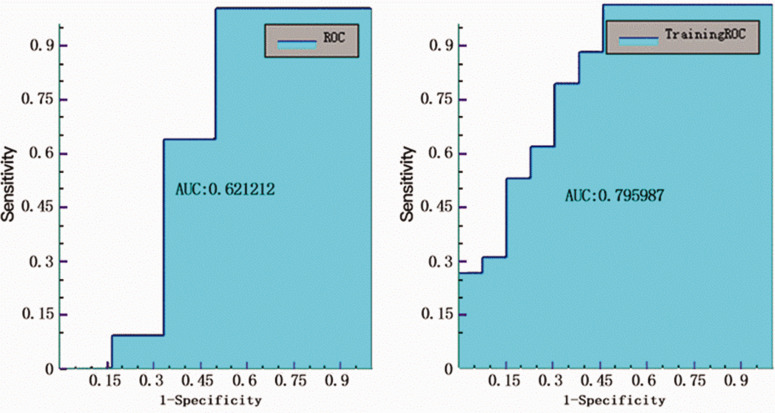
The lowest AUC value was 0.621 for the T1 solid model to classify Ki-67 ≥10% from Ki-67 <10% (Figure 4), with sensitivity, specificity, accuracy, and precision values of 0.727, 0.5, 0.647, 0.727, respectively (Table 2).
Figure 4.
Receiver operating characteristic (ROC) curve analysis of testing and training data for the Ki-67 model in the T1 solid tumour area.
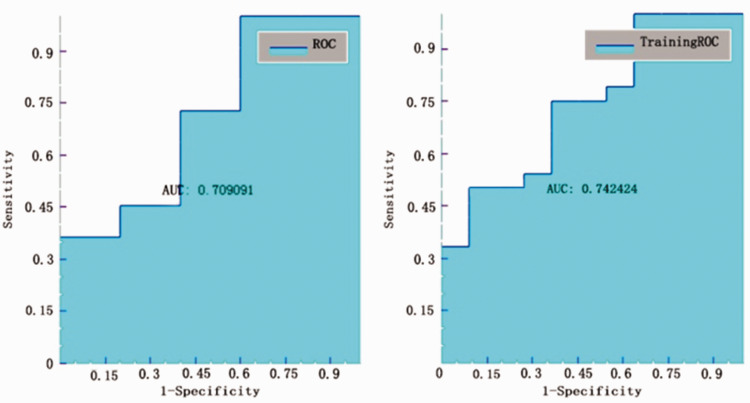
The ratio of p53+ to p53– was 5: 11 in the test data set, and 11: 24 in the training data set.
Testing the models using ROC curve analyses showed that the best AUC value was found for T2 10-mm peritumoral area model to classify p53+ from p53–, which produced an AUC of 0.709 (Figure 5), with sensitivity, specificity, accuracy, and precision values of 1, 0.4, 0.813, 0.786, respectively (Table 3).
Figure 5.
Receiver operating characteristic (ROC) curve analysis of testing and training data for the p53 model in the T2 10-mm peritumoral areas.
Table 3.
Receiver operating curve analyses of radiomic models for predicting p53 levels in patients with glioma using different regions of interest.
| MRI region |
||||||
|---|---|---|---|---|---|---|
| T1 solid | T2 solid | T2 5 mm | T2 10 mm | T2 15 mm | T2 20 mm | |
| Accuracy | 0.688 | 0.562 | 0.562 | 0.813 | 0.5 | 0.688 |
| Sensitivity | 0.636 | 0.636 | 0.727 | 1 | 0.636 | 0.909 |
| Specificity | 0.8 | 0.4 | 0.2 | 0.4 | 0.2 | 0.2 |
| AUC | 0.673 | 0.382 | 0.527 | 0.709 | 0.381 | 0.4 |
| Precision | 0.875 | 0.7 | 0.666 | 0.786 | 0.636 | 0.714 |
MRI, magnetic resonance imaging; AUC, area under the curve; solid, solid tumour region in T1 or T2 weighted images; 5/10/15/20 mm, peritumoral regions in T2-weighted images.
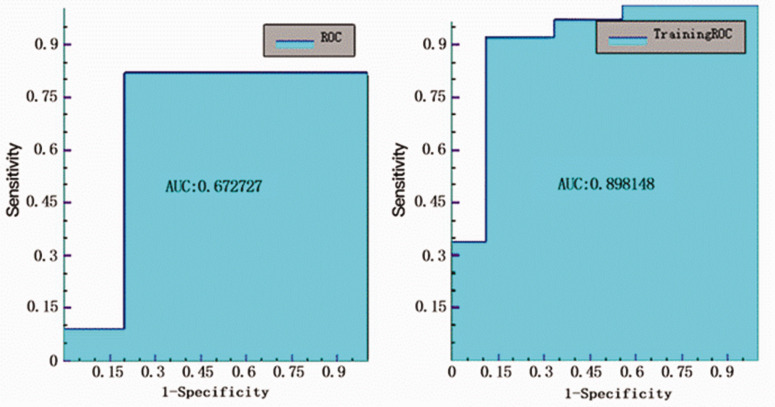
The AUC value for the T1 solid model to classify p53+ from p53– was 0.673 (Figure 6), with sensitivity, specificity, accuracy, and precision values of 0.636, 0.8, 0.688, 0.875, respectively (Table 3).
Figure 6.
Receiver operating characteristic (ROC) curve analysis of testing and training data for the p53 model in the T1 solid tumour area.
Specific features calculations for the different models in different radiographic areas are provided as supplemental material.
Discussion
The present study employed a radiomics approach to investigate the potential association between quantitative imaging features extracted from MR images and Ki-67 and p53 levels in patients with glioma. The results showed that a machine learning-based predictive model extracted from the imaging features could distinguish between low and high levels of Ki-67 (AUC 0.773). In the p53 model, the best AUC was 0.709, but with a specificity of 0.4. The results also showed that in the Ki-67 marker model, the 20-mm peritumoral area in the T2-weighted sequence had predictive efficiency (AUC, 0.773; and accuracy, 0.706) that was close to the solid tumour part in T2 sequence imaging.
Levels of p53 and Ki-67 are useful pathological molecular biomarkers in the diagnosis and treatment of glioma, and are widely used in the clinic.4,17 The present research suggests a potential non-invasive method for predicting levels of the Ki-67 marker, and also highlighted that p53 may have some correlation with radiomics on T2 and T1 sequences.
According to the study conducted by Su et al.,18 radiomics features are significantly correlated with the level of Ki-67. The study showed that the AUC value of a single-sequence Ki-67 model can reach 0.745, which is slightly below the value in the present study (AUC, 0.773), and the composite sequence can reach an AUC value of 0.963.18 Another study in low-grade gliomas reported an AUC value for a p53 model of 0.763, which is higher than the present study.19 This may be related to the fact that the present study was not grouped by level. Previous studies have shown that imaging histology may be helpful in predicting the molecular characteristics of gliomas and useful in targeted and personalized treatment.20,21 Furthermore, the present study showed that the 20-mm peritumoral area in T2-weighted imaging had a similar efficiency in predicting Ki-67 levels as the solid tumour part in T2-weighted imaging. Peritumoral oedema is one of the main characteristics of malignant glioma and an important factor that affects the incidence and mortality in patients with glioma.22 This may be related to the infiltration of glioma cells into the peritumoral area.23 In addition, according to a recent study, a number of glioma stem cells were found to have infiltrated into the region of the peritumoral oedema,24 and these resistant cells are, in turn, found to cause tumour recurrence.25–27 The present findings suggested that there was a correlation between radiomics features and Ki-67 in the peritumoral areas.
In the present research, the peritumoral zone was found to have different prediction capabilities in different ranges. For Ki-67 markers, with the expansion of the peritumoral areas, the model prediction accuracy was found to gradually increase, suggesting that there are texture features related to Ki-67 expression in the peritumoral zone. These results indicate that the peritumoral areas should be involved in the establishment of a glioma model. A study of peritumoral zone perfusion revealed that the peritumoral area of gliomas has different perfusion changes from metastatic tumours.28 Research often outlines ROI through solid, necrosis, and oedema areas,29 but other research has shown that infiltration of tumour cells can be found in the peritumoral areas without changes in conventional MRI results.30 Therefore, the present study used the method of extending the tumour edge outward with a fixed width, to outline and analyse the peritumoral areas, and revealed that a valuable model can also be obtained. In the analysis of glioma texture, in addition to the ROI delineation through tumour imaging, attention to the peritumoral areas without changes in conventional MRI may be complementary to the current study of glioma texture. Attention to changes in the peritumoral zone may provide more information about the radiological characteristics of gliomas.
The present results may be limited by several factors. Because the sample size is relatively small, and thus, insufficient, the performance of the classification models may have deficiencies. Therefore, a future large multicentre study is needed to assess the universalization ability of the radiomics model. Also, due to the data being relatively dated, some patients did not have contrast-enhanced T1-weighted images, diffusion-weighted images, and apparent diffusion coefficient sequence checks, and hence, further related studies are being conducted to address these improvements.
In conclusion, Ki-67 was shown to have a better correlation with radiomic features than p53 in T2 weighted imaging. Furthermore, the Ki-67 markers displayed a good predictive effect in the 20-mm peritumoral areas. These data suggest that there is further research value in the brain area without conventional MR features. The present study also found that p53 markers may be correlated with radiomics in T2 and T1-weighted sequences, and more sequence studies and explorations are warranted in further studies. With the help of these models, the tumour can be evaluated prior to surgery to obtain more information regarding the extent of surgery required, as well as the treatment and prognosis.
Supplemental Material
Supplemental material, sj-pdf-1-imr-10.1177_0300060520914466 for Radiomic prediction models for the level of Ki-67 and p53 in glioma by Xiaojun Sun, Peipei Pang, Lin Lou, Qi Feng, Zhongxiang Ding and Jian Zhou in Journal of International Medical Research
Declaration of conflicting interest
Peipei Pang is employed by GE Healthcare Life Sciences, and she participated in software use, guidance and data analysis.
Funding
This study received funding from the National Natural Science Foundation of China (No. 81871337).
ORCID iD
Xiaojun Sun https://orcid.org/0000-0002-6775-7230
Supplemental material
Supplemental material for this article is available online.
References
- 1.Louis DN, Holland EC, Cairncross JG. Glioma classification: a molecular reappraisal. Am J Pathol 2001; 159: 779–786. [DOI] [PMC free article] [PubMed] [Google Scholar]
- 2.Chen F, Becker AJ, LoTurco JJ. Contribution of tumor heterogeneity in a new animal model of CNS tumors. Mol Cancer Res 2014; 12: 742–753. [DOI] [PMC free article] [PubMed] [Google Scholar]
- 3.Louis DN, Perry A, Reifenberger G, et al. The 2016 world health organization classification of tumors of the central nervous system: a summary. Acta Neuropathol 2016; 131: 803–820. [DOI] [PubMed] [Google Scholar]
- 4.Takano S, Ishikawa E, Sakamoto N, et al. Immunohistochemistry on IDH 1/2, ATRX, p53 and Ki-67 substitute molecular genetic testing and predict patient prognosis in grade III adult diffuse gliomas. Brain Tumor Pathol 2016; 33: 107–116. [DOI] [PubMed] [Google Scholar]
- 5.Qu DW, Xu HS, Han XJ, et al. Expression of cyclinD1 and Ki-67 proteins in gliomas and its clinical significance. Eur Rev Med Pharmacol Sci 2014; 18: 516–519. [PubMed] [Google Scholar]
- 6.Cai J, Yang P, Zhang C, et al. ATRX mRNA expression combined with IDH1/2 mutational status and Ki-67 expression refines the molecular classification of astrocytic tumors: evidence from the whole transcriptome sequencing of 169 samples. Oncotarget 2014; 5: 2551–2561. [DOI] [PMC free article] [PubMed] [Google Scholar]
- 7.Wang PF, Liu N, Song HW, et al. IDH-1R132H mutation status in diffuse glioma patients: implications for classification. Oncotarget 2016; 7: 31393–31400. [DOI] [PMC free article] [PubMed] [Google Scholar]
- 8.Cahill DP, Sloan AE, Nahed BV, et al. The role of radiotherapy in the management of patients with diffuse low grade glioma: a systematic review and evidence-based clinical practice guideline. J Neurooncol 2015; 125: 531–549. [DOI] [PubMed] [Google Scholar]
- 9.Yang W, Wang H, Ju H, et al. A study on the correlation between STAT‑1 and mutant p53 expression in glioma. Mol Med Rep 2018; 17: 7807–7812. [DOI] [PubMed] [Google Scholar]
- 10.Hur H, Kim NK, Min BS, et al. Can a biomarker-based scoring system predict pathologic complete response after preoperative chemoradiotherapy for rectal cancer? Dis Colon Rectum 2014; 57: 592–601. [DOI] [PubMed] [Google Scholar]
- 11.Jin Y, Xiao W, Song T, et al. Expression and prognostic significance of p53 in glioma patients: a meta-analysis. Neurochem Res 2016; 41: 1723–1731. [DOI] [PubMed] [Google Scholar]
- 12.Kong DS, Kim J, Ryu G, et al. Quantitative radiomic profiling of glioblastoma represents transcriptomic expression. Oncotarget 2018; 9: 6336–6345. [DOI] [PMC free article] [PubMed] [Google Scholar]
- 13.Kickingereder P, Burth S, Wick A, et al. Radiomic profiling of glioblastoma: identifying an imaging predictor of patient survival with improved performance over established clinical and radiologic risk models. Radiology 2016; 280: 880–889. [DOI] [PubMed] [Google Scholar]
- 14.Zhang B, Tian J, Dong D, et al. Radiomics features of multiparametric MRI as novel prognostic factors in advanced nasopharyngeal carcinoma. Clin Cancer Res 2017; 23: 4259–4269. [DOI] [PubMed] [Google Scholar]
- 15.Cai J, Zhang C, Zhang W, et al. ATRX, IDH1-R132H and Ki-67 immunohistochemistry as a classification scheme for astrocytic tumors. Oncoscience 2016; 3: 258–265. [DOI] [PMC free article] [PubMed] [Google Scholar]
- 16.Gui J, Li H. Penalized Cox regression analysis in the high-dimensional and low-sample size settings, with applications to microarray gene expression data. Bioinformatics 2005; 21: 3001–3008. [DOI] [PubMed] [Google Scholar]
- 17.Hu X, Miao W, Zou Y, et al . Expression of p53, epidermal growth factor receptor, Ki-67 and O6-methylguanine-DNA methyltransferase in human gliomas. Oncol Lett 2013; 6: 130–134. [DOI] [PMC free article] [PubMed] [Google Scholar]
- 18.Su C, Jiang J, Zhang S, et al. Radiomics based on multicontrast MRI can precisely differentiate among glioma subtypes and predict tumour-proliferative behaviour. Eur Radiol 2019; 29: 1986–1996. [DOI] [PubMed] [Google Scholar]
- 19.Li Y, Qian Z, Xu K, et al. MRI features predict p53 status in lower-grade gliomas via a machine-learning approach. Neuroimage Clin 2018; 17: 306–311. [DOI] [PMC free article] [PubMed] [Google Scholar]
- 20.Itakura H, Achrol AS, Mitchell LA, et al. Magnetic resonance image features identify glioblastoma phenotypic subtypes with distinct molecular pathway activities. Sci Transl Med 2015; 7: 303ra138. [DOI] [PMC free article] [PubMed] [Google Scholar]
- 21.Gevaert O, Mitchell LA, Achrol AS, et al. Glioblastoma multiforme: exploratory radiogenomic analysis by using quantitative image features. Radiology 2014; 273: 168–174. [DOI] [PMC free article] [PubMed] [Google Scholar]
- 22.Lin ZX. Glioma-related edema: new insight into molecular mechanisms and their clinical implications. Chin J Cancer 2013; 32: 49–52. [DOI] [PMC free article] [PubMed] [Google Scholar]
- 23.Yamahara T, Numa Y, Oishi T, et al. Morphological and flow cytometric analysis of cell infiltration in glioblastoma: a comparison of autopsy brain and neuroimaging. Brain Tumor Pathol 2010; 27: 81–87. [DOI] [PubMed] [Google Scholar]
- 24.Ruiz‐Ontañon P, Orgaz JL, Aldaz B, et al. Cellular plasticity confers migratory and invasive advantages to a population of glioblastoma‐initiating cells that infiltrate peritumoral tissue. Stem Cells 2013; 31: 1075–1085. [DOI] [PubMed] [Google Scholar]
- 25.Zhang X, Zhang W, Mao XG, et al. Targeting role of glioma stem cells for gliobastoma multiforme. Curr Med Chem 2013; 20: 1974–1984. [DOI] [PubMed] [Google Scholar]
- 26.Chen J, Li Y, Yu TS, et al. A restricted cell population propagates glioblastoma growth after chemotherapy. Nature 2012; 488: 522–526. [DOI] [PMC free article] [PubMed] [Google Scholar]
- 27.Mangiola A, de Bonis P, Maira G, et al. Invasive tumor cells and prognosis in a selected population of patients with glioblastoma multiforme. Cancer 2008; 113: 841–846. [DOI] [PubMed] [Google Scholar]
- 28.Neiman OH, Sadetzki S, Chetrit A, et al. Perfusion-weighted imaging of peritumoral edema can aid in the differential diagnosis of glioblastoma mulltiforme versus brain metastasis. Isr Med Assoc J 2013; 15: 103–105. [PubMed] [Google Scholar]
- 29.Chaddad A, Kucharczyk MJ, Daniel P, et al. Radiomics in glioblastoma: current status and challenges facing clinical implementation. Front Oncol 2019; 9: 374. [DOI] [PMC free article] [PubMed] [Google Scholar]
- 30.Blystad I, Warntjes JBM, Smedby Ö, et al. Quantitative MRI for analysis of peritumoral edema in malignant gliomas. PLoS One 2017; 12: e0177135. [DOI] [PMC free article] [PubMed] [Google Scholar]
Associated Data
This section collects any data citations, data availability statements, or supplementary materials included in this article.
Supplementary Materials
Supplemental material, sj-pdf-1-imr-10.1177_0300060520914466 for Radiomic prediction models for the level of Ki-67 and p53 in glioma by Xiaojun Sun, Peipei Pang, Lin Lou, Qi Feng, Zhongxiang Ding and Jian Zhou in Journal of International Medical Research


