Abstract
Most patients with cancer either do not respond to immune checkpoint blockade or develop resistance to it, often because of acquired mutations that impair antigen presentation. Here we show that loss of function of the RNA-editing enzyme ADAR1 in tumour cells profoundly sensitizes tumours to immunotherapy and overcomes resistance to checkpoint blockade. In the absence of ADAR1, A-to-I editing of interferon-inducible RNA species is reduced, leading to double-stranded RNA ligand sensing by PKR and MDA5; this results in growth inhibition and tumour inflammation, respectively. Loss of ADAR1 overcomes resistance to PD-1 checkpoint blockade caused by inactivation of antigen presentation by tumour cells. Thus, effective anti-tumour immunity is constrained by inhibitory checkpoints such as ADAR1 that limit the sensing of innate ligands. The induction of sufficient inflammation in tumours that are sensitized to interferon can bypass the therapeutic requirement for CD8+ T cell recognition of cancer cells and may provide a general strategy to overcome immunotherapy resistance.
Despite the remarkable clinical successes of immune checkpoint blockade, most patients do not respond to immunotherapy, or develop therapeutic resistance because of mutations in the interferon-γ (IFNγ)- sensing pathway or in the antigen-presentation pathway1-4. There are currently no therapeutic options to overcome acquired resistance to checkpoint blockade.
We recently conducted a pooled in vivo CRISPR screen to identify genes expressed by the B16 transplantable melanoma model that, when deleted, confer sensitivity to immunotherapy5. This screen identified a number of genes with the potential to modify the response to endogenous RNA species, including Adar1, which encodes an adenosine deaminase that binds to and limits the sensing of endogenous double-stranded RNA (dsRNA)6-9. Here we show that ADAR1 functions as a checkpoint that limits anti-tumour immunity by preventing the sensing of endogenous dsRNA. Loss of function of ADAR1 improves responses to PD-1 blockade and overcomes common mechanisms of resistance to immunotherapy.
ADAR1 loss sensitizes tumours to immunotherapy
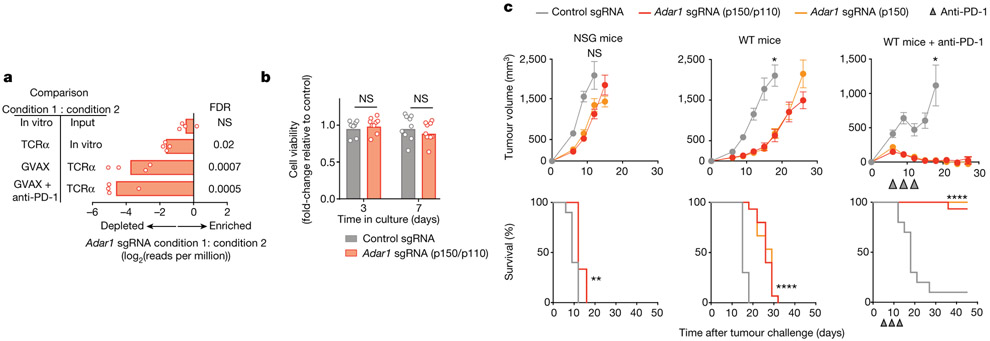
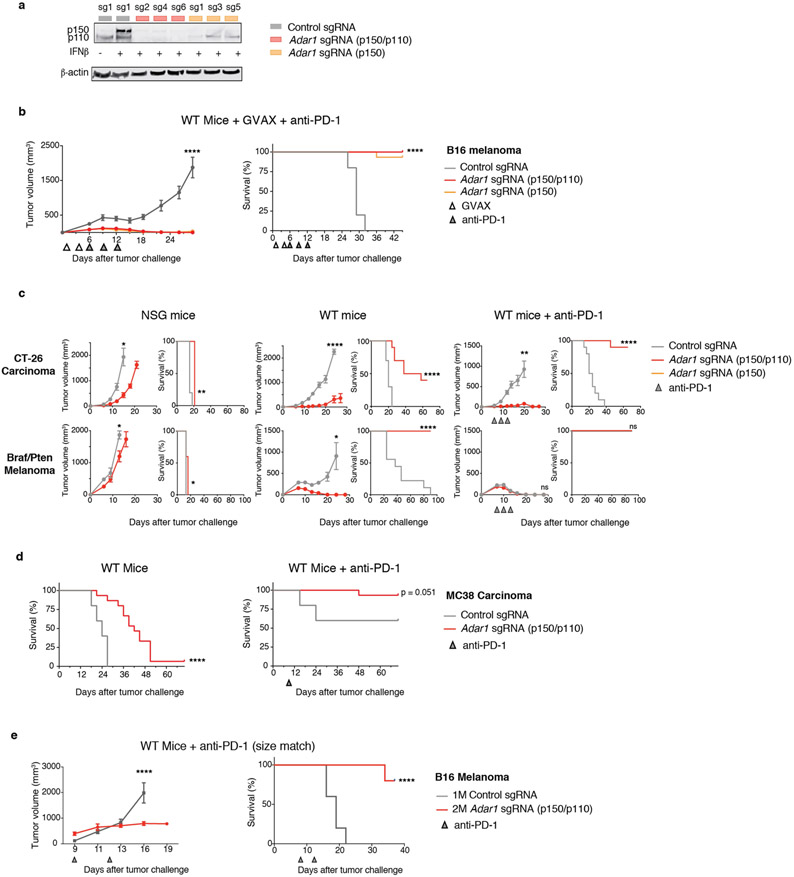
In our prior in vivo CRISPR screen, Adar1-targeting single-guide RNAs (sgRNAs) were markedly depleted from tumours in immunocompetent mice (Fig. 1a). To test whether deletion of Adar1 sensitized tumours to anti-tumour immunity, we generated mouse B16 tumour cells that lacked ADAR1 (Extended Data Fig. 1a) and compared their growth with control B16 tumours in vitro and in vivo. B16 cells lacking ADAR1 p150 or ADAR1 p110/p150 (each isoform targeted by three sgRNAs; hereafter termed Adar1-null tumours) grew equivalently to control tumour cells in vitro (Fig. 1b), suggesting that neither isoform of ADAR1 is essential for cell growth. Adar1-null tumours implanted in immunodeficient NOD.Cg-Prkdcscid Il2rgtm1Wjl/SzJ (NSG) mice showed only a minimal decrease in tumour size (Fig. 1c). By contrast, Adar1-null B16 tumours in wild-type, immunocompetent animals were profoundly sensitized to anti-PD-1 antibody treatment (P < 0.0001, log-rank test; Fig. 1c, Extended Data Fig. 1a). We found similar results in Adar1-null tumour cell lines in three additional transplantable tumour models and also when tumours were size-matched at the time of treatment (Extended Data Fig. 1c-e, Supplementary Text I). Thus, Adar1-null tumours are sensitized to anti-tumour immunity and immunotherapy in multiple transplantable tumour models.
Fig. 1 ∣. Loss of ADAR1 in tumour cells enhances anti-tumour immunity and responses to PD-1 checkpoint blockade.
a, Relative depletion of Adar1 sgRNAs from a pool of sgRNAs targeting 2,368 genes expressed by Cas9+ B16 tumour cells. n = 4 independent guides targeting each gene; false discovery rate (FDR) was calculated using the STARS algorithm v1.3 to generate permutation testing and a null distribution. b, Viability of Adar1-null and control B16 tumour cells following in vitro culture. n = 9 for each condition; results are representative of two independent experiments. c, Tumour volume and survival analysis of control (grey), Adar1 p150-null (orange) or Adar1 p110/p150-null (red) B16 tumours in NSG, wild-type (WT) and wild-type anti-PD-1-treated C57BL/6 mice. Wild-type B16 mice that did not receive anti-PD-1 treatment were treated with an equivalent concentration of rat IgG2a isotype control antibody. Data in c represent two independent experiments with n= 5 animals per guide with two separate guides for the control group and three separate guides for each Adar1-null group. Data for individual guides targeting each isoform of ADAR1 are pooled. a, b, Bars show mean; c, mean ± s.e.m. b, c (tumour volume curves), two-sided Student’s t-test; c (survival curves), log-rank test;*P < 0.05; **P < 0.01; ****P < 0.0001; NS, not significant.
Loss of ADAR1 increases tumour inflammation
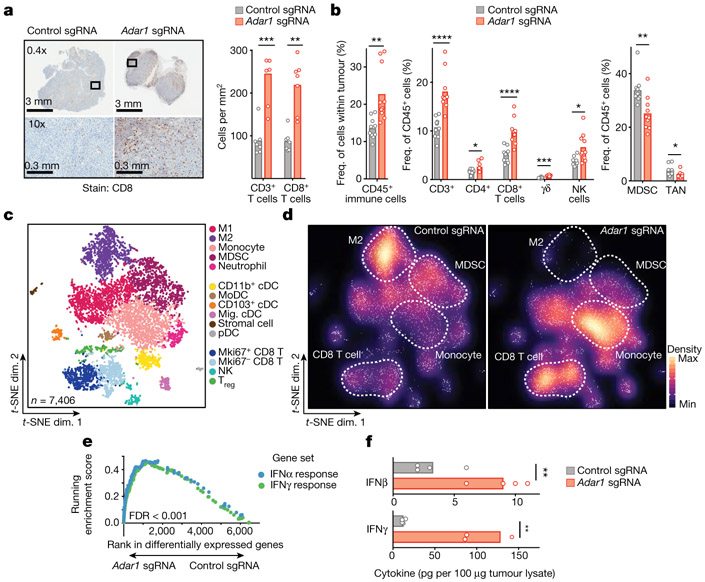
We compared the immune microenvironment of Adar1-null and control B16 tumours from untreated wild-type mice and found a significant increase in CD8+ T cells in Adar1-null tumours (P < 0.005, Student’s t-test; Fig. 2a) that were infiltrated throughout the tumour, significantly increased CD45+ immune cell infiltration (P < 0.01, Student’s t-test; Fig. 2b, Extended Data Figs. 2, 3) and significantly increased proportions of CD3+ T cells, CD4+ T cells, CD8+ T cells, γδ T cells and natural killer (NK) cells (P < 0.0001, P < 0.05, P < 0.0001, P < 0.001 and P < 0.05, respectively, Student’s t-test; Fig. 2b). Adar1-null tumours had significantly decreased proportions of myeloid-derived suppressor cells (MDSCs) and tumour-associated neutrophils (P < 0.01 and P < 0.05, respectively, Student’s t-test; Fig. 2b).
Fig. 2 ∣. Loss of ADAR1 inflames the TME.
a, Immunohistochemistry (left) with quantification (right) of CD3+ and CD8+ T cells in untreated control (grey) or Adar1-null (red) B16 tumours (n = 8 mice per group). b, Flow cytometry of immune populations from untreated control and Adar1-null B16 tumours (representative results from two independent experiments; n= 8–10 mice per group per experiment). TAN, tumour-associated neutrophils. c, d, t-Distributed stochastic neighbour embedding (t-SNE) plot (c) and density plots (d) of 7,406 RNA-sequenced (RNA-seq) single CD45+ cells from Adar1-null and control B16 tumours (n = 2 biological replicates for each population). Treg, regulatory T cells; M1, M1 macrophages; M2, M2 macrophages; cDC, conventional dendritic cells; MoDC, monocyte-derived dendritic cells; pDC, plasmacytoid dendritic cells. e, Gene set enrichment analysis (GSEA) of IFN response signatures in immune cells from Adar1-null compared with control tumours. FDR calculated using GSEA. f, IFNβ and IFNγ protein levels within the TME of Adar1-null and control B16 tumours; n = 4 for each condition. a, b, f, Twosided Student’s t-test;*P < 0.05; **P < 0.01; ***P < 0.001; ****P < 0.0001.
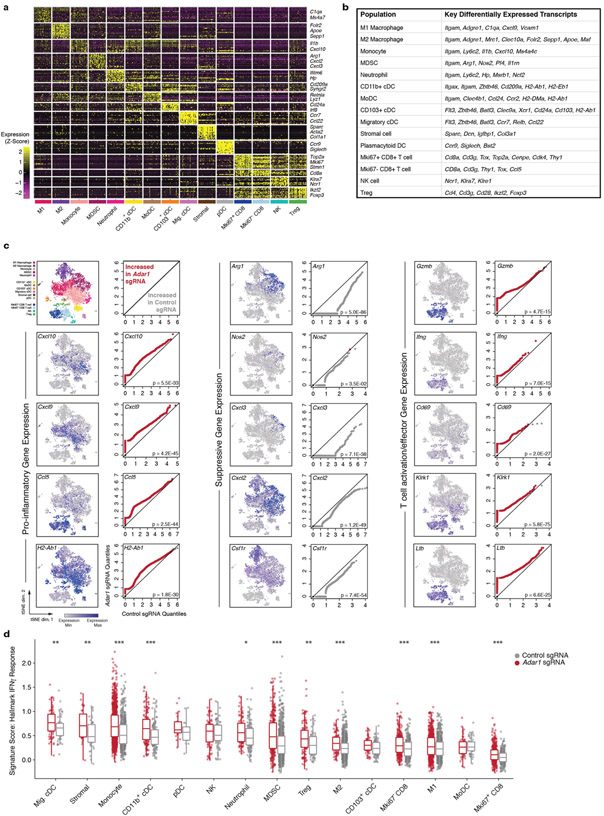
Single-cell RNA sequencing of CD45+ cells in the tumour microenvironment (TME) (Fig. 2c, Extended Data Fig. 4a, b) confirmed increased CD8+ T cell infiltration and showed a striking repolarization of the myeloid compartment of Adar1-null tumours (Fig. 2d). M2 macrophages and MDSCs were decreased in Adar1-null tumours relative to control tumours (Fig. 2d), and there was a marked decrease in expression of genes in myeloid cells associated with a suppressive phenotype (Extended Data Fig. 4c, Wilcoxon rank-sum test). We found a shift in the balance of chemokines expressed by immune cells in Adar1-null tumours, with decreased expression of chemokines associated with the recruitment of MDSCs and increased expression of chemokines associated with the recruitment of T cells and NK cells (Extended Data Fig. 4c). Genes associated with the activation and effector function of CD8+ T cells were increased in Adar1-null tumours relative to controls (Extended Data Fig. 4c).
We found an increase in the expression of gene signatures for IFNα and IFNγ responses in almost all types of immune cell from Adar1-null tumours relative to control tumours (Fig. 2e, Extended Data Fig. 4d) and both IFNβ and IFNγ protein levels in tumour lysates were significantly higher in Adar1-null tumours than in control tumours (Fig. 2f, P < 0.01 for both, Student’s t-test). Deletion of Adar1 therefore causes a global reshaping of the tumour immune compartment and increased abundance of IFNs.
Loss of ADAR1 sensitizes tumours to IFNs
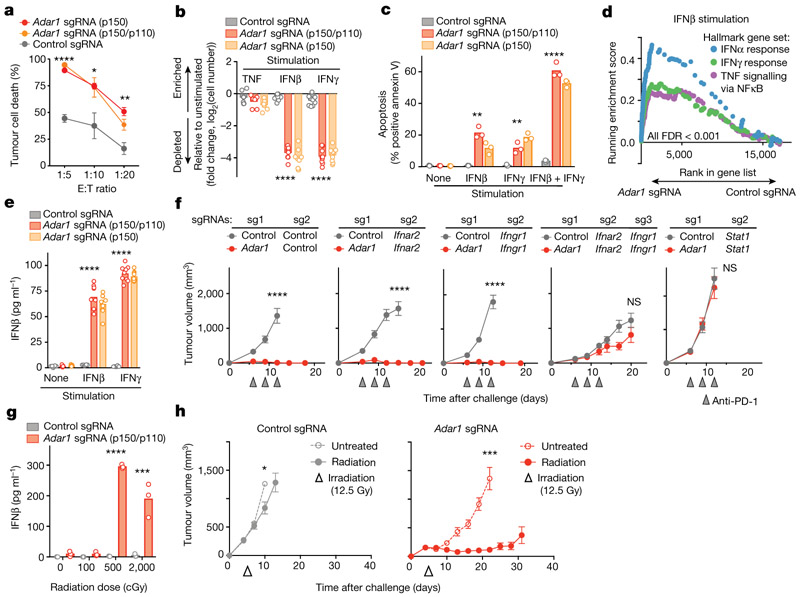
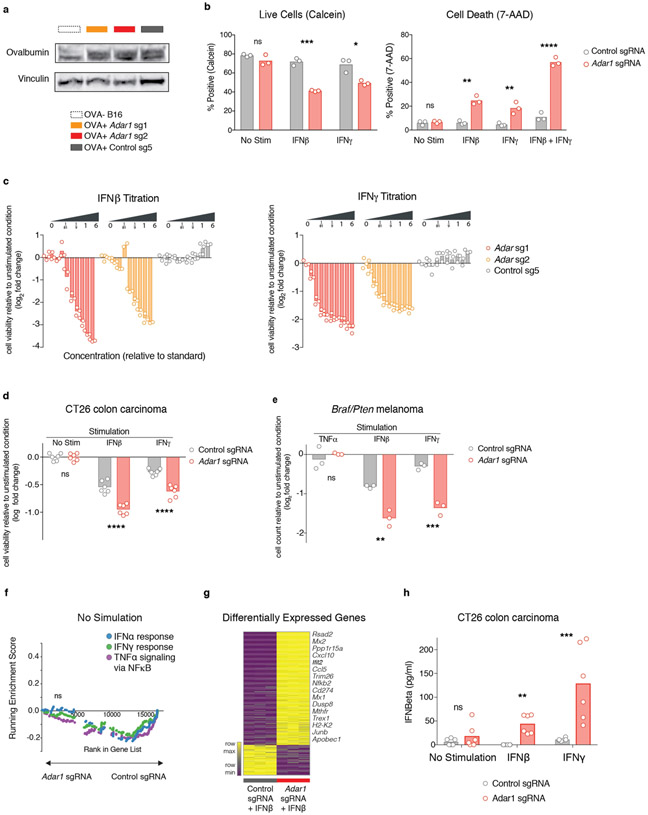
Adar1-null tumours were significantly more sensitive than control tumours to T cell killing (P < 0.0001, P < 0.05, P < 0.01 for effector:target (E:T) ratios of 1:5, 1:10 and 1:20, respectively, Student’s t-test; Fig. 3a, Extended Data Fig. 5a). Enhanced T cell killing of Adar1-null tumours could result either from improved T cell cytotoxicity or from an increased sensitivity to secreted effector cytokines such as IFNγ. We tested the latter possibility by stimulating Adar1-null and control tumour cells with IFNβ, IFNγ, or TNF (also known as TNFα) and comparing their growth with that of unstimulated cells. Compared with control tumour cells, Adar1-null cells showed significant inhibition of viability (P < 0.0001, Student’s t-test) and increased apoptosis (P < 0.01, Student’s t-test) when stimulated with IFNβ or IFNγ, but not TNF (Fig. 3b, c, Extended Data Fig. 5b, c). Similar results were seen in CT26 and Braf/Pten tumours (Extended Data Fig. 5d, e). Thus, the sensing of either type I or type II IFNs is sufficient to cause growth arrest and apoptosis in Adar1-deficient tumour cells.
Fig. 3 ∣. Exogenous IFN is required to trigger anti-tumour immunity in Adar1-null tumours.
a, T cell-dependent killing of ovalbumin-expressing Adar1 p150/p110-null (red), p150-null (orange) and control (grey) B16 tumour cells by OT-I transgenic T cells specific for an ovalbumin-derived peptide in the context of MHC-I at decreasing E:T ratios (1:20, 1:10 and 1:5). Data shown are representative of two independent experiments with n = 3 replicates for each condition; mean ± s.e.m. b, Relative numbers of control, Adar1 p150/p110-null, and Adar1 p150-null B16 tumour cells stimulated with cytokines indicated compared with unstimulated conditions (n = 3 for each condition; data are representative of three independent experiments). c, Annexin V staining in control, Adar1 p110/ p150-null and Adar1 p150-null tumours following stimulation with IFNβ, IFNγ or IFNβ + IFNγ (n = 3 for each condition; data are representative of three independent experiments). d, GSEA of gene signatures in Adar1-null compared with control B16 tumour cells after in vitro culture with IFNβ stimulation. n = 3 for each condition; FDR calculated using GSEA. e, Enzyme-linked immunosorbent assay (ELISA) for IFNβ in supernatant from control, Adar1 p150/p110-null and Adar1 p150-null B16 tumour cells after in vitro culture in unstimulated, IFNβ or IFNγ conditions (n = 3 for each condition; data are representative of three independent experiments). f, Tumour volume following treatment with anti-PD-1 in vivo in genetic epistasis tumour models that lack ADAR1 and components of IFN sensing pathways (n = 5 mice in each group, data representative of two independent experiments). g, ELISA for IFNβ in supernatant from control and Adar1 p150/p110-null B16 tumour cells following irradiation in vitro (n = 3 for each condition; data representative of two independent experiments). h, Tumour volume of control (grey) and Adar1-null (red) B16 tumours following therapeutic irradiation in vivo. n = 10 mice in each group; data are representative of two independent experiments. b, c, e, g, Bars represent mean; f, mean ± s.e.m. a–c, e, f, h, Two-sided Student’s t-test; *P < 0.05; **P < 0.01; ***P < 0.001, ****P < 0.0001; NS, not significant.
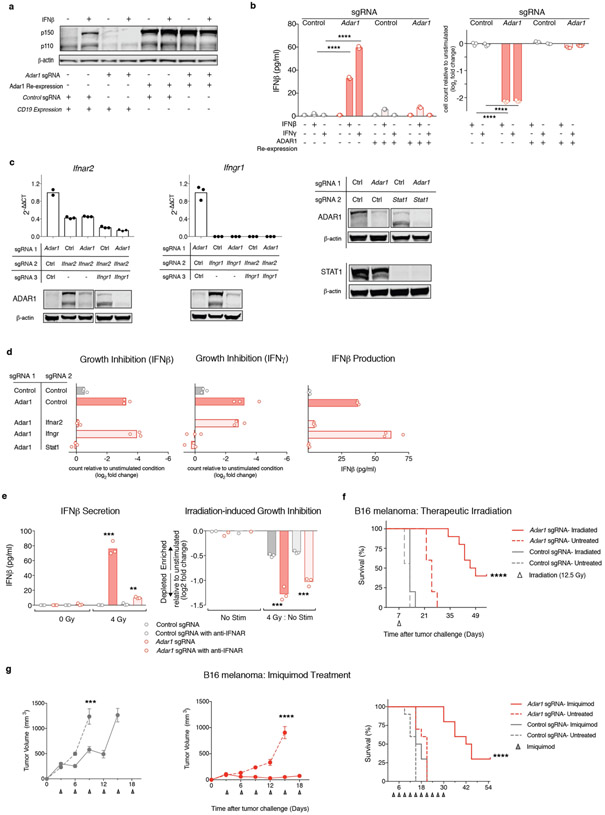
Adar1-null B16 cells showed significant upregulation of gene signatures of response to IFNα, IFNβ and TNF relative to control cells when cultured with IFNβ or IFNγ (Fig. 3d, Extended Data Fig. 5f, all FDR < 0.001). Cytokine and chemokine genes such as Ifnb1, Il6, Ccl5, Cxcl9 and Cxcl10 were upregulated in Adar1-null cells following IFN stimulation (Extended Data Fig. 5g). Consistent with this, we found that Adar1-null tumours secreted IFNβ following stimulation with IFNβ or IFNγ, whereas control cells or unstimulated Adar1-null cells did not (Fig. 3e, Extended Data Fig. 5h). Re-expression of Adar1 p150 restored IFN-induced growth inhibition and IFNβ secretion to control levels, demonstrating that these phenotypes were unlikely to be off-target effects of gene editing (Extended Data Fig. 6a, b). Thus, Adar1-null tumour cells increase expression of antiviral cytokines and chemokines following exposure to IFN.
Sensitivity to immunotherapy requires IFN sensing
We tested whether Adar1-null tumours required IFN sensing for enhanced sensitivity to immunotherapy in vivo. We generated Adar1-null tumour cell lines that also lacked Ifnar2, Ifngr1 or Stat1 (double knockout (DKO) cell lines), and triple knockout (TKO) Adar1-null tumour cell lines in which both Ifnar2 and Ifngr1 were deleted (Extended Data Fig. 6c). The in vitro growth arrest and IFNβ secretion phenotypes seen in Adar1-null tumours following stimulation with IFNβ and IFNγ stimulation were abolished by concomitant deletion of Ifnar2 and Ifngr1, respectively (Extended Data Fig. 6d). Similarly, deletion of Stat1 suppressed both in vitro phenotypes following stimulation with either IFN (Extended Data Fig. 6d). In vivo, genetic deletion of either Ifnar2 or Ifngr1 was not sufficient to suppress the sensitivity of Adar1-null tumours to PD-1 checkpoint blockade (Fig. 3f). However, concomitant deletion of both Ifnar2 and Ifngr1, or deletion of Stat1, abolished the sensitivity of Adar1-null tumours to immunotherapy (Fig. 3f). Thus, Adar1-null tumours have an obligate requirement for IFN to mediate their sensitivity to immunotherapy.
ADAR1 loss sensitizes tumours to irradiation
We reasoned that loss of ADAR1 may sensitize tumours to other cancer therapies that are known to induce IFN production in the TME, such as radiation therapy10-12 or toll-like receptor agonists13-15. In vitro, Adar1-null tumour cells produced significantly more IFNβ than did control tumours after irradiation (Fig. 3g, Extended Data Fig. 6e) and were significantly less viable after irradiation (Extended Data Fig. 6e; P < 0.001, Student’s t-test). Radiation (12.5 Gy) or topical therapy with imiquimod significantly slowed tumour growth and enhanced survival in animals bearing Adar1-null tumours, but had a minimal effect on control B16 tumours (Fig. 3h, Extended Data Fig. 6d, f, g; P < 0.0001 for survival in both cases, log-rank test). Thus, loss of ADAR1 increases the efficacy of therapies that can elicit the production of IFN in the TME.
ADAR1-edited RNAs are preferentially induced by IFN
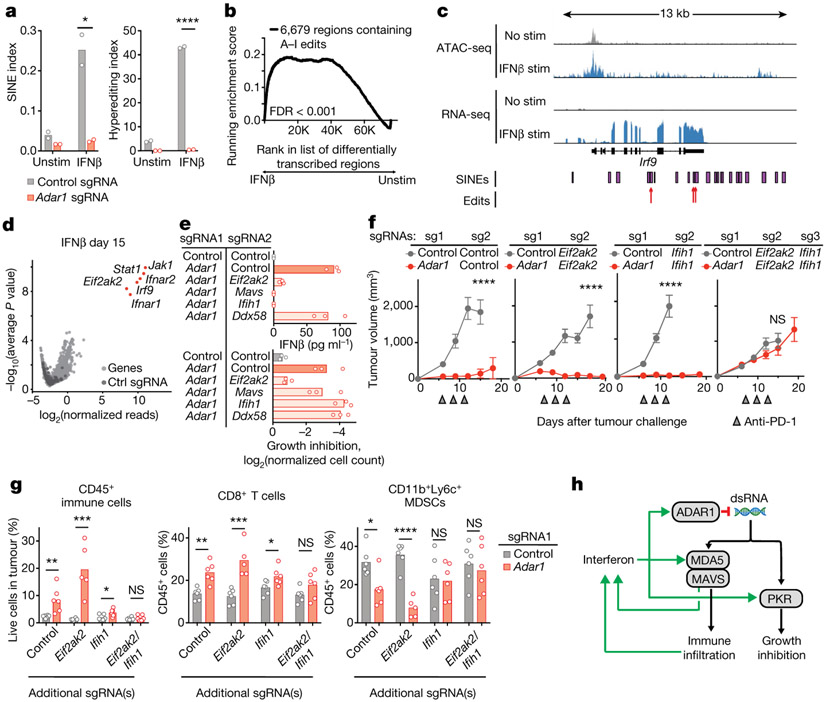
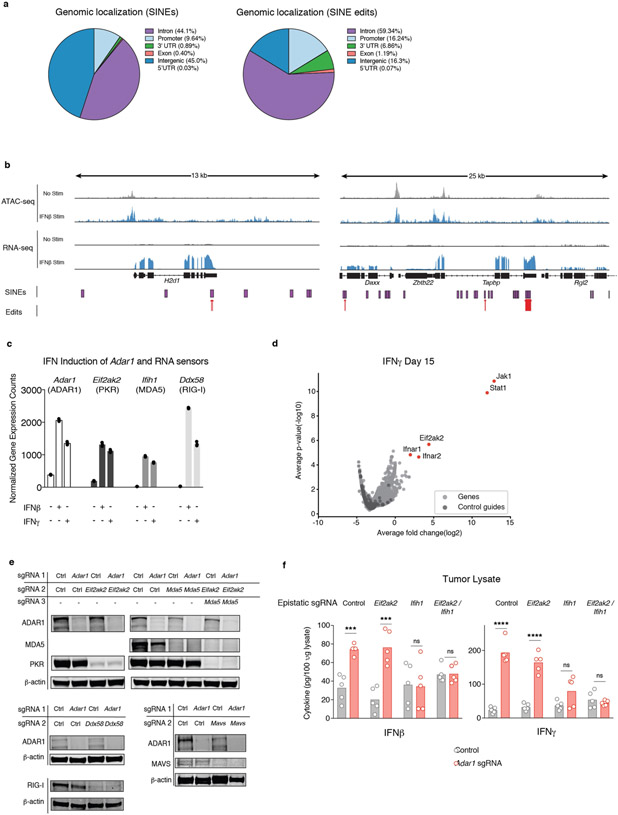
We reasoned that the requirement for IFN to trigger the observed response in Adar1-null cells might be explained by the IFN-mediated upregulation of RNA species that are normally edited by ADAR1 and that can serve as ligands for dsRNA sensors. We found a larger number of A-to-I editing events in small interspersed nuclear elements (SINEs) and a greater abundance of RNA hyperediting following IFN stimulation in control cells compared with Adar1-null cells (Fig. 4a; P < 0.05 and P < 0.0001, respectively, Student’s t-test). SINEs containing known ADAR1 edit sites were enriched around genes, in particular 3′ UTRs, compared with the genomic distribution of all SINEs16,17 (Extended Data Fig. 7a; P < 1 × 10⁻³⁰, hypergeometric test).
Fig. 4 ∣. dsRNA sensing triggers distinct mechanisms of anti-tumour immunity through MDA5 and PKR in Adar1-null tumours.
a, Quantification of A-to-I editing in SINEs (left) and hyper-editing (right) in control and Adar1-null B16 tumours with and without stimulation with IFNβ (n = 3 for each condition). b, Enrichment in the expression of RNA transcripts containing A-to-I editing sites following stimulation with IFNβ relative to the unstimulated state in control B16 tumour cells. n = 3 for each condition; FDR calculated using GSEA. c, Assay for transposase accessible chromatin with high-throughput sequencing (ATAC-seq) and RNA-seq at the Irf9 locus indicating positions of SINEs and A-to-I edits of RNA in IFNβ-stimulated or unstimulated control B16 cells. d, Volcano plot depicting the relative depletion and enrichment of sgRNAs targeting 20,146 genes in a Cas9+ Adar1-null B16 tumour cell line following stimulation with IFNβ in vitro. p values were derived using STARS v1.3. e, IFNβ secretion (top) and IFNγ-mediated growth inhibition (bottom) in Adar1-null (red) and control (grey) B16 cells with additional deletion of Eif2ak2 (PKR), Mavs (MAVS), Ifih1 (MDA5), or Ddx58 (RIG-I) (n = 3 for each condition; data are representative of two independent experiments). f, Tumour volume following anti-PD-1 treatment of B16 tumours with the genetic perturbations indicated (n = 5 mice per group; data are representative of two independent experiments). g, Flow cytometry of immune populations from untreated control and Adar1-null B16 tumours with the genetic perturbations indicated (n = 5 mice per group). h, Schema of the genetic dependencies of enhanced immune infiltration and enhanced susceptibility to immune cells in Adar1-null tumours, a, e, g, Bars represent mean; f, mean ± s.e.m. a, f, g, Two-sided Student’s t-test; *P < 0.05; **P < 0.01; ***P < 0.001; ****P < 0.0001; NS, not significant.
We found that RNA species with evidence of A-to-I edits were significantly upregulated by stimulation with IFNβ (Fig. 4b, c, Extended Data Fig. 7b; FDR < 0.001). Consistent with this, we found a highly significant association between edited sites adjacent to IFN-inducible regions of accessible chromatin (data not shown; P = 0.0035, one-sided binomial test). Thus, IFNs increase the transcription of RNA species that are normally edited by ADAR1 and that may serve as ligands for dsRNA sensors. Together with increased abundance of the RNA sensors themselves (Extended Data Fig. 7c), this may explain the requirement for IFN to reveal the vulnerability of Adar1-null tumour cells.
PKR and MDA5 mediate distinct phenotypes
We conducted a genome-wide screen using CRISPR to identify genes required for the IFN-induced growth arrest phenotype of Adar1-null tumour cells. Following culture with IFNβ, we found significant enrichment of sgRNAs targeting genes required for the sensing of type I IFN (Ifnar1, Ifnar2, Jak1, Stat1, and Irf9; FDR < 0.0002, Fig. 4d) in the surviving cells. We also found marked enrichment of sgRNAs targeting Eif2ak2, the gene that encodes protein kinase R (PKR). In a second screen we used IFNγ to mediate growth arrest and found enrichment of sgRNAs targeting Jak1, Stat1, and Efi2ak2 but not those targeting Ifngr1 or Ifngr2. We did, however, observe enrichment of sgRNAs targeting Ifnar1 and Ifnar2 (FDR < 0.0007, Extended Data Fig. 7d), suggesting that IFNγ stimulation elicits type I IFN secretion from Adar1-deficient cells, which in turn mediates growth arrest via PKR. Thus, sensing of dsRNA by PKR is the major mechanism that underlies the growth arrest phenotype of Adar1-null tumour cells following IFN stimulation.
To identify the genes required for the secretion of IFNβ by Adar1-null cells, we generated DKO Adar1-null cell lines that also lacked either Ifih1 (MDA5), Ddx58 (RIG-I), Mavs (MAVS), or Eif2ak2 (PKR) and tested them for suppression of the growth arrest and IFNβ secretion phenotypes (Fig. 4e, Extended Data Fig. 7e). Loss of PKR abolished the IFN-induced growth arrest phenotype. Loss of other dsRNA sensors had no effect on IFN-mediated growth arrest (Fig. 4e). Deletion of MDA5 or MAVS completely suppressed secretion of IFNβ, which was also reduced in Adar1-null tumour cells that lacked PKR (Fig. 4e). This suggests that MDA5 and MAVS do not suppress IFN-mediated growth arrest in Adar1-null cells, but are required for IFNβ secretion.
We next tested which dsRNA sensor was responsible for the enhanced response of Adar1-null tumours to immunotherapy in vivo. DKO Adar1-null cell lines that also lacked either PKR or MDA5 were as sensitive to immunotherapy as Adar1-null single knockout tumours (Fig. 4f). However, TKO tumour cells that lacked ADAR1, PKR and MDA5 no longer showed enhanced sensitivity to immunotherapy (Fig. 4f). Thus, dsRNA sensing through either PKR or MDA5 is sufficient to confer the enhanced response to checkpoint blockade of Adar1-null tumours, but loss of both pathways abrogates this increased sensitivity.
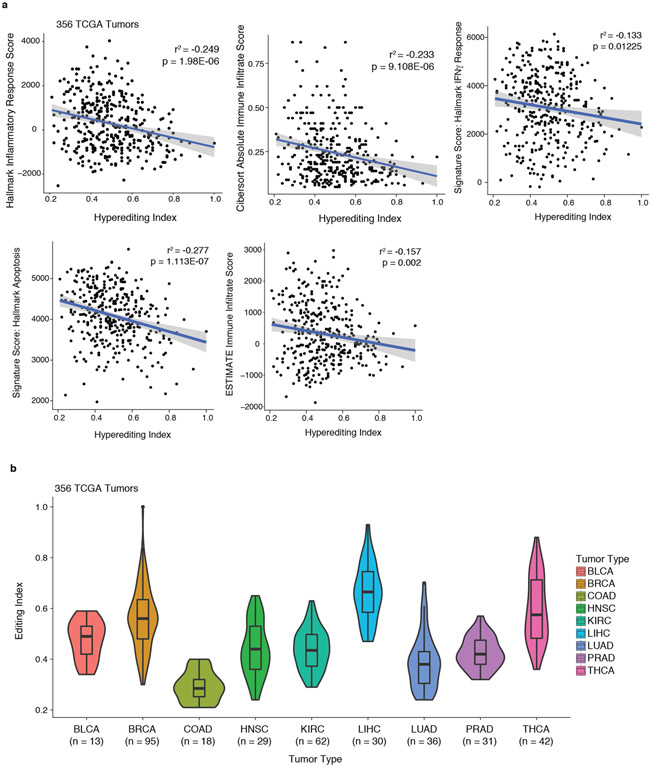
We next tested which dsRNA sensor was required for the inflammation observed in Adar1-null tumours in vivo. Adar1-null tumours that lacked PKR showed similar or greater inflammation of the TME compared with Adar1-null tumours and greater inflammation than control tumors (Fig. 4g). By contrast, Adar1-null tumours lacking MDA5 showed only a minor increase in inflammation relative to control tumours, and Adar1-null tumours lacking both PKR and MDA5 showed no increase in immune infiltration (Fig. 4g). Similarly, whereas both IFNβ and IFNγ were significantly increased in the microenvironments of Adar1-null tumours with or without PKR (P < 0.001 for both following IFNβ stimulation and P < 0.0001 for both following IFNγ stimulation), we detected no increase in IFN in Adar1-null tumours lacking MDA5 or in Adar1-null tumours lacking both PKR and MDA5 (Extended Data Fig. 7f). Thus dsRNA sensing by MDA5 is required for the enhanced inflammation and immune infiltration in Adar1-null tumours, but activation of PKR is not. MDA5 and PKR therefore mediate distinct mechanisms of increased susceptibility to anti-tumour immunity in Adar1-null tumours (Fig. 4h). Consistent with these results, levels of hyperediting in human tumours were inversely correlated with immune infiltration and inflammatory response (Extended Data Fig. 8a, b, Supplementary Text II).
Loss of ADAR1 overcomes resistance to immunotherapy
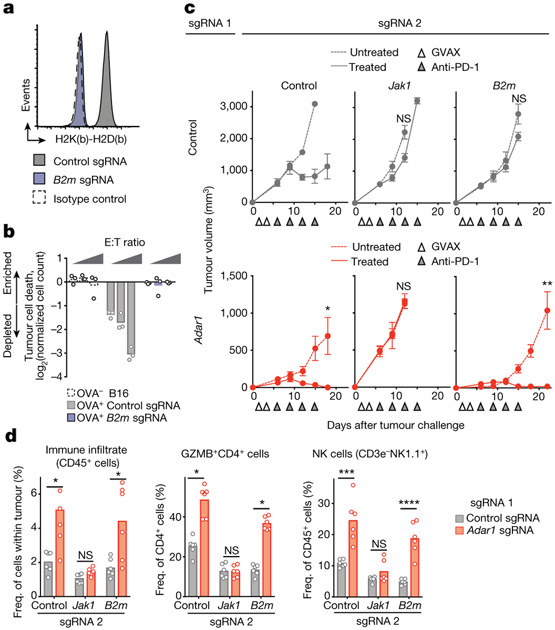
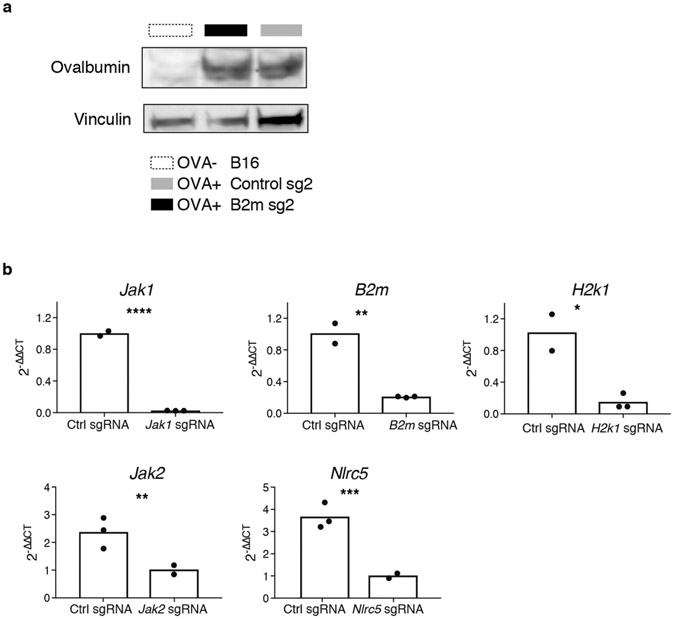
We tested whether deletion of Adar1 was sufficient to overcome common mechanisms of resistance to checkpoint blockade. To generate mouse models of immunotherapy resistance, we deleted B2m in B16 tumours and confirmed that this abolished recognition of tumour cells by CD8+ T cells (Fig. 5a, b, Extended Data Fig. 9a, b) and rendered them completely resistant to immunotherapy in vivo (Fig. 5c, top; Extended Data Fig. 10a).
Fig. 5 ∣. Loss of ADAR1 overcomes resistance to immunotherapy mediated by loss of antigen presentation.
a, MHC I expression in control (grey) and B2m-null (purple) B16 tumour cell lines relative to isotype control (dashed line). Data are representative of two independent experiments. b, T cell killing assay with non-ovalbumin-expressing control (dashed line), ovalbumin-expressing control (grey) and ovalbuminexpressing B2m-null (purple) B16 cells (n = 3 for effector target ratios 1:20, 1:10 and 1:5 for each condition; data shown are representative of two independent experiments). c, Tumour volume following anti-PD-1 and GVAX treatment of B16 tumours with the genetic perturbations indicated. Data (mean ± s.e.m.) are representative of two independent experiments with n = 5 mice in each group. d, Flow cytometry of immune populations following anti-PD-1 and GVAX treatment of B16 tumours with the genetic perturbations indicated (n = 5 mice per group). Bars represent mean. c, d, Two-sided Student’s t-test; *P < 0.05; **P < 0.01; ***P < 0.001; ****P < 0.0001; NS, not significant.
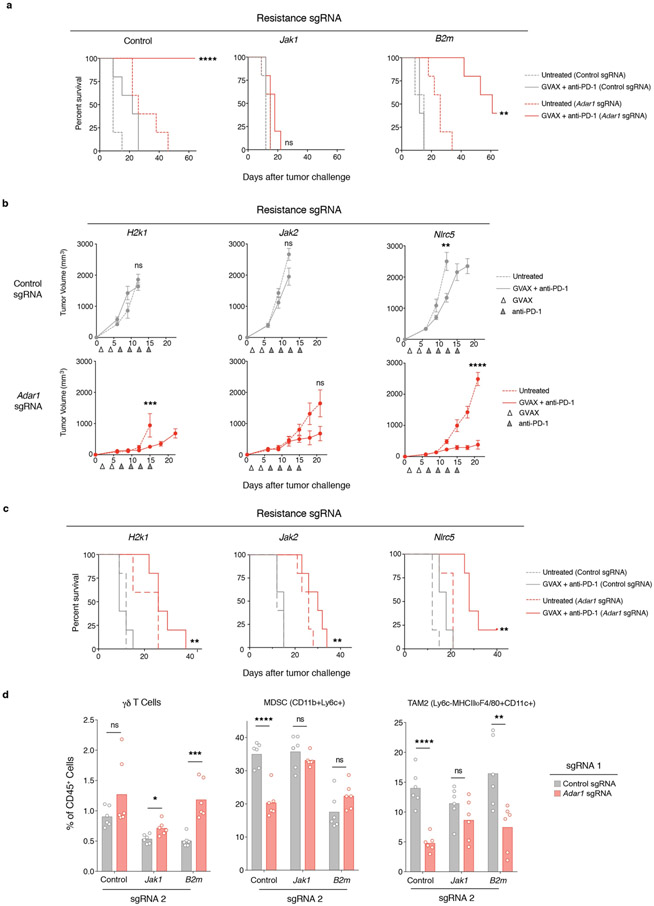
We next generated cell lines lacking both Adar1 and B2m and compared their sensitivity in vivo to immunotherapy with granulocyte- macrophage colony-stimulating factor (GM-CSF)-secreting whole tumour cell vaccine (GVAX) and PD-1 blockade with those of cell lines lacking only B2m. Loss of ADAR1 restored sensitivity to immunotherapy and resulted in elimination of many of the B2m-null, resistant tumours (Fig. 5c, Extended Data Fig. 10a). Similar results were found for other resistance mutations: H2-K1, Nlrc5 and Jak2 (Extended Data Figs. 9b, 10b, c). By contrast, tumour cells in which resistance had been engineered by deletion of Jak1 were not re-sensitized by loss of ADAR1 (Fig. 5c), underscoring the essential role of IFN sensing in the sensitivity of Adar1-null tumours to immunotherapy.
Loss of ADAR1 in Jak1-null tumours did not change the composition of immune cells in the tumours. However, loss of ADAR1 in B2m-null tumours was associated with a significant increase in immune cells, including non-MHC I-restricted cytotoxic cells such asγδ T cells, granzyme B+ CD4+ T cells and NK cells (Fig. 5d, Extended Data Fig. 10d, P < 0.05, P < 0.001, P < 0.001, P < 0.0001, respectively, Student’s t-test), and a significant decrease in suppressive myeloid cells (Extended Data Fig. 10d, P < 0.01, Student’s t-test). Thus, deletion of Adar1 overcomes several common mechanisms of acquired resistance to immunotherapy and causes inflammatory repolarization of the TME even in the absence of CD8+ T cell recognition of MHC I on tumours.
Discussion
We have shown that loss of function of ADAR1 in tumour cells removes a checkpoint that normally restrains sensing of IFN-inducible dsRNA, leading to enhanced tumour inflammation and heightened IFN sensitivity mediated by MDA5 and PKR, respectively. This dual mechanism increases the response to immune checkpoint blockade and overcomes resistance to immunotherapy.
Because tumours without immune infiltration often fail to respond to checkpoint blockade, strategies to inflame the TME are a high therapeutic priority. These include increased delivery or epigenetic derepression of innate ligands10,18-22. However, our data suggest that cancer cells already contain, or can be induced to express, sufficient quantities of immunostimulatory nucleic acids to increase tumour immunity and overcome resistance to checkpoint blockade, if the mechanisms that limit their detection can be overcome.
Effective immunotherapy with checkpoint blockade is assumed to require recognition of tumour cells by cytotoxic CD8+ T cells23-25, but our results show that loss of function of ADAR1 restores sensitivity to immunotherapy in tumours with a B2m deletion. This suggests that recognition of tumours by CD8+ T cells is not an obligate part of an effective immune response against cancer cells. Rather, loss or lack of antigen presentation can be overcome if sufficient inflammation can be elicited in an IFN-sensitive tumour. This finding suggests a strategy for effective immunotherapy even in the absence of a tumour-specific endogenous CD8+ T-cell response.
METHODS
Creation of CRISPR-edited tumour cell lines.
Adar1 was deleted in Cas9-expressing B16, Braf/Pten and MC38 mouse tumour cell lines for validation experiments using a lentiviral delivery system (pXPR_BRD024, Addgene) to express sgRNAs and puromycin selection as previously described5. For further validation experiments, confirmatory epistasis and re-expression/rescue experiments, Adar1 was deleted in B16 and CT26 cells using transient transfection of a Cas9-sgRNA plasmid (pX459, Addgene) with the Turbofect transfection reagent (Thermo Fisher Scientific, R0531) or lipofectamine transfection reagent (Thermo Fisher Scientific, L3000015), respectively, and puromycin selection. For epistasis experiments, Cas9 was expressed using the pLX311 backbone, transient transfection was used to introduce the first guide(s), and the final epistasis guides were expressed using the pXPR_BRD024 lentiviral expression system. For in vitro re-expression/ rescue experiments, Adar1 was synthesized from the mm10 consensus sequence and either ADAR1 or an irrelevant control protein (CD19) was expressed using the pLX311 backbone used in prior work to express Cas95. Cell lines were tested every 3–6 months for mycoplasma contamination.
Animal treatment and tumour challenges.
The designs of animal studies and procedures were approved by the Dana Farber Cancer Institute IACUC and the Broad Institute IACUC committees. Ethical compliance with IACUC protocols and institute standards was maintained. Specific pathogen-free facilities at the Dana Farber and Broad Institutes were used for the storage and care of all mice. Six-week-old wild-type female C57BL/6J mice were obtained from Jackson laboratories. A colony of B6.129S2-Tcratm1Mom/J (Tcra) T cell-deficient mice were bred on site at the Dana Farber Institute. A colony of NOD.Cg-Prkdcscid Il2rgtm1Wjl/SzJ (NSG) mice were bred on site at the Broad Institute. Mice were age-matched to be 6–12 weeks old at the time of tumour inoculation. For tumour challenges, 2.0 × 10⁶ tumour B16, Braf/Pten or MC38 cells were resuspended in Hanks balanced salt solution (Gibco), mixed 1:1 by volume with matrigel (Corning) and subcutaneously injected into the right flank on day 0. CT26 cells (1.0 × 10⁶) were resuspended in Hanks balanced salt solution and injected as described above. Each tumour injected contained only a single sgRNA targeting each indicated gene. Where indicated, mice were vaccinated with 1.0 × 10⁶ GM-CSF-secreting B16 (GVAX) cells (kindly provided by G. Dranoff) that had been irradiated with 35 Gy on days 1 and 4 to elicit an anti-tumour immune response. For non-resistance validation experiments, mice were treated with 100 μg of rat monoclonal anti-PD1 antibodies (Bio X Cell, clone: 29F.1A12) on days 6, 9 and 12 (for B16 and CT26) or day 9 (for MC38) via intraperitoneal injection. Rat IgG2a isotype control was used in control mice corresponding to the anti-PD1 treatment group for B16 experiments shown in Fig. 1. For resistance experiments, mice were treated with 200 μg of rat anti-PD1 antibodies on days 6, 9, 12 and 15. Each tumour was measured every 3–4 days beginning on day 6 after challenge until either the survival endpoint was reached or no palpable tumour remained. Measurements were assessed manually by assessing the longest dimension (length) and the longest perpendicular dimension (width). Tumour volume was estimated with the formula: (L × W2)/2. CO2 inhalation was used to euthanize mice. For irradiation experiments, the Dana Farber Small Animal Radiation Research Platform was used26. In brief, mice were anesthetized via isoflurane inhalation for the duration of each treatment. For each treatment, tumours were visualized using cone beam computed tomography (CT) using 60 kVp and 0.8 mA photons. Tumours were treated using a 10 × 10-mm square shaped collimator selected to give 0.25–0.5-cm margins around gross tumour, using 220 kVp and 13 mA photons given with a lateral en face field prescribed to a depth of 5 mm. The Small Animal Radiation Research Platform was calibrated and maintained as previously described26. For imiquimod experiments, 5% imiquimod cream was obtained through the Dana-Farber Cancer Institute animal facility. A thin film of imiquimod cream was applied to the skin overlying tumours every three days following tumour inoculation until tumour outgrowth or disappearance. No statistical methods were used to predetermine sample size. For all experiments, at least five mice were included in each group, based upon prior knowledge of the variability of experiments with immune checkpoint blockade. Animals were randomized before treatment and no blinding was performed.
Tumour size match experiment.
We implanted 2 × 10⁶ Adar1-null (Adar1 sgRNA 2) cells in matrigel or 1 × 10⁶ control B16 tumour cells in HBSS into the right flank of 6- to 7-week-old C57BL/6 female mice. Mice were treated with 5 mg/kg anti-PD-1 antibody on days 6, 9 and 12 as described above.
Immunohistochemistry.
Immunohistochemical (IHC) staining was performed at the Dana-Farber/Harvard Cancer Center Specialized Histopathology Core using a Leica Bond automated staining platform with anti-CD3 (Abcam, clone ab16669; 1:150 dilution) and anti-CD8 (eBio, clone 14-0808; 1:100 dilution) antibodies. Slides were visualized using Aperio software. CD3+ and CD8+ cells that stained with strong membranous positivity were enumerated in five separate areas at 20 × magnification in a blinded fashion by G.K.G. for each slide.
Analysis of tumour-infiltrating lymphocytes by flow cytometry.
Control guide or Adar1-null tumour cells (Adar1 sgRNA 2; 2 × 10⁶) were implanted in matrigel into BL6 female mice at 5–8 weeks of age. On day 14 following implantation, tumours were dissected from the surrounding fascia, weighed, mechanically minced, and treated with collagenase P (2 mg/ml, Sigma) and DNase I (50 μg/ml, Sigma) for 10 min at 37 °C. Cells were passed through a 70-micrometre filter to remove clumps, diluted in medium, and a small aliquot taken directly for flow cytometry. Cell surface staining was performed with the indicated antibodies before fixation and permeabilization of the cells (Intracellular Fixation & Permeabilization Buffer Set, eBiosciences) for intracellular staining. Sphero AccuCount Fluorescent Particles (Spherotech) were added to each tube to allow cell counting before analysis on a LSR II flow cytometer (BD Biosciences). All analysis was done with FlowJo software v 10.4.2 (FlowJo). Cell counts were determined by normalizing cell numbers to beads recorded, divided by the amount of tumour aliquot taken and the mass of the tumour. See Supplementary Information Table 1 for a full list of antibodies used.
Analysis of tumour-infiltrating lymphocytes by single cell RNA-seq.
Adar1-null (sgRNA2) or control tumour cells (2 × 10⁶) were implanted in matrigel into the right flank of C57BL/6 female mice. On day 14, tumours were dissected from the surrounding fascia, mechanically minced, and treated with collagenase P (2 mg/ml, Sigma) and DNase I (50 μg/ml, Sigma) for 10 min at 37 °C. Tumour-infiltrating leukocytes were enriched using an Optiprep (Sigma) density gradient followed by CD45+ MACS positive selection (Miltenyi). B16 tumour cells grown in culture were added to each sample at a 5% ratio as a spike-in control for assessing sample-to-sample variability. Cells were counted and loaded onto the 10x device (10x Genomics). Samples were processed per the manufacturer’s protocol and sequenced on an Illumina NextSeq sequencer. Sample demultiplexing, barcode processing, alignment, filtering, UMI counting, and aggregation of sequencing runs were performed using the Cell Ranger analysis pipeline (v1.2). Downstream analyses were performed in R using the Seurat package27.
For each cell, two quality control metrics were calculated: (1) the total number of genes detected and (2) the proportion of UMIs contributed by mitochondrially encoded transcripts. Cells in which fewer than 200 genes were detected and in which mitochondrially encoded transcripts constituted more than 10% of the total library were excluded from downstream analysis. Genes detected in fewer than three cells across the data set were also excluded, yielding a preliminary expression matrix of 8,834 cells (comprised of both infiltrating immune cells and spiked-in tumour cells) by 17,190 genes. To assess technical variability between samples, an initial t-SNE projection was generated using all 8,834 cells (data not shown); co-clustering of spiked-in tumour cells expressing Pmel and Mlana (transcriptional markers of melanoma) from all four experiments demonstrated minimal sample-to-sample variability. We subsequently removed 1,428 tumour cells from the total expression matrix, leaving only infiltrating immune cells for downstream analysis.
Mean and dispersion values were calculated for each gene across the remaining 7,406 cells, and a subset of 1,494 highly variable genes was selected for principal components analysis (PCA). Following PCA, the first 55 PCs were determined to be significant (P < 0.01) using the jackstraw method and t-SNE was performed on these significant PCs using default parameters for 1,000 iterations for visualization in two dimensions. Unsupervised clustering using a shared nearest neighbour modularity optimization based algorithm (resolution parameter 0.8) identified 15 distinct clusters28. See Supplementary Information Table 2 for cell cluster and barcode identification for each cell. For classification of immune cell populations, differential expression analysis was performed between each cluster and all other cells using a Wilcoxon rank sum test. Top differential expression results for each cluster were cross-referenced with canonical markers for a comprehensive range of immune cell populations, yielding a consensus panel of transcriptional markers for each of the 15 clusters (Extended Data Fig. 4a, b, Supplementary Information Table 3).
For preranked GSEA, differential expression analysis was performed between all infiltrating immune cells from Adar1-null tumours and control tumours using a Wilcoxon rank sum test, and a ranking metric was calculated for each gene as R = −log10(q), where q is the FDR-adjusted P value (Supplementary Information Table 4). Preranked GSEA was performed using a curated collection of gene sets consisting of sets from the Hallmark and Gene Ontology collections in the MSigDB database29. Single-cell signature scoring using FastProject was also performed using this curated collection30.
RNA-seq analysis of tumour cells.
Adar1-null or control sgRNA-transfected B16 cells were stimulated with IFNβ (1,000 U/ml, PBL) for 36 h. RNA was extracted from cell pellets using the Qiagen RNeasy Mini kit according to the manufacturer’s instructions. First-strand Illumina-barcoded libraries were generated using the NEB RNA Ultra Directional kit according to the manufacturer’s instructions, using ribosomal RNA depletion and including a 12-cycle PCR enrichment. Libraries were sequenced on an Illumina NextSeq 500 instrument using paired-end 37-bp reads. Data were trimmed for quality using the Trimmomatic pipeline with the following parameters: LEADING:15 TRAILING:15 SLIDINGWINDOW:4:15 MINLEN:16. Data were aligned to mouse reference genome mm10 using Bowtie2. HTSeq was used to map aligned reads to genes and to generate a gene count matrix. Normalized counts and differential expression analysis was performed using the DESeq2 R package (Supplementary Information Table 5). GSEA was performed as previously described, using the Hallmark gene signature collection29,31(Supplementary Information Table 6).
RNA editing analysis of tumour cells.
All editing analysis was performed using tumour cell RNA-seq data, which were generated as indicated above. The quality of the sequence reads was confirmed using the FastQC (https://www.bioinformatics.babraham.ac.uk) quality control tool with default parameters. Duplicated reads were removed using prinseq32. Next, sequence reads were aligned using the STAR33 aligner to the mm9 reference genome with parameters that accept only uniquely aligned reads (outFilterMultimapNmax = 1) and limit the number of mismatches to 0.05 of the mapped length (outFilterMismatchNoverLmax = 0.05).
In order to generate the SINE index measurements, a previously published human Alu-specific editing detection algorithm34 was adjusted to screen three mouse SINE subfamilies: B1, B2 and B4. Similar to the Alu editing index, the SINE editing index is defined as the number of guanosines that were aligned to genomic adenosines that reside in SINE element, divided by the total number of nucleotides within the reads that align to SINE adenosine positions. All edited sites were converted to mm10 genome coordinates for downstream analysis.
Hyper-editing analysis is another global estimate of RNA editing levels35. This analysis quantifies heavily edited (hyper-edited) reads, which fail to align to the corresponding genome using standard alignment tools, and are hence traditionally overlooked. In order to align these hyper-edited reads, we transformed all adenosines to guanosines in both the unmapped reads and the reference genome and realigned them, and then transformed back the nucleotides to identify all mismatches. For each sample, the number of hyper-edited reads per million mapped reads is used to quantify the level of hyper-editing. All hyper-edited sites were converted to mm10 genome coordinates for downstream analysis.
Reads from the RNA-seq, which were generated as described above, were then aligned to the mouse reference genome (mm10) using STAR 2.5.4a aligner with the following parameters that accept only uniquely aligned reads (outFilterMultimap Nmax 1) and limit the absolute number of mismatches per read to 10 (–outFilter-MismatchNmax 10). We marked duplicate reads in the bam files using PICARD. Next, we attempted to capture the entire transcriptional universe by using MACS2 version 2.1.0, setting FDR to 0.05 and default mouse genome size, to call peaks on aligned reads from two biological conditions (two replicates each): untreated and IFNβ-treated control sgRNA-transfected B16 cells.
Transcribed regions were defined by using BEDTools to extend MACS2-called peaks across regions of the genome that were covered by at least 10 reads in any sample. These regions then were filtered for lengths of more than 50 bases. Furthermore, transcribed regions were checked for accuracy by viewing them on the Integrated Genomics Viewer and by calculating genome coverage using BEDTools. BEDTools was used to calculate the average read coverage for each transcribed region. Differential expression analysis between transcribed regions was performed using DESeq2. To assess the enrichment of edit site containing transcribed regions in IFNβ-treated versus untreated control sgRNA-transfected B16 cells, GSEAPreranked was performed between these groups using the ranking statistic k = (−1 × log10(q)) × (Abs(f)/f), where q is the DESeq2 FDR-adjusted P value and f is the signed fold change of a given transcribed region.
Genomic annotation of all SINE elements and edited sites found within SINE elements was performed using the ChIPseeker R package36.
ATAC-seq analysis of tumour cells.
For generation of ATAC-seq data, B16 tumour cells were grown in vitro with and without IFNβ stimulation for 36 h. Fifty thousand cells per replicate were sorted into PBS with 10% FBS. Pelleted cells were lysed in 50 μl reaction mix (25 μl of 2 × TD, 2.5 μl of Tn5 enzyme, 0.25 μl of 2% digitonin, 22.25 μl of nuclease-free water). The reaction was incubated at 37 °C for 30 min with agitation at 300 r.p.m. DNA was purified using a QIAgen MinElute Reaction Cleanup kit and Nextera sequencing primers ligated using PCR amplification. Agencourt AMPure XP bead cleanup (Beckman Coulter/Agencourt) was used post-PCR and library quality was verified using a Tapestation machine. Samples were sequenced on an Illumina NextSeq 550 sequencer using paired-end 37-bp reads.
Raw reads in Fastq files were trimmed for quality and primers were removed using Trimmomatic-0.33 using the following parameters: LEADING:15 TRAILING:15 SLIDINGWINDOW:4:15 MINLEN:36. FastQC reports were generated before and after trimming to assess quality. Trimmed reads were aligned to mm10 with bowtie2.2.4. Aligned bams were sorted for marking duplicates, and reads mapping to the blacklist region were removed. Reads were shifted +4 bp and −5 bp using pysam 0.9.0. Bam files from biological replicates were merged using samtools 1.3 before peak-calling using MACS 2.1.1 at a q-value threshold of 0.001. Consensus peaks were merged to create a single peak universe. Cut sites were extracted from each biological replicate and the number of cuts within each peak region was quantified to generate a raw counts matrix. DESeq2 was used to normalize the counts matrix and perform differential accessibility analysis between all pairwise comparisons. Regions were subsetted into those with increased, decreased or non-differential accessibility after IFN treatment compared with baseline samples. All peaks were extended by 250 bp on each side (total extension of 500 bp) using BEDTools2.2.20 and the number of overlaps with previously defined edits (see above) were quantified. The significance of overlap with edits was determined using a one-directional binomial test with non-differential regions as the background.
TCGA hyperediting analysis.
A hyperediting index was obtained from a published study37 characterizing primary tumour samples from 356 patients with publically available RNA-seq data in the TCGA collection (https://cancergenome.nih.gov/). Gene signature scores for Hallmark gene sets31 were assigned to these primary tumour samples using single-sample gene set enrichment analysis (ssGSEA) and the GenePattern interface (https://genepattern.broadinstitute.org). CIBERSORT38 was used to calculate an absolute immune infiltrate score for all primary tumour samples. ESTIMATE39 was used to independently quantitate immune infiltrate for each primary tumour sample (http://bioinformatics.mdanderson.org/estimate/). For samples without a publically available ESTIMATE score, scores were calculated using the ESTIMATE R package. Pearson correlation tests were performed using R.
In vitro cytokine stimulations and growth inhibition assays.
Tumour cells were engineered as noted above and plated in DMEM (B16, Braf/Pten and MC38) or RPMI (CT26) + 10% FBS containing the indicated combinations of cytokines: IFNβ (1,000 U/ml, PBL), IFNγ (100 ng/ml, Cell Signaling Technologies), TNF (10 ng/ml, PreproTech). For cell growth and viability assays, 10,000 cells were plated in 96-well plates and viable cells were enumerated after 72–96 h using Cell Titer-Glo (Promega, G7570). Growth assays depicted in the main figures were repeated for confirmation as follows: 50,000 cells were plated in 12-well plates and viable cells were counted after 72 h using the Countess automated cell counting system (Thermo Fisher Scientific, C10227).
Cell death assays.
Three sets of transfected B16 cells (control sgRNA5, Adar1 sgRNA1 and Adar1 sgRNA2) were plated in separate 6-well plates at a concentration of 100,000 cells per well and incubated for 72 h with DMEM + 10% FBS containing one of the following combinations of cytokines: IFNβ, IFNγ, or IFNβ and IFNγ. Cytokine-treated B16 cells, following trypsinization and washes in PBS + 2% FBS, were stained for 20 min on ice using the manufacturer’s recommended concentrations of Annexin-V PE and 7-AAD from the PE Annexin V Apoptosis Detection Kit 1(BD Pharmingen) and with Calcein-AM (ThermoFisher Scientific). Staining of cell surface markers was then analysed using an Accuri C6 flow cytometry system. Analysis was carried out using FlowJo software.
In vitro IFNβ ELISA.
Cells were seeded at a density of 10,000 cells per well in a 96-well plate. Mouse IFNβ (PBL Assay Science) was then added. After 6 h of incubation at 37 °C, the supernatant was aspirated from the wells to remove the mouse IFNβ. The wells were then gently washed once with medium. Fresh warm medium was then replaced in all the wells. After 72 h of incubation at 37 °C, the supernatant was collected, and the concentration of IFNβ was determined using the VeriKine Mouse Interferon Beta ELISA Kit (PBL Assay Science) or Mouse IFN-beta Quantikine ELISA Kit (R&D Systems).
Cytokine analysis from tumour lysate.
Tumours were isolated from mice on day 12 after inoculation. One hundred milligrams of tissue was collected in a 2-ml round-bottom eppendorf tube with pre-chilled 500 μl of cell lysis buffer (ThermoFisher, EPX-99999-000) supplemented with 1 mM PMSF, cOmplete Protease Inhibitor Cocktail and PhosSTOP Phosphatase Inhibitor Cocktail tablets (Roche). Tissues were homogenized with 5 mm stainless-steel beads on a TissueLyser machine (Qiagen) at 25 Hz for 1 min and centrifuged at 16,000g for 10 min at 4 °C. Protein concentration was assessed by BCA assay (ThermoFisher Scientific), and tissues were normalized to 10 mg/ml. Lysate was then probed for IFNβ or IFNγ protein levels by ELISA (mouse IFN-beta Quantikine ELISA, mouse IFNγ Quantikine ELISA, R&D Systems).
Western blotting.
Whole-cell lysates were prepared in either SDS lysis buffer (60 mM Tris HCl, 2% SDS, 10% glycerol, complete EDTA-free protease-inhibitor (Roche), and 500 U/ml benzonase nuclease (Novagen)) or RIPA Lysis and Extraction Buffer (ThermoFisher Scientific). For blots of ADAR1 and epistasis genes, cells were stimulated with 1,000 U/ml mouse IFNβ (PBL) overnight before collecting lysates unless otherwise noted. Samples were boiled at 100 °C and clarified by centrifugation. Protein concentration was measured with a BCA protein assay kit (Pierce). Between 30 and 150 μg protein was loaded onto 4–12% Bolt Bis-Tris Plus gels (Life Technologies) in MES buffer (Life Technologies). Protein was transferred to 0.45-mm nitrocellulose membranes (Bio-Rad). Membranes were blocked in Tris-buffered saline plus 0.1% Tween 20 (TBS-T) containing 5% nonfat dry milk for 1 h at room temperature followed by overnight incubation with primary antibody at 4 °C. For Extended Data Fig. 1a, membranes were washed with TBS-T and incubated with HRP-conjugated secondary antibodies for 1 h at room temperature. HRP was activated with Supersignal West Dura Extended Duration Substrate (Pierce) and visualized with a chemiluminscent detection system using Fuji ImageQuant LAS4000 (GE Healthcare Life Sciences). For all other figures, membranes were incubated with Odyssey Blocking Buffer (LI-COR), and IRDye 800CW or 680RD secondary antibodies. Membranes were then visualized using the Odyssey CLx scanner (LI-COR), then analysed using ImageJ, Image Studio Lite and Adobe Photoshop software.
Antibodies.
Flow cytometry antibodies are listed in Supplementary Table 1 and immunohistochemistry antibodies are listed above. For western blotting, primary antibodies against ADAR1 (15.8.6, Santa Cruz Biotechnology), PKR (EPR19374 Abcam), RIG-I (D14G6, Cell Signaling Technology), MDA5 (D74E4, Cell Signaling Technology), STAT1 (p91, Polyclonal Goat IgG, R&D Systems), and MAVS (Rabbit Polyclonal IgG, ThermoFisher Scientific)were used. Peroxidase-conjugated secondary antibodies against rabbit IgG, mouse IgG or goat IgG were purchased from Jackson Laboratories. IRDye secondary antibodies against rabbit IgG, mouse IgG or goat IgG were purchased from LI-COR Biosciences.
Quantitative PCR.
For each replicate, one million tumour cells were collected and resuspended in buffer RLT (Qiagen, 79216). RNA was extracted using an RNeasy Mini Kit (Qiagen, 74104) as per the manufacturer’s instructions. RNA was converted to cDNA using the Improm-II Reverse Transcription System (Promega A3800). qPCR reactions were carried out in 20 reaction volumes with 10 μl of TaqMan Gene Expression Master Mix (Thermo Fisher Scientific, 4369016), 5 μl nuclease-free H2O, 1 μl of each probe and 3 μl of each cDNA sample. The qPCR reaction was run using a ViiA 7 Real-Time PCR System (Thermo Fisher Scientific) in a 96-well plate. FAM-tagged targets were quantified using the ΔΔCt method relative to β-actin (Actb), which was VIC-tagged.
CRISPR sgRNA sequences.
Adar sgRNA 1 CACCGTCTGGATTCACAACTCCAGG
Adar sgRNA 2 CACCGTCACAGCCCTACCTTGCCA
Adar sgRNA 3 CACCGTGTGACTCTCAGAAATCAG
Adar sgRNA 4 ACCGTTCCAAGTCAATCAGCACTG
Adar sgRNA 5 CACCGCACACAGCAGGGGTACACCA
Adar sgRNA 6 CACCGTCCGTCAAGTACCAGATGGG
Ddx58 sgRNA 1 CACCGCGTTGGAGATGCTAAGACCG
Ddx58 sgRNA 2 CACCGTCCGCCAGAGATGAACGAAG
Eif2ak2 sgRNA 1 CACCGTGGCTACTCCGTGCATCTGG
Eif2ak2 sgRNA 2 CACCGCTCGTCTATGACAAGTAAT
Ifih1 sgRNA 1 CACCGCGTAGACGACATATTACCAG
Ifih1 sgRNA 2 CACCGACATAACAGCAACATGGGCA
Ifnar2 sgRNA 1 CACCGTACCAGAGGGTGTAGTTAG
Ifnar2 sgRNA 2 CACCACACAAGCTGAGGAGACCGA
Ifngr1 sgRNA 1 CACCCGACTTCAGGGTGAAATACG
Ifngr1 sgRNA 2 CACCGGTATTCCCAGCATACGACA
Mavs sgRNA 1 CACCGACTCCTCCAGACCAACTCCG
Mavs sgRNA 2 CACCGGTCACAACATCCCTGACCA
Stat1 sgRNA 1 CACCGATCATCTACAACTGTCTGA
Stat1 sgRNA 2 CACCGTACGATGACAGTTTCCCCA
Control sgRNA 1 CACCGCGAGGTATTCGGCTCCGCG
Control sgRNA 2 CACCGCTTTCACGGAGGTTCGACG
Control sgRNA 3 CACCATGTTGCAGTTCGGCTCGAT
Control sgRNA 4 CACCACGTGTAAGGCGAACGCCTT
Control sgRNA 5 CACCATTGTTCGACCGTCTACGGG
Statistics.
Statistical tests employed with the number of replicates and independent experiments are listed in the text and figure legends. All graphs with error bars report mean ± s.e.m. values except where indicated. t-tests were two-tailed in all cases. For box-plot elements, the centre line represents the median value, box limits represent upper and lower quartiles and whiskers represent minimum and maximum values. PRISM was used for basic statistical analysis and plotting (http://www.graphpad.com), and the R language and programming environment (https://www.r-project.org) was used for the remainder of the statistical analysis. Multiple hypothesis testing correction was applied where multiple hypotheses were tested and is indicated by the use of FDR.
Reporting summary.
Further information on research design is available in the Nature Research Reporting Summary linked to this paper.
Extended Data
Extended Data Fig. 1 ∣. Supporting evidence that ADAR1 loss enhances the response to immunotherapy.
a, Expression of ADAR1 protein in control (grey), Adar1 p150-null (orange) and Adar1 p150/p110-null (red) B16 cells. Results are representative of three independent experiments. b, Tumour volume (left) and survival analysis (right) of control (grey), Adar1 p150-null (orange) or Adar1 p110/p150-null (red) B16 tumours in GVAX- and anti-PD-1-treated wild-type C57BL/6 mice. n = 5 animals per guide with two separate guides for the control group and at least two separate guides for each Adar1-null group. Data are representative of two independent experiments. c, Tumour volume and survival analysis of control (grey), Adar1 p150-null (orange) or Adar1 p110/p150-null (red) CT26 and Braf/Pten tumours in NSG, wild-type and wild-type anti-PD-1-treated mice. n = 5 mice per group; data are representative of two independent experiments. d, Survival analysis of control and Adar1-null MC38 tumours in wild-type and wild-type anti-PD-1-treated C57BL/6 mice. n = 5 animals per guide with two separate guides for the control group and three separate guides for the Adar1-null group. Data are representative of two independent experiments. e, Tumour volume and survival analysis of Adar1-null and control B16 tumours size matched at the time of PD-1 treatment initiation. b–e, Tumour volume curves are mean ± s.e.m and assessed with Student’s t-test; survival curves assessed with log-rank test, *P < 0.05; **P < 0.01; ***P < 0.001; ****P < 0.0001.
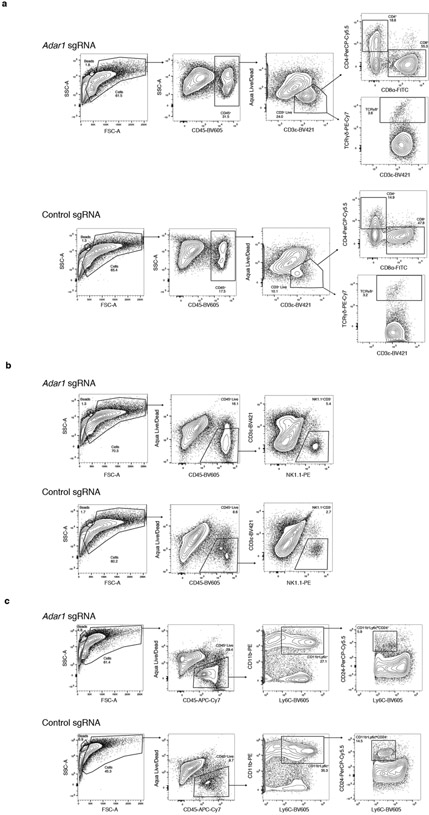
Extended Data Fig. 2 ∣. Flow cytometry gating strategies and representative plots.
a, Gating strategy and representative flow cytometry plots for the assessment of CD4+, CD8+ and γδ T cells in Adar1-null and control B16 tumours. b, Gating strategy and representative flow cytometry plots for the assessment of NK cells in Adar1-null and control B16 tumours. c, Gating strategy and representative flow cytometry plots for the assessment of CD11b+Ly6c+ and CD11b+Ly6cloCD24+ cells in Adar1-null and control B16 tumours.
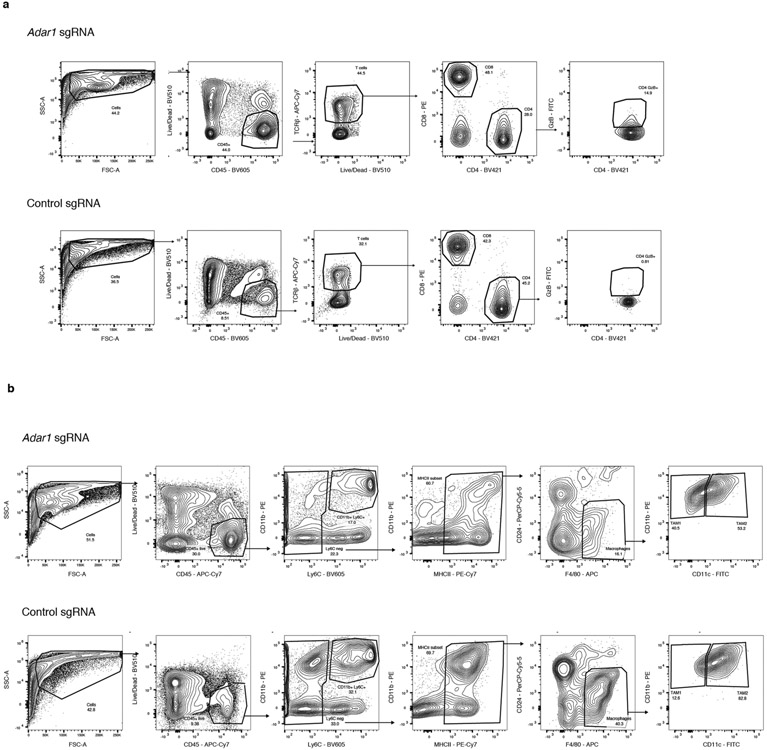
Extended Data Fig. 3 ∣. Further flow cytometry gating strategies and representative plots.
a, Gating strategy and representative flow cytometry plots for the assessment of granzyme B+CD4+ T cells in Adar1-null and control B16 tumours. b, Gating strategy and representative flow cytometry plots for the assessment of TAM1 and TAM2 populations in Adar1-null and control B16 tumours.
Extended Data Fig. 4 ∣. Single-cell RNA-seq extended data.
a, Gene expression matrix from single-cell RNA-seq experiment characterizing expression of lineage-defining genes in cell clusters. b, Key differentially expressed transcripts that distinguish cell clusters in Fig. 2. c, Paired quantile-quantile (Q–Q) plots comparing the expression of a curated set of genes in immune cells from Adar1-null and control tumours and matched t-SNEs depicting the distribution of gene expression for proinflammatory, suppressive and T cell activation/effector genes. P values calculated using Wilcoxon rank-sum test. d, Single-cell gene set enrichment scores of an IFNγ response signature score within individual immune subpopulations from Adar1-null and control tumours (P values calculated using Kolmogorov–Smirnov test). a, c, d, n = 7,406 cells. *P < 0.05; **P < 0.01; ***P < 0.001.
Extended Data Fig. 5 ∣. Further studies corroborating the reported in vitro phenotype of Adar1-null tumour cells.
a, Western blot demonstrating expression of ovalbumin in modified Adar1 p150/p110-null (red), Adar1 p150-null (orange) and control (grey) B16 tumour cell lines. Data are representative of two independent experiments. b, Calcein cell viability and 7-AAD cell death staining of control or Adar1-null B16 tumour cells following stimulation with IFNβ, IFNγ or a combination of both. Data are representative of three independent experiments with n = 3 for each condition. c, Growth and viability of Adar1 p150/p110-null, Adar1 p150-null and control B16 tumour cells in response to increasing doses of IFNβ and IFNγ (n = 3 for each condition). Doses are relative to 1 × standard of 1,000 U ml−1 IFNβ and 100 ng ml−1 IFNγ. Data are representative of two independent experiments. d, Growth and viability of Adar1 p150/p110-null and control CT26 tumour cells following stimulation with IFNβ or IFNγ relative to the unstimulated state (n = 3 for each condition). Data are representative of two independent experiments. e, Growth and viability of Adar1 p150/p110-null and control Braf/Pten tumour cells following stimulation with TNF, IFNβ or IFNγ relative to the unstimulated state (n = 3 for each condition). Data are representative of two independent experiments. f, GSEA of gene signatures in Adar1-null compared with control B16 tumours cells after in vitro culture without cytokine stimulation. n = 3 for each condition; FDR calculated using GSEA. g, Heat map showing differentially expressed genes from Adar1-null and control B16 tumour cells 36 h after IFNβ stimulation in vitro (n = 3 for each condition). Genes listed in adjacent text were manually curated as antiviral or relevant to anti-tumour immunity. h, IFNβ ELISA of control and Adar1 p150/p110 CT26 tumour cells following stimulation with IFNβ or IFNγ (n = 3 for each condition). b–e, h, Two-sided Student’s t-test, *P < 0.05; **P < 0.01; ***P < 0.001; ****P < 0.0001.
Extended Data Fig. 6∣. ADAR1 re-expression and corroborating in vitro epistatic IFN-signalling experiments.
a, Western blot of B16 Adar1-null tumour cells following re-expression of wild-type ADAR1 or an irrelevant control (CD19) protein. Data are representative of two independent experiments. b, IFNβ secretion (left) and relative growth (right) of control (grey), Adar1 p150/p110-null (red), Adar1-null with full-length ADAR1 re-expression construct (red outline) and control with ADAR1 re-expression construct (grey outline) B16 tumour cells following cytokine stimulation as indicated (n = 3 for each condition). Data are representative of two independent experiments. c, qPCR and western blot validation of the loss of expression of Ifnar2, Ifngr1 and Stat1 from B16 tumour cells used to generate the control and Adar1-null tumour cell lines shown in Fig. 3. n = 3 for qPCR experiments and data are representative of two independent experiments. d, Growth inhibition (left two panels) and IFNβ ELISA (right panel) of control and Adar1-null B16 tumour cells modified to delete Ifnar2, Ifngr1 or Stat1 (n = 3 for each condition; data representative of three independent experiments). e, IFNβ secretion in vitro following irradiation with 4 Gy in Adar1-null and control B16 tumour cells with and without IFNAR-blocking antibodies (left). Growth and viability of Adar1-null and control B16 tumour cells in vitro following irradiation with 4 Gy with and without IFNAR-blocking antibodies (right). For both plots: n = 3 for each condition; data are representative of two independent experiments. f, Survival analysis corresponding to the tumour volume curves depicted in Fig. 3h of Adar1 and control tumours treated with therapeutic irradiation. n = 10 mice for each group. Data are representative of two independent experiments. g, Tumour volume and survival analysis of control and Adar1-null B16 tumours treated with topical imiquimod. Data are representative of two independent experiments with n = 10 mice per group. b, e and tumour volume curves, two-sided Student’s t-test; survival curves, log-rank test, *P < 0.05; **P < 0.01; ***P < 0.001; ****P < 0.0001.
Extended Data Fig. 7∣. Corroborating data for dsRNA editing and epistasis studies of Adar1-null tumours.
a, Genomic localization of SINEs (left) and detected editing sites within SINEs (right) in control B16 tumour cells. b, Representative tracks of ATAC-seq and RNA-seq mapped to SINEs and detected edits in IFN-inducible regions of accessible chromatin and transcription. c, Transcriptional upregulation of Adar1 and dsRNA sensors 36 h after stimulation with IFNβ or IFNγ in control B16 tumour cells as measured by RNA-seq (n = 3 for each condition). d, Volcano plot depicting the relative depletion and enrichment of sgRNAs targeting 20,146 genes in a Cas9+ Adar1-null B16 tumour cell line following stimulation with IFNγ in vitro. P values are derived using STARS v1.3. e, Western blots demonstrating the loss of expression of PKR, MDA5, RIG-I, MAVS and ADAR1 from double knockout and triple knockout B16 tumour cell lines. Data are representative of two independent experiments. f, IFNβ and IFNγ ELISAs from tumour lysate extracted from Adar1-null and control tumours that were epistatically deleted for dsRNA sensors including Eif2ak2 (PKR), Ifih1 (MDA5) or both (n = 5 for each condition). f, Two-sided Student’s t-test, *P < 0.05; **P < 0.01; ***P < 0.001; ****p < 0.0001.
Extended Data Fig. 8∣. Correlations between RNA editing and signatures of immune infiltration in TCGA.
a, Pearson’s correlations between hyperediting index and Hallmark Inflammatory Response, CIBERSORT Absolute Immune Infiltrate, Hallmark Interferon Gamma Response, Hallmark Apoptosis and ESTIMATE immune infiltrate gene signatures from 356 tumours in TCGA for which hyperediting index information was available. b, Distribution of hyperediting index values of individual tumour types from the same samples from TCGA. Box plots represent the range, median, 25th and 75th percentile with n as indicated in the figure.
Extended Data Fig. 9 ∣. Corroborating data for models of immunotherapy resistance.
a, Western blot demonstrating the expression of ovalbumin in control and B2m-null B16 tumour cell lines depicted in Fig. 5c. Data are representative of two independent experiments. b, Quantitative PCR and western blots demonstrating loss of expression of B2m, Jak1, H2k1, Jak2, and Nlrc in B16 tumour cell lines used to make epistatically deleted Adar1-null or control tumour cells lines. n = 3 for qPCR experiments and data are representative of two independent experiments with P value calculated using two-sided Student’s t-test, *P < 0.05; **P < 0.01; ***P < 0.001; ****P < 0.0001.
Extended Data Fig. 10 ∣. Loss of ADAR1 overcomes multiple common mechanisms of resistance to immunotherapy in vivo.
a, Survival analysis corresponding to tumour volume curves from Fig. 5c depicting the effect of Adar1 deletion in B16 tumours in which Jak1 or B2m have been epistatically deleted. n = 5 animals per group; data are representative of two independent experiments. b, Tumour volume curves in control (grey) and Adar1-null (red) B16 tumour cells epistatically deleted for H2k1, Jak2 and Nlrc5 and treated with GVAX and anti-PD-1 as indicated (n = 5 animals per group). c, Survival analysis corresponding to the tumour volume curves depicted in b. d, Additional TME characterization of control and Adar1-null B16 tumour cells epistatically deleted for Jakl and B2m as indicated (n = 5 mice per group). Data in d and all tumour volume curves assessed with two-sided Student’s t-test; all survival curves assessed with log-rank test, *P < 0.05; **P < 0.01; ***P < 0.001; ****P < 0.0001.
Supplementary Material
Acknowledgements
We thank all members of the Haining, Hur, Levanon and Meyerson laboratories for their input and discussions regarding this project.
Footnotes
Competing interests This work was supported in part by funding from Calico Life Sciences, LLC. J.J.I., R.T.M. and W.N.H. are authors of a patent application related to ADAR. W.N.H. consults for and has equity in Tango Therapeutics.
Publisher’s note: Springer Nature remains neutral with regard to jurisdictional claims in published maps and institutional affiliations.
Online content
Any methods, additional references, Nature Research reporting summaries, source data, statements of data availability and associated accession codes are available at https://doi.org/10.1038/s41586-018-0768-9.
Data availability
All data presented in this manuscript are available from the corresponding author upon reasonable request. Bulk tumour cell RNA sequencing has been deposited at the Gene Expression Omnibus (GEO) under accession number https://www.ncbi.nlm.nih.gov/geo/query/acc.cgi?acc=GSE110708. Single-cell RNA sequencing of tumour cells were also deposited at the GEO under accession numberhttps://www.ncbi.nlm.nih.gov/geo/query/acc.cgi?acc=GSE110746.
References
- 1.Zaretsky JM et al. Mutations associated with acquired resistance to PD-1 blockade in melanoma. N. Engl. J. Med 375, 819–829 (2016). [DOI] [PMC free article] [PubMed] [Google Scholar]
- 2.Gao J et al. Loss of IFN-γ pathway genes in tumor cells as a mechanism of resistance to anti-CTLA-4 therapy. Cell 167, 397–404 (2016). [DOI] [PMC free article] [PubMed] [Google Scholar]
- 3.Yoshihama S et al. NLRC5/MHC class I transactivator is a target for immune evasion in cancer. Proc. Natl Acad. Sci. USA 113, 5999–6004 (2016). [DOI] [PMC free article] [PubMed] [Google Scholar]
- 4.Sade-Feldman M et al. Resistance to checkpoint blockade therapy through inactivation of antigen presentation. Nat. Commun 8, 1136 (2017). [DOI] [PMC free article] [PubMed] [Google Scholar]
- 5.Manguso RT et al. In vivo CRISPR screening identifies Ptpn2 as a cancer immunotherapy target. Nature 547, 413–418 (2017). [DOI] [PMC free article] [PubMed] [Google Scholar]
- 6.Mannion NM et al. The RNA-editing enzyme ADAR1 controls innate immune responses to RNA. Cell Reports 9, 1482–1494 (2014). [DOI] [PMC free article] [PubMed] [Google Scholar]
- 7.Liddicoat BJ, Chalk AM & Walkley CR ADAR1, inosine and the immune sensing system: distinguishing self from non-self. Wiley Interdiscip. Rev. RNA 7, 157–172 (2016). [DOI] [PubMed] [Google Scholar]
- 8.Ahmad S et al. Breaching self-tolerance to Alu duplex RNA underlies MDA5-mediated inflammation. Cell 172, 797–810.e13 (2018). [DOI] [PMC free article] [PubMed] [Google Scholar]
- 9.Chung H et al. Human ADAR1 prevents endogenous RNA from triggering translational shutdown. Cell 172, P811–P824 (2018). [DOI] [PMC free article] [PubMed] [Google Scholar]
- 10.Deng L et al. STING-dependent cytosolic DNA sensing promotes radiation-induced type I interferon-dependent antitumor immunity in immunogenic tumors. Immunity 41, 843–852 (2014). [DOI] [PMC free article] [PubMed] [Google Scholar]
- 11.Lim JYH, Gerber SA, Murphy SP & Lord EM Type I interferons induced by radiation therapy mediate recruitment and effector function of CD8+ T cells. Cancer Immunol. Immunother 63, 259–271 (2014). [DOI] [PMC free article] [PubMed] [Google Scholar]
- 12.Twyman-Saint Victor C et al. Radiation and dual checkpoint blockade activate non-redundant immune mechanisms in cancer. Nature 520, 373–377 (2015). [DOI] [PMC free article] [PubMed] [Google Scholar]
- 13.Wenzel J, Uerlich M, Haller O, Bieber T & Tueting T Enhanced type I interferon signaling and recruitment of chemokine receptor CXCR3-expressing lymphocytes into the skin following treatment with the TLR7-agonist imiquimod. J. Cutan. Pathol 32, 257–262 (2005). [DOI] [PubMed] [Google Scholar]
- 14.Sainathan SK et al. Toll-like receptor-7 ligand Imiquimod induces type I interferon and antimicrobial peptides to ameliorate dextran sodium sulfate-induced acute colitis. Inflamm. Bowel Dis 18, 955–967 (2012). [DOI] [PMC free article] [PubMed] [Google Scholar]
- 15.Cho JH et al. The TLR7 agonist imiquimod induces anti-cancer effects via autophagic cell death and enhances anti-tumoral and systemic immunity during radiotherapy for melanoma. Oncotarget 8, 24932–24948 (2017). [DOI] [PMC free article] [PubMed] [Google Scholar]
- 16.Patterson JB & Samuel CE Expression and regulation by interferon of a double-stranded-RNA-specific adenosine deaminase from human cells: evidence for two forms of the deaminase. Mol. Cell. Biol 15, 5376–5388 (1995). [DOI] [PMC free article] [PubMed] [Google Scholar]
- 17.George CX & Samuel CE Human RNA-specific adenosine deaminase ADAR1 transcripts possess alternative exon 1 structures that initiate from different promoters, one constitutively active and the other interferon inducible. Proc. Natl Acad. Sci. USA 96, 4621–4626 (1999). [DOI] [PMC free article] [PubMed] [Google Scholar]
- 18.Heidegger S et al. The RIG-I agonist 3pRNA synergizes with checkpoint blockade in cancer immunotherapy. Blood 126, 3436 (2015). [Google Scholar]
- 19.Goel S et al. CDK4/6 inhibition triggers anti-tumour immunity. Nature 548, 471–475 (2017). [DOI] [PMC free article] [PubMed] [Google Scholar]
- 20.Chiappinelli KB et al. Inhibiting DNA methylation causes an interferon response in cancer via dsRNA including endogenous retroviruses. Cell 162, 974–986 (2015). [DOI] [PMC free article] [PubMed] [Google Scholar]
- 21.Li H et al. Immune regulation by low doses of the DNA methyltransferase inhibitor 5-azacitidine in common human epithelial cancers. Oncotarget 5, 587–598 (2014). [DOI] [PMC free article] [PubMed] [Google Scholar]
- 22.Ribas A et al. Oncolytic virotherapy promotes intratumoral T cell infiltration and improves anti-PD-1 immunotherapy. Cell 170, 1109–1119 (2017). [DOI] [PMC free article] [PubMed] [Google Scholar]
- 23.Juneja VR et al. PD-L1 on tumor cells is sufficient for immune evasion in immunogenic tumors and inhibits CD8 T cell cytotoxicity. J. Exp. Med 214, 895–904 (2017). [DOI] [PMC free article] [PubMed] [Google Scholar]
- 24.McGranahan N et al. Allele-specific HLA loss and immune escape in lung cancer evolution. Cell 171, 1259–1271 (2017). [DOI] [PMC free article] [PubMed] [Google Scholar]
- 25.Tumeh PC et al. PD-1 blockade induces responses by inhibiting adaptive immune resistance. Nature 515, 568–571 (2014). [DOI] [PMC free article] [PubMed] [Google Scholar]
- 26.Ngwa W, Tsiamas P, Zygmanski P, Makrigiorgos GM & Berbeco RI A multipurpose quality assurance phantom for the small animal radiation research platform (SARRP). Phys. Med. Biol 57, 2575–2586 (2012). [DOI] [PubMed] [Google Scholar]
- 27.Satija R, Farrell JA, Gennert D, Schier AF & Regev A Spatial reconstruction of single-cell gene expression data. Nat. Biotechnol 33, 495–502 (2015). [DOI] [PMC free article] [PubMed] [Google Scholar]
- 28.Waltman L & van Eck NJ A smart local moving algorithm for large-scale modularity-based community detection. Eur. Phys. J. B 86, 471 (2013). [Google Scholar]
- 29.Subramanian A et al. Gene set enrichment analysis: a knowledge-based approach for interpreting genome-wide expression profiles. Proc. Natl Acad. Sci. USA 102, 15545–15550 (2005). [DOI] [PMC free article] [PubMed] [Google Scholar]
- 30.DeTomaso D & Yosef N FastProject: a tool for low-dimensional analysis of single-cell RNA-Seq data. BMC Bioinformatics 17, 315 (2016). [DOI] [PMC free article] [PubMed] [Google Scholar]
- 31.Liberzon A et al. The Molecular Signatures Database (MSigDB) hallmark gene set collection. Cell Syst. 1, 417–425 (2015). [DOI] [PMC free article] [PubMed] [Google Scholar]
- 32.Schmieder R & Edwards R Quality control and preprocessing of metagenomic datasets. Bioinformatics 27, 863–864 (2011). [DOI] [PMC free article] [PubMed] [Google Scholar]
- 33.Dobin A et al. STAR: ultrafast universal RNA-seq aligner. Bioinformatics 29, 15–21 (2013). [DOI] [PMC free article] [PubMed] [Google Scholar]
- 34.Bazak L et al. A-to-I RNA editing occurs at over a hundred million genomic sites, located in a majority of human genes. Genome Res 24, 365–376 (2014). [DOI] [PMC free article] [PubMed] [Google Scholar]
- 35.Porath HT, Carmi S & Levanon EY A genome-wide map of hyper-edited RNA reveals numerous new sites. Nat. Commun 5, 4726 (2014). [DOI] [PMC free article] [PubMed] [Google Scholar]
- 36.Yu G, Wang L-G & He Q-Y ChIPseeker: an R/Bioconductor package for ChIP peak annotation, comparison and visualization. Bioinformatics 31, 2382–2383 (2015). [DOI] [PubMed] [Google Scholar]
- 37.Paz-Yaacov N et al. Elevated RNA Editing activity is a major contributor to transcriptomic diversity in tumors. Cell Reports 13, 267–276 (2015). [DOI] [PubMed] [Google Scholar]
- 38.Newman AM et al. Robust enumeration of cell subsets from tissue expression profiles. Nat. Methods 12, 453–457 (2015). [DOI] [PMC free article] [PubMed] [Google Scholar]
- 39.Yoshihara K et al. Inferring tumour purity and stromal and immune cell admixture from expression data. Nat. Commun 4, 2612 (2013). [DOI] [PMC free article] [PubMed] [Google Scholar]
Associated Data
This section collects any data citations, data availability statements, or supplementary materials included in this article.


