Summary
The adipose tissue is an energy store and a dynamic endocrine organ1,2. In particular, the visceral adipose tissue (VAT) is critical for the regulation of systemic metabolism3,4, and impaired VAT function, for example in obesity, is associated with insulin resistance and type 2 diabetes5,6. Regulatory T (Treg) cells that express the transcription factor Foxp3 are critical for limiting immune responses and suppress tissue inflammation, including in the VAT7–9. Here we uncover pronounced sexual dimorphism in VAT Treg cells. Male but not female VAT was enriched for Treg cells, which differed strikingly from their female counterparts in phenotype, transcriptional landscape and chromatin accessibility. Heightened inflammation in the male VAT facilitated the recruitment of Treg cells via the CCL2-CCR2 axis. Androgen regulated the differentiation of a unique IL-33-producing stromal cell population specific to the male VAT, which paralleled the local expansion of Treg cells. Sex-hormones also regulated VAT inflammation, which shaped the transcriptional landscape of VAT-resident Tregs in a Blimp1 transcription factor dependent manner. Overall, we find that sex-specific differences in VAT Treg cells are imprinted by the tissue niche in a sex-hormone-dependent manner to limit adipose tissue inflammation.
Sexual dimorphism in VAT Treg cells
Sex-dependent differences in adipose tissue physiology and organismal metabolism are well documented across species10,11. Consistent with this notion, male and female mice display differences in body weight, ratio of lean-to-fat mass and rates of energy expenditure (Extended Data Fig. 1a–c, Fig. 1a, b). Males compared with age-matched females, showed relative glucose intolerance and concomitant hyperinsulinemia, hallmarks of insulin resistance, but no differences in adipokines (Fig. 1c, Extended Data Fig. 1d, e). Immune cells play critical roles in VAT-mediated regulation of organismal metabolism12–17. Strikingly, perigonadal VAT of lean male mice harboured much larger proportions and numbers of Treg cells compared with females (Fig. 1d–f). This difference was specific to Treg cells, as there were no significant differences between any other major adaptive and innate immune cell populations, including type 2 innate lymphocytes (ILC2), which together with Treg cells play an important role in VAT homeostasis14,15,18,19 (Extended Data Fig. 1f, g). VAT Treg cells also displayed striking sex-dependent phenotypic differences. While both male and female VAT Treg cells had an activated phenotype (CD62L−CD44+), only male VAT Treg cells expressed high amounts of the IL-33 receptor ST2, the maturation marker KLRG1 and the chemokine receptor CCR2 (Extended Data Fig. 1h, Fig. 1g). Furthermore, the immune suppressive cytokine IL-10 was abundant in male but not in female VAT Treg cells (Fig. 1h). Sex-specific differences in Treg cells were specific to the VAT, as abundance and IL-10 expression of Treg cells in other lymphoid or non-lymphoid tissues, such as small intestine lamina propria, colon, liver and lung were similar (Extended Data Figs 1i, 2a). Furthermore, the differences were specific to the adipose tissue depot, as neither the subcutaneous nor the peri-nephric adipose showed sex-specific differences in abundance or phenotype of Treg cells (Extended Data Fig. 2b, c).
Figure 1. Treg cells show VAT specific sexual dimorphism.
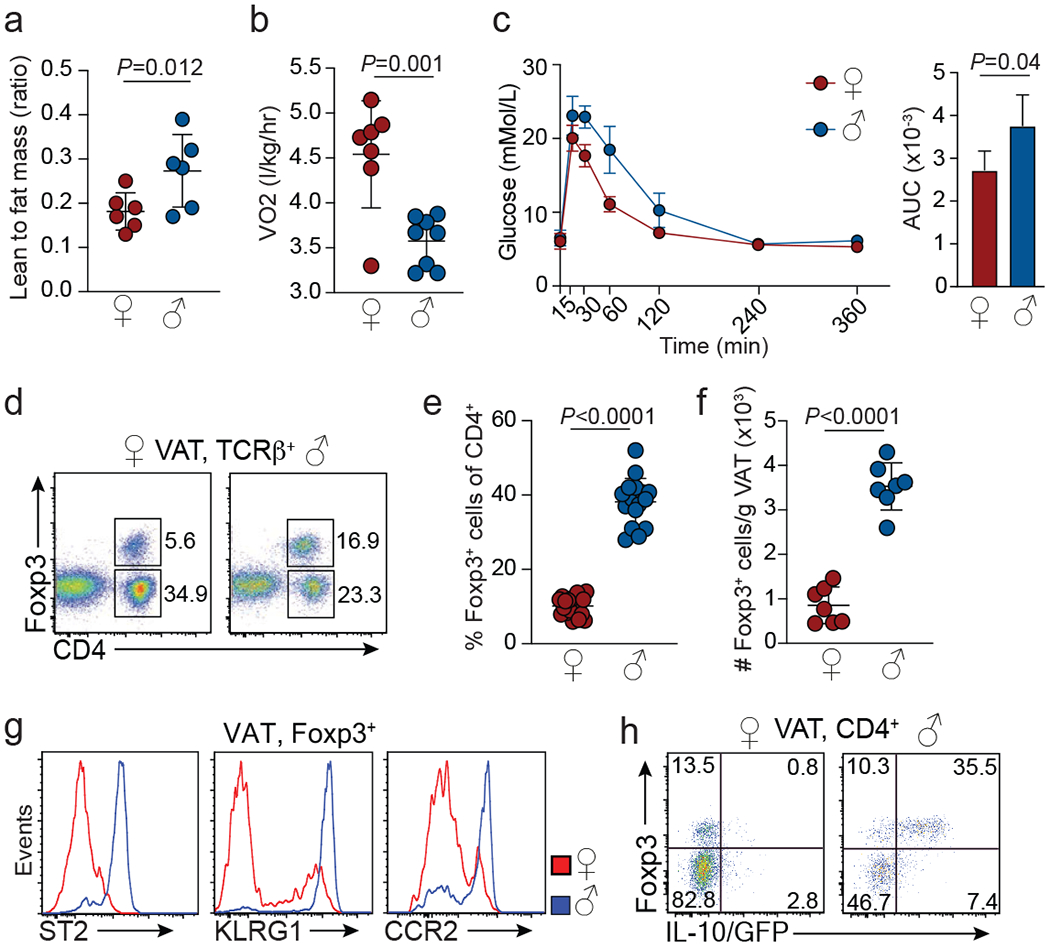
a, Ratio of lean mass to fat mass. Female (n=6), male (n=6). b, Oxygen consumption. Female (n=6), male (n=8). c, Glucose tolerance in 25-week-old female and male mice under normal chow diet conditions. Female (n=4), male (n=4). Graph on the right shows area under the curve (AUC) for the glucose tolerance test. d, Proportions of Foxp3+ cells among visceral adipose tissue (VAT) TCRβ+ T cells in female and male C57BL/6 mice. Representative of female (n=19), male (n=16). e, Foxp3+ Treg cells as proportion of CD4+ cells. Female (n=19), male (n=16). f, Treg cell numbers in the VAT of female and male mice. Female (n=7), male (n=7). g, Expression of indicated cell surface markers on male and female VAT Treg cells. Representative of female (n=19), male (n=16). h, IL-10/GFP expression in VAT Treg cells from male and female Foxp3RFPIl10GFP mice. Representative of n=6 mice of each sex. For a-c, e and f, unpaired t-test (2-tailed) was performed. Data are mean ± s.d. Data pooled or representative of 2-3 independent experiments.
Sex-specific VAT Treg cell molecular profile
To gain insight into the molecular mechanisms that underpin sex-dependent differences in VAT Treg cells, we compared transcriptional profiles of Treg cells isolated from the VAT and spleens of male and female mice by RNA sequencing (RNAseq). Treg cells isolated from male VAT and spleen differed substantially, revealing a distinct VAT Treg cell transcriptional signature of almost 3000 genes (false discovery rate 0.1, fold change >2) (Fig. 2a, Supplementary Information 1). In contrast, Treg cells from female VAT were similar to their splenic counterparts, with only 305 differentially expressed genes (Fig. 2b, Supplementary Information 2). Comparison of male and female VAT Treg cells, but not splenic Treg cells, revealed striking differences in their transcriptional profiles with >1100 genes differentially expressed (Fig. 2c, Extended data Fig. 2d, Supplementary Information 3, 4). In line with our flow-cytometric data, male VAT Treg cells showed higher expression of Il1rl1 (encoding ST2), Il10, Ccr2 and Klrg1. Similarly, male but not female VAT Treg cells expressed high amounts of Pparg (required for VAT Treg cell differentiation20), Prdm1 (encoding Blimp1, associated with effector Treg cell differentiation21) and Gata3. In contrast, female VAT Treg cells showed elevated amounts of Sell (CD62L), Cxcr5, Stat1, Foxo1 and Tcf7 (Fig. 2c). Much fewer genes, including the ubiquitous male-specific Ddx3y and female-specific Xist, were differentially expressed between male and female VAT-resident ILC2s and conventional CD4+ T cells (Extended data Fig. 2e, f; Supplementary Information 5, 6), indicating that the sex-dependent differences in gene expression were specific to VAT Treg cells. To test whether the distinct transcriptional profiles of male and female VAT Treg cells were reflected in differential chromatin accessibility, we performed ATAC sequencing (ATACseq) (Fig. 2d). We found 3833 loci that showed sex-dependent differential accessibility in VAT Treg cells. This included Il1rl1, Il10, Pparg and Klrg1, which were part of the male VAT Treg cell transcriptional signature and showed increased accessibility in male VAT Treg cells compared to both female VAT Treg and male splenic Treg cells (Fig. 2e, Extended data Fig. 2g, h; Supplementary Information 7).
Figure 2. Treg cells from male and female VAT are distinct in their transcriptional profile and chromatin accessibility.
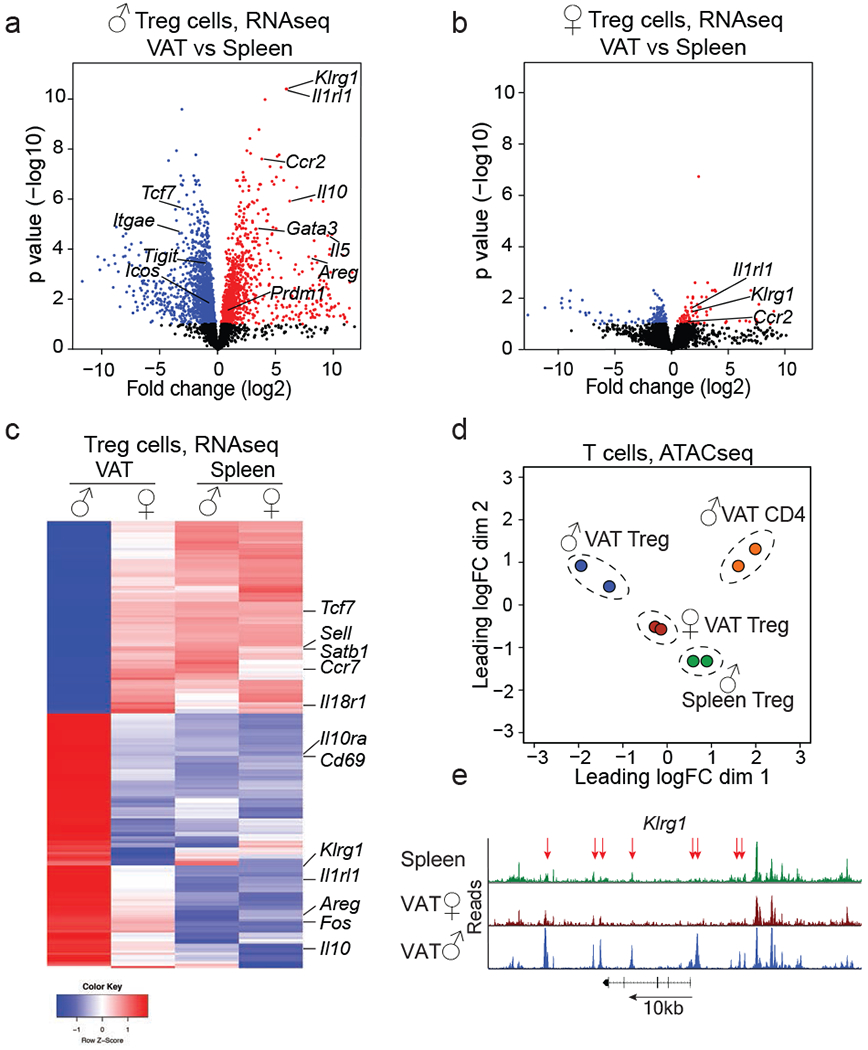
Treg cells were sorted from visceral adipose tissue (VAT) and spleens of 25 to 32-week-old Foxp3RFP mice to perform RNA sequencing and Assay for Transposase-Accessible Chromatin using sequencing (ATACseq). n=2 samples, each sample contains Treg cells from n=5 male and n=12 female mice. a, Volcano plot shows genes differentially expressed between Treg cells from male VAT and spleen. Each dot represents a gene; genes in red are up, genes in blue are down-regulated in male VAT Treg cells. b, Volcano plot shows genes differentially expressed between Treg cells from female VAT and spleen. Genes in red and blue are up or down-regulated, respectively, in female VAT Treg cells. c, Heatmap shows top 200 genes differentially expressed between male and female VAT and comparison to splenic Treg cells. d, Multi-dimensional scaling analysis of ATACseq data. Distances shown on the plot represent the leading log2-fold-change between samples. (e) ATACseq tracks show chromatin accessibility at the Klrg1 locus of male splenic Treg cells (green) and Treg cells from female (red) and male (blue) VAT. Arrows indicate regions of differential chromatin accessibility. Statistical methods and software packages described in methods.
Treg cell extrinsic sex-hormonal function
Sex hormones are central to multiple developmental processes and are enriched in adipose tissue22. To test whether VAT Treg cells were regulated by sex hormones, we analysed mice that were deficient for either androgen or estrogen receptors. VAT Treg cells from male mice lacking the androgen receptor (Ar−/− were significantly reduced compared to their wildtype counterparts and displayed a phenotype similar to female wildtype VAT Treg cells, including diminished ST2, KLRG1 and CCR2 expression (Fig. 3a–c, Extended Data Fig. 3a). In contrast, female but not male mice lacking the estrogen receptor (Era−/−) showed a significant increase in VAT-Treg cells that displayed the phenotype of male VAT Treg cells with elevated expression of ST2, KLRG1 and CCR2 (Fig. 3d–f, Extended Data Fig. 3b, c). This phenotype was recapitulated when we treated female wildtype mice with ICI, an estrogen receptor antagonist (Extended Data Fig. 3d, e). Consistent with an important role of sex hormones in VAT physiology, male Ar−/− mice had reduced VAT mass and improved glucose tolerance, while female Era−/− mice showed the opposite phenotype (Extended Data Fig. 3f–i). Both Ar−/− and Era−/− mice compared to controls showed modestly increased fasting plasma insulin (Extended Data Fig. 3j, k).
Figure 3. Sex differences in VAT Treg cells are linked to sex hormones.

a, Foxp3 and ST2 expression in VAT CD4+ T cells from male wildtype (WT) and androgen receptor-deficient (Ar−/−) mice. WT (n=6), Ar−/− (n=7). b, Foxp3+ cells within CD4+ T cells in VAT (n=6 WT, n=7 Ar−/−), spleen, and small intestine lamina propria (SI-LP) of WT and Ar−/− mice. WT and Ar−/− (n=3). c, KLRG1 expression in WT and Ar−/− VAT Treg cells. WT (n=6), Ar−/− (n=7). d, Foxp3 and ST2 expression in VAT CD4+ T cells from female WT and estrogen receptor alpha-deficient (Era−/−) mice. WT (n=6), Era−/− (n=7). e, Foxp3+ Treg cells within CD4+ T cells of VAT (n=6 WT, n=7 Era−/−), spleen (n=7 WT, n=5 Era−/−) and SI-LP (n=3, WT and Era−/−) of WT and Era−/− mice. f, KLRG1 expression in female WT and Era−/− VAT Treg cells. WT (n=6), Era−/− (n=7). g, Percentage VAT Treg cells in mock treated (n=7) and estrogen (E-2) treated male WT mice (n=13) (left). In right, mock treated (n=6) and testosterone (T) treated (n=9) female WT mice. h, i, Volcano plot showing genes differentially expressed between male VAT and subcutaneous adipose tissue (SC-AT) (h), or between total male and female VAT (i). Each dot represents a gene; genes in red are up, genes in blue are down-regulated in the respective comparison. j, Proportion of Treg cells in the VAT (n=5), spleen (n=4) and SI-LP (n=3) of male WT and Ccr2−/− mixed bone marrow chimeric mice. k, Quantitative PCR analysis of gene expression in age-matched male WT and Ar−/− and female WT and Era−/− mice. Unpaired t-test performed for b, e, g, j (2-tailed), one way ANOVA for k. Data are mean ± s.d, except (k) mean ± s.e.m. Data pooled or representative of two independent experiments.
Sex hormone receptors are widely expressed, including by cells of the immune system23,24. To test if the functions of hormone receptors are intrinsic to Treg cells, we generated bone marrow chimeric mice by transferring congenically marked male wildtype bone marrow into lethally irradiated male Ar−/− or wildtype recipients (Extended Data Fig. 4a). Remarkably, male wildtype VAT Treg cells that developed in an androgen receptor deficient environment acquired the phenotype typical for female VAT Treg cells, while male wildtype VAT Treg cells that developed in a wildtype environment adopted the male phenotype (Extended Data Fig. 4b, c), indicating that sexual dimorphism of VAT Treg cells is extrinsic. This notion was confirmed when we generated Arfl/flFoxp3Cre mice in which androgen receptor was deleted specifically in Treg cells (Extended Data Fig. 4d, e). Consistent with a Treg cell extrinsic activity of estrogen, estrogen receptor deficient and wildtype Treg cells were represented equally in mixed bone marrow chimeric mice containing congenically marked wildtype and Era−/− hematopoietic cells (Extended Data Fig. 4f). Finally, treatment of male wildtype mice with estrogen resulted in a decrease in Treg cells specifically in the VAT and reduced KLRG1 and ST2 expression, whereas female wildtype mice treated with testosterone showed an increase in these parameters (Fig. 3g, Extended Data Fig. 4g–l). Overall, our data show that a sex hormone dependent niche enforces the VAT Treg cell specific phenotype.
VAT inflammation recruits Treg cells
To examine the nature of the sex-specific Treg cell niche in the VAT, we performed RNAseq of total VAT and subcutaneous adipose tissue from male and female mice. We observed substantial differences between adipose tissue from different depots. Compared with subcutaneous adipose tissue, the VAT was enriched in proinflammatory genes including Ccl2, Tnf and Il1b, but also Il33 (Fig. 3h, Supplementary Information 8). VAT displayed substantial sex-dependent transcriptional differences, with close to 1300 genes differentially expressed between tissues isolated from male and female mice (Fig. 3i, Extended Data Fig. 5a, Supplementary Information 9). In particular, genes that contribute to inflammation (Tnf, Ccl2 and Il1b), tissue fibrosis (Col6a5) and prostaglandin metabolism (Hpgds), were elevated in male compared to female VAT. As male VAT Treg express high levels of CCR2, the high expression of its ligand, CCL2 (MCP-1), in male VAT was of particular interest. To understand the Treg cell intrinsic role of CCR2 in the VAT, we generated mixed bone marrow chimeric mice containing both CCR2-deficient (Ccr2−/− and wildtype hematopoietic cells. In male chimeric mice, we observed a significant reduction of Ccr2−/− VAT Treg cells compared to wildtype cells as well as reduced expression of prototypical VAT Treg cell markers. This defect was restricted to the VAT as spleens or small intestines contained similar proportions of Ccr2−/− and wildtype Treg cells (Fig. 3j; Extended Data Fig. 5b, c). The difference was specific to Treg cells as ILC2 of either genotype were similarly represented in the VAT of chimeric mice (Extended Data Fig. 5d). In contrast, mice deficient in TNF, IL-1b and IFNg showed no substantial loss or altered phenotype of VAT Treg cells (Extended Data Fig. 5e). Notably, a small fraction of Treg cells in the spleens of both male and female mice co-expressed KLRG1 and CCR2, and these cells could be expanded by administration of IL-33 (Extended Data Fig. 5f–h). This suggests that VAT Treg cells were recruited from splenic precursors, a notion consistent with recent work25 and long-term parabiosis experiments, which showed that Treg cells, unlike ILC2, are continuously recruited to the VAT (Extended Data Fig. 5i–k). In line with a critical role for sex-hormones in regulating the abundance of inflammatory mediators in the VAT, expression of Ccl2, Il1b and Il6 was higher in female Era−/− mice compared to wildtype controls (Fig. 3k). Similarly, female mice treated with testosterone showed an increase in the expression of Il6, Ccl2 and Il1b and increased VAT weight, while male mice treated with estrogen showed reduction in these parameters (Extended Data Fig. 6a, b). Finally, treatment of male mice with celecoxib, a pharmacological inhibitor of cyclooxygenase-2 (COX2), reduced the amount of inflammatory mediators such as CCL2 and the abundance of VAT Treg cells in male mice (Extended Data Fig. 6c–e). Taken together these results show that Treg cells have high-jacked the same molecular cues as pro-inflammatory cells to populate the adipose tissue and are recruited to the male VAT in a manner dependent on CCL2 and limited by estrogen.
Sex-hormones control IL-33+ stromal cells
To characterize the tissue niche that imparts the phenotypic and molecular features of VAT Treg cells, we performed RNAseq of adipocytes, endothelial cells (CD31+Gp38−) and stromal cells (CD31−Gp38+) isolated from the VAT of male and female mice (Extended Data Fig. 6f, Supplementary Information 10). We first identified the source of IL-33, which acts as a critical growth factor that facilitates expansion of VAT Treg cells26,27. Consistent with recent reports13,28–30, Il33 expression was largely restricted to Gp38+ stromal cells, which were present in males and females in similar numbers (Extended Data Fig. 6g). However, Gp38+ cells of males and females showed marked differences in their transcriptional profiles, including in males elevated expression of Nt5e, encoding the ecto-nucleotidase CD73, while Cd90, a marker of mesenchymal stromal cells, was downregulated (Extended Data Fig. 6h). Differential expression of CD90 and CD73 segregated four distinct Gp38+ stromal cell populations, of which the two that expressed CD73+ were largely restricted to the male VAT and almost absent from other adipose tissue depots and from females (Fig. 4a, b, Extended data Fig. 6i, j). Analysis of Il33GFP reporter mice revealed that IL-33 production was restricted to Gp38+ stromal cells, including the CD73+ fraction (Fig. 4c, d, Extended data Fig. 7a). Indeed, we detected fewer IL-33 producing stromal cells in female compared to male stromal cells (Extended data Fig. 7b, c). Consistent with the idea that IL-33 is limiting in female mice, administration of IL-33 led to robust expansion of female VAT Treg cells, which proliferated locally in the VAT and upregulated ST2 (Extended data Fig. 7d–h). Further supporting this model, Treg cells sorted from the spleens of transgenic mice expressing a VAT-specific T cell receptor25 and transferred into congenically marked mice, populated the VAT of male mice more efficiently and expressed higher amounts of ST2 compared to Treg cells transferred into female mice (Extended data Fig. 7i). Male Ar−/− mice had significantly reduced, while female Era−/− mice had more CD73+ stromal cells compared to their wildtype counterparts, suggesting that sex hormones regulate the development of CD73+ stromal cells (Fig. 4e, f). Indeed, treatment of female mice with testosterone resulted in the induction of CD73+ stromal cells, while treatment of male mice with estrogen resulted in reduction of these cells (Fig. 4g, h, Extended Data Fig. 8a, b). Administration of IL-33 to Ar−/− mice resulted in pronounced population expansion of VAT Treg cells, suggesting that IL-33 is limiting in these mice (Extended data Fig. 8c). In contrast, treatment of male mice with celecoxib, resulted in an increase in CD73+ stromal cells (Extended data Fig. 8d), indicating that the reduction of VAT Treg cells in celecoxib-treated mice was not linked to the loss of IL-33 producing stromal cells. Together these experiments reveal that sex hormones regulate the development of specific IL-33 producing stromal cell populations and show that IL-33 availability controls the size of the VAT Treg cell niche.
Figure 4. Hormone-dependent stromal cells and Blimp1 underpin VAT Treg cell sexual dimorphism.

a, CD90 and CD73 expression in GP38+ VAT stromal cells from wildtype (WT) female and male mice. b, Percentage of CD73+ cells of CD90+ (left) and CD90− (right) cells. n=12 male and female. c, IL-33/GFP and Gp38 expression in CD45- VAT stromal vascular fraction from male wildtype (WT) and Il33GFP mice. Representative of n=6. d, CD73 and CD90 expression in GP38+IL-33/GFP+ VAT stromal cells from male and female Il33GFP mice. Representative of n=8 of both sexes. e CD73 and CD90 expression within Gp38+ stromal cells from male WT and Ar−/− VAT. f-h, Proportions of CD73+ cells within Gp38+ VAT stromal cells of WT (n=7) and Ar−/− (n=8) males (f, left), WT (n=5) and Era−/− (n=7) females (f, right), testosterone (T) treated female (n=9) and male (n=8) WT mice (g), and estrogen (E-2) treated male (n=11) and female (n=7) mice (h). i Proportions of Treg cells in the VAT (n=7 per genotype) and spleens (n=4 per genotype) of Blimp1fl/flFoxp3Cre and Foxp3Cre mice. j, Expression of Foxp3, ST2 and KLRG1 in VAT CD4+ T cells from Blimp1fl/fl Foxp3Cre and Foxp3Cre control mice. k, ATACseq tracks show chromatin accessibility (male spleen - green; female VAT - red; male VAT - blue) and ChIPseq shows Blimp1 occupancy (black) in the Il1rl1 locus. Arrows indicate differentially accessible and boxes Blimp1-occupied sites. l, Flow cytometry plots show expression of Foxp3 and CD25 in VAT CD4+T cells from WT and Il6−/− mice. m, Proportions of splenic, VAT and small intestine lamina propria (SI-LP) Treg cells among VAT CD4+ T cells of WT and Il6−/− mice (n=4 per genotype). Unpaired t-test performed (2-tailed). Data are mean ± s.d. Data pooled or representative of two independent experiments.
Blimp1 controls VAT Treg cell genes
Finally, to elucidate how the VAT-Treg cell specific transcriptional landscape is shaped in a Treg-cell intrinsic manner, we tested the function of Blimp1, which was increased in male compared to female VAT Treg cells (Extended data Fig. 8e). Male mice lacking Blimp1 specifically in Treg cells, showed reduced VAT Treg cells, which had downregulated ST2, KLRG1, TIGIT and CCR2, and upregulated CD103 and CD62L (Fig. 4i, j, Extended data Fig. 8f). Consistent with a loss of VAT Treg cells, male mice with a Treg-cell specific loss of Blimp1 (Blimp1fl/flFoxp3Cre) showed reduced glucose tolerance (Extended data Fig. 8g). RNAseq revealed >2500 genes deregulated in Blimp1-deficient compared to control VAT Treg cells, including downregulation of VAT Treg signature genes Il1rl1, Klrg1, Ccr2, Pparg and Il10, resulting in a transcriptional profile similar to that of female VAT Treg cells (Extended data Fig. 9a, b, Supplementary Information 11). To identify direct targets of Blimp1, we interrogated our ATACseq and our published Blimp1 chromatin immunoprecipitation (ChIP) sequencing data31. In total we detected 2095 ChIP peaks that overlapped with open chromatin in VAT Treg cells. These sites were associated with Blimp1 target genes such as Ccr7, Tcf7, Klf2, Cxcr5, S1pr1, Myc and Bcl6, and key genes of the VAT Treg cell signature, including Il10, Ccr2 and Il1rl1, suggesting that these genes were direct transcriptional targets of Blimp1 in VAT Treg cells (Extended data Fig. 9c, d, Supplementary Information 12). Blimp1 binding sites were detected in multiple loci with differential accessibility in splenic Treg cells and male and female VAT Treg cells, respectively. This included sites in Il1rl1, which showed full accessibility in male but reduced accessibility in female VAT Treg cells and was fully closed in splenic Treg cells (Fig. 4k). Notably, CCR2+KLRG1+ splenic Treg cells also expressed Blimp1 and Pparg, and loss of Blimp1 resulted in a loss of CCR2 expression and an overall reduction of KLRG1+ Treg cells (Extended Data Fig. 10a–e). IL-6 and IL-4, both abundant in the VAT, potently induced Blimp1 in Treg cells in vitro, while IL-33 did not (Extended Data Fig. 10f). Il6 was mainly expressed by VAT dendritic cells, macrophages and ILC2 (Extended Data Fig. 10g). Consistent with an important role for IL-6 in VAT physiology, CD73+ stromal cells, Treg cells and ILC2 were reduced in the VAT of male IL-6-deficient mice, and VAT Treg cells showed impaired expression of ST2, KLRG1 and CCR2 (Extended Data Fig. 10h–j, Fig. 4l, m). Administration of IL-33 to IL-6-deficient mice resulted in pronounced population expansion of VAT Treg cells, suggesting that IL-6 per se is not essential for the differentiation of VAT Treg cells but promotes the availability of IL-33 (Extended Data Fig. 10k).
The VAT constitutes an inflammatory environment and low-grade inflammation, which increases in obesity and contributes to the development of metabolic disease and type 2 diabetes. Our data show that in females, inflammation is limited by estrogen. In males, however, heightened VAT inflammation and male-specific IL-33-producing stromal cells mediate the active recruitment and local expansion of Treg cell numbers in a Blimp1-dependent manner (Extended Data Fig. 10l).
Methods
Mice.
Era−/− (Jax stock # 026176), Ar−/− 32, Erafl/fl 33, Ccr2−/− (Jax stock # 004999), Blimp1fl/fl 34, Blimp1GFP 35, Il33GFP (Jax stock # 002650), Il6−/− (Jax stock # 002650), Tnf−/− (Jax stock # 003008), Il1b−/− 36, Rag1−/− (Jax stock # 002216) and C57BL/6 Ly5.1 mice were bred at the The Walter and Eliza Hall Institute animal facility. Foxp3Cre (Jax stock # 016961), Foxp3RFP (Jax stock # 008374) and IL10GFP (Jax stock # 014530) mice were purchased from the Jackson laboratory. All mouse lines were maintained on a C57BL/6J (Ly5.2) background, except Il33−/−, which is on a C57BL/6N background. Mice were analyzed at 25-30 weeks of age unless specified. Mice were maintained and used in accordance with the guidelines of the WEHI Animal Ethics Committee.
Bone marrow chimeras.
Bone marrow chimeric mice were generated by lethally irradiating recipient mice with 2 x 550 R and reconstituting them with 1 x 10⁷ congenically marked bone marrow cells. Ccr2−/− / Ly5.1 mixed chimeric mice were made in Rag1−/− recipients irradiated 2 x 350R.
Antibodies and flow cytometry.
Fluorochrome-conjugated antibodies directed against the following mouse antigens were used for analysis by flow cytometry. Antibodies, clone names and manufactures: Invitrogen/eBioscience – KLRG1 (2F1) FITC, BV711; Thy1.2 (30-H12) FITC; γδTCR (ebioGL3) FITC; CD25 (PC61.5) PEcy7; Gp38 (eBio8.1.1) PEcy7; KLRG1 (2F1) PEcy7; ST2 (RMST2-2) APC; Tigit (GIGD7) eFluor660; GITR APC; CD25 (PC61.5) APC; TCRβ (H57-597) PerCP Cy5.5; Foxp3 (FJK-16s) eFluor450; Ly5.2 (104) eFluor450; Gata3 (TWAJ) PE; CD103 (2E7) PE, EOMES (Dan11mag) PerCPeFluor710. BD – Ly5.2 (104) FITC; CD4 (GK1.5) BUV496; CD19 (1D3) BUV737; CD8a (53-6.7) BUV737; CD45.2 (104) BUV395; CD11b (M1/70) BUV737; KLRG1 (2F1) BV711. BioLegend – CD45.1 (A20) FITC; F4/80 (BM8) FITC; CD45.2 (104) BV605; CD4 (GK1.5) APC/cy7; CD11c (N418) BV711; CD69 (H1.2F3) BV711; F4/80 (BM8) BV605; CD140a (APA5) APC; CD31 (PacBlue); CD73 (TY/11.8) PE. R&D systems – mCCR2 A700. WEHI – NK1.1 (PK136) Alexa594. For surface staining, antibodies were diluted at 1:200 and incubated with cells in PBS with 2% BSA on ice or 4 degrees for 30 mins. Cell pellet was re-suspended in live dead stain containing PBS with 2% BSA. For intranuclear staining Foxp3 staining kit was used from Invitrogen.
Preparation of lymphocytes from adipose tissue.
Unless indicated otherwise, perigonadal VAT was collected from 30 to 35-week-old male or female mice, finely minced and suspended in 0.025% collagenase Type IV (Gibco) (2 ml collagenase per gram fat). The suspension was incubated for 45 min at 37 °C in a shaker. After incubation the suspension was 10 times diluted with PBS + 2% FCS and spun at 800 x g for 15 min at 4 °C. The upper adipocyte fraction was discarded and the stromal vascular fraction that has settled down was further purified to obtain lymphocytes by Histopaque (Sigma) gradient.
Isolation of intestinal lamina propria lymphocytes (LPL).
LPLs were extracted from the small intestine. In brief, Peyer’s patches removed and intestines were opened longitudinally and cut into small pieces (<5 mm). Epithelial cells and intraepithelial lymphocytes (IEL) were removed by washing with HBSS and incubating with 5 mM EDTA for 30 min at 37 °C. The intestinal pieces were washed with RPMI and 10% FCS, and LPLs were isolated by digestion with 1 μg/ml DNase (Sigma-Aldrich) and 200 μg/ml Collagenase III (Worthington) for 40 min at 37 °C. The LPL fractions were purified by 40-80% Percoll (GE Healthcare) gradient.
Parabiosis experiments.
Surgery was done as described. Briefly, each mouse was anaesthetized with ketamine and xylazine 10 μg/g. Skin was shaved and disinfected by wiping with alcohol prep pads and betadine three times. Matching incisions were made from the olecranon to the knee joint of each mouse and subcutaneous fascia bluntly dissected to create 0.5 cm of free skin. The olecranon and knee joints were attached by a 5-0 silk suture, and dorsal and ventral skin attached by continuous staples or sutures. Betadine was used to cover the entire incision following surgery.
Treg cell cultures.
Treg cells were purified from Foxp3RFP mice using FACS sorting. Sorted Treg cells were cultured in 96 well flat bottom plate with a density of 100,000 cells/well in 250 μL media. Plates were pre-coated with anti-CD3 (2C11) (5 μg/mL) and Treg cells cultured in complete IMDM media with IL-2 (100 U) and soluble anti-CD28 (2 μg/mL) along with other cytokines mentioned.
Adoptive transfer of Treg cells.
5x10⁶ CD4+ T cells purified from pooled spleen and lymph nodes of 6 to 8-week-old male or female CD45.2+ vTreg53 TCR Tg+ littermates, using the Dynabeads Untouched Mouse CD4 Cells Kit (Thermo Fisher Scientific), were injected i.v. into sex-matched 6-8wk-old B6.CD45.1+ mice. Engraftment and enrichment of donor-derived cells in the spleen, epididymal VAT, ovarian VAT, or inguinal SAT of recipient mice were analyzed at 12 weeks after transfer.
Glucose-tolerance tests.
1.75 g per kilogram of body weight (g/kg) glucose was injected intraperitoneally to mice fasted for 8 h. Blood samples were obtained from the tail tip at the indicated times, and blood glucose concentrations were measured using a handheld glucometer (Accu-Chek Performa, Roche).
Metabolic cages.
Mice were metabolically screened (oxygen consumption, energy expenditure, RER, food intake, activity) by placing them in a 12-chamber Promethion system (Sable Systems, Las Vegas, NV, USA) for 48 hrs. The first 24 hrs acted as a familiarization period and the second 24 hrs was analysed using the CalR software tool.
Intracellular IL-33 staining.
intracellular IL-33 was detected by fixation and permeabilization using True-Nuclear Transcription Factor Buffer Set (BioLegend) as per the manufacturer’s instructions followed by incubation with a goat anti-IL-33 polyclonal primary Ab (#AF326, R&D Systems) and a donkey anti-goat Cy3 secondary Ab (#705-166-147, Jackson Immunoresearch Laboratories).
Celecoxib treatment.
7-week-old male C57BL/6 were fed with celecoxib containing diet 29 mg/kg/day for 15 weeks.
Hormone treatment.
0.25 mg 60-day release 17-β estradiol pellets (SE-121, Innovation research of America) were surgically implanted subcutaneously in 7-8-week old male and female C57BL/6 mice. For testosterone treatment, 4 mg Testosterone (Sigma Aldrich, T1500) powder was packed in 1cm silastic tubing and surgically implanted subcutaneously in 7-8-week-old male and female C57BL/6 mice. Mice were analysed 6 weeks post implantation.
Serum adipokine and Insulin measurement.
Bio-Plex Pro mouse diabetes immunoassay kit (Bio Rad, 171F7001M) was used to measure fasting serum concentrations of adipokines according to manufacturer’s protocol. Adiponectin was measured by a separate kit from Bio Rad (Bio-Plex Pro mouse diabetes Adiponectin assay kit, 171F7001M).
ICI treatment.
For the estrogen receptor antagonist experiments, adult C57BL/6 mice were ovariectomized and then either not treated any further or treated with 5 mg of ICI 182-780 (IP injections one/week for 6 weeks. At the end of the experiment mice were collected and uterine weight used to confirm that ICI 182-780 treatment was successful.
Cytokine treatment.
0.5 μg/head IL-33 (R&D systems) was administered intra-peritoneally for 3 alternate days and mice were analyzed on day 7. In other experiments, 8-week-old C57BL/6 mice were treated with recombinant human (r)IL-6 (10 μg/head, 4 times with 2-day interval). PBS was used as control.
High-fat diet.
Male C57BL/6 mice were fed a high-fat diet in which 59% of the total energy is derived from lipids (59 kcal% fat, Specialty Feeds, SF03-002) for 40 weeks.
Echo MRI and Indirect Calorimetry.
Body composition (fat and lean mass) was measured with a 4-in-1 EchoMRI™ body composition analyser (EchoMRI, Houstan, TX, USA), and whole body oxygen consumption measured with a Comprehensive Laboratory Animal Monitoring System (Columbus Instruments, Columbus, Ohio, USA) as previous described37.
RNA extraction.
RNA was extracted from VAT using Qiagen RNeasy lipid tissue mini kit as per manufacturers protocol. RNA from Treg cells and stromal cells were isolated using Qiagen RNeasy plus micro kit as per manufacturers protocol. VAT was pooled from 3 mice per sample. VAT Treg cells and stromal cells were sorted from pooled VAT from 5 or more mice. Stromal cells were flow cytometry sorted as Gp38+ or Gp38− from CD45-Ter119-population. Adipocytes were purified after removal of stromal vascular fraction.
RNA-sequencing and analysis.
RNA purification was performed following the manufacturer’s protocol using the RNAeasy Plus Mini Kit (Qiagen). In each biological condition two samples were generated from a male and female mouse respectively. All samples were sequenced on an Illumina NextSeq 500 generating 75 bp paired end reads. Reads were aligned to the mouse reference genome GRCm38/mm10 using the Subread aligner (version 1.6.2)38. Mapped reads were assigned to NCBI RefSeq mouse genes and genewise counts were produced by using featureCounts39. Genes that failed to achieve a CPM (counts per million mapped reads) value of 0.5 in at least 2 libraries were excluded from downstream analysis. Read counts were converted to log2-CPM, quantile normalized and precision weighted with the voom function of the limma package40,41. A linear model was fitted to each gene, and empirical Bayes moderated t-statistics were used to assess differences in expression42. Genes were called differentially expressed if they achieved a false discovery rate (FDR) less than 0.1 and a fold change greater than 1.2.
ATAC-sequencing and analysis.
ATACseq was performed based as described43. Briefly, 3550.000 Treg cells cells were resuspended in 50 μ! of chilled ATAC lysis buffer (10 mM TrisHCL, 10 mM NaCl, 3 mM MgCh, 0.1% (v/v) Igepal CA-630) and centrifuged for 10 minutes at 500xg at 4°C. Nuclei of an equivalent of 25.000 cells were resuspended in 25 μl of Tagmentation buffer (2x Tagment DNA buffer, 20x Tagment DNA enzyme (Nexterea library preparation kit) and incubated 37°C for 30 minutes. Next, Tagmented DNA was isolated using the MinElute PCR purification kit (Qiagen). Samples were PCR-amplified with a common forward primer and unique barcoding reverse primers before tagmentation efficiency and concentration was assessed with a bioanalyzer high sensitivity DNA analysis kit (Agilent). Pooled libraries were cleaned from small (<150 bp) fragments and sequenced on a NextSeq 500 sequencer (Illumina) producing paired-end 75 bp reads. Sequence reads were mapped to mouse genome GRCm38/mm10 using Subread. Only uniquely mapped reads were retained. ATAC peaks were called using Homer (version 4.9) with a FDR cut-off of 1e-5. Overlapping peaks from different samples were merged into a single peak region that covers all the overlapping peaks. Mapped reads were assigned to all the merged regions for each sample using featureCounts. Regions were removed from analysis if they failed to achieve a CPM value of 0.7 or higher in at least one sample. Regions were annotated by assigning them to the nearest gene. Read counts for regions were converted to log2-CPM and precision weighted with the limma voom function. A linear model was fitted to each region, and empirical Bayes moderated t-statistics were used to assess differences in chromatin accessibility. A FDR cutoff of 0.2 was applied for calling differentially accessed regions.
ChIPseq analysis.
Blimp1 ChIP-seq reads were mapped to the mouse reference genome GRCm38/mm10 using the Subread aligner. Blimp1 binding peaks were called using Homer (version 4.9) with a FDR cutoff of le-4. Peaks were assigned to their nearest gene. Overlapping peaks between ChIPseq data and ATACseq data were identified as those that have at least lbp overlap.
Statistics.
If not stated otherwise t-test was performed to test for statistical significance; error bars denote mean ± s. d. unless specified otherwise.
Extended Data
Extended data Figure 1. Multiple physiological and cellular parameters differ between male and female mice.
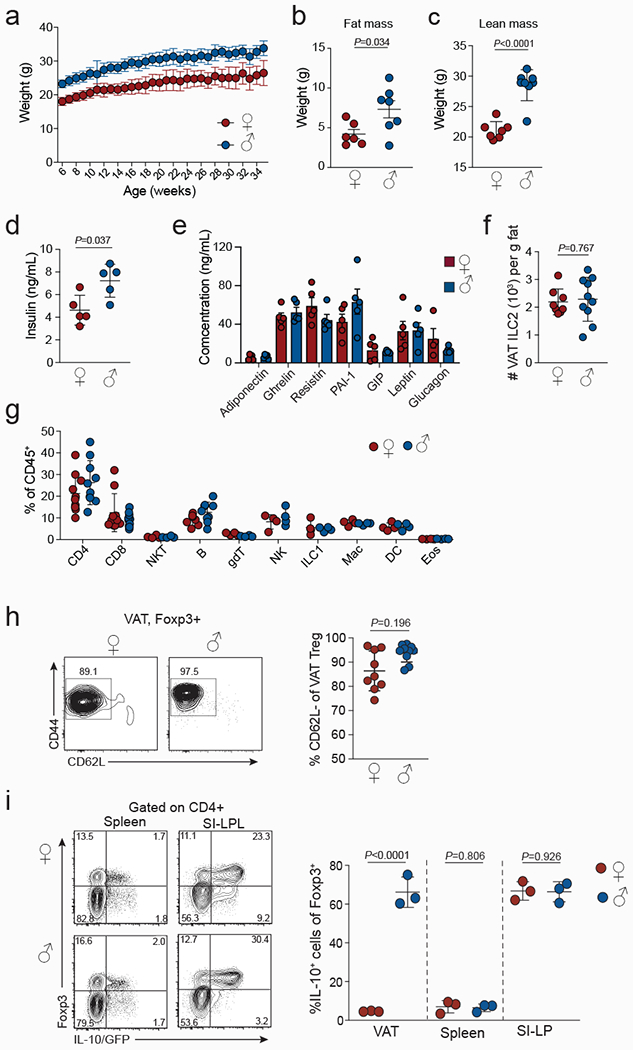
a, Weight gain of normal chow diet fed wildtype (WT) male and female mice with age (n=6, females and males). b-e, Multiple physiological parameters measured in age matched WT male and female mice, including fat mass (n=7, females and males) (b), lean mass (n=7, females and males) (c), serum insulin levels (n=5, females and males) (d), and serum adipokine levels 6 h post fasting (n=5, females and males) (e). f, Numbers of ILC2 in male and female VAT from 12-15-week-old mice. (n=8) females, (n=10) males. g, Proportions of different VAT resident immune cells determined from male and female mice (n=4-9). h, Expression of CD44 and CD62L in VAT Treg cells from male and female WT mice. Graph on the right shows quantification (n=9, females and males). i, Flow cytometry plots (left) showing Foxp3RFP and Il10GFP expression in spleens and small intestine lamina propria (SI-LP) and quantification (right) of IL-10/GFP+ Treg cells in VAT, spleen and SI-LP resident CD4+ T cells of female and male Foxp3RFPIl10GFP double reporter mice (n=3, females and males). Unpaired t-test was performed (2-tailed). Data are mean ± s.d. Data pooled or representative of 2 independent experiments.
Extended data Figure 2. VAT specific sexual-dimorphism in Treg cells is underpinned by unique transcriptional signatures and chromatin accessibility.
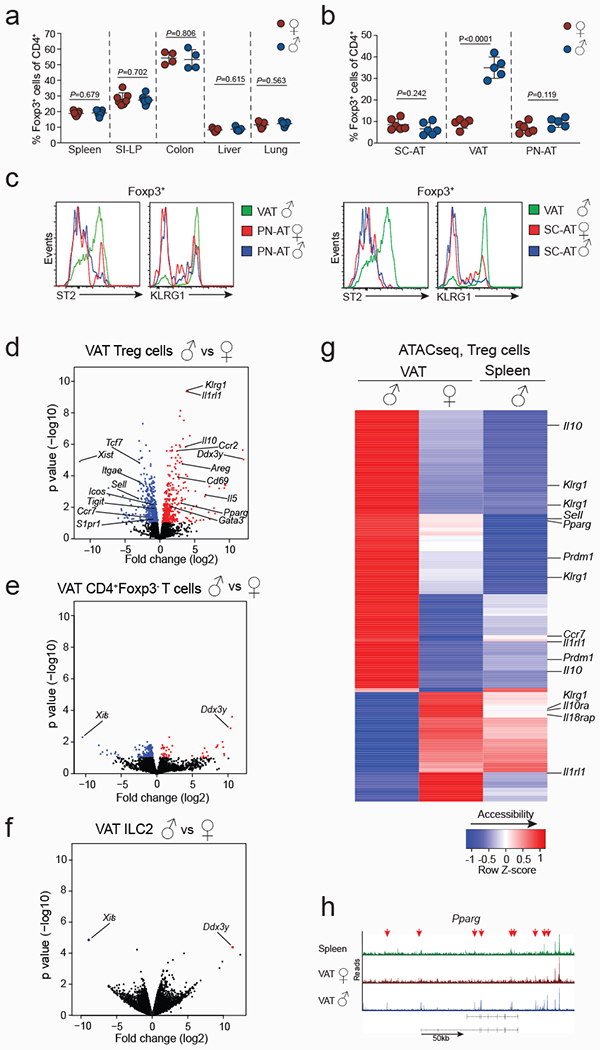
a, Percentages of Foxp3+ cells in spleens (n=6, females and males), small intestine lamina propria (SI-LP) (n=7, females and males), colons (n=4, females and males), livers and lungs (n=5 females and males) from 25 to 30-week-old wildtype (WT) mice. b, Percentages of Foxp3+ cells in subcutaneous adipose tissue (SC-AT) (n=6 females and males), VAT (n=5, females and males) and perinephric adipose tissue (PN-AT) (n=6 females and males) from 25 to 30-week-old WT mice. c, Expression of ST2 and KLRG1 in Treg cells from the PN-AT (left) and SC-AT (right) of WT male and female mice. Treg cells from male VAT are shown in green as positive control. d-f, Volcano plots show genes differentially expressed between male and female VAT Treg cells (d), VAT CD4+Foxp3− T cells (e), and VAT-ILC2s (f). Each dot represents a gene. Differentially expressed genes are marked in blue (downregulated) or red (upregulated). g, Heatmap shows chromatin accessibility of VAT Treg signature genes assessed by ATACseq. Data displayed from male VAT Treg cells, female VAT Treg cells, male splenic Treg cells. h, ATACseq tracks show chromatin accessibility at the Pparg locus of male splenic Treg cells (green) and Treg cells from female (red) and male (blue) VAT. Arrows indicate regions of differential chromatin accessibility. Data in (a, b) pooled or representative of two independent experiments, and unpaired t-test (2-tailed) performed. Data are mean ± s.d, Sequencing experiments performed in duplicates. For each RNAseq sample, VAT Tregs were sorted from male (n=5) and female (n=12) Foxp3RFP mice. For ATACseq, each sample contained Treg cells from n=4 males and n=10 females. Experiments were performed with 25 to 32-week-old mice. Statistical methods and software packages for sequencing data described in methods.
Extended data Figure 3. Opposing functions of male and female sex-hormones in regulating VAT inflammation, Treg cell recruitment and glucose tolerance.
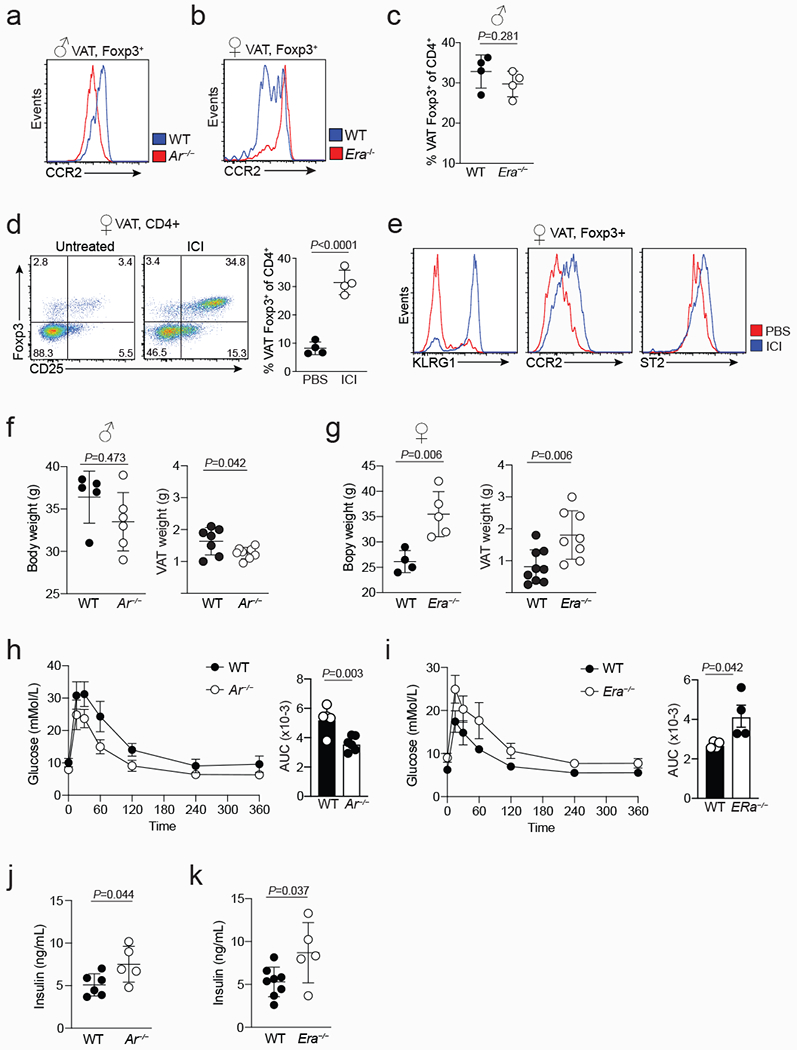
a, Representative flow cytometry histograms showing expression of CCR2 in wildtype (WT) and Ar−/− VAT Treg cells (a), and WT and Era−/− VAT Treg cells (b). c, Frequency of VAT Treg cells in male WT and Era−/− mice (n=4 of each genotype). d, Flow cytometry plots (left) show VAT Treg cells from control and ICI treated female mice, and graph (right) shows quantification (n=4 for both conditions). e, Expression of indicated markers in control and ICI treated female VAT Treg cells. f, Body mass (left) (n=5 WT; n=6 Ar−/−) and VAT mass (right) (n=7 WT; n=8 Ar−/−) from 20 to 25-week-old male WT and Ar−/− mice. g, Body mass (left) (n=4 WT; n=5 Era−/−) and VAT mass (right) (n=9 WT; n=8 Era−/−) from 20 to 25-week-old female WT and Era−/− mice. h, i, Oral glucose tolerance test (left) and area under the curve (right) comparing age-matched male WT and Ar−/− mice (n=4 WT; n=5 Ar−/−) (h), or female WT and Era−/− mice (n=4, WT and Era−/−) (i). j, k, Fasting serum insulin levels in WT (n=6) and Ar−/− (n=5) male mice (j), and in WT (n=8) and Era−/− (n=5) female mice (k). Unpaired ttest (2-tailed) performed. Data are mean ± s.d. Data pooled or representative of two independent experiments.
Extended data Figure 4. VAT Treg cell extrinsic function of sex-hormones.
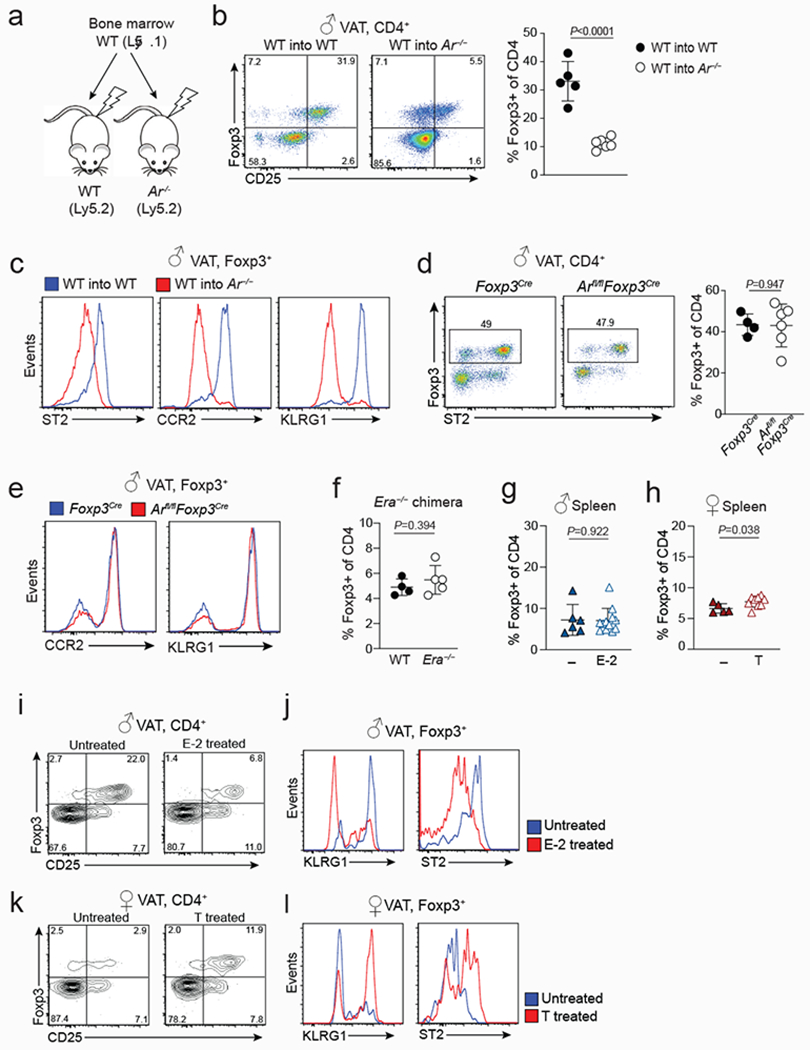
a, Schematic shows the strategy used to make bone marrow chimeric mice using wildtype (WT) and Ar−/− recipients. b, Proportions of Treg cells from the VAT of irradiated WT (n=5) and Ar−/− (n=6) mice that received WT bone marrow. Quantification on the right. c, Expression of indicated cell surface markers on VAT Treg cells from WT and Ar−/− mice that were reconstituted with WT bone marrow (from b). d, Flow cytometry plots (left) show expression of Foxp3 and ST2 in VAT CD4+ T cells from male Arfl/flFoxp3Cre (n=6) and Foxp3Cre (n=4) control mice. Quantification on the right. e, Expression of CCR2 and KLRG1 in VAT Treg cells from Arfl/flFoxp3Cre and control mice (from d). f, Percentages of WT and Era−/− Treg cells in the VAT of female bone marrow chimeric mice. Irradiated WT female Ly5.1 recipient mice were reconstituted with either female Ly5.2 WT (n=4) or female Era−/− (n=5) bone marrow cells. g, h, Percentages of splenic Treg cells in estrogen treated (n=12) and untreated (n=6) male WT mice (g) and in testosterone treated (n=9) and untreated (n=5) female WT mice (h). i, Expression of Foxp3 and CD25 in VAT CD4+ T cells isolated from estrogen treated or untreated male WT mice. j, Flow cytometry histograms show expression of KLRG1 and ST2 in VAT Treg cells from estrogen (E-2) treated or untreated male WT mice. k, Expression of Foxp3 and CD25 in VAT CD4+ T cells isolated from testosterone treated or untreated female WT mice. l, Expression of KLRG1 and ST2 in VAT Treg cells from testosterone treated or untreated female WT mice. Unpaired t-test (2-tailed) performed. Data are mean ± s.d. Data pooled or representative of two independent experiments.
Extended data Figure 5. Sex-specific VAT inflammation, Treg cell recruitment and maintenance in VAT.
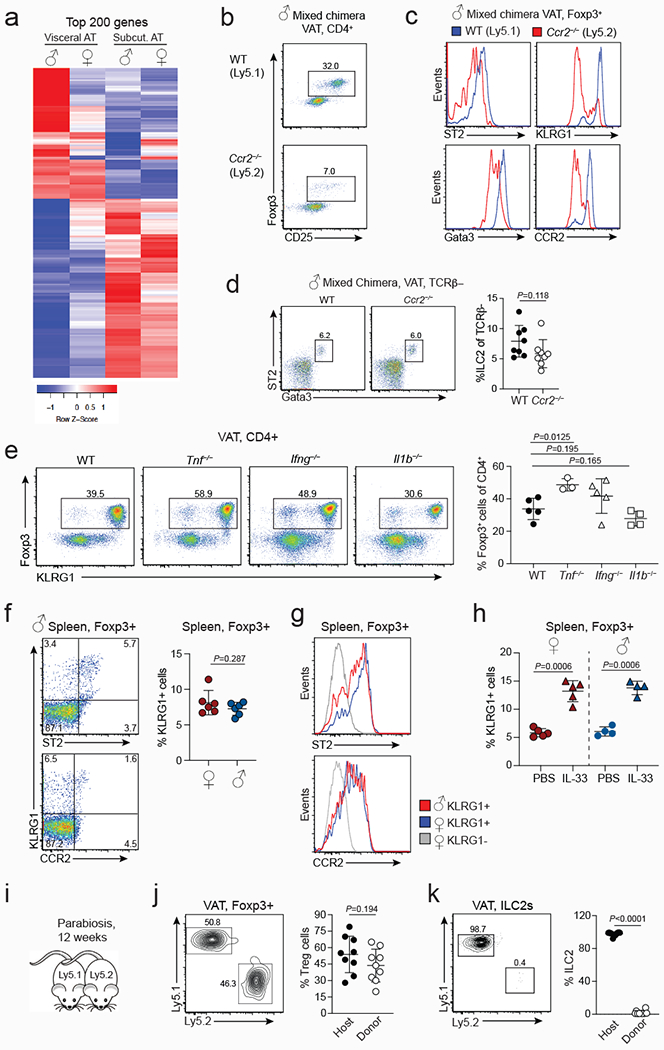
a, Heatmap shows top 200 differentially expressed genes between male and female VAT and subcutaneous adipose tissue (SC-AT). Duplicate samples used for RNA sequencing. For each sample, VAT or SC-AT from three mice were pooled for RNA extraction. b, Proportions of Treg cells in wildtype (WT) and Ccr2−/− compartments of mixed bone marrow chimeric mice. c, Expression of specified markers in WT and Ccr2−/− VAT Treg cells from male mixed bone marrow chimeric mice. d, Flow cytometry plots (left) and quantification (right) of WT and CCR2-deficient ILC2s in the VAT of male chimeric mice containing congenically marked WT (n=8) and Ccr2−/− (n=8) hematopoietic cells. e, Expression of Foxp3 and KLRG1 in WT (n=5), Tnf−/− (n=3), Ifng−/− (n=5) and Il1b−/− (n=4) mice. Graph on the right shows quantification. f, Expression of KLRG1 and ST2 (top) and KLRG1 and CCR2 (bottom) in splenic Treg cells from WT male mice. Graph (right) shows percentages of KLRG1+ cells of Treg cells in the spleen of WT male (n=6) and female (n=6) mice. g, ST2 and CCR2 expression in male and female KLRG1+ splenic Treg cells. h, Graph shows percentages of KLRG1+ cells of Treg cells in the spleens of female (n=5) and male (n=4) mice treated with PBS or IL-33. i, Schematic of parabiosis experiment. j, k, Flow cytometry plots (left) and quantification (right) show proportions of Treg cells (n=9) (j) and ILC2 (n=9) (k) in the VAT of parabiotic WT female mice that were paired for 12 weeks. Unpaired t-test (2-tailed) performed. Data are mean ± s.d. Data pooled or representative of two independent experiments.
Extended data Figure 6. Sex-hormonal control of VAT inflammation and stromal cell differentiation.
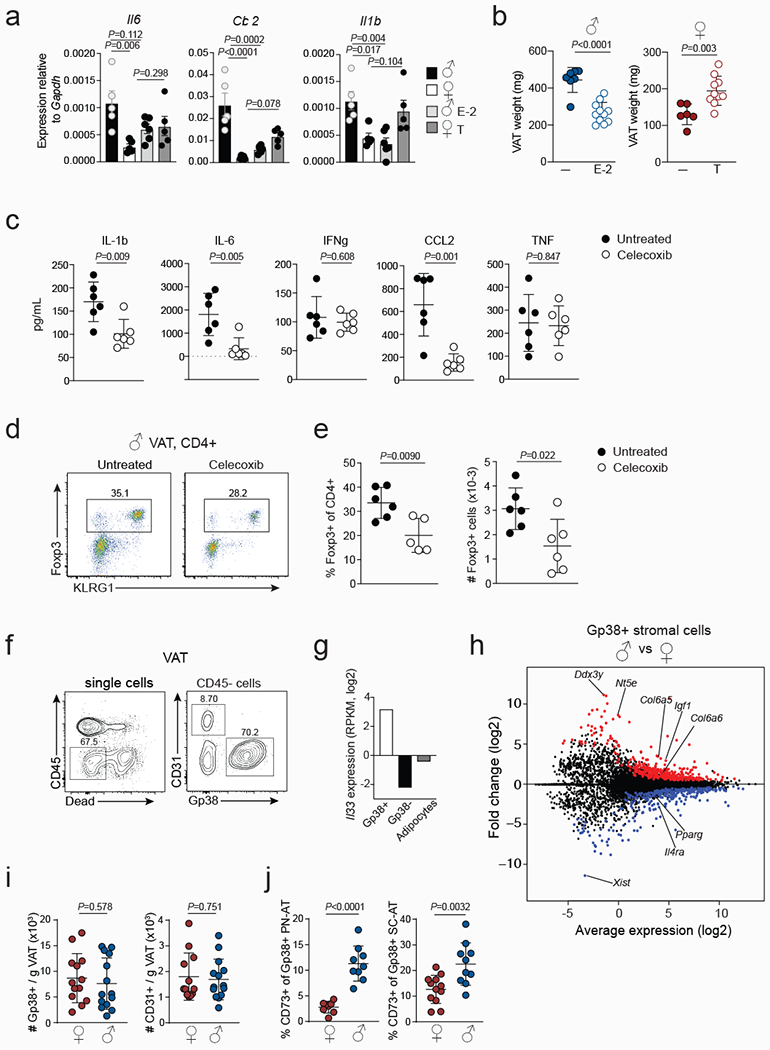
a, Expression of indicated genes in the VAT of Testosterone (T) or estrogen (E-2) treated male and female wildtype (WT) mice measured by quantitative PCR. Untreated females and males, T treated females (n=5); E-2 treated males (n=6). b, VAT weight from untreated (n=7) and E-2 (n=11) treated WT male (left) and untreated (n=6) and T treated (n=10) WT female (right) mice. c, Concentrations of indicated proinflammatory cytokines in the mesenteric lymph nodes of Celecoxib (n=6) or untreated (n=6) WT male mice measured by cytokine bead array. d, Expression of Foxp3 and KLRG1 in CD4+ T cells isolated from the VAT of Celecoxib treated and untreated male WT mice. e, Percentages (left) and numbers (right) of Foxp3+ Treg cells in the VAT of Celecoxib treated (n=6) and untreated (n=6) WT male mice. f, Gating strategy used to identify VAT CD31+ endothelial cells and Gp38+ stromal cells in the CD45-non-hematopoietic cell compartment of WT male and female mice. g, Il33 transcript levels in Gp38+ stromal and Gp38-CD31+ endothelial cells and in adipocyte from 25-week-old male mice (data from RNAseq analysis, two samples per cell type). h, MA plot showing genes differentially expressed between male and female GP38+ VAT stromal cells. RNA sequencing performed in duplicate samples. For each sample, the respective VAT stromal cell population was sorted from WT male (n=5) and female (WT=7) mice. i, Numbers of Gp38+ cells in female (n=13) and male (n=14) VAT (left) and CD31+ cells (right) in female (n=11) and male (n=14) VAT from 25-week-old mice. d, Proportions of CD73+ cells within the female (n=8) and male (n=9) Gp38+ stromal compartment of peri-nephric adipose tissue (PN-AT, left) and subcutaneous adipose tissue (SC-AT) (right) (n=12 females; n=10 males). For (a) One-way ANOVA was performed. Other data were analysed using unpaired t-test (2-tailed). Data are mean ± s.d. except (a) ± s.e.m. Data pooled or representative of two independent experiments.
Extended data Figure 7. Sex-specific distribution of IL-33+ VAT stromal cells and VAT Treg cell response to IL-33 administration.
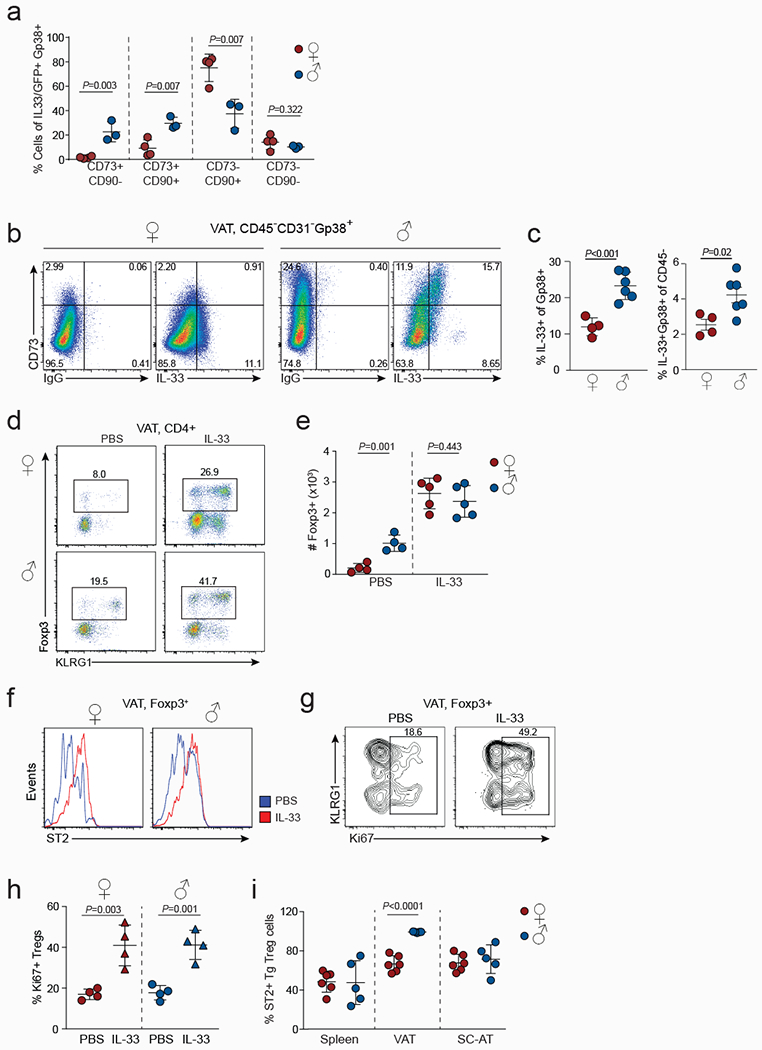
a, Percentages of IL-33+ cells within each VAT Gp38+ stromal cell compartment of female (n=4) and male (n=3) wildtype (WT) mice. b, IL-33 expression in CD45-CD31-Gp38+ stromal cells as measured by intracellular staining. IgG was used as a control. c, Percentages of IL-33+ cells within the VAT Gp38+ stromal cell compartment of WT female (n=4) and male (n=6) mice (left) and percentages of IL-33+Gp38+ of live cells in VAT (right). d-h, IL-33 (n=5) or PBS (mock) (n=4) was administered to 12-week-old male and female WT mice. Expression of Foxp3 and KLRG1 in VAT CD4+ T cells (d), numbers of VAT Treg cells (e), ST2 expression in VAT Treg cells from IL-33 or PBS treated (f), expression of KLRG1 and Ki67 in VAT Treg cells of male mice (g), and quantification of Ki67+ VAT Treg cells in female (n=4) and male (n=4) WT mice (h). i, Treg cells were sorted from the spleens of transgenic mice expressing a VAT-specific T cell receptor25 and transferred into congenically marked female (n=6) or male (n=5) mice. Percentages of ST2+ TCR transgenic (Tg) Treg cells within the adipose tissue 12 weeks after adoptive transfer. Unpaired t-test (2-tailed) was performed. Data are mean ± s.d. Data pooled or representative of two independent experiments.
Extended data Figure 8. Sex-hormonal regulation of CD73+ VAT stromal cell differentiation and Blimp1 regulation of VAT Treg cells and organismal metabolism.
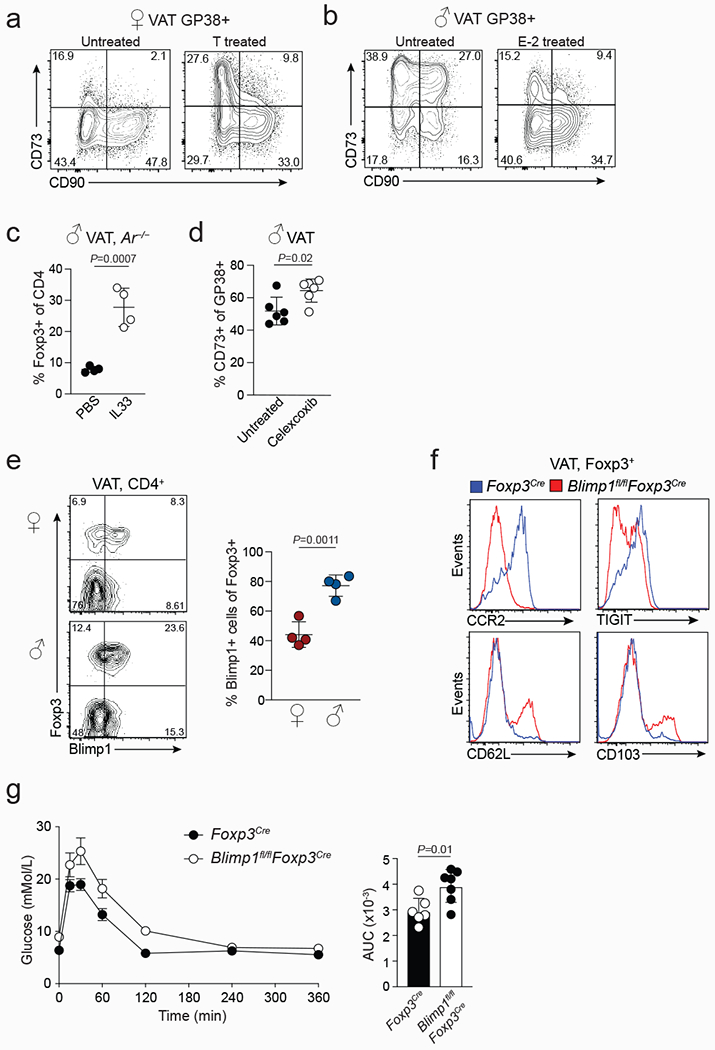
a, Flow cytometry plots from testosterone (T) treated and untreated female wildtype (WT) mice showing expression of CD73 and CD90 in Gp38+ VAT stromal cells. b, Flow cytometry plots from estrogen (E-2) treated and untreated male WT mice showing expression of CD73 and CD90 in Gp38+ VAT stromal cells. c, Percentages of VAT Treg cells in male Ar−/− mice treated with PBS (n=4) or IL-33 (n=4). d, Percentages of CD73+ stromal cells in Celecoxib treated (n=6) or untreated (n=5) male mice. e, Expression of Foxp3/RFP and Blimp1/GFP in male (n=4) and female (n=4) VAT Treg cells from Foxp3RFPBlimp1GFP double reporter mice. Percentages of Blimp1/GFP+ cells of Foxp3+ Treg cells. f, Expression of indicated molecules in Foxp3Cre and Blimp1fl/flFoxp3Cre VAT Treg cells. g, Oral glucose tolerance test in normal diet fed 25-week-old male Blimp1fl/flFoxp3Cre (n=7) and Foxp3Cre (n=6) mice. Graph on the right shows area under the curve (AUC).Unpaired t-test (2-tailed) was performed. Data are mean ± s.d. Data pooled or representative of two independent experiments.
Extended data Figure 9. Blimp1 establishes the VAT Treg cell transcriptional and chromatin landscapes.
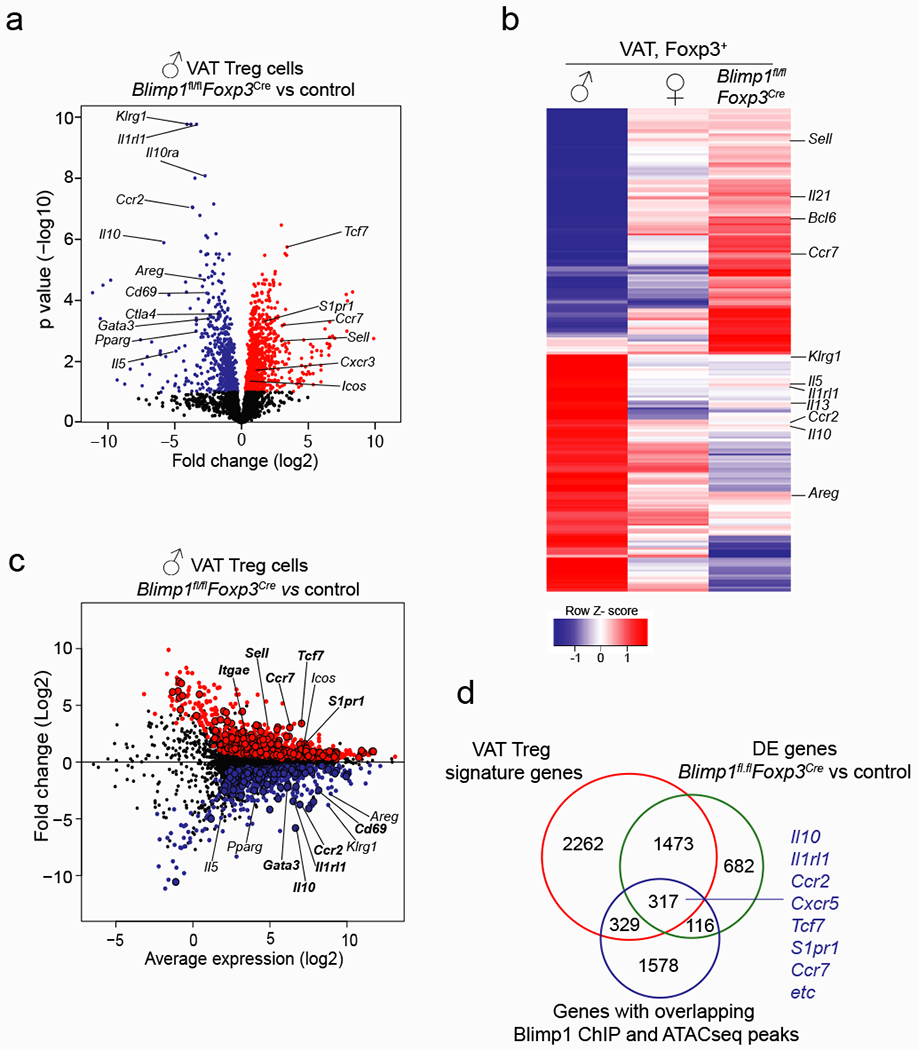
a, Volcano plot shows genes differentially expressed between male Blimp1fl/flFoxp3Cre and control VAT Treg cells. For each genotype duplicate samples were used for RNA sequencing. Each sample contains VAT Treg cells from n=7 Blimp1fl/flFoxp3Cre and n=5 Foxp3Cre mice. b, Heatmap shows top 200 genes differentially expressed between WT male and female VAT Treg cells and Blimp1fl/flFoxp3Cre male VAT Treg cells. c, MD plot shows expression of genes in Blimp1fl/flFoxp3Cre and Foxp3Cre VAT Treg cells. Each dot represents a gene; genes highlighted in red are up and blue are down-regulated in Blimp1fl/flFoxp3Cre VAT Treg cells. Larger dots with black outline indicate genes that are also bound by Blimp1 in regions of open chromatin in VAT Treg cells. d, Venn diagram shows overlap between genes differentially expressed between male VAT Treg cells and male splenic Treg cells (VAT Treg cell signature), male Blimp1fl/flFoxp3Cre and control VAT Treg cells and genes that show Blimp1 ChIP binding in regions of open chromatin (peaks) of male VAT Treg cells. Statistical methods and software packages described in methods.
Extended data Figure 10. Blimp1 regulates putative VAT Treg cell precursors, diverse functions of IL-6 in the VAT, and a model of the sex-hormone mediated circuitry that mediates recruitment, expansion and function of VAT Treg cells.
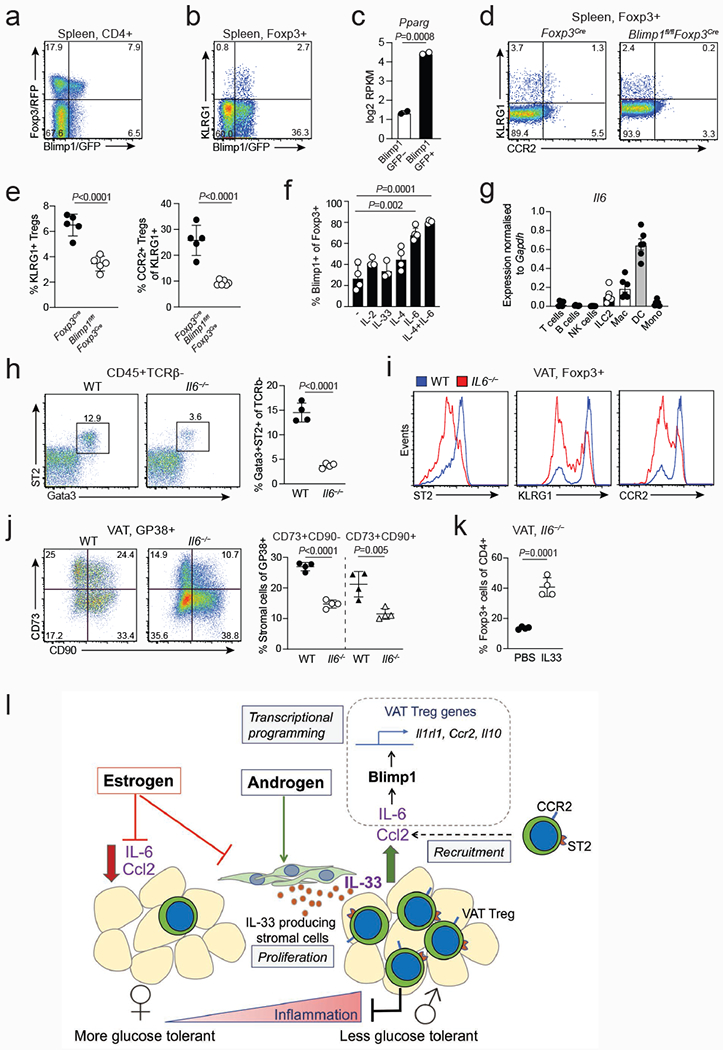
a, Expression of Foxp3 and Blimp1 in splenic CD4+ T cells from Foxp3RFPBlimp1GFP mice. b, Expression of Blimp1/GFP and KLRG1 in splenic Treg cells. c, Pparg expression in Blimp1/GFP+ vs Blimp1/GFP− splenic Treg cells. Bar graph generated from RNAseq read counts26. d, Expression of KLRG1 and CCR2 in splenic Treg cells from Foxp3Cre and Blimp1fl/flFoxp3Cre mice. e Graphs on the right show percentages of KLRG1+ cells among splenic Treg cells of Foxp3Cre (n=5) and Blimp1fl/flFoxp3Cre (n=6) mice and percentages of CCR2+ cells within the KLRG1+ fraction of splenic Treg cells. f, Proportion of Blimp1/GFP+ Treg cells obtained after Blimp1/GFP-Treg cells sorted from Foxp3RFPBlimp1GFP mice were cultured in the presence of indicated cytokines (n=3-4). g, Expression of Il6 transcripts as measured by quantitative PCR in hematopoietic cell populations sorted from the male VAT (n=6). h, Flow cytometry plots (left) and quantification (right) of ILC2s in the VAT of male WT (n=4) and Il6−/− (n=4) mice. i, Flow cytometry histograms show expression of indicated markers in WT and Il6−/− VAT Treg cells. j, Expression of CD73 and CD90 in WT (n=4) and Il6−/− (n=4) VAT Gp38+ cells (left). Percentages of CD73+CD90− and CD73+CD90+ stromal cells in the VAT of male WT (n=4) and Il6−/− (n=4) mice (right). k, Percentages of VAT Treg cells in male Il6−/− mice treated with PBS or IL-33. Unpaired t-test (2-tailed) was performed. Data are mean ± s.d. Data pooled or representative of two independent experiments. l, Model of the sex-hormone mediated circuitry that mediates recruitment, expansion and function of VAT Treg cells. Treg cells are recruited to the VAT in a CCL2/CCR2-dependent manner. IL-6 induces the expression of transcription factor Blimp1, which in turn activates expression of prototypical VAT-Treg signature genes IL-33 receptor ST2, CCR2 and IL-10. IL-33 production by androgenresponsive stromal cells leads to local expansion of VAT Treg cells in the male VAT, whichin turn mediate repression of VAT inflammation.
Supplementary Material
Acknowledgements
This work was funded by the National Health and Medical Research Council (NHMRC, project grants and fellowship to AK), the Sylvia and Charles Viertel Foundation (fellowship to AK), the Diabetes Australia (grant to AV) and grants from the US NIH (R01DK092541) and JPB Foundation (to DM). WS is funded by Walter and Eliza Hall Institute Centenary Fellowship funded by a donation from CSL Ltd. MAF is a senior Principal Research Fellow of the NHMRC. PAB was funded by an NBCF Career Development Fellowship. JDZ and RAD are supported by funding from The Sir Edward Dunlop Medical Research Foundation, The Austin Health Research Foundation and a Les and Eva Erdi Research Grant. RAD was funded by fellowship from the Australian and New Zealand Bone and Mineral Society. We thank Thomas Korn (Technical University Munich) for help with experiments, Gail Risbridger (Monash University), Kenneth S. Korach (National Institute of Health), Matthias Ernst (Olivia Newton John Cancer Research Institute), John Silke (Walter and Eliza Hall Institute) and Wah Chin Boon (Howard Florey Institute) for mice.
Footnotes
Author Information statement. The authors declare no competing interests.
Data availability. Sequencing data generated for this study have been deposited in the Gene Expression Omnibus (GEO) database with accession number GSE121838. https://www.ncbi.nlm.nih.gov/geo/query/acc.cgi?acc=GSE121838. All other data and materials are available upon request.
References
- 1.Meseguer A, Puche C & Cabero A Sex steroid biosynthesis in white adipose tissue. Horm Metab Res 34, 731–736 (2002). [DOI] [PubMed] [Google Scholar]
- 2.Kamat A, Hinshelwood MM, Murry BA & Mendelson CR Mechanisms in tissue-specific regulation of estrogen biosynthesis in humans. Trends Endocrinol Metab 13, 122–128 (2002). [DOI] [PubMed] [Google Scholar]
- 3.Luo L & Liu M Adipose tissue in control of metabolism. J Endocrinol 231, R77–R99 (2016). [DOI] [PMC free article] [PubMed] [Google Scholar]
- 4.Rosen ED & Spiegelman BM Adipocytes as regulators of energy balance and glucose homeostasis. Nature 444, 847–853 (2006). [DOI] [PMC free article] [PubMed] [Google Scholar]
- 5.Mraz M & Haluzik M The role of adipose tissue immune cells in obesity and low-grade inflammation. J Endocrinol 222, R113–127 (2014). [DOI] [PubMed] [Google Scholar]
- 6.Cildir G, Akincilar SC & Tergaonkar V Chronic adipose tissue inflammation: all immune cells on the stage. Trends in molecular medicine 19, 487–500 (2013). [DOI] [PubMed] [Google Scholar]
- 7.Josefowicz SZ, Lu LF & Rudensky AY Regulatory T Cells: Mechanisms of Differentiation and Function. Annu Rev Immunol 30, 531–564 (2012). [DOI] [PMC free article] [PubMed] [Google Scholar]
- 8.Ohkura N, Kitagawa Y & Sakaguchi S Development and maintenance of regulatory T cells. Immunity 38, 414–423, doi: 10.1016/j.immuni.2013.03.002 (2013). [DOI] [PubMed] [Google Scholar]
- 9.Panduro M, Benoist C & Mathis D Tissue Tregs. Annu Rev Immunol 34, 609–633 (2016). [DOI] [PMC free article] [PubMed] [Google Scholar]
- 10.White UA & Tchoukalova YD Sex dimorphism and depot differences in adipose tissue function. Biochim Biophys Acta 1842, 377–392 (2014). [DOI] [PMC free article] [PubMed] [Google Scholar]
- 11.Karastergiou K, Smith SR, Greenberg AS & Fried SK Sex differences in human adipose tissues - the biology of pear shape. Biol Sex Differ 3, 13 (2012). [DOI] [PMC free article] [PubMed] [Google Scholar]
- 12.Feuerer M et al. Lean, but not obese, fat is enriched for a unique population of regulatory T cells that affect metabolic parameters. Nat Med 15, 930–939 (2009). [DOI] [PMC free article] [PubMed] [Google Scholar]
- 13.Kohlgruber AC et al. gammadelta T cells producing interleukin-17A regulate adipose regulatory T cell homeostasis and thermogenesis. Nature immunology 19, 464–474 (2018). [DOI] [PMC free article] [PubMed] [Google Scholar]
- 14.Lee MW et al. Activated type 2 innate lymphoid cells regulate beige fat biogenesis. Cell 160, 74–87 (2015). [DOI] [PMC free article] [PubMed] [Google Scholar]
- 15.Molofsky AB et al. Interleukin-33 and Interferon-gamma Counter-Regulate Group 2 Innate Lymphoid Cell Activation during Immune Perturbation. Immunity 43, 161–174 (2015). [DOI] [PMC free article] [PubMed] [Google Scholar]
- 16.Wensveen FM et al. NK cells link obesity-induced adipose stress to inflammation and insulin resistance. Nature immunology 16, 376–385 (2015). [DOI] [PubMed] [Google Scholar]
- 17.Lynch L et al. Regulatory iNKT cells lack expression of the transcription factor PLZF and control the homeostasis of T(reg) cells and macrophages in adipose tissue. Nature immunology 16, 85–95 (2015). [DOI] [PMC free article] [PubMed] [Google Scholar]
- 18.Moro K et al. Innate production of T(H)2 cytokines by adipose tissue-associated c-Kit(+)Sca-1(+) lymphoid cells. Nature 463, 540–544 (2010). [DOI] [PubMed] [Google Scholar]
- 19.Brestoff JR et al. Group 2 innate lymphoid cells promote beiging of white adipose tissue and limit obesity. Nature 519, 242–246 (2015). [DOI] [PMC free article] [PubMed] [Google Scholar]
- 20.Cipolletta D et al. PPAR-gamma is a major driver of the accumulation and phenotype of adipose tissue Treg cells. Nature 486, 549–553 (2012). [DOI] [PMC free article] [PubMed] [Google Scholar]
- 21.Cretney E et al. The transcription factors Blimp-1 and IRF4 jointly control the differentiation and function of effector regulatory T cells. Nat Immunol 12, 304–U353 (2011). [DOI] [PubMed] [Google Scholar]
- 22.Michalakis K, Mintziori G, Kaprara A, Tarlatzis BC & Goulis DG The complex interaction between obesity, metabolic syndrome and reproductive axis: a narrative review. Metabolism: clinical and experimental 62, 457–478 (2013). [DOI] [PubMed] [Google Scholar]
- 23.Kissick HT et al. Androgens alter T-cell immunity by inhibiting T-helper 1 differentiation. Proceedings of the National Academy of Sciences of the United States of America 111, 9887–9892 (2014). [DOI] [PMC free article] [PubMed] [Google Scholar]
- 24.Kovats S Estrogen receptors regulate innate immune cells and signaling pathways. Cell Immunol 294, 63–69 (2015). [DOI] [PMC free article] [PubMed] [Google Scholar]
- 25.Li C et al. TCR Transgenic Mice Reveal Stepwise, Multi-site Acquisition of the Distinctive Fat-Treg Phenotype. Cell 174, 285–299 e212 (2018). [DOI] [PMC free article] [PubMed] [Google Scholar]
- 26.Vasanthakumar A et al. The transcriptional regulators IRF4, BATF and IL-33 orchestrate development and maintenance of adipose tissue-resident regulatory T cells. Nature immunology 16, 276–285 (2015). [DOI] [PubMed] [Google Scholar]
- 27.Kolodin D et al. Antigen- and cytokine-driven accumulation of regulatory T cells in visceral adipose tissue of lean mice. Cell Metab 21, 543–557 (2015). [DOI] [PMC free article] [PubMed] [Google Scholar]
- 28.Mahlakoiv T et al. Stromal cells maintain immune cell homeostasis in adipose tissue via production of interleukin-33. Sci Immunol 4, 35, eaax0416 (2019). [DOI] [PMC free article] [PubMed] [Google Scholar]
- 29.Spallanzani RG et al. Distinct immunocyte-promoting and adipocyte-generating stromal components coordinate adipose tissue immune and metabolic tenors. Sci Immunol 4, 35, eaaw3658 (2019). [DOI] [PMC free article] [PubMed] [Google Scholar]
- 30.Koga S et al. Peripheral PDGFRalpha(+)gp38(+) mesenchymal cells support the differentiation of fetal liver-derived ILC2. The Journal of experimental medicine 215, 1609–1626 (2018). [DOI] [PMC free article] [PubMed] [Google Scholar]
- 31.Mackay LK et al. Hobit and Blimp 1 instruct a universal transcriptional program of tissue residency in lymphocytes. Science 352, 459–463 (2016). [DOI] [PubMed] [Google Scholar]
- 32.Notini AJ, Davey RA, McManus JF, Bate KL & Zajac JD Genomic actions of the androgen receptor are required for normal male sexual differentiation in a mouse model. J Mol Endocrinol 35, 547–555 (2005). [DOI] [PubMed] [Google Scholar]
- 33.Rana K, Clarke MV, Zajac JD, Davey RA & MacLean HE Normal phenotype in conditional androgen receptor (AR) exon 3-floxed neomycin-negative male mice. Endocr Res 39, 130–135 (2014). [DOI] [PubMed] [Google Scholar]
- 34.Kallies A, Xin A, Belz GT & Nutt SL Blimp-1 transcription factor is required for the differentiation of effector CD8(+) T cells and memory responses. Immunity 31, 283–295 (2009). [DOI] [PubMed] [Google Scholar]
- 35.Kallies A et al. Plasma cell ontogeny defined by quantitative changes in blimp-1 expression. The Journal of experimental medicine 200, 967–977 (2004). [DOI] [PMC free article] [PubMed] [Google Scholar]
- 36.Horai R et al. Production of mice deficient in genes for interleukin (IL)-1 alpha, IL-1beta, IL-1 alpha/beta, and IL-1 receptor antagonist shows that IL-1beta is crucial in turpentine-induced fever development and glucocorticoid secretion. The Journal of experimental medicine 187, 1463–1475 (1998). [DOI] [PMC free article] [PubMed] [Google Scholar]
- 37.Lancaster GI & Henstridge DC Body Composition and Metabolic Caging Analysis in High Fat Fed Mice. J Vis Exp 135 (2018). [DOI] [PMC free article] [PubMed] [Google Scholar]
- 38.Liao Y, Smyth GK & Shi W The Subread aligner: fast, accurate and scalable read mapping by seed-and-vote. Nucleic Acids Res 41, e108 (2013). [DOI] [PMC free article] [PubMed] [Google Scholar]
- 39.Liao Y, Smyth GK & Shi W featureCounts: an efficient general purpose program for assigning sequence reads to genomic features. Bioinformatics 30, 923–930 (2014). [DOI] [PubMed] [Google Scholar]
- 40.Law CW, Chen Y, Shi W & Smyth GK Voom: precision weights unlock linear model analysis tools for RNA-seq read counts. Genome biology 15, R29 (2014). [DOI] [PMC free article] [PubMed] [Google Scholar]
- 41.Ritchie ME et al. limma powers differential expression analyses for RNA-sequencing and microarray studies. Nucleic acids research 43, e47 (2015). [DOI] [PMC free article] [PubMed] [Google Scholar]
- 42.McCarthy DJ & Smyth GK Testing significance relative to a fold-change threshold is a TREAT. Bioinformatics 25, 765–771 (2009). [DOI] [PMC free article] [PubMed] [Google Scholar]
- 43.Buenrostro JD, Giresi PG, Zaba LC, Chang HY & Greenleaf WJ Transposition of native chromatin for fast and sensitive epigenomic profiling of open chromatin, DNA-binding proteins and nucleosome position. Nat Methods 10, 1213–1218 (2013). [DOI] [PMC free article] [PubMed] [Google Scholar]
Associated Data
This section collects any data citations, data availability statements, or supplementary materials included in this article.


