

SUMMARY
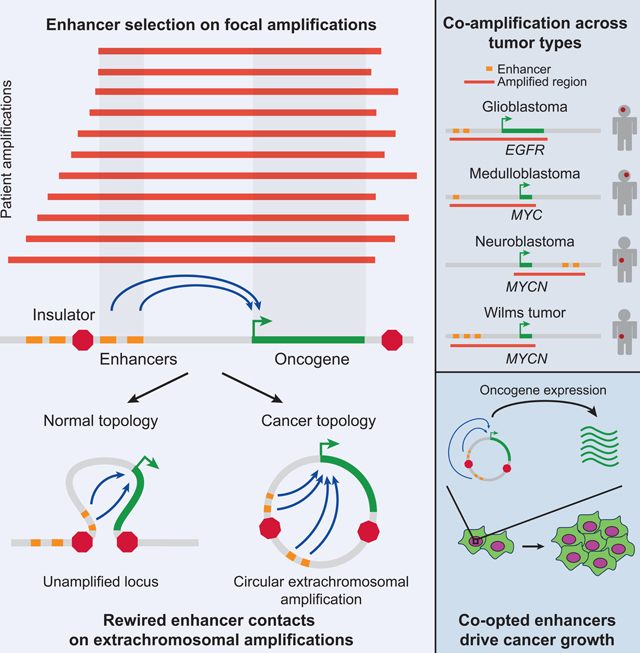
Non-coding regions amplified beyond oncogene borders have largely been ignored. Using a computational approach, we find signatures of significant co-amplification of non-coding DNA beyond the boundaries of amplified oncogenes across five cancer types. In glioblastoma, EGFR is preferentially co-amplified with its two endogenous enhancer elements active in the cell type of origin. These regulatory elements, their contacts, and their contribution to cell fitness are preserved on high-level circular extrachromosomal DNA amplifications. Interrogating the locus with a CRISPR interference screening approach reveals a diversity of additional elements that impact cell fitness. The pattern of fitness dependencies mirrors the rearrangement of regulatory elements and accompanying rewiring of the chromatin topology on the extrachromosomal amplicon. Our studies indicate that oncogene amplifications are shaped by regulatory dependencies in the non-coding genome.
IN BRIEF
Extrachromosomal oncogene amplification is a common occurrence across a broad range of cancers, yet the chromatin landscape of these high-level amplifications is poorly understood. Using a combination of approaches to explore their chromatin topology and enhancer landscape it is observed that these oncogene amplifications are shaped by regulatory dependencies in the non-coding genome.
Graphical Abstract
INTRODUCTION
The “gene centric” view of DNA amplification focuses on identifying the potential oncogene in the minimal common region of copy number gain, but recent work on genome organization and gene regulation has revealed the crucial importance of neighboring regions in transcriptional control. Topologically Associating Domains (TADs) and the genes within them have emerged as units of genome organization (Dixon et al., 2012; Nora et al., 2012). We therefore decided to revisit the prevailing paradigm on gene amplification and interrogate the regions beyond the traditional 5’ to 3’ boundaries of the oncogene.
Oncogene amplification can be classified into two broad categories: low-level copy gain and high-level amplification. Low-level gains arise due to large chromosome level abnormalities or smaller tandem duplications at a locus. Low-level copy number gains often remain stable upon their establishment. High-level amplifications arise by entirely different mechanisms, such as breakage-fusion bridges or chromothripsis, leading to oncogenes amplified in homogenously staining regions or carried on circular extrachromosomal DNA (ecDNA). Continuous selective pressure can drive a progressive increase in oncogene copy number to levels that can reach 50 or more (Turner et al., 2017). Regardless of the class, amplifications always take additional sequences beyond the body of the gene, but it remains unclear whether these additional sequences are functional or are just passengers.
Aberrant enhancer activity is a key driver of gene expression programs that contribute to tumor formation, maintenance, and progression. Compared to their normal counterparts, tumor cells frequently show locus-specific gains and losses of typical- and super-enhancer activity across the epigenome (Akhtar-Zaidi et al., 2012; Hnisz et al., 2013). Moreover, translocations (Northcott et al., 2014), inversions (Groschel et al., 2014), and other genomic rearrangements (Beroukhim et al., 2016) can reposition enhancers near proto-oncogenes to activate them. In one instance, duplication of the androgen receptor gene and its enhancer contributes to the progression of metastatic castration-resistant prostate cancer (Takeda et al., 2018; Viswanathan et al., 2018). These studies illustrate that a change in a single enhancer can profoundly promote the tumor phenotype. Based on this background, we performed a comprehensive survey of the patterns of co-amplification around oncogenes. We investigated the role of co-amplifications in gene regulation, regulatory element acquisition, chromatin topology, and their impact on cell fitness using a combination of ChlP-seq, 4C-seq, and CRISPR interference (CRISPRi) screening. With EGFR as our exemplar, we found that the oncogenes amplified on circular extrachromosomal DNA select for existing and new regulatory interactions that promote cancer growth.
RESULTS
EGFR is co-selected with two functional enhancers on amplicons in glioblastoma
EGFR is the second most significant amplification occurring across tumor types (Zack et al., 2013). High-level focal amplification of EGFR is especially prevalent in glioblastoma, often arising on circular extrachromosomal DNA (Turner et al., 2017). We first evaluated EGFR amplicons in 174 amplified glioblastoma specimens curated by The Cancer Genome Atlas (TCGA). Visual inspection of the aligned amplicons revealed that 173 out of 174 amplicons include 130-kb of non-coding DNA upstream of the EGFR gene. We hypothesized that if any genomic features undergo co-selection with the EGFR gene upon amplification, the associated amplicons would be expected to extend distally to include these features, manifesting as a “skewing” of amplicons with respect to the genomic location of the oncogene (Figure 1a). To test for this scenario, we developed a Monte Carlo-based method in which the actual distribution of amplicons at a given locus was compared to that of amplicons randomly shuffled uniformly at the locus such that amplicons still encompassed the oncogene. This revealed a striking skew of amplicons toward the region upstream of EGFR (P < 0.0001). This region harbors non-coding DNA and the gene SEC61G, not consistently co-amplified with EGFR (Figure 1b). As the core co-amplified region extending 130-kb upstream of the gene is entirely non-coding, we mapped the active regulatory elements using ChlP-seq data for the promoter and enhancer histone mark H3K27ac. We identified two H3K27ac signals directly within the region of skew. Each of these putative enhancers showed near perfect co-amplification with the EGFR gene (Figure 1c). Multiple lines of evidence supported their functional activity: both EGFR enhancers lay within accessible chromatin measured by Assay for Transposase-Accessible Chromatin sequencing (ATAC-seq), were bound by RNA Polymerase II, and expressed enhancer RNA (Figure 1d).
Figure 1. Skewing of EGFR focal amplifications to two upstream enhancer elements.

(a) Model for positive selection of functional elements on amplicons. (b) (From top-to-bottom) Green highlights region of skew from the Monte Carlo simulation (P < 0.0001). Heatmap depicting the EGFR amplicons across 174 glioblastoma samples. The aggregate heatmap summarizes the frequency of amplification across the cohort. (Bottom) magnified view of the co-amplified H3K27ac peaks (from an aggregate of six glioblastoma models) upstream of EGFR. (c) Copy number for the EGFR transcription start site (TSS) (x axis) versus copy number of each upstream enhancer (y axis) across EGFR-amplified glioblastoma samples. (d) H3K27ac ChlP-seq, ATAC-seq, POLR2A ChlP-seq, and RNA-seq signals at two EGFR enhancers for four glioblastoma lines (GBM3565, GBM3094, GSC23, G459). (e) Experimental scheme for EGFR repression by CRISPRi using a doxycycline-inducible KRAB-dCas9 construct designed to target EGFR enhancers and promoter in G361 glioblastoma cell cultures. (f) RT-qPCR EGFR expression in G361 with multiple sgRNAs targeting EGFR enhancers 1 and 2 and a comparison of the promoter in induced and uninduced cells (N=3 experiments per sgRNA with 2–3 technical replicates). (g) Cell viability as assayed by Alamar blue in induced and uninduced cells after 8 days of culture, following sgRNA targeting of the EGFR enhancers and promoter (N=3 experiments per sgRNA). A t-test was used for significance (* p≤0.05, ** p≤0.01, *** p≤0.001 compared to the untreated control using all technical replicates). See also Figure S1.
To assess the functional contribution of the upstream EGFR enhancers on EGFR expression and cell viability, we designed a CRISPRi approach for these two loci using doxycycline-inducible dCas9-KRAB, using multiple single guide RNAs (sgRNAs) for each enhancer (Figure 1e). Targeting either EGFR enhancer in an EGFR-unamplified glioblastoma cell line consistently reduced EGFR transcript levels on par with that obtained by targeting the EGFR promoter (Figure 1f). The reduced EGFR expression resulting from CRISPRi of the 86-kb and 130-kb upstream enhancers inhibited cell viability (Figure 1g), supporting enhancer contributions to tumor biology. In contrast, sgRNAs targeting an unrelated locus (SQLE) did not affect EGFR expression (Figure S1a). Thus, the co-amplified region upstream of EGFR contains two bona fide enhancers that regulate EGFR expression and cellular fitness.
Co-amplified enhancers are active in cells of glial origin
Based on the role of enhancers in defining cellular states, we hypothesized that the preferential selection of enhancers during oncogenic amplification depends upon their active and open status in the tissue type from which cancer arises. Enhancers were tested for their activity in the 134 tissues profiled by the Roadmap Epigenomics Consortium (Figures 2a). At the EGFR locus in glioblastoma, the H3K27ac profile within the region of skew most closely resembled nervous system tissues: specifically, a hippocampus tissue specimen and embryonic stem-cell derived neurosphere culture (Figure 2b). The 86-kb and 130-kb upstream EGFR enhancers also showed binding of SOX2, a transcription factor vital to the maintenance of neural progenitors and stem-like glioblastoma cells (Figure 2c) (Ellis et al., 2004; Suva et al., 2014).
Figure 2. Selection of tissue-specific enhancers by EGFR amplicons.

(a) Model of tissue specific enhancer analysis. (b) Pearson correlation to measure the similarity between the H3K27ac enhancer profiles within the region of skew of normal tissues and the profile of GSC23 for EGFR in glioblastoma. The top scoring tissues are labelled. (c) ChlP-seq tracks for H3K27ac and SOX2 in the EGFR region of skew in glioblastoma cell lines (aggregate track, MGGTPC) and neural stem cells (NSC194, neural progenitor cell). (Bottom) Zoom in of SOX2 signal for EGFR enhancer 1 and enhancer 2.
EGFR and its endogenous enhancers are maintained as amplified, circular extrachromosomal DNA
To understand the role of the EGFR enhancers in their amplified context, we identified 9 glioblastoma cell cultures with high-level focal EGFR amplifications (Figures 3a and 3b). Despite the heterogeneous nature of EGFR amplicons, the two EGFR enhancer elements were consistently amplified across all 9 glioblastomas. H3K27ac levels at the EGFR promoter and the two enhancers positively correlated with the number of copies of EGFR (P < 0.0001) (Figures S2a and S2b), indicating that enhancer acetylation likely occurred on every copy of the amplicon. Furthermore, in some instances the expression levels of EGFR were higher than predicted based on copy number alone (Figure S2c), suggesting additional transcriptional regulation. In two glioblastomas, the copy number of the upstream EGFR enhancers was higher than that of EGFR itself (red arrows, Figure 3b), implying that the enhancers had been subject to positive selection beyond that of the EGFR gene itself.
Figure 3. Co-option of local and ectopic enhancers by EGFR extrachromosomal amplification events.

(a) Overview of experimental approach. (b) (Left) ChIP input control sequence tracks from EGFR-amplified and -unamplified glioblastoma cell models. (Right) Enlarged view of the EGFR 5’ upstream region H3K27ac ChlP-seq data. (c) Metaphase FISH of GBM3565 showing extrachromosomal EGFR amplification (red) at white arrows. The CEP7 probe depicted in green marks the centromere of chromosome 7. (60x original magnification) (d) (Left) Circular amplicon reconstruction based on paired-end reads. (Right) In silico reconstruction of the EGFR GBM3565 ecDNA showing supporting split reads. (e) In silico reconstruction of GBM3679, GBM1552, GBM2229, and GBM3565 ecDNA amplifications carrying the EGFR amplicon. (Top) Intrachromosomal (blue) rearrangements predicted by paired-end reads, input track from showing focal amplifications, and H3K27ac ChlP-seq track. (Bottom) Circular layout of EGFR amplicon. (Outside-inside) H3K27ac ChlP-seq track, refseq genes (in green), and chromosome 7 coordinates. See also Figure S2 and Figure S3.
In glioblastoma, the EGFR gene is frequently amplified as extrachromosomal amplicons that arise through chromothripsis (Rausch et al., 2012a; Stephens et al., 2011; Zhang et al., 2015). Indeed, using DNA fluorescence in situ hybridization (FISH), we confirmed the presence of extrachromosomal EGFR amplification in two samples (Figures 3c and S3). In four of the glioblastoma samples with EGFR amplification, we reconstructed circular nature of the amplification by using a combination of split and discordant paired-end reads from the H3K27ac ChlP-seq data (see Methods) (Figure 3d) (Sanborn et al., 2013; Turner et al., 2017). Reconstruction of the circular structure of the EGFR amplifications in context with cis-regulatory features revealed other heterogeneous arrangements containing neighboring genes and multiple active regulatory elements, in addition to the two EGFR enhancers (Figures 3e and S3). In one glioblastoma model (GBM3565), 3 non-contiguous genomic segments that normally span two individual topological-associated domains (TADs) were brought together by the formation of the extrachromosomal amplification (Figure 3e).
Extrachromosomal EGFR amplification impacts 3D chromatin topology
We investigated the three-dimensional topology of the EGFR locus in unamplified glioblastoma models by generating CTCF ChlP-seq profiles and integrating publicly available HiC data (Johnston et al., 2019) (Figure 4a). EGFR resides within a 480-kb loop domain, bounded by two inward-facing CTCF motifs, containing both enhancers and the EGFR gene. We performed circular chromosome conformation capture sequencing (4C-seq) on an EGFR-unamplified glioblastoma (GSC23) to interrogate the genomic structure of the EGFR locus. We first anchored on the 5’ EGFR domain boundary and found that the loop domain was preserved in this EGFR unamplified sample (Figure S4a). Anchoring from the EGFR promoter, EGFR had strong contacts with the two upstream enhancers, as well as the multiple enhancers within the gene body (Figure 4b). In the EGFR-amplified sample GBM3565, 4C-seq anchored on the EGFR promoter revealed a striking rearrangement of the locus topology (Figure 4c). In addition to preservation of the contacts between the endogenous enhancers and the EGFR promoter, multiple new contacts occurred within the loop domain between the promoter and other enhancers. One of the contacts was between the EGFR promoter and a gained enhancer specific to the glioblastoma model. Perhaps most strikingly, there were new 3D contacts extending past the canonical domain boundary. 4C-seq anchored on the normal 5’ domain boundary revealed a stark weakening of the strength of the boundary loop (Figure S4b). ChlP-seq studies showed that CTCF binding was preserved at the boundaries of the amplified loop domain, indicating that the new contacts beyond the boundary occurred without a disruption to CTCF occupancy.
Figure 4. Topology of the EGFR locus in unamplified and amplified glioblastoma.

(a) (Top) HiC contact map of unamplified glioblastoma model cell line G567. (Middle) CTCF ChlP-seq track of unamplified glioblastoma model cell line GSC23. The red and green arrows denote the orientation of the CTCF motif. (Bottom) Schematic of the boundaries of the loop domain. (b) 4C-seq profiles anchored from near the EGFR transcription start site (dotted line) showing interactions to the EGFR enhancers (boxed) for GSC23 (unamplified). Red arcs denote regions with strong distal interactions with EGFR at a 12 kb window thresholded at a 0.12 interaction frequency. H3K27ac ChIP-seq tracks accompany the 4C-seq data. The 4C-seq tracks consist of a main trend of the chromatin interactions based on a 5 kb window and domainogram colored by interaction frequency. Right side depicts a model for the toplogy of the locus. (c) Same as (b) for GBM3565 (EGFR amplified). See also Figure S4.
Enhancer rewiring on extrachromosomal DNA regulates cell viability
Given the striking difference in chromosome topology between the amplified and unamplified EGFR locus, we functionally interrogated every regulatory element at the EGFR locus through a 21-day CRISPRi proliferation dropout screen, utilizing 9559 guides targeting more than 100 regions across the locus in EGFR amplified (GBM3565) and EGFR unamplified (GSC23) models (Figure 5a). As expected, sgRNAs targeting the EGFR promoter were the most significantly depleted across the screen, indicating that the EGFR promoter strongly contributes to cellular fitness (Figures 5b–d). Furthermore, the endogenous EGFR enhancers 1 and 2 scored as fitness enhancers in the amplified sample, indicating that, even in the context of the amplification, they remain functional. In addition to the preserved regulatory links, the screen revealed other instances of regulatory rewiring. For simplicity, we named these enhancers E3, E4, and E5. First, loss of a fitness signal at E3 in the amplified line was due to its deletion within the amplicon. Enhancer E4 was a cell line-specific enhancer showing both a gain-of-activity and a new contact, with the second most robust fitness score across the locus on the amplified locus. Enhancer E5 had a high-fitness score solely driven by a new 3D contact on the amplicon. Perhaps the most striking finding was that CRISPRi significance scores nearly perfectly mirrored H3K27ac peak strength across the amplified and unamplified loci, indicating that nearly every enhancer element provided some level of functional contribution to overall fitness. Overall, these data indicate that the preservation of contacts to enhancers and even purely topological changes driven by amplification and circularization can modulate an oncogene’s ability to affect cell viability.
Figure 5. The contribution of enhancers on EGFR amplicons to cell fitness.

(a) Overview of CRISPRi screen design. (b) Genomic annotations for the EGFR locus. We show enhancer 1 and enhancer 2 as E1 and E2 and additional enhancers as E3–5. (c) CRISPRi fitness plots for unamplified (GSC23) and amplified (GBM3565) glioblastoma. CRISPRi score (red) represents −log10(p value) based on the 20 sgRNA rolling average. High CRISPRi scores represent depletion. Peaks above the dashed threshold line are significant at a Benjamini-Hochberg FDR < 0.01. H3K27ac ChIP-seq tracks and 4C-seq strong interactions are shown about the CRISPRi scores. Colored circles above the peaks denote shared or unique significant enhancers. (d) Zoom ins for EGFR enhancer 4, 1, and the promoter. The tracks are the same as in (c) except for the addition of the log2(fold change of day 21 compared to the plasmid library) of individual sgRNAs. See also Figure S5.
Cell-of-origin enhancers co-amplify with oncogenes across multiple solid tumors
We interrogated available datasets from multiple cancer types to determine if the coamplification of enhancers and oncogenes was a more general phenomenon. Using SNP microarray data publicly available from TCGA, TARGET, and several individual cancer profiling efforts (Chen et al., 2008; Northcott et al., 2012), we quantified copy number alterations across 4577 human tumor samples representing 9 different solid cancers (Figure 6a). We searched specifically for high-level amplifications, as these are frequently propagated extrachromosomally (Turner et al., 2017). Of these tumors, 743 tumors had high-level focal oncogene amplification (copy number > 7) with 43 amplified COSMIC-defined oncogenes (Forbes et al., 2017; Sondka et al., 2018). EGFR amplification in glioblastoma was the most common, followed by ERBB2 amplification in breast cancer. For each of the 43 occurrences of focal amplification, we analyzed reference H3K27ac ChlP-seq data from representative tumors and identified putative enhancers likely to be consistently present on amplicons (Figure 6b), revealing a general pattern of co-amplification of oncogenes and associated enhancers, with 30 of 43 occurrences of focal amplification containing specific distally-positioned enhancer elements co-amplified with the oncogene on every amplicon (Figure 6c).
Figure 6. Multi-cancer analysis of enhancer selection on oncogene amplicons.

(a) Solid tumors analyzed in this study. (b) Workflow for pan-cancer identification of oncogene-enhancer co-amplification. (c) Bar chart showing the proportion of samples containing a co-amplified enhancer. The most frequently co-amplified enhancer is plotted; other enhancers may be present at a lower frequency. (d) Oncogenes showing amplicon-skew in indicated cancers. (e) MYCN amplification skewing data for neuroblastoma showing inclusion of a downstream super-enhancer. (Top-bottom) Super-enhancers colored by recurrence number detected in MYCN-unamplified neuroblastoma cell lines and aggregated H3K27ac ChIP-seq data from these 12 lines (top). Copy number profile of 40 neuroblastoma tumors, with the region of skew indicated by the green bar (P < 0.0001 by Monte Carlo simulation) (bottom). (f) MYCN amplification skewing in Wilms tumor includes an upstream super-enhancer. (Top-bottom) Super-enhancers colored by recurrence number detected in MYCN-unamplified primary Wilms tumor samples and aggregated H3K27ac ChlP-seq data from samples of these 5 tumors (top). Copy-number profile of 15 Wilms tumors, with the region of skew indicated by the green bar (P < 0.0001 by Monte Carlo simulation) (bottom). (g) Pearson correlation to measure the similarity between the H3K27ac enhancer profiles within the region of skew of normal tissues and the profile of CLB-GA neuroblastoma cell line. The top scoring tissues are labelled. (h) ChlP-seq tracks for H3K27ac and the lineage-enriched factors MYCN, TWIST1, and GATA3 from the MYCN region of skew in neuroblastoma, as assessed within the neuroblastoma aggregate track, an embryonic adrenal sample from Roadmap Epigenomics data, and the MYCN-amplified neuroblastoma cell line BE(2)C. (i) Same as (g) except the normal tissues were compared to the profile of Wilms tumor 5. The top scoring tissues are labelled. (j) ChlP-seq tracks for H3K27ac and lineage-enriched factors SIX1 and SIX2 from the MYCN region of skew in Wilms tumor, as assessed in the Wilms tumor aggregate track and embryonic kidney samples. See also Figure S6.
To determine if the putative enhancers were co-selected with their oncogenes, we applied our Monte Carlo-based test for amplicon skewing and detected 15 instances of amplicon skewing (P < 0.0001) (Supplementary Table 1). For 7 of the 15 skewed amplicons, the region of skew contained a neighboring oncogene that had been co-amplified with the presumed driver oncogene. For example, CCND1 was co-amplified with CTTN in several tumor types, including head and neck squamous cell carcinoma. Previous reports of co-amplification of oncogenes (Dedes et al., 2010; Kendall et al., 2007; Wang et al., 2013) validate the Monte Carlo-method we used to identify loci under selection. Seven occurrences of amplification skewed towards regions that were either non-coding or containing genes without known oncogenic function (Figure 6d).
We used H3K27ac ChlP-seq data from representative tumors for each oncogene to understand the regulatory landscape within the region of co-amplification. In all 7 cases, the H3K27ac ChlP-seq data revealed overlapping super-enhancers and typical enhancers within the regions of skew. In addition to EGFR, the most striking cases were MYC in group 3 medulloblastoma and MYCN in both neuroblastoma and Wilms tumors. MYC was co-amplified with a super-enhancer in medulloblastoma not only on contiguous amplicons, but also in more complex non-contiguous amplicons, which further implied that oncogene and enhancers are co-selected with oncogenes (Figure S6). MYCN showed different skew patterns in neuroblastoma and Wilms tumor (Figures 6e and 6f). If the basis of skewing in amplicon structure is determined by enhancer selection, then the regions of skew should contain active enhancers, unique to each tumor type. Indeed, H3K27ac ChlP-seq data from neuroblastoma revealed a super-enhancer within the 3’ skew (Figure 6e). To independently validate these in silico data, we obtained 5 primary Wilms tumors and performed H3K27ac ChlP-seq, which revealed the presence of a recurrent super-enhancer that directly overlapped with the 5’ region of skew on amplicons (Figure 6f). This superenhancer was exclusive to Wilms tumors and not observed in neuroblastoma. Reciprocally, the neuroblastoma MYCN super-enhancer was not observed in Wilms tumor. These observations suggest that the MYCN oncogene undergoes preferential selection with cancer-specific enhancers.
Co-amplified enhancers were tested for their activity in normal tissues from the Roadmap Epigenomics Consortium. At the MYCN locus in neuroblastoma, the co-amplified super-enhancer was most active in fetal adrenal tissue, which is rich with neural crest derivatives and generally accepted to be a cell type-of-origin for neuroblastoma (Figure 6g) (Jiang et al., 2011). In MYCN-driven neuroblastoma, the neural-crest determinants, MYCN, TWIST1, and GATA3, occupied the 3’ super-enhancer (Figure 6h). Among the diversity of tissues surveyed by the Roadmap Epigenomics Consortium, the MYCN super-enhancer in Wilms tumor was most specific to the human embryonic kidney (Figure 6i), the tissue-of-origin for this cancer (Rivera and Haber, 2005). In the embryonic kidney, the SIX1 and SIX2 mesenchymal transcription factors essential to kidney development occupied these enhancers (Figure 6j) (Kobayashi et al., 2008; O’Brien et al., 2016; Xu et al., 2003). Collectively, these data indicate that the selected enhancers reflect the tissue of origin for each particular tumor and are bound by lineage-specific factors that normally mediate formation of these tissues during early embryonic development.
DISCUSSION
We find that neighboring non-coding regions harboring enhancers co-amplify with oncogenes and maintain the physical contacts present on the linear chromosome. However, circularization of these amplicons can lead to the incorporation of new regulatory elements and changes to the topological connections to the oncogene. Furthermore, this regulatory rewiring contributes to the oncogene’s effect on cancer fitness.
Circular ecDNA can arise through chromosome shattering events (chromothripsis), and the current model is that the fragments are put back together at random (Korbel and Campbell, 2013). We propose that selection acts on the pool of rewired loci and provides a selective advantage. However, given that we never observe breakpoints between the EGFR gene and its two upstream enhancers, this suggests that incorporation of endogenous enhancers may not only be advantageous, but actually required for oncogene selection.
Tumor cells acquire highly active typical and super enhancers at driver oncogenes (Akhtar-Zaidi et al., 2012; Hnisz et al., 2013). However, under this model, oncogenes are limited by their immediate neighborhood of regulatory elements. But chromothripsis provides the opportunity for oncogenes to expand their enhancer repertoire, either through the incorporation of active enhancers normally insulated from the oncogene or through the creation of new regulatory connections.
Other described mechanisms of regulatory rewiring of oncogenes include structural rearrangements that can reposition enhancers near oncogenes, disrupt TAD insulating elements, or amplify enhancers independently of oncogene amplification (Beroukhim et al., 2016). Here we describe another mechanism of oncogenic regulatory rewiring driven by coamplification and subsequent circularization. The whole locus is the driver: oncogene, enhancers, their topological contacts, and perhaps other unknown regulatory features, i.e. the “onco-locus.” Collectively, our results uncover an additional layer of regulatory complexity in canonical driver events, which may provide avenues for the targeted disruption of key oncogenes that have been considered undruggable to date.
STAR METHODS TEXT
LEAD CONTACT AND MATERIALS AVAILABILITY
Further information and requests for resources and reagents should be directed to and will be fulfilled by the Lead Contact, Peter Scacheri (pxs183@case.edu). All unique/stable reagents generated in this study are available from the Lead Contact with a completed Materials Transfer Agreement.
EXPERIMENTAL MODEL AND SUBJECT DETAILS
Tissues
Five Wilms tumors were obtained from existing pathological specimens at the Cleveland Clinic after review by pathologists following the Case Western Reserve University IRB-approved exemption (IRB-2018–2245). Wilms tumor sample 1 was a stage I tumor from the left kidney of a 6 year, 7 month old male. Wilms tumor sample 2 was a stage II tumor from the left kidney of a 1 year, 8 month old female. Wilms tumor sample 3 was a stage III tumor from the right kidney of a 1 year, 7 month old male. Wilms tumor sample 4 was a stage I tumor from the left kidney of a 5 year, 4 month old female. Wilms tumor sample 5 was a stage I tumor from the right kidney of a 3 month old male.
Cell lines
Glioblastoma cell models GBM3565 and GSC23 from tumors prior to the study were cultured in stem cell conditions as previously described (Bao et al., 2006). For these studies, including FISH and 4C-seq, glioblastoma cells were cultured in Neurobasal Medium (Gibco) with the addition of B27 (without vitamin A, ThermoFisher), penicillin streptomycin (50 ug ml-1, Gibco), sodium pyruvate (1 mM, Gibco), basic fibroblast growth factor (20ngml-1, R&D) and epidermal growth factor (20ngml-1, R&D). Cells are dissociated with Accutase (Innovative Cell Technologies, Inc.) during passaging. Incubator conditions were 37°C, 20% oxygen, and 5% CO2. Cells were regularly tested and found free of mycoplasma. Short tandem repeat (STR) testing was performed to confirm cell identity. The GBM3565 was derived in the Rich lab from a glioblastoma from a 32-year old male patient. The GSC23 model, a gift from Erik Sulman of MD Anderson Cancer Center, was derived from glioblastoma biopsy from a 63-year old male patient.
Glioblastoma cell model G361 was grown on Primaria culture plates (Corning) coated with poly-L-ornithine (Sigma) and laminin (Sigma) as described previously (Park et al., 2017). The neurosphere cell self-renewal media consisted of Neurocult NS-A Basal media (StemCell Technologies), with 2 mM L-glutamine, 1x N2 supplement (Life Technologies), 1x B27 supplement (Life Technologies), 75 μg/mL bovine serum albumin (Life Technologies), 10 ng/mL recombinant human EGF (Sigma), 10 ng/mL basic fibroblast growth factor (StemCell Technologies), and 2 μg/mL heparin (Sigma). Cells are dissociated with Accutase (Innovative Cell Technologies, Inc.) during passaging. G361 was derived by the Dirks lab from a glioblastoma from a female patient.
METHOD DETAILS
Chromatin Immunoprécipitation sequencing
For the H3K27ac ChlP-seq of the Wilms tumor samples, between 0.22 and 0.63 g of frozen Wilm’s tumor tissues were pulverized in Covaris tissueTUBE TT1 bags on dry ice and using liquid nitrogen (Savic et al., 2013). For the CTCF ChlP-seq of GBM3565 and GSC23, 10 million cells were used. Using the Covaris truChIP™ Chromatin Shearing kit (#520154), the powdered tissue (Wilms tumor) or cells (glioblastoma) were cross-linked in formaldehyde for 10 min and the cell nuclei were extracted. Samples were sheared in 1 ml milliTUBEs on the Covaris model S2 AFA focused ultrasonicator, duty factor 2%, intensity 4, 200 cycles/burst, for 6 min. Our ChlP-seq method using 8 μg rabbit anti-H3K27ac (Abeam #4729) or 10 μL of anti-CTCF (Cell Signaling #3418) was that of Schmidt et al. (Schmidt et al., 2009) but using PCRCIean Dx paramagnetic beads (ALINE #C-1003) instead of column purifications and using adapters that we made following Illumina bar codes. Calibration of various bead-to-DNA volume ratios was performed on a 100 bp ladder standard to determine the best bead ratio to remove excess adapters and adapter-dimers after the adapter ligation step and after gel purification of the final libraries. The Wilms tumor H3K27ac ChlP-seq libraries were sequenced as single-end, 75-basepair reads on an Illumina NextSeq 500 platform at the Case Western Reserve University Genomics Core Facility. The glioblastoma CTCF ChlP-seq libraries were sequenced as paired-end, 150-basepair reads on an Illumina NovaSeq 6000 platform at the New York Genome Center.
CRISPRi mediated repression in stable dCas9-KRAB-expressing G361 cells
The pLCKO lentiviral backbone (a gift from Jason Moffat) for expression of the sgRNAs and the pHAGE TRE dCas9-KRAB lentiviral plasmid (a gift from Rene Maehr & Scot Wolfe) that encodes dCas9-KRAB were obtained from Addgene (#73311 and #50917, respectively). sgRNAs for each target were designed using a CRISPR design tool (Hsu et al., 2013) and CHOPCHOP software (Labun et al., 2016). sgRNAs were cloned into the BfuAI site of the pLCKO vector. Lentivirus were produced in HEK293T packaging cells by transfection of the lentiviral expression plasmid along with psPAX2 (a gift from DidierTrono, Addgene #12260) and pMD2.G (a gift from Didier Trono, Addgene #12259) packaging plasmids. Forty-eight hours post-transfection, lentiviral media was harvested and concentrated using the Lenti-X concentrator solution (Clontech). The G361 dCas9-KRAB stable cell line was generated by infecting the G361NS patient-derived glioblastoma cell line with pHAGE TRE dCas9-KRAB lentivirus in combination with G418 selection (80 ug/mL). G361 cells stably expressing dCas9-KRAB were transduced with pLCKO-sgRNA lentiviral particles in 3 independent experiments and selected with puromycin and G418. After selection, cells were left untreated or induced with doxycycline for 8 days with regular media changes. Alamar Blue (Thermo Fisher Scientific) was added to the plates to assess the relative viability of the induced cells compared to the untreated control cells.
Total RNA was extracted from the cells using the RNeasy Mini kit (QIAGEN), and RNA was reverse transcribed into cDNA using the Bioline SensiFAST cDNA synthesis kit. RT-qPCR was performed using the Bioline SensiFAST SYBR mix (No-Rox) and gene-specific primers (Table S2) on a Bio-Rad CFX96 Real-Time PCR instrument. For each of triplicate experiments, at least two measurements were made. Threshold qPCR values for each sample were first normalized to the reference gene TBP and then normalized to the untreated control values for each independent replicate. The significance of fold changes was tested using t-test versus control.
CRISPRi proliferation screen
sgRNAs targeting the regulatory landscape of the EGFR locus were designed using CHOPCHOP (Labun et al., 2016). Guides located in non-regulatory regions were included from both within and outside of the amplified region. In total, 9559 guides were included that had recognition sites in the genome, and 400 guides were included that had no genomic target sites (Table S3). We designed, cloned, and packaged our CRISPRi screen as previously described (Joung et al., 2017; Klann et al., 2017). Briefly, the guides were synthesized (CustomArray) and cloned into pLV hU6-sgRNA hUbC-dCas9-KRAB-T2a-Puro (a gift from Charles Gersbach, Addgene plasmid # 71236) using NEBuilder HiFi DNA Assembly Master Mix (NEB) as previously described. Lentiviral particles were produced using Lenti-X Packaging Single Shots (Takara Bio) in HEK293T (ATCC) cells according to manufacturer instructions. Glioblastoma cells were transduced at an MOI of ~0.3 and selected with puromycin (0.75 ug/mL). After selection, cells were maintained at ~500x coverage of the sgRNA library and genomic DNA was harvested after 21 days in culture. Guides were amplified using 5 micrograms of genomic DNA in 5 parallel PCR reactions using Premix Taq DNA polymerase (Takara Bio) and the library preparation primers (Klann et al., 2017) (See Table S2). The libraries were purified using PCR Clean DX beads (Aline Biosciences), pooled, and paired-end sequenced on a MiSeq (lllumina) using custom read and index primers (Klann et al., 2017).
Karyotype and FISH
FISH was performed on cell suspensions prepared from glioblastoma models using a standard laboratory protocol. Briefly, a dual color probe set was used to detect the presence of EGFR (Spectrum Orange, 7p11.2–p12) and the centromere of chromosome 7 (Spectrum Green, 7p11.1–q11.1) following the manufacturer’s instructions with modifications (Abbott Molecular, Des Plaines, IL). Both interphase and metaphase cells were analyzed. At least 10 metaphase chromosome spreads were examined, and images were captured using Leica DM6 via a 60X oil objective and CytoVision imaging system (Leica Microsystems, Buffalo Grove, IL).
Circular Chromosome Conformation Capture Sequencing (4C-seq)
Circular chromosome conformation capture sequencing was used to study the topology of the unamplified and amplified EGFR locus in two glioblastoma models, GBM3565 and GSC23. The glioblastoma models were grown in serum-free conditions as described above and underwent 4C-seq with steps and reagents as previously described (Splinter et al., 2012). Briefly, after dissociation with Accutase (Innovative Cell Technologies, Inc.), 10 million glioblastoma cells were crosslinked with 1% formaldehyde in PBS for 10 minutes, with 1M glycine used to stop crosslinking. Cells were lysed with a solution of 50 mM Tris-HCI pH 7.5, 150 mM NaCI, 5 mM EDTA, 0.5% NP-40, 1% Triton X-100 and 1x protease inhibitor and nuclei were isolated. Initial chromatin digestion was performed at 37°C and 900 rpm in a Eppendorf Thermomixer in 1x restriction buffer with SDS and Triton X-100 with the primary cutter restriction enzyme Dpnll (NEB) (a modification of Splinter et al., 2012) with 200 U of enzyme before overnight digestion added each morning and evening for 2 days of digestion. The restriction enzyme was heat inactivated for 20 minutes at 65°C, and the DNA was ligated with 50 U of T4 DNA Ligase (Roche, #799009). Crosslinks were reversed with Proteinase K overnight at 65°C, and DNA was extracted with a standard laboratory phenol-chloroform DNA extraction. Second restriction enzyme digestion was performed at 37°C in 1x restriction buffer with the primary cutter restriction enzyme CviQI (NEB) (a modification of Splinter et al., 2012) with 50 U of enzyme for one overnight digestion. The restriction enzyme was heat inactivated for 20 minutes at 65°C, and DNA extracted with a standard laboratory phenol-chloroform extraction. Circular DNA (the 4C template) was created with ligation of 100 U T4 DNA Ligase (Roche, #799009) overnight at 16°C. DNA was again extracted with a phenol-chloroform extraction. To obtain a comprehensive understanding of the topology of the EGFR locus, sequencing adapter oligonucleotides for 4C-seq (provided in Table S2) were used to obtain 5 different viewpoints at the EGFR locus: EGFR Enhancer 1, EGFR Enhancer 2, the 5’ CTCF loop domain boundary, approximately 800 bp upstream of EGFR TSS, and 2000 bp downstream of the EGFR TSS. PCR was used with the previous adapters to obtain the sequencing libraries. Template (20 ng for GBM3565, 200 ng for GSC23) and was amplified in 1.12 nmol of adapters in 50 uL reactions with the High-Fidelity PCR Master (Roche) reaction mix for the following parameters: 2 minutes 94°C; and 29 repeats of 10 seconds 94°C, 1 minute 55°C, 3 minutes of 68°C; 5 minutes 68°C; hold at 12°C. Finally, both QIAquick PCR Purification Kit (Qiagen) and PCRCIean DX beads (Aline Bioscience) were used to purify libraries. Oligonucleotides 4C-seq libraries were sequenced as single-end, 60-basepair reads on an lllumina HiSeq 2500 platform at the University of Chicago Genomics Facility.
QUANTIFICATION AND STATISTICAL ANALYSIS
Proliferation and qRT-PCR experiments
For both the proliferation and qRT-PCR experiments, data from three independent biological replicates were used to determine the average and standard deviation. T-tests were used to compare the differences between un-induced and doxycycline induced groups. Please see legends for p values and details of the particular experiments.
ChlP-seq analysis and downstream processing
In addition to ChlP-seq performed specifically for this study, several publicly available sources of H3K27ac ChlP-seq data were collected for as a source of cancer reference epigenomes for integration of with copy number data. Notably paired-end ChlP-seq of the patient-derived glioblastoma cells and several neural stem cells from our laboratory used extensively in this study was recently published (Mack et al., 2019) and is available at GEO accession GSE119755.
Reads were trimmed for quality and to remove adapter sequences using the Trim Galore! Software (https://www.bioinformatics.babraham.ac.uk/proiects/trim_galore/). Trimmed reads were aligned to human genome reference hg19 with either BWA-MEM vO.7.15 (Li and Durbin, 2009) for glioblastoma models or bowtie2 v2.3.2 (Langmead and Salzberg, 2012) for Wilms tumor. Binary sequence alignment map (BAM) files were then sorted with SAMtools v1.8 (Li et al., 2009), and PCR duplicates were removed with Picard v2.1.0 (https://broadinstitute.qithub.io/picard/). Peaks were called using MACS2 v2.1.1 (Zhang et al., 2008) using an input control and thresholded at a significant enrichment of q < 0.001. Aggregate tracks were created using the median value of 6 glioblastoma models. Peak recurrence was called based on how many individual samples in a given cancer had an overlapping peak at a given location. Bigwig tracks were created from deeptools “bamCoverage” (Ramirez et al., 2016) or downloaded from an available database and visualized with the Integrative Genomics Viewer (Robinson et al., 2011). Normalized peak size was quantified using the SAMtools “bedcov” command to count reads in genomic regions and SAMtools “flagstat” command to count aligned reads, then dividing the average read count per 1 kb of the region by the number of aligned reads for the sample in millions. Distal active regulatory elements (putative enhancers) were derived by subtracting peaks overlapping within a +/− 2kb window from the transcription start site of all genes in the refseq database, and also subtracting peaks from known blacklist regions (Encode Project Consortium, 2012).
Super-enhancers were called with the Ranking of Super Enhancer (ROSE) algorithm set at the default parameters (Loven et al., 2013; Whyte et al., 2013).
RNA-seq Analysis
RNA-seq from the patient-derived glioblastoma cell models was generated in our laboratory, now published (Mack et al., 2019) and available at GEO Accession GSE119834. The RNA-seq for the were analyzed with the quasi-mapping tool Salmon (Patro et al., 2017) to quantify transcripts across the samples.
Copy Number Analysis and Identification of Focal Amplifications
TCGA (breast (The Cancer Genome Atlas Network, 2012), liver (The Cancer Genome Atlas Research Network, 2017), head and neck (The Cancer Genome Atlas Network, 2015), glioblastoma (Brennan et al., 2013), lung squamous (The Cancer Genome Atlas Research Network, 2012), and bladder cancers (The Cancer Genome Atlas Research Network, 2012)) and TARGET (Wilms tumor (Gadd et al., 2017)) log2(Fold change copy number ratio) data were downloaded from the ICGC data portal DCC data release 25 (https://dcc.icgc.org/releases). Raw Affymetrix SNP 6.0 microarray data from medulloblastoma were downloaded from the GEO accession GSE37385 (Northcott et al., 2012), and the data were transformed into segmented copy number ratios with Rawcopy (Mayrhofer et al., 2016). A neuroblastoma cohort was collected from GEO accession GSE12494 (Chen et al., 2008), and the log2(FC copy number ratio) values for individual SNPs were converted to hg19 coordinates using the UCSC liftover utility and segmented using R package DNAcopy (Venkatraman and Olshen, 2007). All analyses were performed using the human genome reference sequence hg19.
Focal amplification events likely derived from breakage-fusion-bridge and extrachromosomal amplifications rather than tandem duplications and chromosome arm-level events, were enriched by filtering segmented focal amplification calls to include those with a log2(fold change copy number ratio) >= 1.8 (corresponding to copy number ~ 7). For each cancer, the amplifications were overlapped with known oncogenes from COSMIC v81 Cancer Gene Census (cancer.sanger.ac.uk)(Forbes et al., 2017; Sondka et al., 2018). The log2(FC copy number ratio) values were universally higher than expected across TARGET cohort Wilms tumor samples, so amplification events were excluded unless they overlapped with known MYCN, which was previously shown to be amplified in the tumor (Schaub et al., 2007).
Only amplification events that are continuous with the oncogene were considered, with the exception that nearby amplification events were merged with the oncogene-containing-amplicon if there was less than a 30 kb gap and the amplicon was at least 80% of the log2(FC ratio) level of the main amplification. Amplifications were further filtered to include only those that have similar copy number levels between transcription start and termination sites. Oncogenes were excluded unless they were amplified in 5 or more samples within the same cancer.
Integration of Focal Amplification Events with Reference Epigenomes
Focal oncogene amplification regions for each cancer were overlapped with putative enhancer elements (i.e., distal H3K27ac marks, specifically external to the oncogene) that were present in 50% or more of the reference epigenomes of the matching cancer. Importantly, the reference epigenome sets for each cancer were from cell lines, tumors, or patient-derived models rather than normal-tissue references. For Figure 6C, the most recurrently overlapped singular enhancer for an oncogene was reported as a fraction of the oncogene amplifications with which it overlapped.
For this analysis, reference H3K27ac ChlP-seq epigenomes were used from the following resources: glioblastoma from GEO: GSE126774 (Mack et al., 2019); medulloblastoma for lines D283 and D341 GEO: GSE37385 (Boulay et al., 2017); bladder cancer lines 5637, T24, J82 cell lines from GEO: GSM1948904, GSM1948906, GSM1948902 (Pattison et al., 2016); liver cancer line HEPG2 from GEO: GSM733743 (Encode Project Consortium, 2012); twelve unamplified neuroblastoma lines from GEO: GSE90683 (Boeva et al., 2017); and breast cancer tumors from ENA: PRJEB22757 (Patten et al., 2018).
Skewing analyses
A Monte Carlo method was used to determine the significance of the skew of each of the amplification events. Amplicons were shuffled to simulate the null hypothesis that the oncogene is the only region of the amplicon under positive selection. Shuffling maintains the same distribution of oncogene amplification sizes that are found within the samples of a particular oncogene-cancer combination. For ten thousand iterations, every sample in a cancer-oncogene combination was shuffled randomly once according to a uniform distribution, such that the amplicon still contained the oncogene. The actual unmodified cohort of oncogene amplifications was compared to the simulated groups of amplifications to detect whether co-amplifications of adjacent regions (i.e., skewing of the amplicons) occurred at a higher frequency than what would be expected by the simulations. Adjacent areas were considered to be significantly skewed if the actual group of amplifications for the oncogene did not extend to that distance in any of the ten thousand simulations (P < 0.0001).
Enhancer landscape similarity analysis
H3K27ac ChlP-seq samples from the Roadmap Epigenomics project (Roadmap Epigenomics et al., 2015) were downloaded from the re-analysis by the ENCODE project (https://www.encodeproject.org). Embryonic kidney was included in the Epigenomics Roadmap for several histone marks but not H3K27ac, so the dataset was supplemented from H3K27ac ChlP-seq of embryonic kidney from GEO accession GSE73867 (O’Brien et al., 2016).
To determine the similarity of the H3K27ac profiles within the regions of skew between cancer and normal tissues, reads in 200 bp bins were counted using “samtools bedcov” (Li et al., 2009) across the region of skew for each oncogene (MYCN in Wilms tumor, MYCN in neuroblastoma, EGFR in glioblastoma) and normalized by the number of aligned reads within the sample. Specifically, the representative cancer lines or tissues were GSC23 (glioblastoma), CLB-GA (neuroblastoma), or Wilms tumor 5 (Wilms tumor). After obtaining a normalized read count, the read counts were scaled to the mean read count within each sample using R “scale” function. Pearson correlation was used between the normalized read counts of the cancer samples and that of each of normal tissues. Correlations were plotted ranked from lowest correlation to highest.
In Figure 2, glioblastoma and neural stem cell ChlP-seq H3K27ac ChlP-seq (Mack et al., 2019) is viewed with neural stem cell SOX2 ChlP-seq from GEO: GSE69479 (Zhou et al., 2016), MGG8TPC SOX2 ChlP-seq from GEO: GSE54047 (Suva et al., 2014), GBM3565 Pol2 ChlP-seq GEO: GSE74520 (Miller et al., 2017), and glioblastoma cell model G489 ATAC-seq from GEO: GSE96088 (Park et al., 2017).
In Figure 6, Wilms tumor ChlP-seq was visualized alongside embryonic kidney SIX1, SIX2, and H3K27ac ChlP-seq from human embryonic kidney samples available from GEO accession GSE73865 (O’Brien et al., 2016). Neuroblastoma aggregate H3K27ac ChlP-seq from GEO: GSE90683 (Boeva et al., 2017) was viewed next to Human embryonic adrenal H3K27ac ChlP-seq (Roadmap Epigenomics et al., 2015), as well as BE(2)-C Neuroblastoma MYCN and TWIST1 ChlP-seq from GEO: GSE80151 (Zeid et al., 2018), and BE(2)-C Neuroblastoma GATA3 ChlP-seq from GEO: GSM1602668 (Oldridge et al., 2015). In Figure S6, medulloblastoma amplifications are viewed next to MB-1M21 H3K27ac ChlP-seq (Lin et al., 2016).
Extrachromosomal DNA amplification reconstruction and visualization
Paired-end ChlP-seq and input were used to detect chromosomal rearrangements in the glioblastoma models. Delly vO.7.5 (Rausch et al., 2012b) was used to detect chromosomal rearrangements genome-wide in these models. Rearrangements were confirmed by inspection on the Integrative Genome Viewer (IGV). CopyWriteR was used to identify regions of amplification (Kuilman et al., 2015), and the Delly-detected rearrangements, with at least 2 supporting reads, were used to manually connect the regions of amplification to reconstruct the architecture of the amplicon. With the amplicons amplified to such a high copy number, many breakpoints had more than 5 supporting split or paired reads. CIRCOS (Krzywinski et al., 2009) was used to visualize the reconstructed circular amplicons.
Circular chromosome conformation capture sequencing (4C-seq) analysis
The 4C-seq data were analyzed with 4cseqpipe (van de Werken et al., 2012) using the default parameters. The 4C-seq data were viewed in the context of HiC data (Johnston et al., 2019) from the glioblastoma model G567.
CRISPRi screen analysis
The sgRNAs were quantified using scripts from (Joung et al., 2017) and the day 21 abundances were compared to the plasmid library DNA abundances after normalizing for library read depth. To assess the significance of individual regions within a single cell line, we created a CRISPRi score based on rolling average across 20 sgRNAs. We created null distribution of random 20 sgRNA average fold changes by repeatedly sampling 1,000,000 times from 400 genomic nontargeting sgRNAs. With this sampled distribution, we fit a normal distribution and used the distribution to calculate p values for rolling average sgRNAs across the locus and controlled for False Discovery Rate (FDR) < 0.01 using Benjamini Hochberg. We confirmed our shared depleted and enriched regulatory regions using CRISPR-SURF (Hsu et al., 2018) (Figure S5).
DATA AND CODE AVAILABILITY
Sequencing data files are available on the Gene Expression Omnibus (GEO) in a SuperSeries with the accession GSE139417.
Supplementary Material
Figure S1. Related to Figure 1. CRISPRi of glioblastoma-dependency gene SQLE. (a-) Whisker-box plots showing for KRAB-dCas9 induced (Dox) and uninduced (Ctrl) cells after 8 days of culture: expression of EGFR (a) and SQLE (b), as detected by RT-qPCR; and cell viability as detected by Alamar Blue staining (d). Relationship between cell viability and EGFR or SQLE knockdown for each sgRNA tested. For (a) and (b), n=3 experiments per sgRNA with 2–3 technical replicates); for (c), n=3 per sgRNA. A t-test was used for significance (* p≤0.05, ** p≤0.01, *** p≤0.001 using all technical replicates compared to the untreated control).
Figure S2. Related to Figure 3. EGFR locus histone acetylation and RNA levels scaled by copy number. (a) H3K27ac ChlP-seq tracks of the EGFR upstream region for two EGFR amplified and two un-amplified glioblastoma models. (b) A scatter plot indicating, for all glioblastoma stem cell models profiled, copy number and normalized H3K27ac peak size for the three peaks at the EGFR locus. Peak size was calculated by normalizing read count to the width of the peak and number of aligned reads in the sample. (c) Scatter plot for EGFR mRNA expression and copy number for the glioblastoma stem cell cohort. For (b) and (c), the lines and accompanying R2 values were calculated by linear regression.
Figure S3. Related to Figure 3. Amplification of EGFR on double minute chromosomes in GBM3094. (a) Metaphase FISH in GBM3094 cells. DAPI stain, the EGFR probe, and centromere 7 (CEP7) are indicated by blue, red, and green, respectively. In the inset, extrachromosomal EGFR is shown by white arrows. (b) Read depth across chromosome 7 for GBM3094. Intrachromosomal and interchromosomal rearrangements are indicated by blue and orange, respectively.
Figure S4. Related to Figure 4. EGFR locus 4C-seq data for unamplified and amplified glioblastoma models. (a-b) 4C-seq of un-amplified GSC23 (a) and amplified GBM3565 (b). (Top-bottom for a and b) H3K27ac ChlP-seq. EGFR 4C-seq experiments, with viewpoints from ~1 kb upstream of the EGFR promoter, EGFR enhancer 1, and EGFR enhancer 2, and the 5’ loop boundary. Anchors represent the 4C-seq viewpoint, and red octagons denote the location of the EGFR loop domain boundary. Additionally, CTCF ChlP-seq is included for GBM3565 in (b).
Figure S5. Related to Figure 5. Rolling average fold change CRISPRi screen results. CRISPRi rolling 20 sgRNA rolling average log2(FC) at the conclusion of the screen for GSC23 (Green) and GBM3565 (blue). H3K27ac ChlP-seq tracks for GSC23 (Green) and GBM3565 (blue). Gray boxes indicate significantly depleted regions shared in the two lines as assessed by CRISPR-SURF.
Figure S6. Related to Figure 6. Skewing of MYC focal amplification events in medulloblastoma with respect to a distant upstream super-enhancer. MYC amplification skewing in medulloblastoma includes an upstream super-enhancer. (Top-bottom) H3K27ac ChlP-seq data from MB-121 medulloblastoma tumor (top). Copy-number profile of 29 medulloblastomas, with the region of skew indicated by the green bar (P < 0.0001 by Monte Carlo simulation) (bottom).
Table S3. Related to Figure 5. CRISPRi library sequences.
HIGHLIGHTS.
Enhancers active in the cell-of-origin are co-amplified with oncogenes
Circular extrachromosomal amplicons are associated with enhancer rewiring
Endogenous and new enhancers on amplicons contribute to cell proliferation
Skewed co-amplification that selects enhancers is found across several tumor types
ACKNOWLEDGMENTS
We thank NIH funding GM007250, TR000441, and CA236313 (A.R.M.); CA160356, CA193677, CA204279, CA143237, and the generous support of Dan Weidenthal (PCS); and CA197718, CA154130, CA169117, CA171652, NS087913, NS089272, and NS103434 (J.N.R). We also thank members of the Scacheri, Rich, and Tesar laboratories for discussion and feedback on the project. We thank Dr. Harris and her laboratory for 4C-seq expertise. This work made use of the High Performance Computing Resource in the Core Facility for Advanced Research Computing at Case Western Reserve University.
Footnotes
DECLARATION OF INTERESTS
The authors declare no competing interests.
Publisher's Disclaimer: This is a PDF file of an unedited manuscript that has been accepted for publication. As a service to our customers we are providing this early version of the manuscript. The manuscript will undergo copyediting, typesetting, and review of the resulting proof before it is published in its final form. Please note that during the production process errors may be discovered which could affect the content, and all legal disclaimers that apply to the journal pertain.
REFERENCES
- Akhtar-Zaidi B, Cowper-Sal-lari R, Corradin O, Saiakhova A, Bartels CF, Balasubramanian D, Myeroff L, Lutterbaugh J, Jarrar A, Kalady MF, et al. (2012). Epigenomic enhancer profiling defines a signature of colon cancer. Science 336, 736–739. [DOI] [PMC free article] [PubMed] [Google Scholar]
- Bao S, Wu Q, McLendon RE, Hao Y, Shi Q, Hjelmeland AB, Dewhirst MW, Bigner DD, and Rich JN (2006). Glioma stem cells promote radioresistance by preferential activation of the DNA damage response. Nature 444, 756–760. [DOI] [PubMed] [Google Scholar]
- Beroukhim R, Zhang X, and Meyerson M. (2016). Copy number alterations unmasked as enhancer hijackers. Nat Genet 49, 5–6. [DOI] [PubMed] [Google Scholar]
- Boeva V, Louis-Brennetot C, Peltier A, Durand S, Pierre-Eugene C, Raynal V, Etchevers HC, Thomas S, Lermine A, Daudigeos-Dubus E, et al. (2017). Heterogeneity of neuroblastoma cell identity defined by transcriptional circuitries. Nat Genet 49, 1408–1413. [DOI] [PubMed] [Google Scholar]
- Boulay G, Awad ME, Riggi N, Archer TC, Iyer S, Boonseng WE, Rossetti NE, Naigles B, Rengarajan S, Volorio A, et al. (2017). OTX2 Activity at Distal Regulatory Elements Shapes the Chromatin Landscape of Group 3 Medulloblastoma. Cancer Discov 7, 288–301. [DOI] [PMC free article] [PubMed] [Google Scholar]
- Brennan CW, Verhaak RG, McKenna A, Campos B, Noushmehr H, Salama SR, Zheng S, Chakravarty D, Sanborn JZ, Berman SH, et al. (2013). The somatic genomic landscape of glioblastoma. Cell 155, 462–477. [DOI] [PMC free article] [PubMed] [Google Scholar]
- Chen Y, Takita J, Choi YL, Kato M, Ohira M, Sanada M, Wang L, Soda M, Kikuchi A, Igarashi T, et al. (2008). Oncogenic mutations of ALK kinase in neuroblastoma. Nature 455, 971–974. [DOI] [PubMed] [Google Scholar]
- Dedes KJ, Lopez-Garcia MA, Geyer FC, Lambros MB, Savage K, Vatcheva R, Wilkerson P, Wetterskog D, Lacroix-Triki M, Natrajan R, et al. (2010). Cortactin gene amplification and expression in breast cancer: a chromogenic in situ hybridisation and immunohistochemical study. Breast Cancer Res Treat 124, 653–666. [DOI] [PubMed] [Google Scholar]
- Dixon JR, Selvaraj S, Yue F, Kim A, Li Y, Shen Y, Hu M, Liu JS, and Ren B. (2012). Topological domains in mammalian genomes identified by analysis of chromatin interactions. Nature 485, 376–380. [DOI] [PMC free article] [PubMed] [Google Scholar]
- Ellis P, Fagan BM, Magness ST, Hutton S, Taranova O, Hayashi S, McMahon A, Rao M, and Pevny L. (2004). SOX2, a persistent marker for multipotential neural stem cells derived from embryonic stem cells, the embryo or the adult. Dev Neurosci 26, 148–165. [DOI] [PubMed] [Google Scholar]
- Encode Project Consortium (2012). An integrated encyclopedia of DNA elements in the human genome. Nature 489, 57–74. [DOI] [PMC free article] [PubMed] [Google Scholar]
- Forbes SA, Beare D, Boutselakis H, Bamford S, Bindal N, Tate J, Cole CG, Ward S, Dawson E, Ponting L, et al. (2017). COSMIC: somatic cancer genetics at high-resolution. Nucleic Acids Res 45, D777–D783. [DOI] [PMC free article] [PubMed] [Google Scholar]
- Gadd S, Huff V, Walz AL, Ooms A, Armstrong AE, Gerhard DS, Smith MA, Auvil JMG, Meerzaman D, Chen QR, et al. (2017). A Children’s Oncology Group and TARGET initiative exploring the genetic landscape of Wilms tumor. Nat Genet 49, 1487–1494. [DOI] [PMC free article] [PubMed] [Google Scholar]
- Groschel S, Sanders MA, Hoogenboezem R, de Wit E, Bouwman BA, Erpelinck C, van der Velden VH, Havermans M, Avellino R, van Lom K, et al. (2014). A single oncogenic enhancer rearrangement causes concomitant EVI1 and GATA2 deregulation in leukemia. Cell 157, 369–381. [DOI] [PubMed] [Google Scholar]
- Hnisz D, Abraham BJ, Lee TI, Lau A, Saint-Andre V, Sigova AA, Hoke HA, and Young RA (2013). Super-enhancers in the control of cell identity and disease. Cell 155, 934–947. [DOI] [PMC free article] [PubMed] [Google Scholar]
- Hsu JY, Fulco CP, Cole MA, Canver MC, Pellin D, Sher F, Farouni R, Clement K, Guo JA, Biasco L, et al. (2018). CRISPR-SURF: discovering regulatory elements by deconvolution of CRISPR tiling screen data. Nat Methods 15, 992–993. [DOI] [PMC free article] [PubMed] [Google Scholar]
- Hsu PD, Scott DA, Weinstein JA, Ran FA, Konermann S, Agarwala V, Li Y, Fine EJ, Wu X, Shalem O, et al. (2013). DNA targeting specificity of RNA-guided Cas9 nucleases. Nat Biotechnol 31, 827–832. [DOI] [PMC free article] [PubMed] [Google Scholar]
- Jiang M, Stanke J, and Lahti JM (2011). The connections between neural crest development and neuroblastoma. CurrTop Dev Biol 94, 77–127. [DOI] [PMC free article] [PubMed] [Google Scholar]
- Johnston MJ, Nikolic A, Ninkovic N, Guilhamon P, Cavalli FMG, Seaman S, Zemp FJ, Lee J, Abdelkareem A, Ellestad K, et al. (2019). High-resolution structural genomics reveals new therapeutic vulnerabilities in glioblastoma. Genome Res 29, 1211–1222. [DOI] [PMC free article] [PubMed] [Google Scholar]
- Joung J, Konermann S, Gootenberg JS, Abudayyeh OO, Platt RJ, Brigham MD, Sanjana NE, and Zhang F. (2017). Genome-scale CRISPR-Cas9 knockout and transcriptional activation screening. Nat Protoc 12, 828–863. [DOI] [PMC free article] [PubMed] [Google Scholar]
- Kendall J, Liu Q, Bakleh A, Krasnitz A, Nguyen KC, Lakshmi B, Gerald WL, Powers S, and Mu D. (2007). Oncogenic cooperation and coamplification of developmental transcription factor genes in lung cancer. Proc Natl Acad Sci U S A 104, 16663–16668. [DOI] [PMC free article] [PubMed] [Google Scholar]
- Klann TS, Black JB, Chellappan M, Safi A, Song L, Hilton IB, Crawford GE, Reddy TE, and Gersbach CA (2017). CRISPR-Cas9 epigenome editing enables high-throughput screening for functional regulatory elements in the human genome. Nat Biotechnol 35, 561–568. [DOI] [PMC free article] [PubMed] [Google Scholar]
- Kobayashi A, Valerius MT, Mugford JW, Carroll TJ, Self M, Oliver G, and McMahon AP (2008). Six2 defines and regulates a multipotent self-renewing nephron progenitor population throughout mammalian kidney development. Cell Stem Cell 3, 169–181. [DOI] [PMC free article] [PubMed] [Google Scholar]
- Korbel JO, and Campbell PJ (2013). Criteria for inference of chromothripsis in cancer genomes. Cell 152, 1226–1236. [DOI] [PubMed] [Google Scholar]
- Krzywinski M, Schein J, Birol I, Connors J, Gascoyne R, Horsman D, Jones SJ, and Marra MA (2009). Circos: an information aesthetic for comparative genomics. Genome Res 19, 1639–1645. [DOI] [PMC free article] [PubMed] [Google Scholar]
- Kuilman T, Velds A, Kemper K, Ranzani M, Bombardelli L, Hoogstraat M, Nevedomskaya E, Xu G, de Ruiter J, Lolkema MP, et al. (2015). CopywriteR: DNA copy number detection from off-target sequence data. Genome Biol 16, 49. [DOI] [PMC free article] [PubMed] [Google Scholar]
- Labun K, Montague TG, Gagnon JA, Thyme SB, and Valen E. (2016). CHOPCHOP v2: a web tool for the next generation of CRISPR genome engineering. Nucleic Adds Res 44, W272–276. [DOI] [PMC free article] [PubMed] [Google Scholar]
- Langmead B, and Salzberg SL (2012). Fast gapped-read alignment with Bowtie 2. Nat Methods 9, 357–359. [DOI] [PMC free article] [PubMed] [Google Scholar]
- Li H, and Durbin R. (2009). Fast and accurate short read alignment with Burrows-Wheeler transform. Bioinformatics 25, 1754–1760. [DOI] [PMC free article] [PubMed] [Google Scholar]
- Li H, Handsaker B, Wysoker A, Fennell T, Ruan J, Homer N, Marth G, Abecasis G, Durbin R, and Genome Project Data Processing, S. (2009). The Sequence Alignment/Map format and SAMtools. Bioinformatics 25, 2078–2079. [DOI] [PMC free article] [PubMed] [Google Scholar]
- Lin CY, Erkek S, Tong Y, Yin L, Federation AJ, Zapatka M, Haldipur P, Kawauchi D, Risch T, Warnatz HJ, et al. (2016). Active medulloblastoma enhancers reveal subgroup-specific cellular origins. Nature 530, 57–62. [DOI] [PMC free article] [PubMed] [Google Scholar]
- Loven J, Hoke HA, Lin CY, Lau A, Orlando DA, Vakoc CR, Bradner JE, Lee TI, and Young RA (2013). Selective inhibition of tumor oncogenes by disruption of superenhancers. Cell 153, 320–334. [DOI] [PMC free article] [PubMed] [Google Scholar]
- Mack SC, Singh I, Wang X, Hirsch R, Wu Q, Villagomez R, Bernatchez JA, Zhu Z, Gimple RC, Kim LJY, et al. (2019). Chromatin landscapes reveal developmentally encoded transcriptional states that define human glioblastoma. J Exp Med 216, 1071–1090. [DOI] [PMC free article] [PubMed] [Google Scholar]
- Mayrhofer M, Viklund B, and Isaksson A. (2016). Rawcopy: Improved copy number analysis with Affymetrix arrays. Sei Rep 6, 36158. [DOI] [PMC free article] [PubMed] [Google Scholar]
- Miller TE, Liau BB, Wallace LC, Morton AR, Xie Q, Dixit D, Factor DC, Kim LJY, Morrow JJ, Wu Q, et al. (2017). Transcription elongation factors represent in vivo cancer dependencies in glioblastoma. Nature 547, 355–359. [DOI] [PMC free article] [PubMed] [Google Scholar]
- Nora EP, Lajoie BR, Schulz EG, Giorgetti L, Okamoto I, Servant N, Piolot T, van Berkum NL, Meisig J, Sedat J, et al. (2012). Spatial partitioning of the regulatory landscape of the X-inactivation centre. Nature 485, 381–385. [DOI] [PMC free article] [PubMed] [Google Scholar]
- Northcott PA, Lee C, Zichner T, Stutz AM, Erkek S, Kawauchi D, Shih DJ, Hovestadt V, Zapatka M, Sturm D, et al. (2014). Enhancer hijacking activates GFI1 family oncogenes in medulloblastoma. Nature 511, 428–434. [DOI] [PMC free article] [PubMed] [Google Scholar]
- Northcott PA, Shih DJ, Peacock J, Garzia L, Morrissy AS, Zichner T, Stutz AM, Korshunov A, Reimand J, Schumacher SE, et al. (2012). Subgroup-specific structural variation across 1,000 medulloblastoma genomes. Nature 488, 49–56. [DOI] [PMC free article] [PubMed] [Google Scholar]
- O’Brien LL, Guo Q, Lee Y, Tran T, Benazet JD, Whitney PH, Valouev A, and McMahon AP (2016). Differential regulation of mouse and human nephron progenitors by the Six family of transcriptional regulators. Development 143, 595–608. [DOI] [PMC free article] [PubMed] [Google Scholar]
- Oldridge DA, Wood AC, Weichert-Leahey N, Crimmins I, Sussman R, Winter C, McDaniel LD, Diamond M, Hart LS, Zhu S, et al. (2015). Genetic predisposition to neuroblastoma mediated by a LM01 super-enhancer polymorphism. Nature 528, 418–421. [DOI] [PMC free article] [PubMed] [Google Scholar]
- Park NI, Guilhamon P, Desai K, McAdam RF, Langille E, O’Connor M, Lan X, Whetstone H, Coutinho FJ, Vanner RJ, et al. (2017). ASCL1 Reorganizes Chromatin to Direct Neuronal Fate and Suppress Tumorigenicity of Glioblastoma Stem Cells. Cell Stem Cell 21, 209–224 e207. [DOI] [PubMed] [Google Scholar]
- Patro R, Duggal G, Love MI, Irizarry RA, and Kingsford C. (2017). Salmon provides fast and bias-aware quantification of transcript expression. Nat Methods 14, 417–419. [DOI] [PMC free article] [PubMed] [Google Scholar]
- Patten DK, Corleone G, Gyorffy B, Perone Y, Slaven N, Barozzi I, Erdos E, Saiakhova A, Goddard K, Vingiani A, et al. (2018). Enhancer mapping uncovers phenotypic heterogeneity and evolution in patients with luminal breast cancer. Nat Med 24, 1469–1480. [DOI] [PMC free article] [PubMed] [Google Scholar]
- Pattison JM, Posternak V, and Cole MD (2016). Transcription Factor KLF5 Binds a Cyclin E1 Polymorphic Intronic Enhancer to Confer Increased Bladder Cancer Risk. Mol Cancer Res 14, 1078–1086. [DOI] [PMC free article] [PubMed] [Google Scholar]
- Ramirez F, Ryan DP, Gruning B, Bhardwaj V, Kilpert F, Richter AS, Heyne S, Dundar F, and Manke T. (2016). deepTools2: a next generation web server for deep-sequencing data analysis. Nucleic Acids Res 44, W160–165. [DOI] [PMC free article] [PubMed] [Google Scholar]
- Rausch T, Jones DT, Zapatka M, Stutz AM, Zichner T, Weischenfeldt J, Jager N, Remke M, Shih D, Northcott PA, et al. (2012a). Genome sequencing of pediatric medulloblastoma links catastrophic DNA rearrangements with TP53 mutations. Cell 148, 59–71. [DOI] [PMC free article] [PubMed] [Google Scholar]
- Rausch T, Zichner T, Schlattl A, Stutz AM, Benes V, and Korbel JO (2012b). DELLY: structural variant discovery by integrated paired-end and split-read analysis. Bioinformatics 28, ¡333–i339. [DOI] [PMC free article] [PubMed] [Google Scholar]
- Rivera MN, and Haber DA (2005). Wilms’ tumour: connecting tumorigenesis and organ development in the kidney. Nat Rev Cancer 5, 699–712. [DOI] [PubMed] [Google Scholar]
- Roadmap Epigenomics C, Kundaje A, Meuleman W, Ernst J, Bilenky M, Yen A, Heravi-Moussavi A, Kheradpour P, Zhang Z, Wang J, et al. (2015). Integrative analysis of 111 reference human epigenomes. Nature 518, 317–330. [DOI] [PMC free article] [PubMed] [Google Scholar]
- Robinson JT, Thorvaldsdottir H, Winckler W, Guttman M, Lander ES, Getz G, and Mesirov JP (2011). Integrative genomics viewer. Nat Biotechnol 29, 24–26. [DOI] [PMC free article] [PubMed] [Google Scholar]
- Sanborn JZ, Salama SR, Grifford M, Brennan CW, Mikkelsen T, Jhanwar S, Katzman S, Chin L, and Haussler D. (2013). Double minute chromosomes in glioblastoma multiforme are revealed by precise reconstruction of oncogenic amplicons. Cancer Res 73, 6036–6045. [DOI] [PMC free article] [PubMed] [Google Scholar]
- Savic D, Gertz J, Jain P, Cooper GM, and Myers RM (2013). Mapping genome-wide transcription factor binding sites in frozen tissues. Epigenetics Chromatin 6, 30. [DOI] [PMC free article] [PubMed] [Google Scholar]
- Schaub R, Burger A, Bausch D, Niggli FK, Schafer BW, and Betts DR (2007). Array comparative genomic hybridization reveals unbalanced gain of the MYCN region in Wilms tumors. Cancer Genet Cytogenet 172, 61–65. [DOI] [PubMed] [Google Scholar]
- Schmidt D, Wilson MD, Spyrou C, Brown GD, Hadfield J, and Odom DT (2009). ChlP-seq: using high-throughput sequencing to discover protein-DNA interactions. Methods 48, 240–248. [DOI] [PMC free article] [PubMed] [Google Scholar]
- Sondka Z, Bamford S, Cole CG, Ward SA, Dunham I, and Forbes SA (2018). The COSMIC Cancer Gene Census: describing genetic dysfunction across all human cancers. Nat Rev Cancer 18, 696–705. [DOI] [PMC free article] [PubMed] [Google Scholar]
- Splinter E, de Wit E, van de Werken HJ, Klous P, and de Laat W. (2012). Determining long-range chromatin interactions for selected genomic sites using 4C-seq technology: from fixation to computation. Methods 58, 221–230. [DOI] [PubMed] [Google Scholar]
- Stephens PJ, Greenman CD, Fu B, Yang F, Bignell GR, Mudie LJ, Pleasance ED, Lau KW, Beare D, Stebbings LA, et al. (2011). Massive genomic rearrangement acquired in a single catastrophic event during cancer development. Cell 144, 27–40. [DOI] [PMC free article] [PubMed] [Google Scholar]
- Suva ML, Rheinbay E, Gillespie SM, Patel AP, Wakimoto H, Rabkin SD, Riggi N, Chi AS, Cahill DP, Nahed BV, et al. (2014). Reconstructing and reprogramming the tumor-propagating potential of glioblastoma stem-like cells. Cell 157, 580–594. [DOI] [PMC free article] [PubMed] [Google Scholar]
- Takeda DY, Spisak S, Seo JH, Bell C, O’Connor E, Korthauer K, Ribli D, Csabai I, Solymosi N, Szallasi Z, et al. (2018). A Somatically Acquired Enhancer of the Androgen Receptor Is a Noncoding Driver in Advanced Prostate Cancer. Cell 174, 422– 432 e413. [DOI] [PMC free article] [PubMed] [Google Scholar]
- The Cancer Genome Atlas Network (2012). Comprehensive molecular portraits of human breast tumours. Nature 490, 61–70. [DOI] [PMC free article] [PubMed] [Google Scholar]
- The Cancer Genome Atlas Network (2015). Comprehensive genomic characterization of head and neck squamous cell carcinomas. Nature 517, 576–582. [DOI] [PMC free article] [PubMed] [Google Scholar]
- The Cancer Genome Atlas Research Network (2012). Comprehensive genomic characterization of squamous cell lung cancers. Nature 489, 519–525. [DOI] [PMC free article] [PubMed] [Google Scholar]
- The Cancer Genome Atlas Research Network (2017). Comprehensive and Integrative Genomic Characterization of Hepatocellular Carcinoma. Cell 169, 1327–1341 e1323. [DOI] [PMC free article] [PubMed] [Google Scholar]
- Turner KM, Deshpande V, Beyter D, Koga T, Rusert J, Lee C, Li B, Arden K, Ren B, Nathanson DA, et al. (2017). Extrachromosomal oncogene amplification drives tumour evolution and genetic heterogeneity. Nature 543, 122–125. [DOI] [PMC free article] [PubMed] [Google Scholar]
- van de Werken HJ, Landan G, Holwerda SJ, Hoichman M, Klous P, Chachik R, Splinter E, Valdes-Quezada C, Oz Y, Bouwman BA, et al. (2012). Robust 4C-seq data analysis to screen for regulatory DNA interactions. Nat Methods 9, 969–972. [DOI] [PubMed] [Google Scholar]
- Venkatraman ES, and Olshen AB (2007). A faster circular binary segmentation algorithm for the analysis of array CGH data. Bioinformatics 23, 657–663. [DOI] [PubMed] [Google Scholar]
- Viswanathan SR, Ha G, Hoff AM, Wala JA, Carrot-Zhang J, Whelan CW, Haradhvala NJ, Freeman SS, Reed SC, Rhoades J, et al. (2018). Structural Alterations Driving Castration-Resistant Prostate Cancer Revealed by Linked-Read Genome Sequencing. Cell 174, 433–447 e419. [DOI] [PMC free article] [PubMed] [Google Scholar]
- Wang J, Qian J, Hoeksema MD, Zou Y, Espinosa AV, Rahman SMJ, Zhang B, and Massion PP (2013). Integrative Genomics Analysis Identifies Candidate Drivers at 3q26–29 Amplicon in Squamous Cell Carcinoma of the Lung. Clinical Cancer Research 19, 5580–5590. [DOI] [PMC free article] [PubMed] [Google Scholar]
- Whyte WA, Orlando DA, Hnisz D, Abraham BJ, Lin CY, Kagey MH, Rahl PB, Lee TI, and Young RA (2013). Master transcription factors and mediator establish super-enhancers at key cell identity genes. Cell 153, 307–319. [DOI] [PMC free article] [PubMed] [Google Scholar]
- Xu PX, Zheng WM, Huang L, Maire P, Laclef C, and Silvius D. (2003). Six1 is required for the early organogenesis of mammalian kidney. Development 130, 3085–3094. [DOI] [PMC free article] [PubMed] [Google Scholar]
- Zack TI, Schumacher SE, Carter SL, Cherniack AD, Saksena G, Tabak B, Lawrence MS, Zhsng CZ, Wala J, Mermel CH, et al. (2013). Pan-cancer patterns of somatic copy number alteration. Nat Genet 45, 1134–1140. [DOI] [PMC free article] [PubMed] [Google Scholar]
- Zeid R, Lawlor MA, Poon E, Reyes JM, Fulciniti M, Lopez MA, Scott TG, Nabet B, Erb MA, Winter GE, et al. (2018). Enhancer invasion shapes MYCN-dependent transcriptional amplification in neuroblastoma. Nat Genet 50, 515–523. [DOI] [PMC free article] [PubMed] [Google Scholar]
- Zhang CZ, Spektor A, Cornils H, Francis JM, Jackson EK, Liu S, Meyerson M, and Pellman D. (2015). Chromothripsis from DNA damage in micronuclei. Nature 522, 179–184. [DOI] [PMC free article] [PubMed] [Google Scholar]
- Zhang Y, Liu T, Meyer CA, Eeckhoute J, Johnson DS, Bernstein BE, Nusbaum C, Myers RM, Brown M, Li W, et al. (2008). Model-based analysis of ChlP-Seq (MACS). Genome Biol 9, R137. [DOI] [PMC free article] [PubMed] [Google Scholar]
- Zhou C, Yang X, Sun Y, Yu H, Zhang Y, and Jin Y. (2016). Comprehensive profiling reveals mechanisms of SOX2-mediated cell fate specification in human ESCs and NPCs. Cell Res 26, 171–189. [DOI] [PMC free article] [PubMed] [Google Scholar]
Associated Data
This section collects any data citations, data availability statements, or supplementary materials included in this article.
Supplementary Materials
Figure S1. Related to Figure 1. CRISPRi of glioblastoma-dependency gene SQLE. (a-) Whisker-box plots showing for KRAB-dCas9 induced (Dox) and uninduced (Ctrl) cells after 8 days of culture: expression of EGFR (a) and SQLE (b), as detected by RT-qPCR; and cell viability as detected by Alamar Blue staining (d). Relationship between cell viability and EGFR or SQLE knockdown for each sgRNA tested. For (a) and (b), n=3 experiments per sgRNA with 2–3 technical replicates); for (c), n=3 per sgRNA. A t-test was used for significance (* p≤0.05, ** p≤0.01, *** p≤0.001 using all technical replicates compared to the untreated control).
Figure S2. Related to Figure 3. EGFR locus histone acetylation and RNA levels scaled by copy number. (a) H3K27ac ChlP-seq tracks of the EGFR upstream region for two EGFR amplified and two un-amplified glioblastoma models. (b) A scatter plot indicating, for all glioblastoma stem cell models profiled, copy number and normalized H3K27ac peak size for the three peaks at the EGFR locus. Peak size was calculated by normalizing read count to the width of the peak and number of aligned reads in the sample. (c) Scatter plot for EGFR mRNA expression and copy number for the glioblastoma stem cell cohort. For (b) and (c), the lines and accompanying R2 values were calculated by linear regression.
Figure S3. Related to Figure 3. Amplification of EGFR on double minute chromosomes in GBM3094. (a) Metaphase FISH in GBM3094 cells. DAPI stain, the EGFR probe, and centromere 7 (CEP7) are indicated by blue, red, and green, respectively. In the inset, extrachromosomal EGFR is shown by white arrows. (b) Read depth across chromosome 7 for GBM3094. Intrachromosomal and interchromosomal rearrangements are indicated by blue and orange, respectively.
Figure S4. Related to Figure 4. EGFR locus 4C-seq data for unamplified and amplified glioblastoma models. (a-b) 4C-seq of un-amplified GSC23 (a) and amplified GBM3565 (b). (Top-bottom for a and b) H3K27ac ChlP-seq. EGFR 4C-seq experiments, with viewpoints from ~1 kb upstream of the EGFR promoter, EGFR enhancer 1, and EGFR enhancer 2, and the 5’ loop boundary. Anchors represent the 4C-seq viewpoint, and red octagons denote the location of the EGFR loop domain boundary. Additionally, CTCF ChlP-seq is included for GBM3565 in (b).
Figure S5. Related to Figure 5. Rolling average fold change CRISPRi screen results. CRISPRi rolling 20 sgRNA rolling average log2(FC) at the conclusion of the screen for GSC23 (Green) and GBM3565 (blue). H3K27ac ChlP-seq tracks for GSC23 (Green) and GBM3565 (blue). Gray boxes indicate significantly depleted regions shared in the two lines as assessed by CRISPR-SURF.
Figure S6. Related to Figure 6. Skewing of MYC focal amplification events in medulloblastoma with respect to a distant upstream super-enhancer. MYC amplification skewing in medulloblastoma includes an upstream super-enhancer. (Top-bottom) H3K27ac ChlP-seq data from MB-121 medulloblastoma tumor (top). Copy-number profile of 29 medulloblastomas, with the region of skew indicated by the green bar (P < 0.0001 by Monte Carlo simulation) (bottom).
Table S3. Related to Figure 5. CRISPRi library sequences.
Data Availability Statement
Sequencing data files are available on the Gene Expression Omnibus (GEO) in a SuperSeries with the accession GSE139417.