Abstract
Purpose:
To quantify the central visual field (VF) loss patterns in glaucoma using machine-learning.
Design:
Retrospective study.
Participants:
8,712 patients with 13,951 Humphrey 10–2 tests from 13,951 eyes for cross-sectional analyses, and 824 patients with at least five reliable 10–2 tests at 6 or more month intervals from 1191 eyes for longitudinal analyses.
Methods:
Total deviation values were used to determine the central VF patterns using the most recent 10–2 tests. A 24–2 VF within a 3 month window of the 10–2 tests was used to stage eyes into mild, moderate or severe functional loss using the Hodapp-Anderson-Parrish scale at baseline. Archetypal analysis was applied to determine the central VF patterns. Cross-validation was performed to determine the optimal number of patterns. Stepwise regression was applied to select the optimal feature combination of global indices, average baseline decomposition coefficients from central VFs archetypes and other factors to predict central VF mean deviation (MD) slope based on the Bayesian information criterion (BIC).
Main Outcome Measures:
The central VF patterns stratified by severity stage based on 24–2 tests and a model to predict the central VF MD change over time using baseline tests.
Results:
From cross-sectional analysis, 17 distinct central VF patterns were determined for the 13,951 eyes across the spectrum of disease severity. These central VF patterns could be divided into isolated superior loss, isolated inferior loss, diffuse loss and other loss patterns. Notably, 4 of the 5 patterns of diffuse VF loss preserved the less vulnerable inferotemporal zone, while they lost most of the remaining more vulnerable zone described by the Hood model. Inclusion of coefficients from central VFs archetypical patterns strongly improved the prediction of central VF MD slope (BIC decreasing of 35; BIC decreasing > 6 indicating strong prediction improvement) than using only the global indices of two baseline VFs. Eyes with baseline VFs with more superonasal and inferonasal loss were more likely to have worsening MD over time.
Conclusion:
We quantified central VF patterns in glaucoma, which were used to improve the prediction of central VF worsening compared with only using global indices alone.
Introduction
The preservation of central visual function is essential to the care of glaucoma patients.1–3 Modeling central visual function as ascertained from 10–2 visual fields (VFs) with adequate sampling of the central 10 degrees offers an opportunity to categorize patterns of central vision loss in glaucoma and understand factors that contribute to its progression.
While prior studies have documented the 24–2 or 30–2 VF loss patterns in glaucoma patients,4–6 there are few existing analyses concerning 10–2 central VF loss.7,8 Hood et al. analyzed the associations between macular structure and the 10–2 VF in eyes with 24–2 VFs that are normal outside the central 10 degrees, and segmented the 10–2 VF into more and less vulnerable zones.7,8 Specifically, the less vulnerable zone is located in a predominantly inferior temporal region and the more vulnerable zone resides in the remaining 10–2 VF locations. In a subsequent study9 of the abnormal 10–2 hemifields in mild glaucoma, most exhibited an arcuate pattern (68%) while others had diffuse loss (8%), and other miscellaneous defects (25%) based on manual assessment. To date, there has been a lack of detailed and systematic characterization of central VF loss patterns in the literature.
In this work, we aim to investigate systematically the central VF patterns in glaucoma and demonstrate their clinical utility. First, we performed cross-sectional analysis of the central VF patterns from total deviation plots by an unsupervised artificial intelligence (AI) method of archetypal analysis for eyes with all glaucoma severities defined by 24–2 VF mean deviation. Second, we have demonstrated the clinical utilities of the central VF patterns by using them to longitudinally track central VF changes and predict central VF MD slope from two baseline VF’s with follow-up of least 24 months.
Methods
We used the VF data from the Glaucoma Research Network (GRN) consortium, which consists of Massachusetts Eye and Ear, Wilmer Eye Institute, New York Eye and Ear Infirmary, Bascom Palmer Eye Institute, and Wills Eye Hospital. The institutional review boards (IRBs) of all institutions approved this research. The IRBs waived the need for informed consent because of the retrospective and de-identified nature of the study. This study adheres to the declaration of Helsinki.
Participants and Data
Reliable Swedish interactive thresholding algorithm (SITA) Standard 10–2 VFs with stimulus size III measured by the Humphrey Field Analyzer (HFA; Carl Zeiss Meditec, Dublin, CA) were selected for our data analyses. Reliable 24–2 VFs from the same subjects were used to stratify the 10–2 VFs by glaucoma severity. The reliability criteria for VF selection were fixation loss rate ≤ 33%, false negative rate ≤ 20%, and false positive rate ≤ 20%.10–15 Although using these strict reliability criteria can potentially exclude true VF defects in severe glaucoma as it is known that fixation loss, false positive and negative rates are typically higher in eyes with worse VF loss, 12,16,17 we intentionally chose the same criteria for all glaucoma severities to ensure that the VFs included were sufficiently reliable.
A 24–2 VF within a 3 month window of the 10–2 tests was used to stage eyes into mild, moderate or severe functional loss using the Hodapp-Anderson-Parrish scale at baseline.18 Eyes with mild glaucoma had a 24–2 VF with mean deviation (MD) ≥ −6 dB; eyes with moderate glaucoma had 24–2 VFs with −12 dB ≤ MD < −6 dB, while eyes with severe glaucoma had a 24–2 VF with MD < −12 dB.
Eyes with at least five reliable 10–2 VFs with intervals of at least 6 months between tests were selected for longitudinal analyses to track VF changes by central VF patterns and predict central VF MD slope.
All VFs were converted to right eye format, and were accordingly analyzed and plotted in right eye format.
Statistical Analyses
An unsupervised AI method, archetypal analysis, was used to determine the central VF patterns. Compared to the axis-learning19,20 and center-learning21,22 methods, archetypal analysis identifies the patterns that are more recognizable clinically23 and therefore are readily interpretable.24–26
The total deviation values of the most recent reliable VF from each eye were used to identify central VF patterns. We applied archetypal analysis to determine the central VF patterns for eyes across the spectrum of glaucoma severity. Each 10–2 VF can be linearly decomposed to the central VF patterns. The decomposition coefficients sum to 100%. The optimal number of central VF patterns was determined with 10-fold cross-validation by minimizing VF reconstruction error.27 In detail, the data were randomly divided into 10 partitions, where each of the 10 partitions was used as the testing set once, with the remaining nine subsets used as training set. The VF reconstruction errors on test data were calculated for the number (k) of archetypes from 2 to 20 (the potential range of number of archetypes). The VF reconstruction errors were calculated as the differences between the original VFs and the reconstructed VFs, which were the sum of the archetypes multiplied by their linear decomposition coefficients. Bayes factor28 was finally applied to determine the optimal k, where the reconstruction errors with k were sufficiently lower (Bayes factor ≥ 3.0)29 from the reconstruction errors with k-1.5 Once the optimal number of patterns k was determined, the central VF patterns were determined over all data using that number. Similarly, central VF patterns were determined for each glaucoma severity stage.
To demonstrate the clinical utility of tracking 10–2 VF pattern specific changes, a series of VFs were decomposed to the central VF patterns for eyes with all severities. Linear regression was applied to the decomposition coefficient over time. Global indices and central VF pattern features of the first two baseline VFs were used to predict the MD slope of central VF with linear regression adjusted for age.30,31 Global indices include the average of MD and pattern standard deviation (PSD) of the two baseline VFs, and the rate of MD and PSD change between baseline VFs. Central VF pattern features include the average baseline VF decomposition coefficients to the 10–2 archetypal VF patterns for eyes with all severities and the average mean absolute error (MAE) of the two baseline VFs reconstruction. The MAE of baseline VF reconstruction was calculated as the mean absolute difference between total deviation values at each of the locations in the original 10–2 baseline VFs and the reconstructed baseline VFs, which is the sum of the archetypal VF patterns multiplied by respective archetypal coefficients. Stepwise regression32 was applied to select the optimal feature combination that predicts central VF MD slope based on Bayesian information criterion (BIC).33 A sub-analysis for eyes with baseline VF MD ≥ −12 dB was performed as well. Note that, the linear mixed model was used to address the issue of intereye correlation, which might bias the linear regression model.34
Results
Central VF Pattern Quantification
13,951 VFs of 13,951 eyes from 8,712 patients were selected to determine the central VF patterns for eyes across all stages of glaucoma severity. The mean ± standard deviation of age, spherical equivalent (SE) and 10–2 MD were 65.6 ± 16.2 years, −0.5 ± 2.0 diopter and −9.4 ± 9.2dB, respectively. Table 1 details the statistical distributions of age, SE and 10–2 MD stratified by glaucoma stages defined by their matching 24–2 MD values.
Table 1.
The statistical distributions of age, SE and 10–2 MD stratified by glaucoma stages defined by their matching 24–2 MD values. SE = spherical equivalent; MD = mean deviation.
| Glaucoma Stage |
VF Number |
Eye Number |
Patient Number |
Age (years) |
SE (diopter) |
10–2 MD (dB) |
|---|---|---|---|---|---|---|
| All stages | 13,951 | 13,951 | 8,712 | 65.6 ± 16.2 | −0.5 ± 2.0 | −9.4 ± 9.2 |
| Mild | 3,529 | 3,529 | 2,502 | 64.5 ± 14.8 | −0.6 ± 2.0 | −3.0 ± 3.6 |
| Moderate | 1,528 | 1,528 | 1,304 | 68.2 ± 13.8 | −0.5 ± 1.9 | −8.3 ± 4.8 |
| Severe | 3,066 | 3,066 | 2,532 | 71.1 ± 14.0 | −0.5 ± 2.0 | −16.8 ± 7.0 |
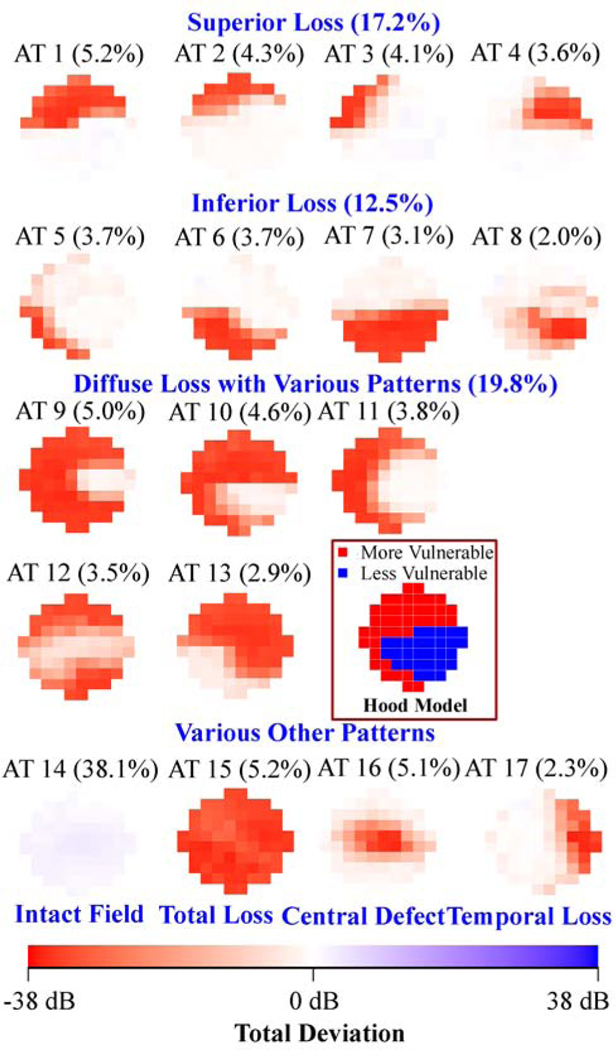
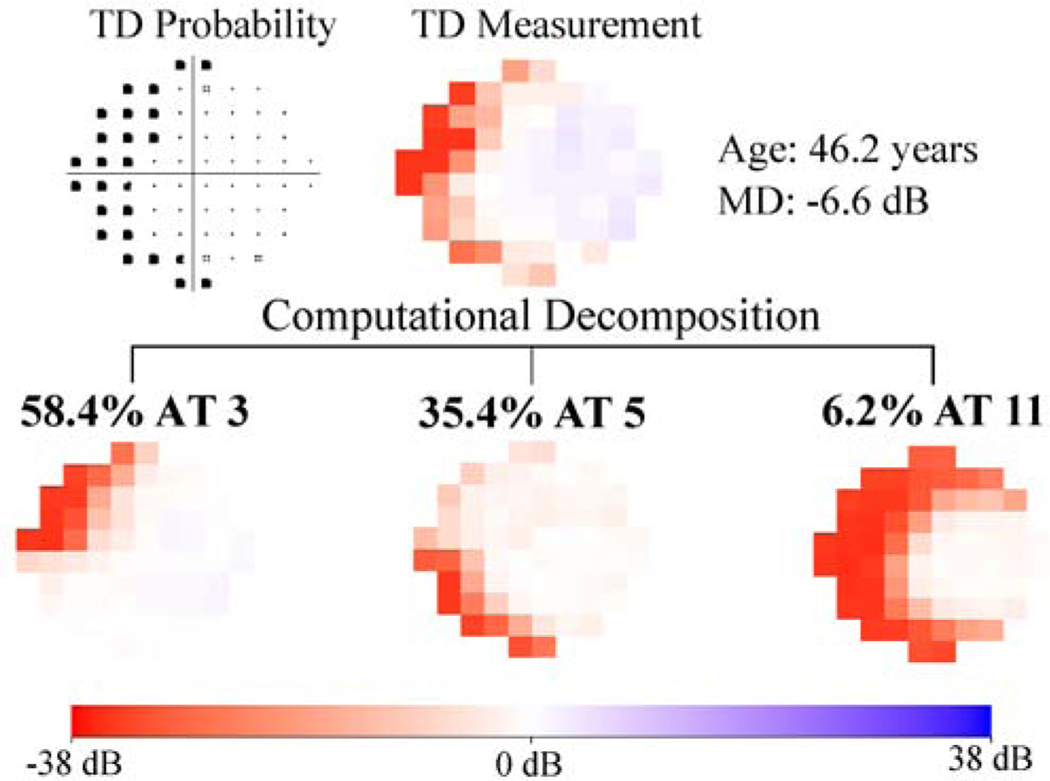
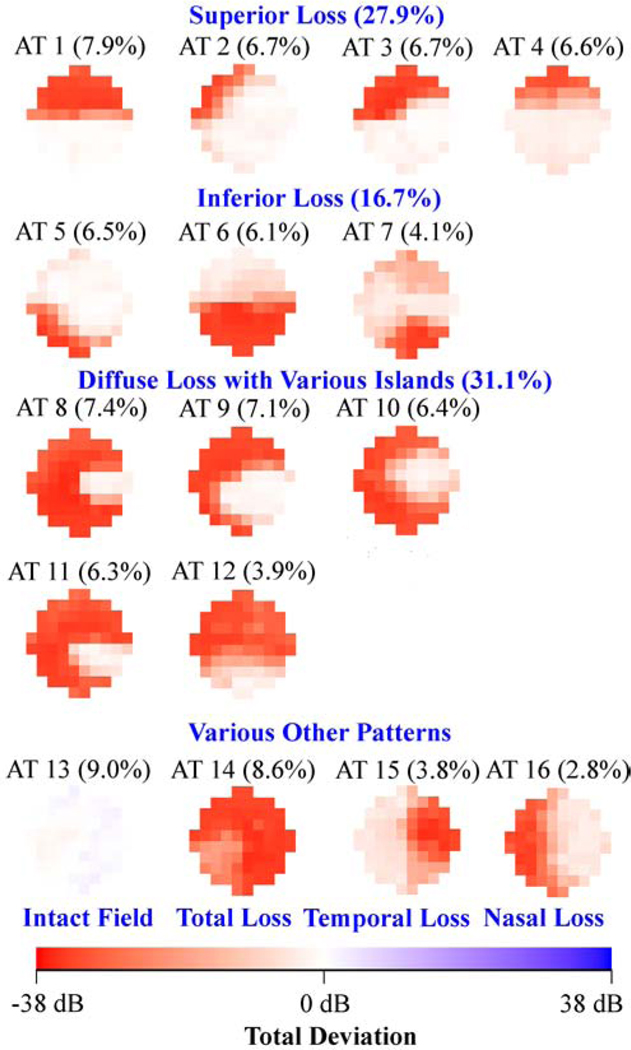
Figure 1 (a) shows the 17 (optimal number of patterns determined by cross-validation) central VF patterns determined by archetypal analyses for the 13,951 eyes with all glaucoma severities, with the respective average decomposition weight for each pattern expressed in percentage format. The most prevalent central VF pattern was an intact field (38.1%). There were 4 central VF patterns related to isolated superior loss, 4 patterns related to isolated inferior loss and 5 patterns related to diffuse loss with various patterns, accounting for 17.2%, 12.5% and 19.8% of central VFs, respectively. The total loss pattern accounted for 5.2% of the central VFs. Notably, 4 of the 5 central VF patterns with diffuse loss accounting for 16.9% of central VFs (archetypes 9, 10, 11 and 12 in Figure 1 (a)) preserved the less vulnerable zone while they lost most of the remaining more vulnerable zone (see schematic in Figure 1 (a)) proposed by Hood and coworkers.8 Furthermore, various arcuate defect patterns were found including 3 superior arcuate defects (archetypes 1, 2, 3) and 3 inferior arcuate defects (archetypes 5, 6 and 8) accounting for 23.0% of central VF loss patterns. An example of a patient’s central VF decomposed quantitatively into a linear combination of the 17 central VF patterns is shown in Figure 1(b). More specifically, a central VF can be approximately represented as the sum of each central VF pattern multiplied by its respective linear decomposition coefficient, which sums to 100%. Intuitively, the central VF pattern with the highest coefficient most resembles the actual VF compared to patterns with lower coefficients. We also applied the t-distributed stochastic neighbor embedding (t-SNE) method to transform the central VFs into a two-dimensional data space for the purpose of better data visualization.35,36 The transformed central VFs were plotted in two-dimensional space with each data point colored based on the respective primary VF pattern. The primary VF pattern was defined as the pattern demonstrating the largest weight coefficient when decomposing the VF into its component patterns. See more details in Supplemental Figure 1.
Figure 1.
A, Seventeen central visual field (VF) patterns determined by archetypal analysis for 13 951 eyes with all glaucoma severities with annotated average decomposition coefficients on all 13 951 VFs. The numbering of the archetypes is based on location of VF loss. The percentage in parenthesis indicates the respective average decomposition weight for each pattern. B, Example of the VF decomposition to the central VF patterns. All VFs are plotted in right-eye format. AT = archetype; MD = mean deviation; TD = total deviation.
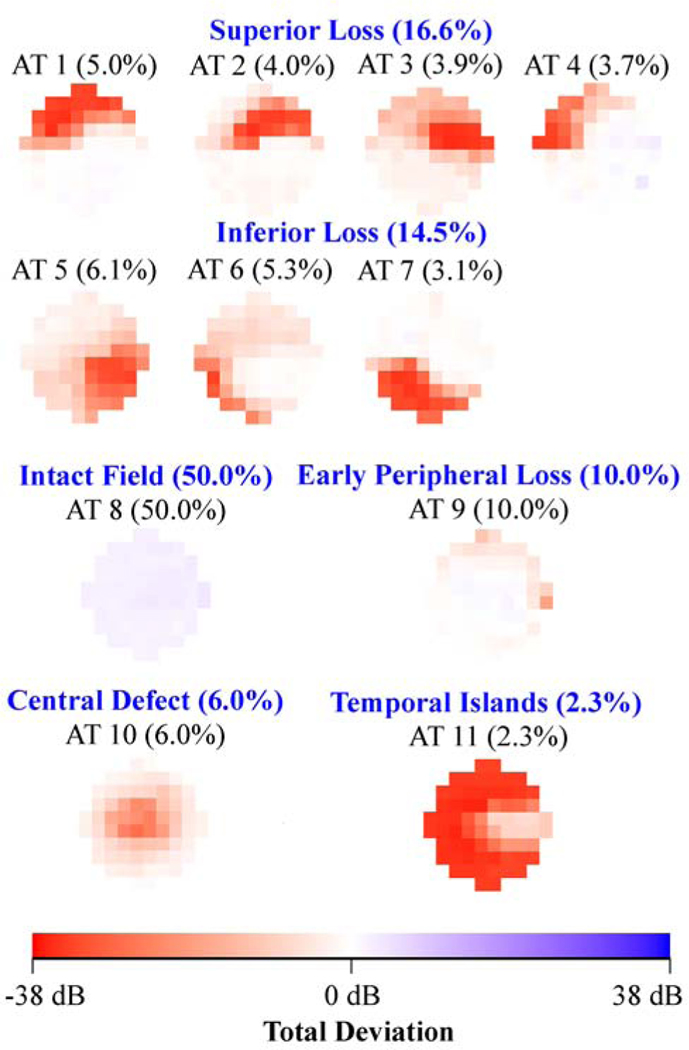
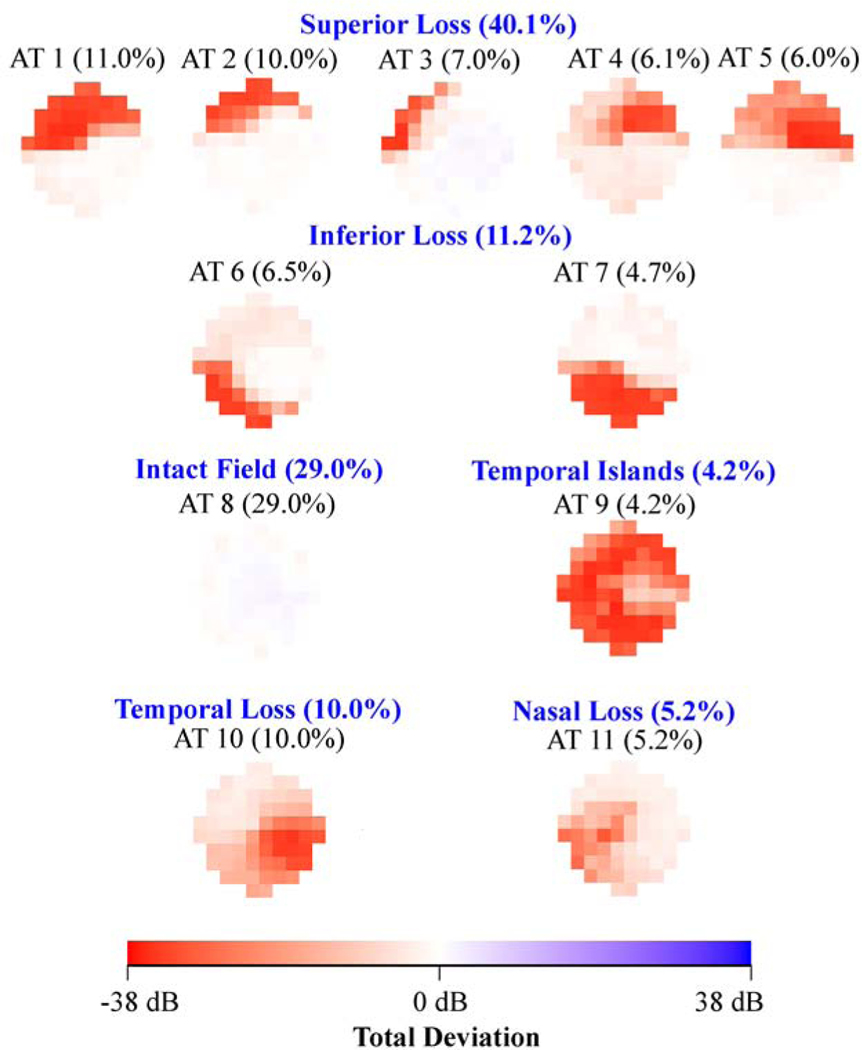
Figure 2 shows the various central VF patterns for eyes with (a) mild (3,529 eyes), (b) moderate (1,528 eyes) and (c) severe (3,066 eyes) glaucoma respectively as determined using accompanied 24–2 VF mean deviation. The average decomposition weight of the intact central VF archetype decreased from 50% in mild glaucoma (archetype 8 in Figure 2 (a)), to 29% in moderate glaucoma (archetype 8 in Figure 2 (b)) and to 9% in severe glaucoma (archetype 13 in Figure 2 (c)), while the average weight of diffuse loss increased from 2.3% in mild glaucoma (archetype 11 in Figure 2 (a)), to 4.2% in moderate glaucoma (archetype 9 in Figure 2 (b)) and to 39.7% in severe glaucoma (archetypes 8, 9, 10, 11, 12 and 14 in Figure 2 (c)). The percentage of arcuate loss increased from 31.1% (archetypes 1, 2, 4, 6, 7 and 9 in Figure 2 (a)) in mild glaucoma to 45.3% (archetypes 1, 2, 3, 4, 6 and 7 in Figure 2 (b)) in moderate glaucoma, and decreased again to 26.5% (archetypes 2, 3, 4 and 5 in Figure 2 (c)) in severe glaucoma.
Figure 2.
A, Eleven central visual field (VF) patterns for eyes with mild glaucoma (3529 eyes). B, Eleven central VF patterns for eyes with moderate glaucoma (1528 eyes). C, Sixteen central VF patterns for eyes with severe glaucoma (3066 eyes). The glaucoma stage was determined by accompanying 24–2 VF mean deviation. All VFs are plotted in right-eye format. AT = archetype.
When comparing the central VF patterns present in different glaucoma stages, similar central VF defects were found in different glaucoma stages including superonasal defects (e.g., archetype 1 in Figure 2 (a) and (b), and archetype 3 in Figure 2 (c)) and temporal island patterns (e.g., archetype 11 in Figure 2 (a), archetype 9 in Figure 2 (b), and archetype 8 in Figure 2 (c)). Unique patterns specific to glaucoma stages include the central defect superior-peripheral loss (10.0%; archetype 9 in Figure 2 (a)) and central defect (6.0%; archetype 10 in Figure 2 (a)) for mild glaucoma, the central-nasal loss (5.2%; archetype 11 in Figure 2 (b)) for moderate glaucoma, and the total loss (8.6%; archetype 14 in Figure 2 (c)) and inferotemporal loss (4.1%; archetype 7 in Figure 2 (c)) for severe glaucoma.
Using Central VF Patterns to Assess Change
1,191 eyes from 824 patients with at least 5 reliable 10–2 VFs obtained at follow-up intervals of at least 6 months were selected for longitudinal analyses to illustrate the potential clinical relevance of the archetypal central VF patterns. At the time of the two baseline VFs (average 102 MD: −11.2 ± 7.9 dB), the mean age of the patient population was 64.7 ± 13.5 years. 384 eyes had 10–2 MD ≥ −6 dB, 677 eyes had 10–2 MD between −6 dB and −12 dB and 514 eyes had 10–2 MD worse than −12 dB. The medians of the follow-up time and number of follow-up tests were 6.3 years and 6, respectively. The average MD slope for eyes with all severities was −0.37 ± 0.66 dB/year and −0.39 ± 0.67 dB/year for eyes with baseline MD ≥ −12 dB.
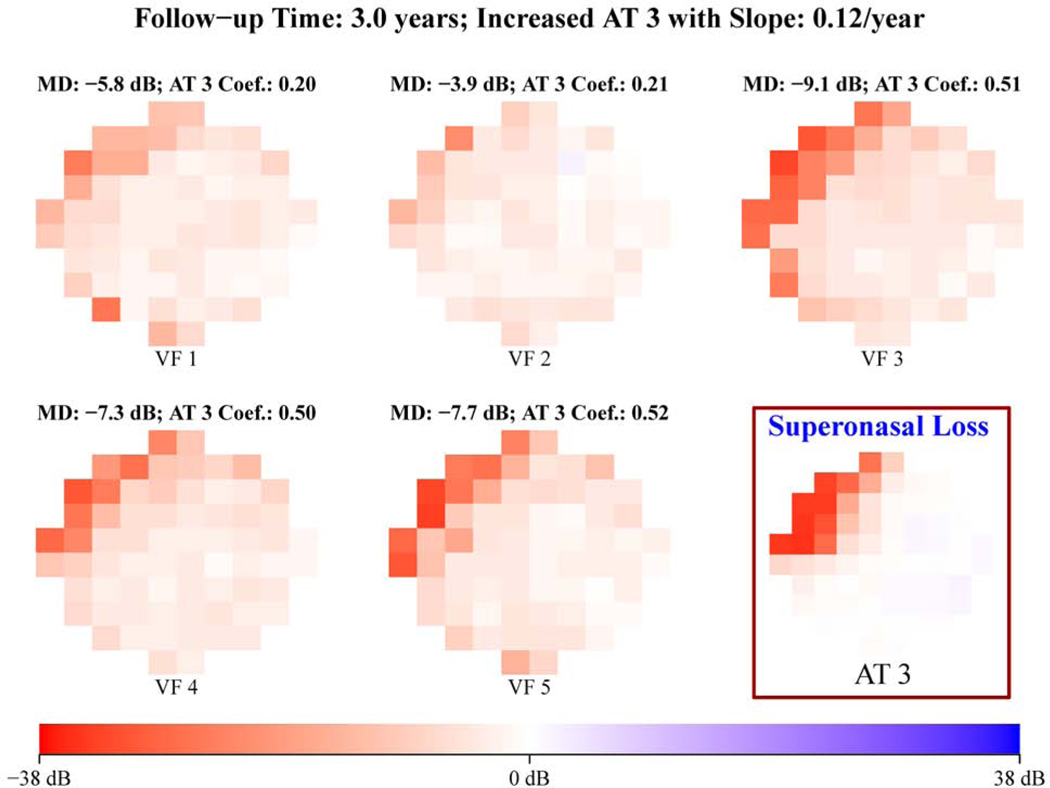
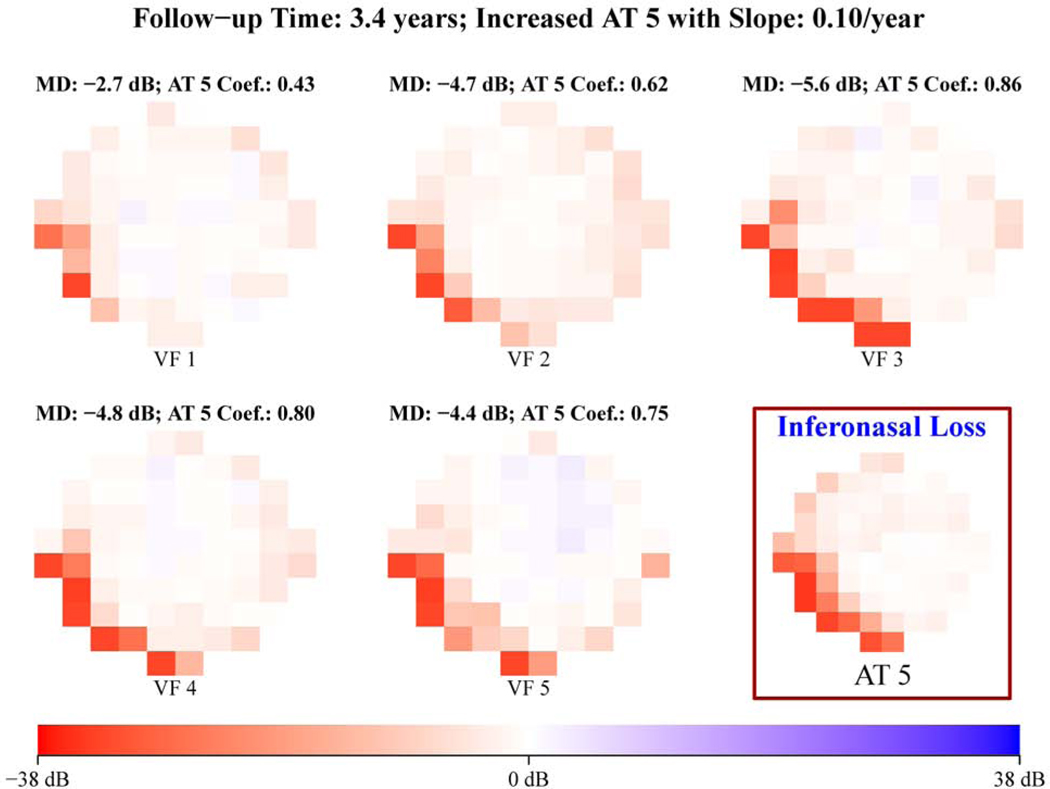
Figure 3 shows representative examples of (a) increased superonasal loss (12% per year) and (b) increased inferonasal loss (10% per year), which were detected by quantitatively tracking the spatial pattern changes using the 17 central VF patterns for eyes with all glaucoma severities illustrated in Figure 1 (a).
Figure 3.
Representative example of (A) increased superonasal loss and (B) increased inferonasal loss detected by tracking the spatial pattern changes using the 17 central visual field (VF) patterns for eyes with all glaucoma severities illustrated in Figure 1A. All VFs are plotted in right-eye format. AT = archetype; MD = mean deviation.
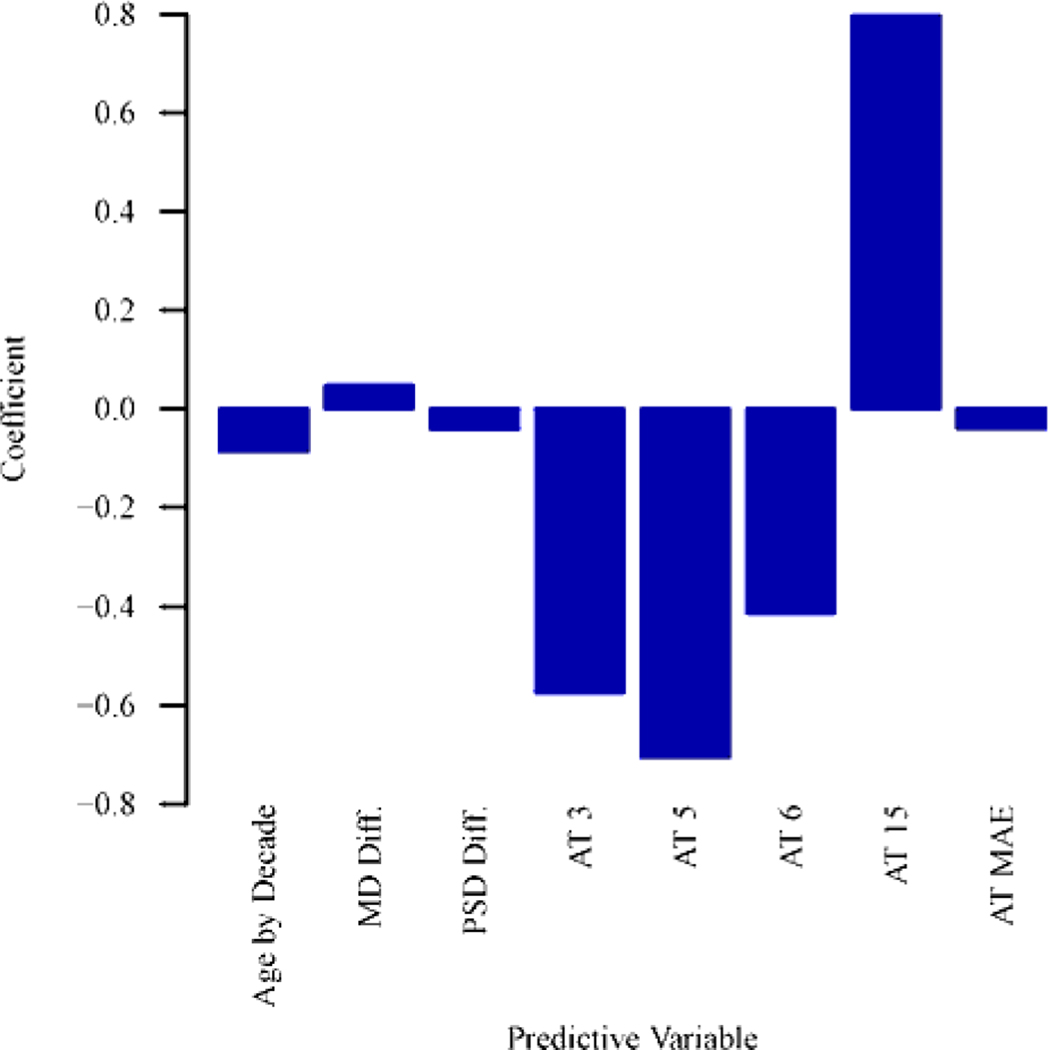
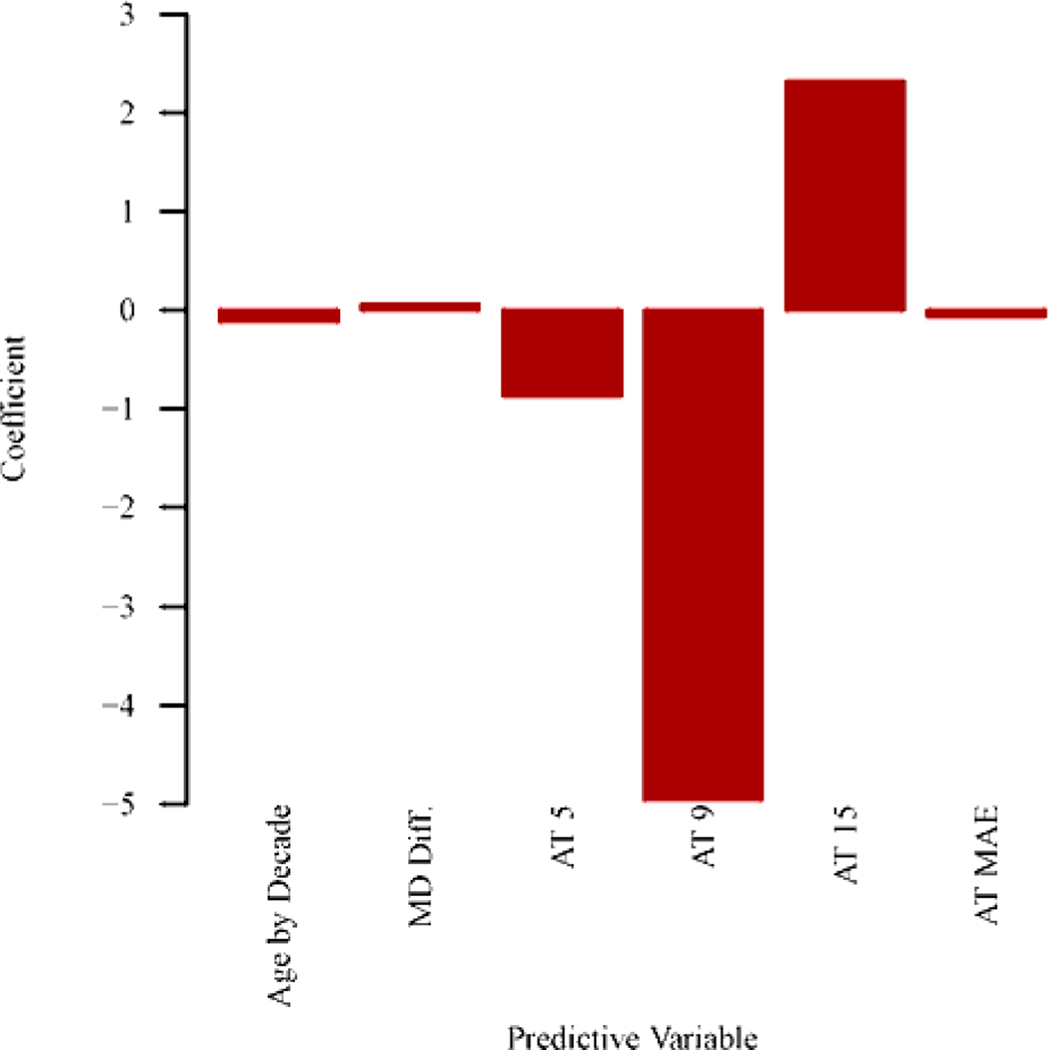
Figure 4 (a) shows the optimal combinations of features to predict the 10–2 MD slope. Inclusion of central VF pattern features strongly improves the prediction of central VF MD slope (BIC decreasing of 35) than using global indices of two baseline VFs. Note that, BIC decreasing > 6 indicates strong prediction improvement.29 Specifically, more negative MD slope of central VF was significantly (p < 0.004 for all) associated with higher coefficients of archetypes 3 (superonasal loss), 5 (inferonasal loss), 6 (extended inferonasal loss), mean absolute error between archetypal VF reconstruction and original baseline VFs, and lower coefficient of archetype 15 (total loss). As expected, older age and decreased MD and PSD between baselines were also significantly (p < 0.001 for all) associated with more negative central VF MD slope. The positive association between archetype 15 and MD slope is likely due to either floor effect or the beneficial effect of cataract surgery.
Figure 4.
Bar graphs showing (A) optimal features to predict the mean deviation (MD) slope of central visual field (VF) for eyes with baseline MDs of all severities (n = 1191 eyes) and (B) optimal features to predict the MD slope of central VF for eyes with baseline MDs of –12 dB or more (better than severe glaucoma; n = 677 eyes). See Tables S1 and S2 (available at www.aaojournal.org) for the detailed model coefficients and their 95% confidence intervals. AT = archetype; MAE = mean absolute error of the baseline VFs reconstruction by central VF archetypes; Diff. = difference between 2 baseline results; PSD = pattern standard deviation.
Figure 4 (b) shows the optimal combination of features to predict central VF MD slope in eyes with baseline MD ≥ −12 dB. Adding central VF pattern features improves the prediction of central VF MD slope (BIC decreasing of 25) compared to global indices alone. In particular, more negative MD slope was statistically (p < 0.006 for all) correlated with higher coefficients of archetypes 5 (inferonasal loss), 9 (diffuse loss with temporal island), and mean absolute error of archetypal VF reconstruction, and lower coefficient of archetype 15 (total loss). Again, older age and decreased MD between baselines were also statistically (p < 0.001 for all) associated with more negative MD slope of central VF.
Discussion
In this work, 17 central VF patterns were autonomously identified for eyes with all severities of functional loss by unsupervised AI. In addition, 11, 11 and 16 central VF patterns were subsequently determined for eyes with mild, moderate and severe glaucoma, respectively. To the best of our knowledge, this is the first study that systematically and quantitatively describes central VF patterns in glaucoma. Among the 17 central VF patterns identified, various arcuate defect patterns were found and most of the diffuse loss patterns preserved the so called less vulnerable zone.8 Similar central VF defects across different glaucoma stages and unique central VF defects specific to a certain glaucoma stage were found, which might represent different subtypes of central VF loss with possibly different underlying pathophysiology and biomarkers.
More importantly, the potential clinical utilities of the central VF patterns were demonstrated including tracking spatial pattern changes over time and predicting the central VF MD slope by baseline central VF patterns.
We demonstrated that the central VF patterns can be used to track and detect the focal changes of central VFs over time. This functionality can be used to develop new progression detection algorithms based on spatial pattern analyses of central VF. A similar algorithm to detect 24–2 VF progression has been developed and demonstrated to be more accurate than existing progression detection methods.26
Consistent with the study by Traynis et al. assessing 10–2 central VF defects manually,9 we found various arcuate defect patterns including 3 superior arcuate defects (archetypes 1, 2, 3) and 3 inferior arcuate defects (archetypes 5, 6 and 8) accounting for 23% of central VFs. Furthermore, 4 out of the 5 patterns of diffuse loss with islands preserved the less inferior temporal vulnerable zone as described.8 The quantification of central VF loss by spatial pattern analyses with archetypal analysis independently confirmed the observational findings of frequent arcuate defects and relative preservation of the inferotemporal less vulnerable zone.8
We also have shown that central VF patterns of baseline VFs are predictive of central VF MD slope when used in a model with age and global indices of baseline VFs. Interestingly, among the 17 central VF patterns, there were 4 central VF patterns (Figure 4 (a)) specifically associated with central VF MD slope. In particular, higher coefficients of archetypes 3 (superonasal loss), 5 (inferonasal loss) and 6 (extended inferonasal loss) were associated with more negative central VF MD slope. Our model could be used by clinicians to decide which patients/eyes need to be treated more aggressively to slow central VF worsening.37
To further support the generalizability of our model, we have compared the VF reconstruction error on our training dataset with the VF reconstruction error on a different testing dataset recently received from Columbia University, which were not included in our original data analysis. The most recent reliable VFs of 2,965 eyes in training and testing datasets were selected. Inter-eye correlation was adjusted with the linear mixed model. The average mean absolute error of VF reconstruction on the training dataset was 2.41 dB compared with the average mean absolute error of VF reconstruction on the testing data 2.32 dB. The modeling error on the testing data was even slightly lower than the modeling error on the training data (p < 0.001). This small difference is likely from sampling effect.
AI shows great potential to improve glaucoma diagnosis and prognosis evidenced by numerous recent publications. AI is generally divided into supervised AI (e.g. deep learning) and unsupervised AI (e.g. archetypal analysis). While the supervised AI has been typically applied for glaucoma detection and forecasting, 36–42 the unsupervised AI mainly helps clinicians to understand the patterns of glaucomatous damages and their changes over time.22,43,44 In previous research,22,43,44 axis-learning such as principal component analysis and independent component analysis and center-learning such as Gaussian mixture modeling have been applied to improve glaucoma progression detection. Compared with axis-learning and center learning methods, the corner-learning AI method of archetypal analysis produces clinical recognizable and interpretable VF patterns which can help translate findings into clinical practice.5,25,26 However, archetypal analysis is theoretically more prone to data outliers compared those aforementioned methods. A hybrid approach combining axis-learning, center-learning and corner-learning might be promising to further improve the clinical utilities of unsupervised AI.
Our study has limitations. First, we do not have detailed demographic (e.g. race and gender) and diagnostic information, treatment history and accompanying structural measurements for our central VF data. Those factors might be related to different central VF patterns, which need to be address in our future studies when the relevant information is available in a new dataset. We would like to stress the fact that we included all patients from five glaucoma services across the US with reliable central 10–2 VF from 1999 to 2014. No patients were excluded due to demographics and past ocular history, therefore our data used to generate the model are probably fairly close to “real world” clinical data. Patients may also have VF loss from confounding diseases, such as macular degeneration, stroke, cataract, etc. For example, archetypes 16 and 17 in Figure 1 (a) might be related to macular degeneration and hemianopia, respectively. More structural measurements and detailed medical records will be needed to determine the exact pathological causes of those VF patterns. On the other hand, the presence of patterns potentially related to confounding diseases is not necessarily a disadvantage, because the subjects in glaucoma clinics may have glaucoma and other vision-related diseases and our model can be potentially used to quantify and distinguish their vision loss related to different diseases. Second, our central VF samples might be biased toward severe glaucoma stage compared with their natural distributions, because central VF is more frequently tested in severe stage disease than in mild stage disease as suggested by the similar numbers of eyes with 10–2 VF for mild and severe glaucoma while typically there are much fewer eyes with severe glaucoma compared with mild glaucoma. However, if the central VF samples are biased in the same way in most glaucoma clinics, then this bias does not affect the applicability of our model. Third, though we demonstrated that central VF patterns of baseline VFs can predict central VF MD slope in addition to global indices, we do not have the detailed diagnostic information and the treatment history of individual patient to more accurately identify the risk factors of the central VF worsening. Lastly, more work is needed to demonstrate the correlation between central VF patterns to the structural damages, perhaps using macular ganglion cell thickness maps.
In summary, representative central VF patterns were determined by archetypal analysis using a large multi-center dataset. Those central VF patterns quantitatively confirmed previous observational findings of arcuate defects and less vulnerable zones in central VF. We demonstrated the potential clinical utilities of central VF patterns including predicting central VF MD change over time. Furthermore, as numerous studies have shown that the central VF is most relevant to the quality of life (QoL) of glaucoma patients,46–51 we believe that further distinguishing the central VF loss based on their spatial patterns can better identify the QoL impairment of glaucoma patients than only using central VF MD.
Supplementary Material
Central visual field patterns in glaucoma were quantified by an unsupervised artificial intelligence technique, and were used to improve the prediction of central visual field loss over time compared with only using global indices alone.
Acknowledgments
Financial support:
This work was supported by NIH R21 EY030142 (T.E.), NIH R21 EY030631 (T.E.), NIH R01 EY030575 (T.E.), NIH R01 EY015473 (L.R.P.), BrightFocus Foundation (M.W., T.E.), Lions Foundation (M.W., T.E.), Grimshaw-Gudewicz Foundation (M.W., N.B, T.E.), Research to Prevent Blindness (M.W., T.E.), NIH K99 EY028631 (M.W.), Harvard Glaucoma Center of Excellence (M.W., T.E., L.Q.S.), the Eleanor and Miles Shore Fellowship (L.Q.S.), Departmental Grant from Research to Prevent Blindness (C.G.D.M.), R01 EY025253 (C.G.D.M.), K23 EY025014 (O.J.S.), the Alice Adler Fellowship (T.E.), NIH NEI Core Grant P30 EY003790 (M.W., T.E., D.L., H.W.), and the Joseph Cohen Research Fund of the New York Eye and Ear Infirmary of Mount Sinai (R.R.).
Footnotes
Potential conflicts of interest:
U.S. Application No. 036770-571001WO (M.W., L.Q.S., T.E.), U.S. Application No. 036770-572001WO (M.W., L.Q.S., T.E.), U.S. Provisional Application No. 62/804,903 (T.E., J.T., M.W.), U.S. Provisional Application No. 62/909,386 (M.W., L.Q.S., T.E.), PCT/US2014/052414 (T.E., P.J.B.).
Publisher's Disclaimer: This is a PDF file of an unedited manuscript that has been accepted for publication. As a service to our customers we are providing this early version of the manuscript. The manuscript will undergo copyediting, typesetting, and review of the resulting proof before it is published in its final form. Please note that during the production process errors may be discovered which could affect the content, and all legal disclaimers that apply to the journal pertain.
References
- 1.Murata H, Hirasawa H, Aoyama Y, et al. Identifying areas of the visual field important for quality of life in patients with glaucoma. PLoS One. 2013;8(3):e58695. [DOI] [PMC free article] [PubMed] [Google Scholar]
- 2.Abe RY, Diniz-Filho A, Costa VP, Gracitelli CPB, Baig S, Medeiros FA. The impact of location of progressive visual field loss on longitudinal changes in quality of life of patients with glaucoma. Ophthalmology. 2016;123(3):552–557. [DOI] [PMC free article] [PubMed] [Google Scholar]
- 3.McKean-Cowdin R, Wang Y, Wu J, et al. Impact of visual field loss on health-related quality of life in glaucoma: the Los Angeles Latino Eye Study. Ophthalmology. 2008;115(6):941–948. [DOI] [PMC free article] [PubMed] [Google Scholar]
- 4.Keltner JL, Johnson CA, Cello KE, et al. Classification of visual field abnormalities in the ocular hypertension treatment study. Arch Ophthalmol. 2003;121(5):643–650. [DOI] [PubMed] [Google Scholar]
- 5.Elze T, Pasquale LR, Shen LQ, Chen TC, Wiggs JL, Bex PJ. Patterns of functional vision loss in glaucoma determined with archetypal analysis. J R Soc Interface. 2015;12(103):20141118. [DOI] [PMC free article] [PubMed] [Google Scholar]
- 6.Goldbaum MH, Sample PA, Zhang Z, et al. Using unsupervised learning with independent component analysis to identify patterns of glaucomatous visual field defects. Invest Ophthalmol Vis Sci. 2005;46(10):3676–3683. [DOI] [PMC free article] [PubMed] [Google Scholar]
- 7.Hood DC, Raza AS, de Moraes CG V, et al. Initial arcuate defects within the central 10 degrees in glaucoma. Invest Ophthalmol Vis Sci. 2011;52(2):940–946. [DOI] [PMC free article] [PubMed] [Google Scholar]
- 8.Hood DC, Raza AS, de Moraes CG V, Liebmann JM, Ritch R. Glaucomatous damage of the macula. Prog Retin Eye Res. 2013;32:1–21. [DOI] [PMC free article] [PubMed] [Google Scholar]
- 9.Traynis I, De Moraes CG, Raza AS, Liebmann JM, Ritch R, Hood DC. Prevalence and nature of early glaucomatous defects in the central 10 of the visual field. JAMA Ophthalmol. 2014;132(3):291–297. doi: 10.1001/jamaophthalmol.2013.7656 [DOI] [PMC free article] [PubMed] [Google Scholar]
- 10.Leung CKS, Liu S, Weinreb RN, et al. Evaluation of retinal nerve fiber layer progression in glaucoma: a prospective analysis with neuroretinal rim and visual field progression. Ophthalmology. 2011;118(8):1551–1557. [DOI] [PubMed] [Google Scholar]
- 11.Leung CK-S, Yu M, Weinreb RN, Lai G, Xu G, Lam DS-C. Retinal nerve fiber layer imaging with spectral-domain optical coherence tomography: patterns of retinal nerve fiber layer progression. Ophthalmology. 2012;119(9):1858–1866. [DOI] [PubMed] [Google Scholar]
- 12.Birt CM, Shin DH, Samudrala V, Hughes BA, Kim C, Lee D. Analysis of reliability indices from Humphrey visual field tests in an urban glaucoma population. Ophthalmology. 1997;104(7):1126–1130. [DOI] [PubMed] [Google Scholar]
- 13.Newkirk MR, Gardiner SK, Demirel S, Johnson CA. Assessment of false positives with the Humphrey Field Analyzer II perimeter with the SITA Algorithm. Invest Ophthalmol Vis Sci. 2006;47(10):4632–4637. [DOI] [PubMed] [Google Scholar]
- 14.Pasquale LR, Kang JH, Manson JE, Willett WC, Rosner BA, Hankinson SE. Prospective study of type 2 diabetes mellitus and risk of primary open-angle glaucoma in women. Ophthalmology. 2006;113(7):1081–1086. [DOI] [PubMed] [Google Scholar]
- 15.Pasquale LR, Willett WC, Rosner BA, Kang JH. Anthropometric measures and their relation to incident primary open-angle glaucoma. Ophthalmology. 2010;117(8):15211529. [DOI] [PMC free article] [PubMed] [Google Scholar]
- 16.Bengtsson B, Heijl A. False-negative responses in glaucoma perimetry: indicators of patient performance or test reliability? Invest Ophthalmol Vis Sci. 2000;41(8):2201–2204. [PubMed] [Google Scholar]
- 17.Gardiner SK, Swanson WH, Goren D, Mansberger SL, Demirel S. Assessment of the reliability of standard automated perimetry in regions of glaucomatous damage. Ophthalmology. 2014;121(7):1359–1369. [DOI] [PMC free article] [PubMed] [Google Scholar]
- 18.Hodapp E, Parrish RK, Anderson DR. Clinical Decisions in Glaucoma. Mosby Inc; 1993. [Google Scholar]
- 19.Wold S, Esbensen K, Geladi P. Principal component analysis. Chemom Intell Lab Syst. 1987;2(1–3):37–52. [Google Scholar]
- 20.Comon P. Independent component analysis, a new concept? Signal Processing. 1994;36(3):287–314. [Google Scholar]
- 21.Hartigan JA, Wong MA. Algorithm AS 136: A k-means clustering algorithm. J R Stat Soc Ser C (Applied Stat. 1979;28(1):100–108. [Google Scholar]
- 22.Yousefi S, Balasubramanian M, Goldbaum MH, et al. Unsupervised Gaussian mixture-model with expectation maximization for detecting glaucomatous progression in standard automated perimetry visual fields. Transl Vis Sci Technol. 2016;5(3):2. [DOI] [PMC free article] [PubMed] [Google Scholar]
- 23.Cutler A, Breiman L. Archetypal Analysis. Technometrics. 1994;36(4):338–347. [Google Scholar]
- 24.Cai S, Elze T, Bex PJ, Wiggs JL, Pasquale LR, Shen LQ. Clinical correlates of computationally derived visual field defect archetypes in patients from a glaucoma clinic. Curr Eye Res. 2017;42(4):568–574. [DOI] [PMC free article] [PubMed] [Google Scholar]
- 25.Wang M, Pasquale LR, Shen LQ, et al. Reversal of glaucoma hemifield test results and visual field features in glaucoma. Ophthalmology. 2018;125(3):352–360. [DOI] [PMC free article] [PubMed] [Google Scholar]
- 26.Wang M, Shen LQ, Pasquale LR, et al. An artificial intelligence approach to detect visual field progression in glaucoma based on spatial pattern analysis. Invest Ophthalmol Vis Sci. 2019;60(1):365–375. [DOI] [PMC free article] [PubMed] [Google Scholar]
- 27.Kohavi R, others. A study of cross-validation and bootstrap for accuracy estimation and model selection. In: Ijcai. Vol 14; 1995:1137–1145. [Google Scholar]
- 28.Rouder JN, Speckman PL, Sun D, Morey RD, Iverson G. Bayesian t tests for accepting and rejecting the null hypothesis. Psychon Bull Rev. 2009;16(2):225–237. [DOI] [PubMed] [Google Scholar]
- 29.Kass RE, Raftery AE. Bayes factors. J Am Stat Assoc. 1995;90(430):773–795. [Google Scholar]
- 30.Fukuchi T, Yoshino T, Sawada H, et al. The relationship between the mean deviation slope and follow-up intraocular pressure in open-angle glaucoma patients. J Glaucoma. 2013;22(9):689–697. [DOI] [PubMed] [Google Scholar]
- 31.Drance S, Anderson DR, Schulzer M. Risk factors for progression of visual field abnormalities in normal-tension glaucoma. Am J Ophthalmol. 2001;131(6):699–708. [DOI] [PubMed] [Google Scholar]
- 32.Jennrich RI. Stepwise regression. Stat methods Digit Comput. 1977;3:58–75. [Google Scholar]
- 33.Schwarz G, others. Estimating the dimension of a model. Ann Stat. 1978;6(2):461–464. [Google Scholar]
- 34.Fan Q, Teo Y-Y, Saw S-M. Application of advanced statistics in ophthalmology. Invest Ophthalmol Vis Sci. 2011;52(9):6059–6065. [DOI] [PubMed] [Google Scholar]
- 35.Yousefi S, Yousefi E, Takahashi H, et al. Keratoconus severity identification using unsupervised machine learning. PLoS One. 2018;13(11):e0205998. [DOI] [PMC free article] [PubMed] [Google Scholar]
- 36.Yousefi S, Elze T, Pasquale LR, Boland M. Glaucoma Monitoring Using Manifold Learning and Unsupervised Clustering. In: 2018 International Conference on Image and Vision Computing New Zealand (IVCNZ); 2018:1–6. [Google Scholar]
- 37.Ratnarajan G, Jolly JK, Yusuf IH, Salmon JF. The effect of trabeculectomy surgery on the central visual ield in patients with glaucoma using microperimetry and optical coherence tomography. Surgery. 2018;3:4. [DOI] [PMC free article] [PubMed] [Google Scholar]
- 38.Bojikian KD, Lee CS, Lee AY. Finding Glaucoma in Color Fundus Photographs Using Deep Learning. JAMA Ophthalmol. 2019. [DOI] [PMC free article] [PubMed] [Google Scholar]
- 39.Wen JC, Lee CS, Keane PA, et al. Forecasting future Humphrey Visual Fields using deep learning. PLoS One. 2019;14(4):e0214875. [DOI] [PMC free article] [PubMed] [Google Scholar]
- 40.Ran AR, Cheung CY, Wang X, et al. Detection of glaucomatous optic neuropathy with spectral-domain optical coherence tomography: a retrospective training and validation deep-learning analysis. Lancet Digit Heal. 2019;1(4):e172–e182. [DOI] [PubMed] [Google Scholar]
- 41.Asaoka R, Murata H, Iwase A, Araie M. Detecting preperimetric glaucoma with standard automated perimetry using a deep learning classifier. Ophthalmology. 2016;123(9):19741980. [DOI] [PubMed] [Google Scholar]
- 42.Li Z, He Y, Keel S, Meng W, Chang RT, He M. Efficacy of a deep learning system for detecting glaucomatous optic neuropathy based on color fundus photographs. Ophthalmology. 2018;125(8):1199–1206. [DOI] [PubMed] [Google Scholar]
- 43.Medeiros FA, Jammal AA, Thompson AC. From Machine to Machine: An OCT-Trained Deep Learning Algorithm for Objective Quantification of Glaucomatous Damage in Fundus Photographs. Ophthalmology. 2019;126(4):513–521. [DOI] [PMC free article] [PubMed] [Google Scholar]
- 44.Asaoka R, Murata H, Hirasawa K, et al. Using deep learning and transfer learning to accurately diagnose early-onset glaucoma from macular optical coherence tomography images. Am J Ophthalmol. 2019;198:136–145. [DOI] [PubMed] [Google Scholar]
- 45.Yousefi S, Kiwaki T, Zheng Y, et al. Detection of longitudinal visual field progression in glaucoma using machine learning. Am J Ophthalmol. 2018;193:71–79. [DOI] [PubMed] [Google Scholar]
- 46.Szlyk JP, Mahler CL, Seiple W, Edward DP, Wilensky JT. Driving performance of glaucoma patients correlates with peripheral visual field loss. J Glaucoma. 2005;14(2):145–150. [DOI] [PubMed] [Google Scholar]
- 47.Chisholm CM, Rauscher FG, Crabb DC, et al. Assessing visual fields for driving in patients with paracentral scotomata. Br J Ophthalmol. 2008;92(2):225–230. [DOI] [PubMed] [Google Scholar]
- 48.Szlyk JP, Taglia DP, Paliga J, Edward DP, Wilensky JT. Driving performance in patients with mild to moderate glaucomatous clinical vision changes. J Rehabil Res Dev. 2002;39(4):467. [PubMed] [Google Scholar]
- 49.Coeckelbergh TRM, Brouwer WH, Cornelissen FW, Van Wolffelaar P, Kooijman AC. The effect of visual field defects on driving performance: a driving simulator study. Arch Ophthalmol. 2002;120(11):1509–1516. [DOI] [PubMed] [Google Scholar]
- 50.Fujita K, Yasuda N, Oda K, Yuzawa M. Reading performance in patients with central visual field disturbance due to glaucoma. Nihon Ganka Gakkai Zasshi. 2006;110(11):914918. [PubMed] [Google Scholar]
- 51.Ramulu PY, West SK, Munoz B, Jampel HD, Friedman DS. Glaucoma and reading speed: the Salisbury Eye Evaluation project. Arch Ophthalmol. 2009;127(1):82–87. [DOI] [PMC free article] [PubMed] [Google Scholar]
Associated Data
This section collects any data citations, data availability statements, or supplementary materials included in this article.


