

Abstract
Electrocardiography (ECG) is a key non-invasive diagnostic tool for cardiovascular diseases which is increasingly supported by algorithms based on machine learning. Major obstacles for the development of automatic ECG interpretation algorithms are both the lack of public datasets and well-defined benchmarking procedures to allow comparison s of different algorithms. To address these issues, we put forward PTB-XL, the to-date largest freely accessible clinical 12-lead ECG-waveform dataset comprising 21837 records from 18885 patients of 10 seconds length. The ECG-waveform data was annotated by up to two cardiologists as a multi-label dataset, where diagnostic labels were further aggregated into super and subclasses. The dataset covers a broad range of diagnostic classes including, in particular, a large fraction of healthy records. The combination with additional metadata on demographics, additional diagnostic statements, diagnosis likelihoods, manually annotated signal properties as well as suggested folds for splitting training and test sets turns the dataset into a rich resource for the development and the evaluation of automatic ECG interpretation algorithms.
Subject terms: Machine learning, Data publication and archiving, Electrocardiography - EKG, Cardiovascular diseases
| Measurement(s) | electrocardiography • cardiovascular system |
| Technology Type(s) | 12 lead electrocardiography |
| Factor Type(s) | presence of co-occurring diseases |
| Sample Characteristic - Organism | Homo sapiens |
Machine-accessible metadata file describing the reported data: 10.6084/m9.figshare.12098055
Background & Summary
Cardiovascular diseases are the leading cause of mortality worldwide, which is in high-income countries only surpassed by cancer1. Electrocardiography (ECG) provides a key non-invasive diagnostic tool for assessing the cardiac clinical status of a patient. Advanced decision support systems based on automatic ECG interpretation algorithms promise significant assistance for the medical personnel due to the large number of ECGs that are routinely taken. However, there are at least two major obstacles that restrict the progress in this field beyond the demonstration of exceptional performance of closed-source algorithms on custom datasets with restricted access2,3, (1) the lack of large publicly available datasets for training and validation4, and (2) the lack of well-defined evaluation procedures for these algorithms. We aim to address both issues and to close this gap in the research landscape by putting forward PTB-XL5, a clinical ECG dataset of unprecedented size along with proposed folds for the evaluation of machine learning algorithms.
The raw signal data underlying the PTB-XL dataset was recorded by devices from the Schiller AG between October 1989 and June 1996. The transfer of the raw data into a structured database, its curation along with the development of corresponding ECG analysis algorithms was a long term project at the Physikalisch Technische Bundesanstalt (PTB). These efforts resulted in a number of publications6–11, but the access to the dataset remained restricted until now. The dataset comprises clinical 12-lead ECG records of 10 seconds length from 18885 patients. The dataset is balanced with respect to sex (52% male and 48% female) and covers the whole range of ages from 0 to 95 years (median 62 and interquantile range of 22). The ECG records were annotated by up to two cardiologists with potentially multiple ECG statements out of a set of 71 different statements conforming to the SCP-ECG standard12. The statements cover form, rhythm and diagnostic statements in a unified, machine-readable form. For the diagnostic labels we provide a hierarchical organization in terms of 5 coarse superclasses and 24 subclasses for the diagnostic labels, see Fig. 1 for a graphical summary of the dataset, that allow for different levels of granularity. Besides annotations in the form of ECG statements along with likelihood information for diagnostic statements, additional metadata for example in the form of manually annotated signal quality statements are available.
Fig. 1.
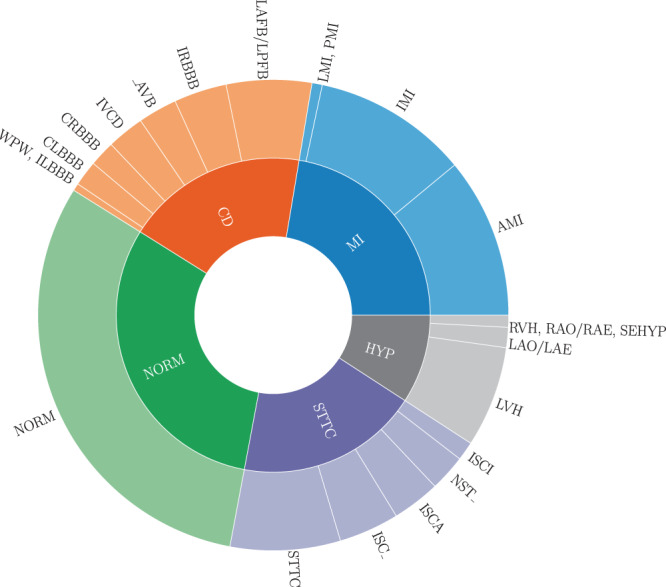
Graphical summary of the PTB-XL dataset in terms of diagnostic superclasses and subclasses, see Table 5 for a definition of the used acronyms.
Apart from the outstanding nominal size of PTB-XL, the dataset is distinguished by its diversity, both in terms of signal quality (with 77.01% of highest signal quality) but also in terms of a rich coverage of pathologies, many different co-occurring diseases but also a large proportion of healthy control samples that is rarely found in clinical datasets. It is in particular this diversity, which makes PTB-XL a rich source for the training and evaluation of algorithms in a real-world setting, where machine learning (ML) algorithms have to work reliably regardless of the recording conditions or potentially poor quality data.
To highlight the uniqueness of the PTB-XL dataset, we compare different commonly used ECG datasets in Table 1 based on sample statistics (number of ECG signals, number of recorded leads, number of patients, average recording length in seconds) and their respective annotations ((D)iagnostic, (F)orm, (R)hytm, (C)linical, (B)eat annotation and the respective number of classes). Most open datasets are provided by PhysioNet13, but typically cover only a few hundred patients. Most notably, this includes the PTB Diagnostic ECG Database6, which was collected during the course of the same long-term project at the PTB, which, however, shares no records with the PTB-XL dataset. The PTB Diagnostic ECG Database includes only 549 records from a single site and provides only a single label per record as opposed to multi-label, machine-readable annotations covering a much broader range of pathologies in PTB-XL. The only exceptions in terms of freely accessible datasets with larger samples sizes are the AF classification dataset14 and the Chinese ICBEB Challenge 2018 dataset15, which contain, however, either just single-lead ECGs or cover only a very limited set of ECG statements. There are several larger datasets that are either commercial or where the access is restricted by certain conditions (top five rows in Table 1). This includes commercial datasets such as CSE16, which has traditionally been used to benchmark ECG interpretation algorithms.
Table 1.
Summary of selected ECG datasets.
| Name | # ECG | # Leads | # Patients | Average length in seconds | Available labels | # Classes | |
|---|---|---|---|---|---|---|---|
| restricted | CSE16 | 1220 | 15 | 1220 | 30 | D | 7 |
| AHA20 | 154 | 2 | 154 | 1800 | DFRB | 8 | |
| Stanford2 | 64121 | 1 | 29163 | 30 | R | 14 | |
| CCDD21 | 179130 | 12 | 179130 | 30 | D | 378 | |
| THEW22 (Chest Pain LR) | 1172 | 12 | 1154 | 86400 | CB | 5 | |
| Mayo CV3 | 649931 | 12 | 180922 | 10 | R | 2 | |
| ICBEB Challenge 201815 | 6877 | 12 | 6877 | 30 | DFR | 8 | |
| non-restricted | MIT-BIH Noise Stress Test23 | 15 | 1 | 15 | 22500 | B | 1 |
| MIT-BIH Arrhythmia24 | 48 | 2 | 47 | 1800 | B | 1 | |
| Malignant Ventricular Arrhythmia25 | 22 | 2 | 22 | 1800 | R | 3 | |
| Ventricular Tachyarrhythmia26 | 35 | 1 | 35 | 480 | B | 3 | |
| European ST-T Database27 | 90 | 2 | 79 | 7200 | F | 2 | |
| AF Classification Challenge 201714 | 8528 | 1 | 8528 | 32.5 | R | 4 | |
| PTB Diagnostic ECG6 | 549 | 15 | 294 | 60 | D | 9 | |
| PTB-XL (this work) | 12 | 10 | DFR |
Methods
This section covers following aspects: In Data Acquisition, we describe in detail the data acquisition process and in Preprocessing we discuss the applied preprocessing steps in order to facilitate a widespread use for training and evaluating machine learning algorithms.
Data acquisition
The raw data acquisition was carried out as follows:
The waveform data was automatically trimmed to 10 seconds segments and stored in a proprietary compressed format. For all signals, we provide the standard set of 12 leads (I,II,III,aVL,aVR,aVF,V1–V6) with reference electrodes on the right arm. The original sampling frequency was 400 Hz.
The corresponding metadata was entered into a database by a nurse.
- Each record was annotated as follows:
-
An initial ECG report string was generated by either:
-
i.67.13% manual interpretation by a human cardiologist
-
ii.31.2% automatic interpretation by ECG-device
-
A.4.45% validation by a human cardiologist
-
B.26.75% incomplete information on human validation
-
A.
-
iii.1.67% no initial ECG report.
In Quality Assessment for Annotation Data (ECG Statements), we provide a more extensive discussion on this step. -
i.
- The report string was converted into a standardized set of SCP-ECG statements including likelihood information for diagnostic statements.
- The heart’s axis and the infarction stadium (if applicable) was extracted from the report.
- A potential second validation (for first evaluation in case of a missing initial report string) was carried out by a second independent cardiologist, who was able to make changes to the ECG statements and the likelihood information directly. In most cases, the deviating opinion was also reported in a second report string.
-
Finally, all records underwent another manual annotation process by a technical expert focusing mainly on qualitative signal characteristics.
Preprocessing
The waveform files were converted from the original proprietary format into a binary format with 16 bit precision at a resolution of 1 μV/LSB. The signals underwent minor processing to remove spikes from switch - on and switch- off processes of the devices, which were found at the beginning and the end of some recordings, and were upsampled to 500 Hz by resampling. For the user’s convenience, we also release a downsampled version of the waveform data at a sampling frequency of 100 Hz.
With the acquisition of the original database from Schiller AG, the full usage rights were transferred to the PTB. The Institutional Ethics Committee approved the publication of the anonymous data in an open-access database (PTB-2020-1). ECGs and patients are identified by unique identifiers. Instead of date of birth we report the age of the patient in years at the time of data collection as calculated using the ECG date. For patients with ECGs taken at an age of 90 or older, age is set to 300 years to comply with Health Insurance Portability and Accountability Act (HIPAA) standards. All ECG dates were shifted by a random offset for each patient while preserving time differences between multiple recordings. The names of validating cardiologists and nurses and recording site (hospital etc.) of the recording were pseudonymized and replaced by unique identifiers. The original data contained implausible height values for some patients. We decided to remove the height values for patients where the body-mass-index calculated from height and weight was larger than 40.
The ECG data was annotated using a codebook (SCP-ECG v0.4 (Annex B)) of ECG statements that preceded the current SCP-ECG standard12. All annotations were converted into SCP-ECG statements by accounting for the minor modifications that occurred between the release of the codebook and the publication of the final standard.
Data Records
The data is composed of the ECG signal waveform data and additional metadata that comprises, most importantly, ECG statements in accordance with the SCP-ECG standard12. This section describes the components of the released data repository5 in detail and is organized as follows: In Waveform Data, we describe how the ECG signal waveform data is stored. Metadata describes the heart of PTB-XL including all information attached to each record.
Waveform Data
For the user’s convenience, we provide waveform data in the WaveForm DataBase (WFDB) format as proposed by PhysioNet (https://physionet.org/about/software/) that has developed into an de-facto standard for the distribution of physiological signal data. In particular, there exist WFDB-parsers for a large number of frequently used programming languages such as C, Python, MATLAB and Java. In addition, the WFDB library also provides conversion routines to other frequently used data formats such as the European Data Format (edf). We stress that the original 16 bit binary data obtained after the conversion from the proprietary file format used by the ECG devices remained unchanged during this process. The WFDB-format only allows for a structured way of accessing the data that includes all required signal-specific metadata, such as channel names or conversion to physical units. In the WFDB-format every ECG is represented by a tuple of two files, a dat-file containing the binary raw data and a corresponding header file with same name and hea-extension. We provide both the original data sampled at 500 Hz as well as a downsampled version at 100 Hz that are stored in respective output folders records100 and records500.
Metadata
The WFDB-format does not provide a standardized way of storing signal-specific metadata. For easy accessibility, we provide the metadata for all ECG records as a table in comma-separated value (csv) format in ptbxl_database.csv containing 28 columns, which can be easily accessed by using existing libraries in all common programming languages. Table 2 gives an overview of the columns provided in this table.
Table 2.
Columns provided in the metadata table ptbxl_database.csv.
| Section | Variable | Data Type | Description |
|---|---|---|---|
| Identifiers | ecg_id | integer | unique ECG identifier |
| patient_id | integer | unique patient identifier | |
| filename_lr | string | path to waveform data (100 Hz) | |
| filename_hr | string | path to waveform data (500 Hz) | |
| General Metadata | age | integer | age at recording in years (see Fig. 3 left) |
| sex | categorical | sex (male 0, female 1) | |
| height | integer | height in centimeters (see Fig. 3 right) | |
| weight | integer | weight in kilograms (see Fig. 3 middle) | |
| nurse | categorical | involved nurse (pseudonymized) | |
| site | categorical | recording site (pseudonymized) | |
| device | categorical | recording device | |
| recording_date | datetime | ECG recording date and time | |
| ECG Statements | report | string | ECG report from diagnosing cardiologist |
| scp_codes | dictionary | SCP ECG statements (see Tables 6, 7 and 8) | |
| heart_axis | categorical | heart’s electrical axis (see Table 10) | |
| infarction_stadium1 | categorical | infarction stadium (see Table 11) | |
| infarction_stadium2 | categorical | second infarction stadium (see Table 11) | |
| validated_by | categorical | validating cardiologist (pseudonymized) | |
| second_opinion | boolean | flag for second (deviating) opinion | |
| initial_autogenerated_report | boolean | initial autogenerated report by ECG device | |
| validated_by_human | boolean | validated by human | |
| Signal Metadata | baseline_drift | string | baseline drift or jump present |
| static_noise | string | electric hum/static noise present | |
| burst_noise | string | burst noise | |
| electrodes_problems | string | electrodes problems | |
| extra_beats | string | extra beats | |
| pacemaker | string | pacemaker | |
| Cross-validation Folds | strat_fold | integer | suggested stratified folds |
Each ECG is identified by a unique ID (ecg_id) and comes with a number of ECG statements (scp_codes) that can be used to train a multi-label classifier that can be evaluated based on the proposed fold assignments (strat_fold).
There are in total 21837 signals from 18885 patients. Figure 2 gives an graphical overview of the temporally ordered dataset in terms of populated fields, where black pixels indicating populated fields and white pixels indicating missing values. Please note how the data acquisition process changed over time, i.e. in the beginning of this study physiological data such as height and weight were gathered more often (mostly diagnostic reports written in English). Also note that towards the end of the study, the fraction of automated reports increases.
Fig. 2.

Overview of populated columns in ptbxl_database.csv. Each entry corresponds to a row in the table in temporal order from top to bottom. Black pixels indicate existing values, missing values remain white.
A detailed breakdown in terms of number of ECGs per patient is given in Table 3. In particular, there are patients for which multiple ECGs available that could be used for longitudinal studies. The rest of this section is organized according to the sections headings in Table 2.
Table 3.
Overview of number of records per patient.
| # Records | 1 | 2 | 3 | 4 | 5 | 6 | 7 | 8 | 9 | 10 |
|---|---|---|---|---|---|---|---|---|---|---|
| # Patients | 16758 | 1604 | 348 | 103 | 43 | 16 | 5 | 4 | 3 | 1 |
Identifiers
Each ECG record is identified by a unique ID (ecg_id) and the corresponding patient is encoded by a patient ID (patient_id). The path to the corresponding waveform data is stored in filename_lr (100 Hz) and filename_hr (500 Hz).
General Metadata
This section covers demographic data and general recording metadata contained in PTB-XL. Demographic data includes age, sex (52% male and 48% female), height (values set for 31.98% of records) and weight (values set for 43.18% of records). The age denotes the patient’s age at the time of the ECG recording. The distributions of age, height, and weight across the whole dataset are shown in Fig. 3. The median age is 62 with interquantile range (IQR) of 22 with minimum age of 0 and maximum age of 95. The median height and weight are 166 and 70 with IQRs of 14 and 20 respectively.
Fig. 3.

Demographic overview of patients in PTB-XL.
The general recording metadata comprises nurse, site, device and recording_date. Both nurse and site are published in pseudonymized form, where in total there are unique nurses across sites, i.e. the location where the ECG was recorded, and recorded using different types of devices. The field recording_date is encoded as YYYY-MM-DD hh:mm:ss.
ECG Statements
This section introduces the ECG statements as the core component of PTB-XL. It is organized as follows: First, we introduce the most important fields, namely report and scp_codes. Afterwards, heart_axis, infarction_stadium1 and infarction_stadium2 are discussed. Finally, we introduce the fields validated_by, second_opinion, initial_autogenerated_report and validated_by_human that are important for the technical validation of the annotation data.
report and scp_codes: The original ECG report is given as string in the report-column and is written in 70.89% German, 27.9% English, and 1.21% Swedish. The ECG report string was converted into structured sets of SCP-ECG statements as described in Methods. All information related to the used annotation scheme is stored in a dedicated table scp_statements.csv that was enriched with additional side-information, see Conversion to other Annotation Standards in Usage Notes for further details.
There are unique SCP-ECG statements used in the dataset. We categorize them by assigning each statement to one or more of the following categories: diagnostic, form and rhythm statements. There are 44 different diagnostic statements, 19 different form statements describing the form of the ECG signal, where 4 statements for diagnostic and form coincide, 12 different non-overlapping rhythm statements describing the cardiac rhythm (Fig. 4 gives an overview as a Venn-diagram of the proposed categories and their overlap). In addition, for all diagnostic statements, a likelihood information was extracted based on certain keywords in the ECG report, see Table 4 for details which is based on7. The likelihood ranges from 0 to 100 conveying the certainty the cardiologist (if the diagnosing cardiologist is very certain about a statement). For form and rhythm statements or in cases where no likelihood information was available, the corresponding likelihood was set to zero. The likelihood information is potentially interesting to account for the non-binary nature of diagnosis statements in real-world data. The SCP statements are presented as a unsorted dictionary (i.e. particular ordering of the statements within the dictionary does not follow any priority) of SCP-ECG statements in the scp_codes-column, where the key relates to the statement itself and the value relates to the likelihood.
Fig. 4.
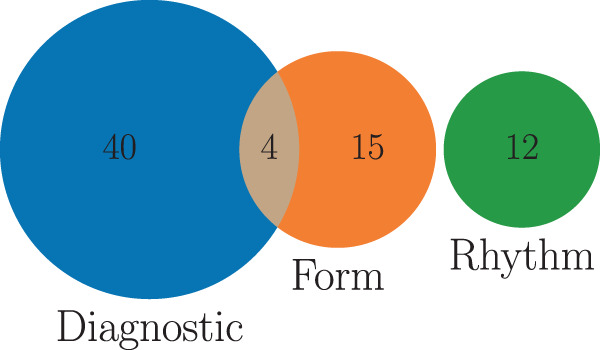
Venn Diagram illustrating the assignment of the given SCP ECG statements to the three categories diagnostic, form and rhythm.
Table 4.
Likelihood statements for diagnostic statements inferred from keywords in the ECG report as introduced in ECG Statements.
| Keywords | Weighting Factor (Confidence) |
|---|---|
| nicht auszuschliessen, cannot rule out, cannot be excluded | 15% |
| möglicherweise, consider, suggest, likely | 35% |
| wahrscheinlich, possible, maybe, probably, ablaufend, Verdacht auf | 50% |
| Sonst, Bild | 80% |
| Consistent with, Diagnose, Zustand nach… | 100% |
Finally, for diagnostic statements we provide a hierarchy of superclasses and subclasses that can be used to train classification algorithms on a set of broader categories instead of the original fine-grained diagnostic labels, see Table 5 for a definition of the acronyms and Fig. 1 for graphical overview of the whole dataset. Tables summarizing the distribution of diagnostic, form and rhythm statements can be found in Tables 6, 7 and 8 respectively, where the first column indicates the acronym associated with the statement (Table 5 for description of acronyms), the second column reflects the number of records (ordered ascending) and the third column gives a short description for each statement. In addition for Table 6 we provide two additional columns indicating the proposed super- and subclass. If we aggregate the diagnostic statements according to superclasses and subclasses using the mapping as described above and in Table 5, the distribution of diagnostic superclass statements assumes the form shown in the uppermost panel in Fig. 5. Particular mentioning deserves the large number of healthy patients that are typically underrepresented in most ECG datasets that are, however, crucial for the development of ECG classification algorithms. Figure 5 shows the distribution of subclasses for a given diagnostic superclass.
Table 5.
SCP-ECG acronym descriptions for super- and subclasses.
| Acronym | SCP statement Description | ||
|---|---|---|---|
| Superclasses | NORM | Normal ECG | |
| CD | Conduction Disturbance | ||
| MI | Myocardial Infarction | ||
| HYP | Hypertrophy | ||
| STTC | ST/T change | ||
| Subclasses | NORM | NORM | Normal ECG |
| CD | LAFB/LPFB | left anterior/left posterior fascicular block | |
| IRBBB | incomplete right bundle branch block | ||
| ILBBB | incomplete left bundle branch block | ||
| CLBBB | complete left bundle branch block | ||
| CRBBB | complete right bundle branch block | ||
| _AVB | AV block | ||
| IVCB | non-specific intraventricular conduction disturbance (block) | ||
| WPW | Wolff-Parkinson-White syndrome | ||
| HYP | LVH | left ventricular hypertrophy | |
| RHV | right ventricular hypertrophy | ||
| LAO/LAE | left atrial overload/enlargement | ||
| RAO/RAE | right atrial overload/enlargement | ||
| SEHYP | septal hypertrophy | ||
| MI | AMI | anterior myocardial infarction | |
| IMI | inferior myocardial infarction | ||
| LMI | lateral myocardial infarction | ||
| PMI | posterior myocardial infarction | ||
| STTC | ISCA | ischemic in anterior leads | |
| ISCI | ischemic in inferior leads | ||
| ISC_ | non-specific ischemic | ||
| STTC | ST-T changes | ||
| NST_ | non-specific ST changes |
Table 6.
Diagnostic Statement Overview, where the acronyms of super- and subclass are introduced in Table 5.
| # Records | Description | Superclass | Subclass | |
|---|---|---|---|---|
| LAFB | 1626 | left anterior fascicular block | CD | LAFB/LPFB |
| IRBBB | 1118 | incomplete right bundle branch block | CD | IRBBB |
| AVB | 797 | first degree AV block | CD | _AVB |
| IVCD | 789 | non-specific intraventricular conduction disturbance (block) | CD | IVCD |
| CRBBB | 542 | complete right bundle branch block | CD | CRBBB |
| CLBBB | 536 | complete left bundle branch block | CD | CLBBB |
| LPFB | 177 | left posterior fascicular block | CD | LAFB/LPFB |
| WPW | 80 | Wolff-Parkinson-White syndrome | CD | WPW |
| ILBBB | 77 | incomplete left bundle branch block | CD | ILBBB |
| 3AVB | 16 | third degree AV block | CD | _AVB |
| 2AVB | 14 | second degree AV block | CD | _AVB |
| LVH | 2137 | left ventricular hypertrophy | HYP | LVH |
| LAO/LAE | 427 | left atrial overload/enlargement | HYP | LAO/LAE |
| RVH | 126 | right ventricular hypertrophy | HYP | RVH |
| RAO/RAE | 99 | right atrial overload/enlargement | HYP | RAO/RAE |
| SEHYP | 30 | septal hypertrophy | HYP | SEHYP |
| IMI | 2685 | inferior myocardial infarction | MI | IMI |
| ASMI | 2363 | anteroseptal myocardial infarction | MI | AMI |
| ILMI | 479 | inferolateral myocardial infarction | MI | IMI |
| AMI | 354 | anterior myocardial infarction | MI | AMI |
| ALMI | 290 | anterolateral myocardial infarction | MI | AMI |
| INJAS | 215 | subendocardial injury in anteroseptal leads | MI | AMI |
| LMI | 201 | lateral myocardial infarction | MI | LMI |
| INJAL | 148 | subendocardial injury in anterolateral leads | MI | AMI |
| IPLMI | 51 | inferoposterolateral myocardial infarction | MI | IMI |
| IPMI | 33 | inferoposterior myocardial infarction | MI | IMI |
| INJIN | 18 | subendocardial injury in inferior leads | MI | IMI |
| PMI | 17 | posterior myocardial infarction | MI | PMI |
| INJLA | 17 | subendocardial injury in lateral leads | MI | AMI |
| INJIL | 15 | subendocardial injury in inferolateral leads | MI | IMI |
| NORM | 9528 | normal ECG | NORM | NORM |
| NDT | 1829 | non-diagnostic T abnormalities | STTC | STTC |
| NST_ | 770 | non-specific ST changes | STTC | NST_ |
| DIG | 181 | digitalis-effect | STTC | STTC |
| LNGQT | 118 | long QT-interval | STTC | STTC |
| ISC_ | 1275 | non-specific ischemic | STTC | ISC_ |
| ISCAL | 660 | ischemic in anterolateral leads | STTC | ISCA |
| ISCIN | 219 | ischemic in inferior leads | STTC | ISCI |
| ISCIL | 179 | ischemic in inferolateral leads | STTC | ISCI |
| ISCAS | 170 | ischemic in anteroseptal leads | STTC | ISCA |
| ISCLA | 142 | ischemic in lateral leads | STTC | ISCA |
| ANEUR | 104 | ST-T changes compatible with ventricular aneurysm | STTC | STTC |
| EL | 97 | electrolytic disturbance or drug (former EDIS) | STTC | STTC |
| ISCAN | 44 | ischemic in anterior leads | STTC | ISCA |
Table 7.
Form Statement Overview.
| # Records | Description | |
|---|---|---|
| NDT | 1829 | non-diagnostic T abnormalities |
| NST_ | 770 | non-specific ST changes |
| DIG | 181 | digitalis-effect |
| LNGQT | 118 | long QT-interval |
| ABQRS | 3327 | abnormal QRS |
| PVC | 1146 | ventricular premature complex |
| STD_ | 1009 | non-specific ST depression |
| VCLVH | 875 | voltage criteria (QRS) for left ventricular hypertrophy |
| QWAVE | 548 | Q waves present |
| LOWT | 438 | low amplitude T-waves |
| NT_ | 424 | non-specific T-wave changes |
| PAC | 398 | atrial premature complex |
| LPR | 340 | prolonged PR interval |
| INVT | 294 | inverted T-waves |
| LVOLT | 182 | low QRS voltages in the frontal and horizontal leads |
| HVOLT | 62 | high QRS voltage |
| TAB_ | 35 | T-wave abnormality |
| STE_ | 28 | non-specific ST elevation |
| PRC(S) | 10 | premature complex(es) |
Table 8.
Rhythm Statement Overview.
| # Records | Description | |
|---|---|---|
| SR | 16782 | sinus rhythm |
| AFIB | 1514 | atrial fibrillation |
| STACH | 826 | sinus tachycardia |
| SARRH | 772 | sinus arrhythmia |
| SBRAD | 637 | sinus bradycardia |
| PACE | 296 | normal functioning artificial pacemaker |
| SVARR | 157 | supraventricular arrhythmia |
| BIGU | 82 | bigeminal pattern (unknown origin, SV or Ventricular) |
| AFLT | 73 | atrial flutter |
| SVTAC | 27 | supraventricular tachycardia |
| PSVT | 24 | paroxysmal supraventricular tachycardia |
| TRIGU | 20 | trigeminal pattern (unknown origin, SV or Ventricular) |
Fig. 5.

Distribution of diagnostic subclasses for given diagnostic superclasses.
In summary, we provide six sets of annotations with different levels of granularity, namely raw (all statements together), diagnostic, diagnostic superclass, diagnostic subclass statements, form and rhythm statements. Depending on granularity, a different number of statements per ECG record is available. A detailed breakdown in terms of number of statements in each level per ECG signal is given in Table 9. For example, there are 410 samples for which no diagnostic statement is given, which are mainly pacemaker ECGs.
Table 9.
Overview of number of statements per ECG introduced in ECG Statements.
| Level | 0 | 1 | 2 | 3 | 4 | 5 | 6 | 7 | 8 | 9 |
|---|---|---|---|---|---|---|---|---|---|---|
| Diagnostic | 407 | 15019 | 4242 | 1515 | 529 | 121 | 4 | 0 | 0 | 0 |
| Diagnostic Superclass | 407 | 16272 | 4079 | 920 | 159 | 0 | 0 | 0 | 0 | 0 |
| Diagnostic Subclass | 407 | 15239 | 4171 | 1439 | 475 | 102 | 4 | 0 | 0 | 0 |
| Form | 12849 | 6693 | 1672 | 524 | 90 | 9 | 0 | 0 | 0 | 0 |
| Rhythm | 771 | 20923 | 142 | 1 | 0 | 0 | 0 | 0 | 0 | 0 |
| All | 0 | 705 | 11247 | 5114 | 2597 | 1254 | 597 | 253 | 63 | 7 |
heart_axis, infarction_stadium1 and infarction_stadium2: The column heart_axis was automatically extracted from the ECG report and is set for 61.05% of the records. It represents the heart’s electrical axis in the Cabrera system. Table 10 shows the distribution, the acronyms and the respective descriptions for entries in the column heart_axis.
Table 10.
Distribution of heart_axis as introduced in ECG Statements.
| Keywords | # Records | |
|---|---|---|
| UNK | Unknown | 8505 |
| MID | Normal axis | 7687 |
| LAD | Left axis deviation | 3764 |
| ALAD | Abnormal LAD, extreme left axis deviation | 1382 |
| RAD | Right axis deviation | 221 |
| ARAD | Abnormal RAD, extreme right axis deviation | 122 |
| AXL | Horizontal axis | 102 |
| AXR | Vertical axis | 51 |
| SAG | Saggital type (S1-S2-S3 Pattern) | 3 |
In case of myocardial infarction, potentially multiple entries for infarction stadium (infarction_stadium and infarction_stadium2) were extracted from the report string. Table 11 shows the respective distributions in addition to a short description, see7 for further details. In particular, we distinguish also intermediate stages “stadium I-II” and “stadium II-III” in addition to the conventionally used infarction stages I, II, and III.
Table 11.
Distribution of infarction stadium across the dataset as introduced in ECG Statements.
| Keyword | # Records | |
|---|---|---|
| Stadium I | acut, early | 186 |
| Stadium I–II | acut/subacut, ablaufend | 5 |
| Stadium II | recent, subacut, bereits abgelaufen | 107 |
| Stadium II–III | subacut/chronisch | 943 |
| Stadium III | old, abgelaufen, chronisch | 1045 |
| unknown | uncertain, unknown, unbekannt | 3443 |
Counts are cumulated from infarction_stadium and infarction_stadium2 which are only set to a value if at least one statement belongs to the superclass of Myocardial Infarction (MI).
validated_by and second_opinion: The validated_by-column provides the identifier of the cardiologist who performed the initial annotation. The column second_opinion is set to true for records, where a second opinion is available and the corresponding report string is appended to report with a preceding “Edit:”. The column initial_autogenerated_report is set to true for all records, where the report string ended with “unbestätigter Bericht’” indicating that the initial report string was generated by an ECG device, as described in Data Acquisition. Unfortunately, there is no precise record of the ECGs that underwent the second validation. For this reason, we store a conservative estimate if the record was validated by a human cardiologist in the column validated_by_human. It is set to true for all records, where validated_by is set, or initial_autogenerated_report is false, or second_opinion is true, see Quality Assessment for Annotation Data (ECG Statements) in Technical Validation for more details.
Signal Metadata
As additional metadata that might potentially be of future use, the signal quality was quantified by a different person with long technical expertise in ECG devices and signals, who went through the whole dataset and annotated the records with respect to signal characteristics such as noise (static_noise and burst_noise), baseline drifts baseline_drift and other artifacts such as electrodes_problems. In addition to these technical signal characteristics, we provide extra_beats for counting extra systoles which is set for 8.95% of records and pacemaker for signal patterns indicating an active pacemaker (for 1.34% of records).
Possible findings in each of the different categories are reported as string without a regular syntax. Overall, these reports represent a very rich source of additional information. The most basic use of these fields is to filter for data of a particularly high quality by excluding all records with non-empty values in the columns mentioned above. We refer to Quality Assessment for Waveform Data in Technical Validation for a summary of the signal quality in terms of the provided annotations.
Cross-validation Folds
For comparability of machine learning algorithms trained on PTB-XL, we provide fold assignments (strat_fold) for all ECG records that can be used to implement recommended train-test splits. The incentive to use stratified sampling is to reduce bias and variance of score estimations, see17. In addition, it leads to a test set distribution for holdout evaluation that mimics the training set distribution as closely as possible to disentangle aspects of covariate shift/dataset shift from the evaluation procedure. We extend existing multilabel stratification methods from the literature to achieve a balanced label while additionally providing two distinguished folds with a particularly high label quality. During this process, each record is assigned to one of ten folds, where the tenth fold is intended to be used for holdout set evaluation and the penultimate ninth fold is supposed to be used as validation set, see Prediction Tasks and Train-Test-Splits for ML Algorithms in Usage Notes for a more detailed description. The fold assignment always respects the underlying patient assignments. This avoids data leakage arising from having ECG signals from the same patient in different folds. In detail, the fold assignment proceeds as follows:
The proposed procedure extends existing stratified sampling methods from the literature18 by accounting for sampling based on patients and by optionally incorporating quality constraints for certain folds. To achieve not only a balanced label distribution but also a balanced age and sex distribution, we do not only incorporate all ECG statements but also sex and age (in five bins each covering 20 years). All ECG statements, sex and age for a given patient are appended into a single list with potentially non-unique entries to ensure sampling based on patients. Then the labels are distributed label-by-label as proposed18, starting with the least populated label within the remaining records. Patients with ECG records that are annotated with this label are subsequently distributed onto the folds. If there is a unique fold that is in most need of the given label, all ECGs of the patient that is currently under consideration are assigned to this fold. In case of a tie, the assignment proceeds by trying to balance the overall sizes of the candidate folds.
During this process, we keep track of the quality of the ECG annotations. A patient is considered clean if for all corresponding ECGs validated_by_human is set to true. When assigning ECGs from a patient that does not carry this flag, we exclude the ninth and tenth fold from the set of folds the samples can be assigned to. As the dataset and in particular the ratio of clean vs. non-clean patients is large enough, the sampling procedure still leads to a label distribution in the clean folds that still approximates the overall distribution of labels and sexes in the dataset very well, see Fig. 6.
Fig. 6.

Distribution of ECG statements, sex and age across ten folds with stratified folds. The ninth and tenth fold are folds with a particularly high label quality that are supposed to be used as validation and test sets.
We believe that this procedure is of general interest for multi-label datasets with multiple records per patient and, in particular in the current context, for exploring the impact of different stratification methods. For the fold assignments in strat_fold, we based the stratification on all available ECG statements but it might also conceivable to consider just subsets of labels, such as all diagnostic statements. To allow a simple exploration of these issues, we provide a Python implementation of the stratification method in the Supplementary Material.
Technical Validation
Quality Assessment for Waveform Data
Since we present the waveform data in its original (binary) form without any modifications (apart from saving it in WFDB-format), we expect a lot of variability with respect to recording noise and several artifacts. For this purpose we summarize the results of the technical validation of the signal data by an technical expert briefly. The signal quality was quantified by a person with technical expertise according to the following categories:
baseline_drift for global drifts in 7.36% of the signal.
static_noise for noisy signals and burst_noise for noise peaks, set for 14.94% and 2.81% of records retrospectively.
electrodes_problems for individual problems with electrodes (0.14% of records).
In total 77.01% of the signal data are of highest quality in the sense of missing annotation in the signal quality metadata. At this point we would like to stress again that the different quality levels reflect the range of different quality levels of ECG data in real-world data and have to be seen as one of the particular strengths of the dataset. This dataset contains a realistic distribution of data quality in clinical practice and is an invaluable source for properly assessing the performance of ML algorithms in the sense of the robustness against changes in the environmental conditions or against various imperfections in the input data.
Quality Assessment for Annotation Data (ECG Statements)
As already mentioned in ECG Statements, it has not been possible to retrospectively reconstruct the labeling process in all cases. In some cases the validating cardiologist (validated_by-column) was left empty even though an automatically created initial ECG report (autogenerated_initial_report) was validated by a human cardiologist. In addition, there is no precise record of those ECGs that went through the second human validation step. Before submission, we randomly selected a subset of recordings from our proposed test set via strati fied sampling (as described in Crossvalidation Folds) and had them reviewed by another independent cardiologist (Author FIL). These examinations confirmed the annotations.
Due to missing information about this process, we can only conservatively estimate that set of ECGs that were potentially only automatically annotated. Therefore, we set validated_by_human to false for the set of automatically annotated ECGs (initial_autogenerated_report=True) with empty validated_by-column and second_opinion=False. The precise fractions are as follows:
- 73.7% validated_by_human=True
- 56.9% validated_by is given
- 16.18% initial_autogenerated_report=False
- 0.62% second_opinion is given
26.3% validated_by_human=False
This is to the best of our knowledge a very conservative estimate as a large fraction of the dataset went through the second validation step, but from our perspective the most transparent way of dealing with this missing metadata issue. Moreover, the second validation was not performed independently but as an validation of the first annotation. Unfortunately, there is no precise record of which diagnostic statements were changed during the final validation step. Therefore, even though most records were evaluated by two cardiologists (albeit not independently), one can only reasonably claim a single human validation.
To make best use of the available data, we decided to incorporate the information which ECGs certainly underwent human validation into the sampling process. To this end, we construct the fold assignment process in such a way that the tenth fold only contains only ECGs that certainly underwent a human validation. This allows to use the tenth fold as a reliable test set with best available label quality for a simple hold-out validation. This is described in detail in Prediction Tasks and Train-Test-Splits for ML Algorithms in Usage Notes.
Usage Notes
In this section, we provide instructions on how to use PTB-XL to train and validate automatic ECG interpretation algorithms. To this end, we first explain how to convert to other standards than SCP in Conversion to other Annotation Standards, afterwards we explain in Prediction Tasks and Train-Test-Splits for ML Algorithms how the proposed cross-validation folds are supposed to be used for a reliable benchmarking of machine learning algorithms on this dataset and outline possible prediction tasks on the dataset. Finally, in Example Code we provide a basic code example in Python that illustrates how to load waveform data and metadata for further processing and provide directions for further analysis.
Conversion to other Annotation Standards
As already mentioned in ECG Statements, besides our proposed SCP standard, we also provide the possibility of transition to other standards such as the scheme put forward by the American Heart Association19. For this purpose and the user’s convenience our repository also provides SCP_labelmap.csv with further information, see ECG Statements for details on the used SCP-ECG statements.
Table 12 gives a detailed description of the table scp_statements.csv. The first column serves as index with SCP statement acronym, the second, eighth and ninth column (description, Statement Category, SCP-ECG Statement Description) describes the respective acronym. The third, fourth and fifth column (diagnostic, form and rhythm) indicate to which broad category each index belongs to. The sixth and seventh column (diagnostic_class and diagnostic_subclass) describes our proposed hierarchical organization of diagnostic statements, see ECG Statements for additional information on the latter two properties.
Table 12.
SCP-ECG statement summary.
| Column | Description |
|---|---|
| acronym | SCP statement |
| description | short statement description |
| diagnostic | flag if statement is diagnostic |
| form | flag if statement is related to form |
| rhythm | flag if statement is related to rhythm |
| diagnostic_class | superclass for diagnostic statements |
| diagnostic_subclass | subclass for diagnostic statements |
| Statement Category | official SCP statement category |
| SCP-ECG Statement Description | official SCP statement description |
| AHA code | unique ID in the AHA standard |
| aECG REFID | IEEE 11073-10102 Annotated ECG (aECG) standard |
| CDISC Code | Controlled Terminology |
| DICOM Code | DICOM Tags |
Description of annotation scheme stored in scp_statements.csv.
The latter three columns of Table 12 provide cross-references to other popular ECG annotation systems as provided on the SCP-ECG homepage (http://webimatics.univ-lyon1.fr/scp-ecg/), namely: AHA aECG REFID, CDISC and DICOM. In Example Code, we provide example Python code for using scp_statements.csv appropriately.
Prediction Tasks and Train-Test-Splits for ML Algorithms
The PTB-XL dataset represents a very rich resource for the training and the evaluation of ECG analysis algorithms. Whereas a comprehensive discussion of possible prediction tasks that can be investigated based on the dataset is clearly beyond the format of this data descriptor, we still find it worthwhile sketching possible future direction. The most obvious tasks are prediction tasks that try to infer different subsets of ECG statements from the ECG record. These tasks can typically be framed as multi-label classification problems. Although a thorough description of proposed evaluation metrics would go beyond of the scope of this manuscript, we highly recommend macro-averaged and threshold-free metrics, such as the macro-averaged area under the receiver operating curve (AUROC). Micro-averaged metrics would overrepresent highly populated classes, whose distribution just reflects the data collection process rather than the statistical distribution of the different pathologies in the population. The large number of more than 2000 patients with multiple ECGs potentially allows to develop prediction models for future cardiac conditions or their progression from previously collected ECGs. Beyond ECG statement prediction, the dataset allows for age/sex inference from the raw ECG record and to develop ECG quality assessment algorithms based on the signal quality annotation. Finally, the provided likelihoods for diagnostic statements can be used to study possible relations between prediction uncertainty compared to human uncertainty assessments.
For comparability of machine learning algorithms trained on PTB-XL, we provide recommended train-test splits in the form of assignments of the record to one of ten cross-validation folds. We propose to use the tenth fold, which is ensured to contain only ECGs that have certainly be validated by at least one human cardiologist and are therefore presumably of highest label quality, to separate a test set that is only used for the final performance evaluation of a proposed algorithm. The remaining nine folds can be used as training and validation set and split at one’s own discretion potentially utilizing the recommended fold assignments. As the ninth and the tenth fold satisfy the same quality criteria, we recommend to use the ninth fold as validation set.
Example Code
In Fig. 7, we provide a basic code example in Python for loading both waveform and metadata, aggregating the diagnostic labels based on the proposed diagnostic superclasses and split data into train and test set using the provided crossvalidation folds. The two main resulting objects are the raw signal data (as a numpy array of shape 1000 × 12 for the case of 100 Hz data) loaded with wfdb as a numpy array as described in Waveform Data and the annotation data from ptbxl_database.csv as a pandas dataframe with 26 columns as described in Metadata. In addition, we illustrate, how to apply the the provided mapping of individual diagnostic statements to diagnostic superclass mapping as introduced in ECG Statements and described in Conversion to other Annotation Standards which consists of loading scp_statements.csv, selecting for diagnostic and creating multi-label lists by applying diagnostic_superclass given the index. Finally, we apply the suggested split into train and test as described in Prediction Tasks and Train-Test-Splits for ML Algorithms.
Fig. 7.

Example Python code for loading data and labels also using the suggested folds and aggregation of diagnostic labels.
After the raw data has been loaded, there are different possible directions for futher analysis. First of all, there are dedicated packages such as BioSPPy (https://github.com/PIA-Group/BioSPPy) that allow to extract ECG-specific features such as R-peaks. Such derived features or the raw signals themselves can then be analyzed using classical machine learning algorithms as provided for example by scikit-learn (https://scikit-learn.org) or popular deep learning frameworks such as TensorFlow (https://www.tensorflow.org) or PyTorch (https://pytorch.org).
Supplementary information
Acknowledgements
The authors thank Dr. Lothar Schmitz for numerous annotations and providing medical expertise and Dr. Hans Koch for initiating and overseeing the creation of the original database. This work was supported by the Bundesministerium für Bildung und Forschung (BMBF) through the Berlin Big Data Center under Grant 01IS14013A and the Berlin Center for Machine Learning under Grant 01IS18037I and by the EMPIR project 18HLT07 MedalCare. The EMPIR initiative is cofunded by the European Union’s Horizon 2020 research and innovation program and the EMPIR Participating States.
Author contributions
Creation and maintenance of the original database: R.D.B. and D.K.; ECG quality assessment: R.D.B., D.K. and F.I.L.; Conception of the release process: P.W., N.S. and T.S.; Data harmonization: P.W. and N.S.; Providing conversion routines: P.W.; Manuscript preparation: P.W. and N.S.; Supervision of the project: W.S. and T.S.; Critical comments and revision of manuscript: all authors.
Code availability
The code for dataset preparation is not intended to be released as it does not entail any potential for reusability. We provide the stratified sampling routine in Supplementary File 1 to allow users to create stratification folds based on user-defined preferences.
Competing interests
The authors declare no competing interests.
Footnotes
Publisher’s note Springer Nature remains neutral with regard to jurisdictional claims in published maps and institutional affiliations.
These authors contributed equally: Patrick Wagner, Nils Strodthoff.
Supplementary information
is available for this paper at 10.1038/s41597-020-0495-6.
References
- 1.Dagenais, G. R. et al. Variations in common diseases, hospital admissions, and deaths in middle-aged adults in 21 countries from five continents (PURE): a prospective cohort study. The Lancet (2019). [DOI] [PubMed]
- 2.Hannun AY, et al. Cardiologist-level arrhythmia detection and classification in ambulatory electrocardiograms using a deep neural network. Nature Medicine. 2019;25:65–69. doi: 10.1038/s41591-018-0268-3. [DOI] [PMC free article] [PubMed] [Google Scholar]
- 3.Attia ZI, et al. An artificial intelligence-enabled ECG algorithm for the identification of patients with atrial fibrillation during sinus rhythm: a retrospective analysis of outcome prediction. The Lancet. 2019;394:861–867. doi: 10.1016/S0140-6736(19)31721-0. [DOI] [PubMed] [Google Scholar]
- 4.Schläpfer J, Wellens HJ. Computer-Interpreted Electrocardiograms. Journal of the American College of Cardiology. 2017;70:1183–1192. doi: 10.1016/j.jacc.2017.07.723. [DOI] [PubMed] [Google Scholar]
- 5.Wagner P, Strodthoff N, Bousseljot R, Samek W, Schaeffter T. 2020. PTB-XL, a large publicly available electrocardiography dataset. PhysioNet. [DOI] [PMC free article] [PubMed]
- 6.Bousseljot R, Kreiseler D, Schnabel A. Nutzung der EKG-Signaldatenbank CARDIODAT der PTB über das Internet. Biomedizinische Technik/Biomedical Engineering. 1995;40:317–318. [Google Scholar]
- 7.Bousseljot R, Kreiseler D. Ergebnisse der EKG-Interpretation mittels Signalmustererkennung. Herzschrittmachertherapie + Elektrophysiologie. 2000;11:197–206. doi: 10.1007/s003990070017. [DOI] [PubMed] [Google Scholar]
- 8.Bousseljot R, Kreiseler D. Waveform recognition with 10,000 ECGs. Computers in Cardiology. 2000;27:331–334. [Google Scholar]
- 9.Bousseljot R, Kreiseler D. ECG signal pattern comparison via Internet. Computers in Cardiology. 2001;28:577–580. [Google Scholar]
- 10.Bousseljot R, et al. Telemetric ECG diagnosis follow-up. Computers in Cardiology. 2003;30:121–124. [Google Scholar]
- 11.Bousseljot R, Kreiseler D, Mensing S, Safer A. Two probabilistic methods to characterize and link drug related ECG changes to diagnoses from the PTB database: Results with Moxifloxacin. Computers in Cardiology. 2008;35:217–220. [Google Scholar]
- 12.ISO Central Secretary. Health informatics – Standard communication protocol – Part 91064: Computer-assisted electrocardiography. Standard ISO 11073-91064:2009, International Organization for Standardization, Geneva, CH (2009).
- 13.Goldberger AL, et al. PhysioBank, PhysioToolkit, and PhysioNet. Circulation. 2000;101:e215–e220. doi: 10.1161/01.cir.101.23.e215. [DOI] [PubMed] [Google Scholar]
- 14.Clifford, G. et al. AF Classification from a Short Single Lead ECG Recording: the Physionet Computing in Cardiology Challenge 2017. In 2017 Computing in Cardiology Conference, vol. 44, 1–4 (Computing in Cardiology, 2017). [DOI] [PMC free article] [PubMed]
- 15.Liu F, et al. An Open Access Database for Evaluating the Algorithms of Electrocardiogram Rhythm and Morphology Abnormality Detection. Journal of Medical Imaging and Health Informatics. 2018;8:1368–1373. doi: 10.1166/jmihi.2018.2442. [DOI] [Google Scholar]
- 16.Arnaud P, et al. Common Standards for Quantitative Electrocardiography: Goals and Main Results. Methods of Information in Medicine. 1990;29:263–271. doi: 10.1055/s-0038-1634793. [DOI] [PubMed] [Google Scholar]
- 17.Kohavi, R. A study of cross-validation and bootstrap for accuracy estimation and model selection. In 14th International Joint Conference on Artificial Intelligence (IJCAI), vol. 2, 1137–1143 (1995).
- 18.Sechidis, K., Tsoumakas, G. & Vlahavas, I. On the Stratification of Multi-label Data. In Gunopulos, D., Hofmann, T., Malerba, D. & Vazirgiannis, M. (eds) Machine Learning and Knowledge Discovery in Databases, 145–158 (Springer Berlin Heidelberg, 2011).
- 19.Mason JW, Hancock EW, Gettes LS. Recommendations for the standardization and interpretation of the electrocardiogram. Journal of the American College of Cardiology. 2007;49:1128–1135. doi: 10.1016/j.jacc.2007.01.025. [DOI] [PubMed] [Google Scholar]
- 20.Moody GB, Mark RG. Development and evaluation of a 2-lead ecg analysis program. Computers in Cardiology. 1982;9:39–44. [Google Scholar]
- 21.Zhang, J., Wang, L., Liu, X., Zhu, H. & Dong, J. Chinese Cardiovascular Disease Database (CCDD) and Its Management Tool. In 2010 IEEE International Conference on BioInformatics and BioEngineering, 66–72 (2010).
- 22.Couderc, J.-P. The telemetric and holter ECG warehouse initiative (THEW): A data repository for the design, implementation and validation of ECG-related technologies. In 2010 Annual International Conference of the IEEE Engineering in Medicine and Biology, 6252–6255 (IEEE, 2010). [DOI] [PMC free article] [PubMed]
- 23.Moody GB, Muldrow W, Mark RG. A noise stress test for arrhythmia detectors. Computers in Cardiology. 1984;11:381–384. [Google Scholar]
- 24.Moody G, Mark R. The impact of the MIT-BIH Arrhythmia Database. IEEE Engineering in Medicine and Biology Magazine. 2001;20:45–50. doi: 10.1109/51.932724. [DOI] [PubMed] [Google Scholar]
- 25.Greenwald, S. D. The development and analysis of a ventricular fibrillation detector. Master’s thesis, Massachusetts Institute of Technology (1986).
- 26.Nolle F, Badura F, Catlett J, Bowser R, Sketch M. CREI-GARD, a new concept in computerized arrhythmia monitoring systems. Computers in Cardiology. 1986;13:515–518. [Google Scholar]
- 27.Taddei A, et al. The European ST-T database: standard for evaluating systems for the analysis of ST-T changes in ambulatory electrocardiography. European Heart Journal. 1992;13:1164–1172. doi: 10.1093/oxfordjournals.eurheartj.a060332. [DOI] [PubMed] [Google Scholar]
Associated Data
This section collects any data citations, data availability statements, or supplementary materials included in this article.
Data Citations
- Wagner P, Strodthoff N, Bousseljot R, Samek W, Schaeffter T. 2020. PTB-XL, a large publicly available electrocardiography dataset. PhysioNet. [DOI] [PMC free article] [PubMed]
Supplementary Materials
Data Availability Statement
The code for dataset preparation is not intended to be released as it does not entail any potential for reusability. We provide the stratified sampling routine in Supplementary File 1 to allow users to create stratification folds based on user-defined preferences.