

Abstract
An ever-evolving understanding of autism spectrum disorder (ASD) pathophysiology necessitates that diagnostic standards also evolve from being observation-based to include quantifiable clinical measurements. The multisystem nature of ASD motivates the use of multivariate methods of statistical analysis over common univariate approaches for discovering clinical biomarkers relevant to this goal. In addition to characterization of important behavioral patterns for improving current diagnostic instruments, multivariate analyses to date have allowed for thorough investigation of neuroimaging-based, genetic, and metabolic abnormalities in individuals with ASD. This review highlights current research using multivariate statistical analyses to quantify the value of these behavioral and physiological markers for ASD diagnosis. A detailed discussion of a blood-based diagnostic test for ASD using specific metabolite concentrations is also provided. The advancement of ASD biomarker research promises to provide earlier and more accurate diagnoses of the disorder.
1. Introduction
The diagnosis of autism spectrum disorder (ASD) is based upon its core symptoms of social/communication deficits and restricted, repetitive behaviors.1 The Centers for Disease Control and Prevention recently estimated the prevalence of ASD among eight-year-old children in the United States to be 1 in 59 for the year 2014,2 a prevalence that has been on a consistent upward trajectory since the 1990s and increasing significantly compared to other notable childhood disorders.3 Similarly, work based upon the 2016 National Survey of Children’s Health found the prevalence of parent-reported ASD to be 1 in 40 among children and adolescents aged 0–17 years.4 The resulting economic burden of ASD in the United States, accounting for medical costs, caretaking, and lost productivity time, is estimated at $268 billion annually.5,6 Globally, ASD has the highest burden among all mental disorders in children younger than five years of age.7
The current understanding of ASD is that it is caused by a combination of genetic predisposition and environmental contributors.8–10 However, specific knowledge of the biological factors contributing to ASD etiology is generally lacking. As a result, there are no clinically accepted biomarkers for ASD diagnosis and diagnosis is instead made after clinical observation of an individual’s behavior. Assessment based solely on behavior introduces substantial variation into the timing of ASD diagnosis, which is reflected in the median diagnosis age being approximately 52 months in the United States2 despite stable diagnoses being possible by as early as 18 months.11 The absence of biomarkers can be at least partially attributed to researchers’ focus on searching for individual measurements that can identify the disorder; however, due to the heterogeneity and the multisystem nature of ASD, such univariate approaches are unlikely to provide satisfactory diagnostic results.12 The use of multivariate analyses is likely necessary to uncover meaningful biological relationships for ASD diagnosis.
This review aims to provide a summary of recent advances towards the development of multivariate biomarkers for ASD that hold promise for achieving higher diagnostic accuracy and/or lower ages of diagnosis than the current standards for diagnosis. Towards this goal, we will present the current social and behavioral standards for ASD diagnosis and their shortcomings. We will then discuss progress made in developing multivariate biomarkers from several domains of quantitative measurements, including behavioral, neuroimaging, genetic, and metabolic measurements, and how these biomarkers can contribute to earlier and more accurate ASD diagnosis, risk prediction, and prediction of treatment outcomes. This discussion will be made in the context of differentiating individuals with ASD from typically developing (TD) individuals as most studies in the literature focus on this comparison, although differentiating individuals with ASD from those with developmental delay (DD) or siblings with ASD would also represent relevant clinical goals.
2. The Current Standard of ASD Diagnosis
The diagnostic criteria for ASD are defined in the American Psychiatric Association’s Diagnostic and Statistical Manual of Mental Disorders (DSM) and the World Health Organization’s International Classification of Diseases (ICD), both of which are outlined below in further detail. In addition to these definitions, ASD screening tools exist to promote awareness and early evaluation. Many of these tools are built off the diagnostic definitions and/or documented behavioral characteristics.13
2.1. ASD Diagnostic Definitions
The American Psychiatric Association (APA) maintains diagnostic criteria for ASD in the DSM. The current edition of the DSM (DSM-V) was published in 2013 and defines the two primary criteria for ASD diagnosis as (1) social communication/interaction deficits and (2) the presentation of restricted and repetitive patterns of behavior.1 In addition, symptoms must appear during early development, cause functional impairments, and not be explained by other developmental delays/disabilities. By nature of it being a spectrum disorder, a diagnosis of ASD encompasses the symptoms of several disorders (autism, Asperger’s syndrome, pervasive developmental disorders (PDDs) not otherwise specified, and childhood disintegrative disorder) that were considered separate diagnoses under the previous edition of the DSM (DSM-IV-TR).14 All individuals previously diagnosed with any singular pervasive developmental disorder are considered diagnosed with ASD. It has been estimated that ASD prevalence was 4% higher with the DSM-IV-TR definition compared to the current definition in the DSM-V.2
Similarly, the World Health Organization (WHO) maintains the ICD, which is currently on its 10th revision (ICD-10) and defines/codes all diseases, disorders, and health-related issues. Contrasting with the “spectrum” designation of the DSM-V, the ICD-10 does not define ASD as its own disorder; instead, its constituent disorders are defined individually and are each coded separately.15 However, these disorders are all still characterized by socialization and communication deficits as well as repetitive patterns in behavior, with symptoms usually presenting before three years of age.
2.2. Diagnostic Assessments for ASD
The Autism Diagnostic Interview-Revised (ADI-R)16 and Autism Diagnostic Observation Schedule (ADOS)17 are two gold-standard instruments used to aid with the diagnosis of ASD. Many diagnostic instruments for ASD other than the ADI-R and ADOS also exist, but a comprehensive discussion of those tools is outside the scope of this review (and we refer the reader to other articles for detailed reviews of these instruments18–22). Overall, the variety of tools available in addition to the diverse backgrounds of evaluators (e.g., developmental pediatrician, psychiatrist, neurologist, etc.) contributes to a highly heterogeneous process for ASD diagnosis.
2.3. Trends in Diagnosis Associated with Current Practices
The subjective nature of behavioral diagnoses as well as the heterogeneity of the disorder has contributed to significant variation in the age of ASD diagnosis. Studies have shown stable diagnoses at 36 months,23 24 months,24,25 and even 18 months.11,26 However, the median age of first ASD diagnosis in the United States is currently estimated at 52 months,2 and is estimated at 55 months in the United Kingdom.27 The presence of comorbid conditions introduces variation into the clinical manifestations of ASD, and may affect the age at which ASD’s core symptoms are recognized depending on which conditions are present (for example, epilepsy may increase the index-of-suspicion for ASD while anxiety may lower it).28 Earlier diagnoses are commonly found in boys, in children with an IQ of 70 or less, and in children with developmental regression.29 Diagnosis age is also affected by a child’s individual developmental trajectory30,31 as well as sociodemographic and socioeconomic factors.32–35 Lower maternal education and being a racial minority may contribute to a delay in age of ASD diagnosis.34 Higher maternal age is associated with younger age of first evaluation, although dependent on other sociodemographic variables.35
2.4. Treatment Impact Due to an Earlier ASD Diagnosis
It is imperative that ASD diagnoses be made as early as possible to expedite the onset of treatment. Behavioral therapies36–38 and parent-mediated intervention,39 among other forms of intervention,40,41 have been found to offer short- and/or long-term improvement to ASD-related symptoms. Earlier intervention also provides substantial economic savings in the long-term.42,43 Later ASD diagnosis minimizes or eliminates these benefits, prompting the development of more reliable tests to improve the early identification of ASD. The timing of ASD diagnosis is also critical as it can affect children’s eligibility for certain services such as early intervention programs and Individualized Education Plans.44
3. Shifting the Paradigm of ASD Diagnosis
ASD is widely acknowledged across the literature as being a multisystem disorder,45,46 with its pathophysiology engaging the central nervous system,47 immune system,48 and digestive system,49 among others. However, the current criteria for ASD diagnosis fail to consider these far-reaching effects in the body and ignore a large number of potentially valuable markers that could be used to aid in diagnosis and/or screening. Attaining more accurate tests for identifying ASD will require diagnostic standards to reflect the disorder’s systemic nature and consider factors beyond its behavioral presentation. Determination of an objective, quantifiable, and biologically-based metric for assessing ASD status, which so far has not been achieved with wide agreement, would signify an important step in this direction. Biomarker-based diagnoses would also be of particular value for high-risk individuals/groups where ASD is more likely to be present, and for populations where ASD diagnoses may be missed more frequently (e.g., girls and certain ethnic groups).
3.1. The Opportunity for ASD Biomarkers
The National Institutes of Health Biomarkers Definitions Working Group define a biomarker as “a characteristic that is objectively measured and evaluated as an indicator of normal biological processes, pathogenic processes, or pharmacologic responses to a therapeutic intervention.”50 Examples of biomarkers already commonly used in medical practice are glycated hemoglobin levels for diagnosing diabetes,51 blood cholesterol levels for assessing heart disease risk,52 and mutations in the BRCA genes that signal increased risk of developing breast cancer.53 Biomarkers have use not only for diagnosing individuals that currently have a condition or disorder, but also for assessing severity of symptoms, predicting future risk of developing the condition before onset of symptoms, evaluating outcomes of clinical treatment, and even identifying subgroups of individuals with the condition.12 A reliable biomarker or set of biomarkers for ASD, which should be attainable given the disorder’s biological origins, would help to fill in existing gaps in the biological knowledge needed to achieve these degrees of assessment.
Recent explosions in “big data” and “open data” have granted researchers access to vast amounts of information that hold great potential for identifying biomarkers for ASD diagnosis.54–56 This has greatly accelerated the collection and sharing of genetic, metabolic, and physiological measures (to name a few) that could provide key insights into specific factors contributing to ASD’s etiology. However, with these expansive volumes of data also come large amounts of noise that may cloud the interpretation of potentially useful patterns. It is therefore necessary for data miners, in close collaboration with clinicians,57 to determine methods for filtering out the unimportant data from those that can be useful for development of potential biomarkers.
3.2. The Role of Multivariate Statistical Modeling in Biomarker Discovery
Historically, many studies have reported biomarker efficacy of a single measurement, such as a metabolic concentration, in terms of the difference in population mean or median between a group of individuals with ASD and a control group. This difference is usually quantified statistically by a p-value or a measure of effect size. While such univariate comparisons are useful for identifying biological systems that may be abnormal in ASD, they do not provide information on the value that a measurement may have for diagnosing individuals with ASD; that is, the amount of separation between the groups is not reflected in the univariate statistics. A statistically significant difference between ASD and control (e.g., TD, DD, or siblings with ASD) groups does not necessarily reflect a measurement that can be used for accurately identifying individuals from the two groups (see Figure 1 for an illustration). In this regard, researchers should be cautious when reporting on potential biomarkers of ASD from univariate statistics alone.
Fig 1.

Example data for an arbitrary quantity measured in 25 individuals with autism spectrum disorder (ASD) and 25 typically developing (TD) individuals. Values for both groups are sampled from normal distributions with equal variances. Comparison of group means (denoted by the solid horizontal lines) with Student’s t-test yields a p-value of 0.033, indicating a statistically significant difference at a significance level of α = 0.05. However, the difference in group means is not sufficient for meaningful classification due to the overlap in the distributions of the measurements of the ASD and TD groups.
Analyses aiming to quantify a biomarker’s usefulness for diagnosing individuals with ASD should instead focus on individual-level statistics rather than differences at the population level.12 In this regard, multivariate statistical modeling offers tremendous potential for biomarker discovery as compared to traditional univariate approaches. As the name suggests, multivariate methods incorporate the contributions of multiple variables at once and model the relationships between these variables to yield an output statistic/score for each individual. Given the complex multisystem nature of ASD, a viable biomarker for the disorder is unlikely to come from a single measurement alone. Multivariate models are more likely to be able to capture relationships, both known and unknown, between systems and variables that are abnormal in ASD pathophysiology.58
A subset of multivariate statistical techniques aims to maximize separation between individuals in two or more groups. These model types are useful for classification tasks in which the goal is to distinguish individuals with ASD from TD individuals (or DD individuals or siblings with ASD if desired) and are commonly applied in machine learning algorithms. Furthermore, multivariate and machine learning models can typically be categorized as either supervised or unsupervised techniques. Supervised techniques are those that make use of a priori group assignments (i.e., ASD or TD status) to identify patterns for classifying individuals; examples of commonly used supervised techniques include support vector machines (SVMs),59 logistic regression,60 discriminant analysis,61 and classification and regression trees (CART).62 On the other hand, unsupervised techniques use no a priori group information and rely solely on commonalities and differences in the data to assign individuals to groups. Principal component analysis,63 k-means clustering,64 and self-organizing maps65 are some examples of unsupervised learning methods.
3.3. Reporting of Biomarker Efficacy
In a majority of cases, multivariate models either produce a binary decision for an individual’s predicted class membership or output a continuous score or probability of class membership that can be used to decide on a threshold for classification. When an individual is evaluated by a binary classifier, four outcomes are thus possible. If the individual has ASD and is correctly identified as having ASD, the diagnosis is a true positive; however, if the same individual is incorrectly identified as being TD, the diagnosis is a false negative. Similarly, a diagnosis of a TD individual is either a true negative if they are diagnosed as TD, or a false positive if they are diagnosed with ASD. Since adjusting the classification threshold requires balancing a trade-off between true and false diagnoses, selection of the threshold is usually dependent on the distribution of classifier scores in addition to desired clinical goals.
A number of metrics exist for reporting performance of a binary classifier. Perhaps the most basic is the percentage accuracy, which is simply the number of true positives plus true negatives divided by the total number of individuals. Sensitivity can be calculated as the number of true positives divided by the total number of individuals with ASD, while specificity is the number of true negatives divided by the total number of TD individuals. Positive predictive value (PPV) and negative predictive value (NPV) are calculated as the number of true positives divided by the total number of positive diagnoses and the number of true negatives divided by the total number of negative diagnoses, respectively. A receiver operating characteristic (ROC) curve can also be constructed to graphically represent the diagnostic performance of a classifier; this curve plots the sensitivity against one minus the specificity for a number of different classification thresholds, where both axes vary from 0 to 1. The area under the ROC curve (AUROC) is a commonly reported metric to summarize the diagnostic value of a medical classifier66 and its possible values typically range from 0.5 to 1, where a value of 0.5 indicates an uninformative classifier and a value of 1 is associated with a perfect classifier. Visual examples of these metrics are provided in Figure 2.
Fig 2.
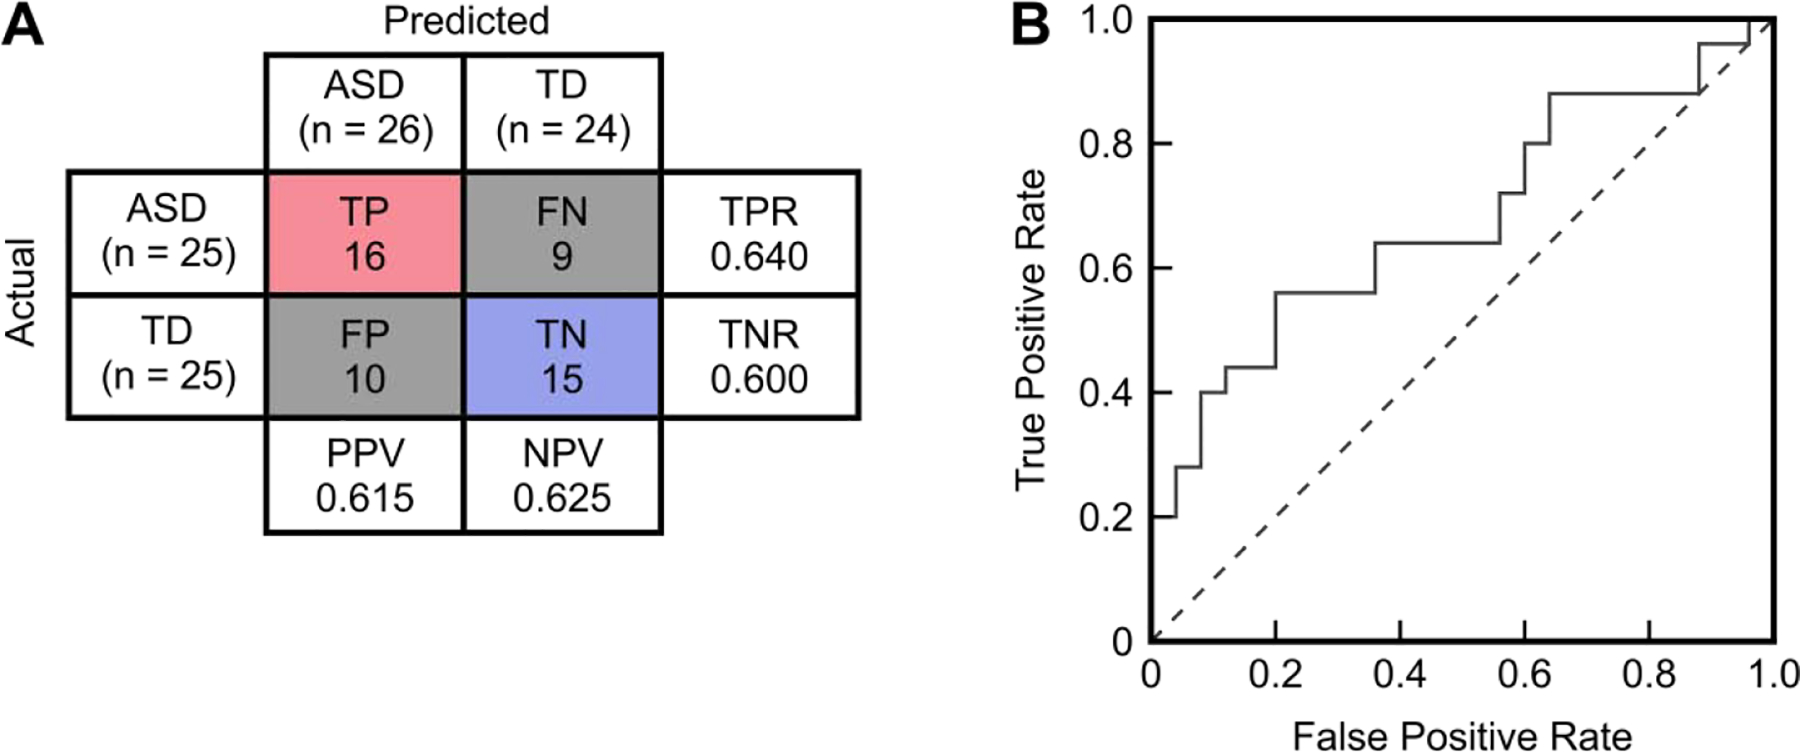
Accuracy metrics for the example data provided in Figure 1. (A) Confusion matrix yielded by classifying any sample/individual with a value less than 1.6 as having autism spectrum disorder (ASD). The number of true positives (TP), true negatives (TN), false positives (FP), and false negatives (FN) are used to calculate the sensitivity/true positive rate (TPR=TP/[TP+FN]), specificity/true negative rate (TNR=TN/[TN+FP]), positive predictive value (PPV=TP/[TP+FP]), and negative predictive value (NPV=TN/[TN+FN]). The overall classification accuracy is (TP+TN)/(TP+TN+FP+FN) = 62%. (B) Receiver operating characteristic (ROC) curve (solid line) plotting the false positive rate (1 – specificity) against the true positive rate (sensitivity) as the threshold for classification is varied. The area under this ROC curve (AUROC) is 0.68. An AUROC of 0.5 indicates a completely uninformative classifier and would be associated with a curve like the dashed line pictured.
Clinical studies often involve a large number of measurements being recorded for relatively few participants. With these types of data, it is easy to develop a model that uses many variables to perfectly classify a small number of individuals. However, such a small sample-to-variable ratio increases the likelihood of overfitting the model to the data set such that its generalizability to new data is minimal. Overfitting is a possibility at any sample size but is a greater concern when the number of samples is small. It is thus essential when reporting results to provide some form of validation of classifier performance on a data set that was not used to develop the model. This can be done by implementing a cross-validation procedure in which a subset of samples are held out from training and reserved for model validation67 or, in the ideal case, by evaluating the classifier on an entirely new set of validation data that was not involved in model development. Prediction accuracy on the validation set can be expected to be lower than that in the training set but should still be sufficiently high to suggest meaningful patterns for further investigation in larger clinical data sets.
4. Multivariate Approaches for Behavioral Biomarkers
Diagnostic instruments such as the ADI-R and ADOS have shown consistent reliability in terms of their sensitivity and specificity for identifying individuals with ASD. However, being that these types of tools contain a number of questions covering various domains of behavior, it is possible that a number of these evaluated behaviors provide information unnecessary for ASD diagnosis or even information that could lead to an inaccurate diagnosis in some cases.68 There are also complex patterns in behavior that cannot be measured by behavioral interviews or observation alone that may contribute to a more accurate ASD diagnosis. With these considerations in mind, a number of recent studies in the literature have aimed to use multivariate models to reduce the number of behavioral screening items needed for ASD diagnosis and/or obtain more advanced measures of behavior that can be used to bolster the diagnostic ability of current instruments.69
4.1. Prediction of Future ASD Diagnosis from Early Behavioral Evaluations
One of the primary concerns associated with early ASD diagnoses is their long-term stability at older ages,70 as a false positive diagnosis is almost as undesirable as a delayed diagnosis. In light of this, it would be of great interest to determine subsets of items from established diagnostic instruments that could be used to simplify the process of early ASD diagnosis. The potential benefits of such an approach are highlighted in a study of high-risk children from the Baby Siblings Research Consortium that reported children with early false positive diagnoses to have behavioral test scores that were overall similar to the scores of children with early false negative diagnoses, but that might have differed in individual symptoms that would have been able to differentiate these two groups.26 Screening for ASD using only the most important behavioral items may thus provide a more precise indicator of future ASD diagnosis in addition to reducing time and costs associated with screening.
The search for early behavioral markers of ASD has prompted several studies, summarized in Table 1, to use multivariate techniques to identify subsets of behavioral symptoms that are most predictive of a later ASD diagnosis. In most cases, these studies feature high-risk children who have an older sibling with ASD, where the risk of ASD diagnosis in these high-risk children is an estimated 18.7%71 and is substantially greater than the overall population risk of 1.7%.2 The use of infants in some studies also introduces uncertainty as it can be difficult at this age to differentiate behaviors associated with normal development from those associated with ASD (this distinction may not become possible until nine months30 to twelve months72 of age). Relying on behavioral markers alone to predict a future ASD diagnosis thus requires that the child be old enough for parents and/or clinicians to make this distinction accurately, making usage of such markers somewhat counterproductive when the objective is to identify ASD as early as possible.
Table 1.
Summary of recent and representative studies predicting future ASD diagnosis through multivariate analysis of early behavioral evaluations. Reported sample sizes are the numbers used for classification and do not necessarily reflect the study’s total sample size.
| Reference | Study Participants | Experimental Methods | Key Features | Multivariate Technique | Key Results |
|---|---|---|---|---|---|
| Macari et al. (2012)173 | 13 infants that were later diagnosed with ASD and 71 that were not | Evaluated behaviors at 12 months that would be predictive of ASD diagnosis at 24 months | Seven individual items from the ADOS-Toddler | Classification tree | Classified ASD versus non-ASD with 85% sensitivity and 96% specificity |
| Chawarska et al. (2014)174 | 157 high-risk infants that were later diagnosed with ASD and 562 that were not | Assessed behaviors at 18 months that would be predictive of ASD diagnosis at 36 months | Six individual items from the ADOS | CART | Classified ASD versus non-ASD with 83% training accuracy and predicted with 77% validation accuracy |
| Barbaro and Dissanayake (2017)24 | 77 children at risk for ASD identified from a community-based sample | At 24 months, assessed ASD status and behavior that would predict retention or loss of ASD diagnosis at 48 months | Four items total from the ADOS and Mullen Scales of Early Learning | Logistic regression | Classified the stable group 96% correctly and the crossover group 44% correctly |
| Bussu et al. (2018)175 | 32 high-risk infants that were later diagnosed with ASD and 129 that were not | Examined behavior and developmental measures at 8 and 14 months to predict ASD status at 36 months | Motor scores at 8 months and daily living score at 14 months | Least-squares SVM | Best AUROCs for classifying ASD versus non-ASD at 36 months were 0.65 and 0.71 using the 8-month and 14-month measures, respectively |
4.2. Reducing the Number of Behavioral Measurements Needed for ASD Diagnosis
Identification of a subset of the most important items from instruments such as the ADOS or ADI-R has the potential to streamline the ASD diagnosis process and may also increase diagnostic accuracy. Such an approach also holds promise for the development of mobile ASD screening tools that can assist with diagnosing ASD on a large scale.73–76 Table 2 lists recent studies that have determined the most important items from behavioral evaluations and used these items to identify individuals with ASD. The availability of data repositories containing behavioral score sheets has allowed for many of these studies to analyze larger samples of participants compared to the aforementioned studies aiming to predict future ASD diagnoses. In addition to the analyses involving greater numbers of samples, the classification results are generally more accurate, which is not unexpected given that the most important behaviors chosen for classification are likely those that originally contributed to the ASD diagnosis being made. The greater accuracy can also likely be explained by the reduced complexity of diagnosis, relatively speaking, compared to predicting a future diagnosis from current behavioral symptoms. It would be of interest to evaluate how well the behaviors identified by these ASD diagnosis studies could be used to predict future diagnoses.
Table 2.
Summary of recent and representative studies aiming to reduce the number of behavioral measures needed for ASD diagnosis through multivariate analysis. Reported sample sizes are the numbers used for classification and do not necessarily reflect the study’s total sample size.
| Reference | Study Participants | Experimental Methods | Key Features | Multivariate Technique | Key Results |
|---|---|---|---|---|---|
| Wall et al. (2012)176 | 891 ASD and 75 non-spectrum children for training; 1976 ASD and 1000 simulated controls for validation | Used ADI-R data from three ASD data repositories | 7 of 93 items from the ADI-R | Alternating decision tree, chosen from 15 algorithms | 99.9% training accuracy, with both 99.9% sensitivity and specificity when predicting the validation set |
| Wall et al. (2012)177 | 612 ASD and 15 non-spectrum children for training; 446 ASD and 1000 simulated controls for validation | Used ADOS data from three ASD data repositories; pilot study for Duda et al. (2014)178 | 8 of 29 items from ADOS Module 1 | Alternating decision tree, chosen from 16 algorithms | 100% training accuracy, with 99.7% sensitivity and 94% specificity when predicting the validation set |
| Duda et al. (2014)178 | 2333 ASD and 283 non-spectrum children | Used ADOS data from five ASD data repositories | ADOS Module 1 feature set from Wall et al. (2012)177 | Alternating decision tree | Validated with 98% sensitivity and 77% specificity against the original ADOS |
| Wilson et al. (2014)179 | 58 male adults with ASD and 66 TD controls | Administered three ASD evaluations and nine neuropsychological tests/tasks | Ten variables from performed tasks, plus verbal IQ and performance IQ | SVM | Achieved 81% accuracy, 78% sensitivity, and 85% specificity with leave-two-out cross-validation |
| Kosmicki et al. (2015)180 | 362 (510) ASD and 282 (93) non-spectrum individuals for training; 1089 (1924) ASD and 66 (214) non-spectrum for validation† | Used data from five ASD data repositories; evaluated score sheets separately for ADOS Module 2 and Module 3 | 9 of 28 behaviors from Module 2 and 12 of 28 behaviors from Module 3 | Logistic regression (Module 2); radial kernel SVM (Module 3) | 99% sensitivity and 89% specificity for Module 2 validation; 98% sensitivity and 97% specificity for Module 3 validation |
| Bone et al. (2016)181 | 1264 verbal individuals with ASD and 462 verbal individuals without ASD | ADI-R and Social Responsiveness Scale items taken from a data repository | Five behavioral codes total from the two assessments | SVM | Classified individuals below (above) age 10 with 89% (87%) sensitivity and 59% (53%) specificity |
| Cohen et al. (2016)182 | 535 children with ASD and 125 children without ASD | PDD Behavior Inventory forms collected from five sites | Six domain scores of PDD Behavior Inventory, parent-reported | CART | 82%/83%/86% sensitivity and 88%/87%/93% specificity for training/testing/validation |
| Levy et al. (2017)183 | 1319 (2870) ASD and 70 (273) non-ASD children† | ADOS Module 2 and Module 3 score sheets from four ASD data repositories | Nine items from Module 2 and nine from Module 3 | Logistic regression; SVM | Classified with 89%/95% sensitivity and 90%/87% specificity for Module 2/3 |
| Feczko et al. (2018)184 | 47 children with ASD and 58 TD children | Had children perform seven tasks related to information processing | 34 behavioral variables related to performed tasks | Random forest | Achieved 73% classification accuracy, 63% sensitivity, and 81% specificity |
Numbers outside (inside) parentheses indicate sample sizes for analyzing ADOS Module 2 (Module 3).
The push to reduce the number of variables required for ASD diagnosis has encouraged the development of novel computational techniques for identifying the most important variables. One computational intelligence method, known as Variable Analysis, analyzes measurements from ASD screening tools and considers correlations between variables and classes (ASD or TD) while minimizing correlations between variables. This technique has been shown to maintain good accuracy in children, adolescents, and adults assessed with the Autism Spectrum Quotient.77 Multilayer fuzzy cognitive maps are another approach that offer promise for improving ASD diagnoses based on subsets of ADOS and ADI-R measures. This type of model has shown results comparable in accuracy to other machine learning algorithms.78 Speech and psychoeducational therapy outcomes in preschoolers with ASD have also been successfully predicted by using artificial neural networks to determine the behavioral variables most important for assessing treatment response.79
4.3. Motor Skills, Eye Gaze and Vocal Patterns as Diagnostic Markers
Delays in early motor skills may become apparent in children with ASD before the stereotypical deficits in behavior and socialization become recognizable,80–83 introducing motor skill development as a potential early indicator of the disorder.84 Similarly, quantifiable eye gaze and attention patterns in young children may serve as objective indicators of ASD85 before the presentation of behavioral symptoms, as early as two to six months of age.86,87 Studies recently investigating these behavioral domains for ASD diagnosis are summarized in Table 3 and show a wide range of outcomes, both in terms of the numbers/types of key features used and the classification accuracies achieved. Other studies have performed classification with eye tracking and attention metrics using only univariate methods.88,89 Additionally, changes in eye gaze have been found to be accurate indicators of improvement in social attention resulting from behavioral intervention90 and may be useful for clinical trials,91 thus reinforcing the potential of these patterns as early biomarkers of ASD.
Table 3.
Summary of recent and representative studies aiming to distinguish individuals with ASD from TD individuals using multivariate analysis of motor skill development and eye gaze/tracking patterns. Reported sample sizes are the numbers used for classification and do not necessarily reflect the study’s total sample size.
| Reference | Study Participants | Experimental Methods | Key Features | Multivariate Technique | Key Results |
|---|---|---|---|---|---|
| Motor Patterns | |||||
| Crippa et al. (2015)185 | 15 children with ASD and 15 TD children | Recorded kinematics data while children performed a reach-to-drop task | Seven kinematic features | SVM | Mean sensitivity/specificity of 82%/89% with leave-one-out cross-validation |
| Dehkordi et al. (2015)96 | 35 children with ASD and 16 TD children | Evaluated children’s social and behavioral interactions with a robotic parrot | Six behavioral features | Random forest | Classified with a maximum of 90% accuracy using seven-fold cross-validation |
| Anzulewicz et al. (2016)98 | 35 children with ASD and 45 TD children | Recorded kinematic and gesture data from children playing with tablet computers | 262 motor features derived from the tablet sensor data | Regularized greedy forest, among other techniques | Achieved a maximum average AUROC of 0.93 with ten repetitions of ten-fold cross-validation |
| Li et al. (2017)186 | 14 adults with ASD and 16 TD controls | Derived kinematic parameters from a hand movement imitation task | Nine kinematic parameters (from two imitation conditions) | SVM, among others | Achieved 87% accuracy, 86% sensitivity, and 88% specificity using a two-step cross-validation method |
| Moradi et al. (2017)97 | 25 children with ASD and 25 TD children | Evaluated movement characteristics of children playing with a smart toy car | Five movement characteristics | Polynomial kernel SVM | Averaged 93% sensitivity and 76% specificity with five-fold cross-validation |
| Eye Gaze/Tracking | |||||
| Stahl et al. (2012)187 | 19 high-risk infants with a sibling with ASD, 17 control infants with no ASD in family | Recorded EEG and measured event-related potentials associated with eye gaze processing | 36 event-related potential (18 direct gaze, 18 averted gaze) metrics | SVM | Classified high-risk versus control with 64% sensitivity and 64% specificity |
| Fujioka et al. (2016)188 | 21 adolescents and adults with ASD and 35 TD controls | Measured percentage of eye fixation time on objects displayed on a screen | Discrimination parameters from three visual areas of interest | Discriminant analysis | Classified with 81% sensitivity and 80% specificity |
| Liu et al. (2016)189 | 29 children with ASD and 58 TD children | Analyzed children’s eye movements during a facial recognition task | Histograms of visual attention to partitioned facial regions | Radial basis function kernel SVM | With leave-one-out cross-validation, achieved 89% accuracy, 93% sensitivity, and 86% specificity |
| Frazier et al. (2018)190 | 91 youth diagnosed with ASD and 110 non-ASD youth | Recorded eye tracking patterns of participants while viewing a video containing 44 visual stimuli | Gaze metrics correlating significantly with ASD diagnosis | Multiple linear regression with ROC analysis | Achieved AUROC of 0.92 and 0.86 in the training set (75% of samples) and validation set (25%) |
| Wan et al. (2018)191 | 37 children with ASD and 37 TD children | Measured children’s fixation time on ten areas of interest while watching a short video of a young female speaking | Fixation time on the body and mouth | SVM | Classified with 85% accuracy, 87% sensitivity, and 84% specificity |
Given that the diagnostic criteria for ASD include socialization and communication deficits, it stands to reason that abnormal vocalization patterns may also serve as early biomarkers for the disorder.92 To this end, a number of studies have aimed to use quantified vocalization patterns to differentiate individuals with ASD from TD individuals. According to a recent review and meta-analysis,93 however, the methods and features used for multivariate analysis vary greatly between such studies, limiting overall interpretation of the predictive value of these patterns.
4.4. Behavioral Patterns from Toy Interactions
Technology, in a broad sense, plays a central role in many modalities of potential ASD diagnosis beyond those evaluating motor, eye gaze, and vocal patterns. Using technology to quantify features that can assist with diagnosis allows for controlled and consistent interactions among multiple patients in different environments; this offers value for conditions like ASD where guided interactions may be difficult.94,95 Sensors embedded into toys, in particular, can provide quantifiable measures of behavior, such as gesture forces and kinematic pattern data, that are not offered by parental or clinical evaluation and that are easily related to traditional ASD diagnostic criteria. For example, multivariate analysis of social and behavioral features taken from the interactions between children and a robotic parrot has distinguished ASD from TD with exceptional accuracy.96 Evaluating children’s patterns of playing with a toy car97 and smart tablets98 have also shown promise for ASD screening. This approach to screening would be feasible for a wide number of smart toys and opens the door for creative ways to characterize behaviors associated with ASD.
5. Medical Imaging for ASD Diagnosis
Neuroimaging may hold many avenues for ASD biomarker discovery.99,100 Compared to their TD peers, children with ASD have been found to have different features of neuroanatomy such as brain morphometry, neurochemical components, and structural and functional connectivity, many of which correspond to brain regions associated with socio-emotional, communication, and restricted repetitive behaviors related to an ASD diagnosis.99 Socio-emotional areas, also known as the “social brain,” exhibit abnormalities in individuals with ASD and include areas for analysis of facial expression and eye gaze, emotional processing, theory of mind, and imitation and understanding.101 Restricted repetitive behaviors are associated with abnormalities within the default mode network.102 The advancement of pattern recognition, machine learning, and neuroimaging techniques has facilitated the development of novel image-based tools for identifying ASD.103
Although the advancement of neuroimaging has elucidated many mysteries of ASD pathophysiology, research is still far from obtaining a coherent and complete picture of associated brain anomalies.101 Every neuroimaging technique uses different methodologies and relies on unique signal sources, frequency bands, spatial resolutions, neural parameters, and analysis techniques accompanied by respective limitation and noise artifacts.101,104 Few studies have investigated the use of multimodal neuroimaging strategies, for which improved methods of integration are needed.104 Even within the same imaging technique, inconsistent findings occur from distinct methodological variables such as field of view and type of data set.105 Development of uniform protocols have emerged to ameliorate these disparities, which only leads to the constant push for improvement of accepted practices and ever changing “best technique.”101 There is also a question as to the cause of brain anomalies and whether they can be attributed to comorbid conditions (such as epilepsy) rather than ASD.106 While certain imaging and functional techniques such as magnetic resonance imaging (MRI), electroencephalography (EEG), and magnetoencephalography (MEG) are universally available, some may be restricted to scientific investigations107 and inappropriate for clinical use.
5.1. Structural MRI
Structural MRI analysis examines brain connectivity, or the existence of abnormal anatomical connections such as axonal or synaptic arrangement. It also provides a non-invasive measurement of white matter tracts, white and grey matter regions, regional thickness, and brain volume. A review on structural MRI noted a common finding of increased growth in total cortical volume, as well as subcortical brain regions and cerebellum in children with ASD.99 Interestingly, large brain volumes are not noted in adults with ASD compared to their TD peers; instead, brain volume growth is suggested to slow from child to adulthood.108
Studies using structural features for ASD classification are outlined in Table 4. A significant concern with many of these studies is the large number of features required (relative to the number of samples) to achieve higher accuracies. As a general rule, the number of samples should be several factors greater (typically by a factor of five or ten) than the number of features used; however, this ratio is far less in many of the listed studies, and in some cases the number of features comes close to exceeding the number of samples. This raises the possibility of overfitting to the available data, which is a concern not necessarily alleviated by cross-validation or validation on a small independent set, and brings into question the reproducibility of some results. Further evaluation of these feature sets on much larger cohorts of participants would help to alleviate concerns of overfitting.
Table 4.
Summary of recent and representative studies aiming to distinguish individuals with ASD from TD individuals using multivariate analysis of structural MRI. Reported sample sizes are the numbers used for classification and do not necessarily reflect the study’s total sample size.
| Reference | Study Participants | Experimental Methods | Key Features | Multivariate Technique | Key Results |
|---|---|---|---|---|---|
| Ecker et al. (2010)192 | 22 adults with ASD and 22 TD adults | Used structural MRI to obtain images of grey and white matter regions | Voxels from grey matter images | SVM | Classified with 77% sensitivity and 86% specificity using leave-two-out cross-validation |
| Jiao et al. (2010)111 | 22 children with ASD and 16 TD children | Measured regional thickness and volumetric morphometry of 66 brain structures via MRI | 7 thickness-based features and, separately, 16 volume-based features | Logistic model tree, among others | Attained 95%/77% sensitivity and 75%/69% specificity for best thickness-/volume-based classification with ten-fold cross-validation |
| Ingalhalikar et al. (2011)193 | 45 children and adolescents with ASD and 30 TD controls | Computed region-based fractional anisotropy and mean diffusivity maps for diffusion tensor imaging data | 18 out of 352 fractional anisotropy/mean diffusivity features | Radial basis function kernel SVM | Achieved 80% accuracy, 74% sensitivity, and 84% specificity with leave-one-out cross-validation |
| Ingalhalikar et al. (2014)109 | 75 children with ASD and 37 TD children | Evaluated two functional tasks using MEG and 74 structural white matter features using diffusion tensor imaging | Two MEG features and 12 diffusion tensor imaging features | Ensemble of classifiers fused with weighted aggregation | Averaged 73% sensitivity and 86% specificity with five-fold cross-validation; 87% accuracy on testing set |
| Wee et al. (2014)194 | 58 children and adolescents with ASD and 59 TD controls | Used structural MRI to evaluate cortical-related morphology (regional and interregional features) | Combination of regional and interregional features | Multi-kernel SVM | Achieved an average of 96% sensitivity and 97% specificity with two-fold cross-validation |
| Gori et al. (2015)195 | 21 children with ASD and 20 TD children | Calculated brain features and global volumes of brain compartments from structural MRI data | 314 region of interest features from the grey matter sub-region | SVM | Averaged 0.74 AUROC with leave-pair-out cross-validation |
| Jin et al. (2015)196 | 40 infants at high risk for ASD and 40 low-risk infants | Derived connectivity features from multiscale connectivity networks measured through MRI; compared high- and low-risk participants | Multiscale regions of interest and diffusion statistics | Multi-kernel SVM | Used nested five-fold cross-validation to obtain averages of 76% accuracy and 0.80 AUROC |
| Libero et al. (2015)110 | 19 adults with ASD and 18 TD adults | Analyzed brain morphometry from structural MRI, diffusion tensor imaging, and proton magnetic resonance spectroscopy data | Fractional anisotropy, radial diffusivity, and cortical thickness | Decision tree | Classified participants with 92% accuracy after leave-one-out cross validation |
| Hazlett et al. (2017)197 | 34 (145) infants at high risk for ASD with (without) a later diagnosis of ASD | Evaluated brain volume and surface area metrics from MRI at 6 and 12 months to predict ASD at 24 months | Regional surface area, intracranial volume, cortical thickness, and sex | Three-stage deep neural network | With ten-fold cross-validation, predicted ASD with 88% sensitivity and 95% specificity |
| Shen et al. (2017)198 | 47 (174) infants at high risk for ASD with (without) a later diagnosis of ASD | Quantified cerebrospinal fluid and lateral ventricle volume from MRI data collected at 6, 12, and 24 months to predict ASD diagnosis at 24 months | Extra-axial cerebrospinal fluid volume | Balance-boosted trees ensemble algorithm | Predicted ASD with 66% sensitivity and 68% specificity after 25-fold cross-validation; similar results on a validation set |
Two studies listed utilize multimodal imaging, including both structural and functional MRI; for further discussion on functional MRI classifications we direct the reader to these studies.109,110 Within their methodologies, Libero et al. also used 1H-magnetic resonance spectroscopy, a non-invasive imaging technique that estimates specific brain metabolites through their chemical composition.110 Another study tested multiple machine learning techniques, examining regional thickness-based and volume-based classification through SVM, multilayer perceptron, functional trees, and logistic model trees.111 Both thickness- and volume-based classifications yielded their best results through the use of logistic model trees with overall better separation from using thickness-based classification.
For further review on using neuroimaging to predict brain disorders, we direct the reader to a recent summary of MRI-based ASD classification studies that discusses how many studies suffer from overfitting, small sample size, non-optimized classifier parameters, and other limiting factors.112
5.2. Functional MRI
MRI images that provide information on the functional connectivity of the brain (functional MRI, or fMRI) focus on patterns of activity via connective pathways. fMRI experiments commonly use structured cognitive tasks, such as social stimuli (faces and bodies).113 However, these studies show varying results in part due to the many challenges they face, including limited current diagnostic standards, small sample size, and validation results.114 Diffusion tensor imaging studies local connectivity and white matter tracts, providing details on functional features through common methodologies of tractography and voxel-wise analysis. The two most common features measured are directionality (quantified by functional anisotropy) and diffusion (quantified by mean diffusivity). Studies commonly show decreased functional anisotropy99,115 and increased mean diffusivity99 in the brains of individuals with ASD compared to their TD peers. Tract-based spatial statistics is an emerging diffusion tensor imaging methodology that overcomes voxel-wise dependency on smoothing kernels.99
MRI studies focus heavily on individuals without intellectual disability, also referred to as high-functioning individuals, who can withstand long, motionless procedures as well as receive and follow instructions.116 Resting state functional connectivity MRI (rs-fMRI) studies require no conscious thought-process and allow children to be scanned while asleep. rs-fMRI measures correlated and anti-correlated signals and, in children with ASD, commonly finds altered functional connectivity in the default mode network, hyper-connectivity in subcortical regions, and under-connectivity between cortical regions.99 In addition to recruiting children with ASD able to undergo an MRI scan, sample sizes for these studies are negatively affected by the cost of the technique.
A list of fMRI (including rs-fMRI) studies employing multivariate analysis to classify ASD can be found in Table 5. The accuracy results achieved in some of these studies are notably high, even after cross-validation, while others only showed modest potential for accurate ASD diagnosis. However, like with the structural MRI studies, there are legitimate concerns of overfitting with several of these fMRI studies due to their low sample-to-feature ratios. In addition to these classification studies, the potential of using fMRI with multivariate analysis for predicting treatment outcomes in individuals with ASD has been investigated.117,118
Table 5.
Summary of recent and representative studies aiming to distinguish individuals with ASD from TD individuals using multivariate analysis of functional MRI data. Reported sample sizes are the numbers used for classification and do not necessarily reflect the study’s total sample size.
| Reference | Study Participants | Experimental Methods | Key Features | Multivariate Technique | Key Results |
|---|---|---|---|---|---|
| Deshpande et al. (2013)199 | 15 adolescents and young adults with ASD and 15 TD controls | Gathered fMRI data to study causal connectivity among different brain regions relating to Theory of Mind | 19 features related to effective connectivity paths | SVM | Classified participants with maximum 96% accuracy, 97% sensitivity, and 95% specificity |
| Uddin et al. (2013)200 | 20 children with ASD and 20 TD children | Collected rs-fMRI and structural MRI data, then identified ten connectivity components associated with functional brain networks | Salience network connectivity features | Logistic regression | Achieved 75% sensitivity and 80% specificity with leave-one-out cross-validation; also validated on an independent cohort |
| Plitt et al. (2015)201 | 59 young adults with ASD and 59 TD controls; replication set with 89 ASD and 89 TD controls | Collected rs-fMRI data and defined three sets of regions of interest to create three unique correlation matrices for participants’ time series | Destrieux atlas set describing 162 regions | Radial basis function kernel SVM, among others | Observed a maximum 77% accuracy with leave-one-out cross-validation (among other methods); results did not improve in replication set |
| Chanel et al. (2016)113 | 15 adults with ASD and 14 TD adults | Gathered fMRI data to study attention/emotions of participants during static faces and dynamic bodies tasks | Features from dynamic body experiment | SVM | Classified with maximum 92% sensitivity and 92% specificity with leave-one-out cross-validation |
| Yahata et al. (2016)202 | 74 adults with ASD and 107 TD adults; 44/27 individuals with ASD and 44/27 TD controls in validation sets 1/2 | Evaluated functional connectivity from rs-fMRI; also examined generalizability to other disorders | 16 out of 9730 functional connections | Logistic regression | Achieved 85% accuracy with leave-one-out cross-validation; validated with 75% and 70% accuracies in independent cohorts |
| Emerson et al. (2017)203 | 11 (48) infants at high risk for ASD with (without) a later diagnosis of ASD | Computed features of functional connectivity from rs-fMRI at 6 months to predict ASD diagnosis at 24 months | 59 sets of features (one for each fold of leave-one-out cross-validation) | SVM | Predicted future diagnosis with 82% sensitivity and 100% specificity using leave-one-out cross-validation |
5.3. ABIDE Studies
The major limitation of small sample size in neuroimaging studies has been combatted by recent research collaboratives. The Autism Brain Imaging Data Exchange (ABIDE),119 ARIANNA,120 and National Database for Autism Research121 are research data repositories dedicated to collecting and sharing data to promote ASD research. Our review of these repositories will be limited to ABIDE, which collects rs-fMRI images from multiple research sites. However, these data sets are subject to between-site differences in experimental procedures,122 and even with increasing training set sizes, many studies report accuracies of approximately 60–70%.123–128 Various techniques, including deep learning, have been investigated to improve classification accuracy using the ABIDE data sets and are listed in Table 6. Despite the greater numbers of samples used in these studies, several rely on extremely large numbers of features that bring into question the reproducibility of their findings; reducing the sizes of these feature sets is thus essential to assess clinical applicability of these approaches.
Table 6.
Summary of recent and representative studies aiming to distinguish individuals with ASD from TD individuals using multivariate analysis of ABIDE imaging data. Reported sample sizes are the numbers used for classification and do not necessarily reflect the study’s total sample size.
| Reference | Study Participants | Experimental Methods | Key Features | Multivariate Technique | Key Results |
|---|---|---|---|---|---|
| Zhou et al. (2014)204 | 127 children with ASD and 153 TD children | Obtained rs-fMRI data from ABIDE repository and used a multi-parametric analytic approach, including network analysis to study connectivity | 4 of 22 quantitative imaging features | Random decision tree | Classified with 98% accuracy for the full data set and 68% accuracy when using ten-fold cross validation |
| lidaka (2015)205 | 312 children and adolescents with ASD and 328 TD controls | Examined rs-fMRI data taken from ABIDE to analyze functional connectivity through correlation matrices | 632 cells from the correlation matrix | Probabilistic neural network | Achieved 89% accuracy, 92% sensitivity, and 87% specificity using leave-one-out cross-validation |
| Kam et al. (2017)206 | 61 individuals with ASD and 72 TD individuals, all under 20 years old | Acquired rs-fMRI data from ABIDE data site to distinguish functional networks through hierarchical clustering | Connectivity features from five clusters | Discriminative restricted Boltzmann machine | Using ten-fold cross-validation, classified with 75% sensitivity and 85% specificity |
| Sadeghi et al. (2017)207 | 29 adolescents and adults with ASD and 31 TD controls | Analyzed properties of functional networks constructed from MRI images in the ABIDE data set | 17 features from nodal metrics | SVM | Averaged 92% classification accuracy with five-fold cross-validation; 68% accuracy in independent set |
| Syed et al. (2017)208 | 392 individuals with ASD and 407 age- and sex-matched TD controls | Identified reproducible independent components of functional networks from ABIDE rs-fMRI data | Regions from the default mode network | k-means clustering | Clustering yielded 89% sensitivity and 90% specificity |
| Bi et al. (2018)209 | 45 individuals with ASD and 39 TD individuals | Evaluated connectivity from ABIDE rs-fMRI data through application of graph theory | 272 graph metrics | Random SVM cluster | Obtained accuracies as high as 96% on the testing subset (26 samples, or 30% of total) |
| Heinsfeld et al. (2018)210 | 505 individuals with ASD and 530 TD individuals | Constructed connectivity matrices using correlations for regions’ time series averages using ABIDE rs-fMRI data | 19900 functional connectivity features | Deep neural network | Achieved 70% accuracy, 74% sensitivity and 63% specificity with ten-fold cross-validation |
| Kong et al. (2019)211 | 78 individuals with ASD and 104 TD individuals | Analyzed brain connectivity through networks based on cortical regions constructed from ABIDE MRI data | 3000 of the top cortical grey matter volume features | Deep neural network | Classified with up to 90% accuracy, 84% sensitivity, and 96% specificity using ten-fold cross-validation |
5.4. Brain Activity Measures
Functional and effective connectivity can also be measured through EEG and MEG. Measurements from EEG have shown differentiating activity for children with ASD, specifically beta and theta waves.129 MEG has been used to determine local and long-range functional connectivity, analyzed using a multiple regression model, and was found to correlate with age in pre-adolescent children with ASD.130 A list of recent ASD classification studies using EEG and MEG can be found in Table 7; the classification accuracies after cross-validation in several of these studies are notable considering the small numbers of features used. Functional near-infrared spectroscopy has also been used to observe differentiating visual and auditory brain responses in children later diagnosed with ASD.131
Table 7.
Summary of recent and representative studies aiming to distinguish individuals with ASD from TD individuals using multivariate analysis of EEG and MEG data. Reported sample sizes are the numbers used for classification and do not necessarily reflect the study’s total sample size.
| Reference | Study Participants | Experimental Methods | Key Features | Multivariate Technique | Key Results |
|---|---|---|---|---|---|
| Bosl et al. (2011)212 | 46 infants at high risk for ASD, and 33 low-risk controls | Collected EEG data and computed modified multiscale entropy as an indicator of normal brain development | Low, high, and mean multiscale entropy values for each of 64 channels | k-nearest neighbors, SVM, naive Bayes | Classified with accuracies between 72% and 77% in 9-month-olds using ten-fold cross-validation |
| Duffy and Als (2012)213 | 430 children with ASD and 554 TD children | Calculated spectral coherence variables from EEG measurements | 40 spectral coherence factors | Discriminant analysis | Averaged 86% sensitivity and 89% specificity across ten split-half analyses and including all age groups |
| Khan et al. (2013)214 | 17 adolescents and young adults with ASD and 20 TD controls | Measured task-related local and long-range functional connectivity from MEG data | Four functional connectivity metrics | Quadratic discriminant analysis | Classified with 90% accuracy, 87% sensitivity, and 95% specificity |
| Jamal et al. (2014)215 | 12 children with ASD and 12 TD children | Extracted brain connectivity features from EEG measurements | 4 of 36 brain connectivity features | Polynomial kernel SVM | With leave-one-out cross-validation, achieved 95% accuracy, 86% sensitivity, and 100% specificity |
| Khan et al. (2015)216 | 15 children and adolescents with ASD and 20 TD controls | Evaluated functional connectivity using tactile and resting state MEG recordings | Local functional connectivity index, Granger causality | Discriminant analysis | Achieved 87% sensitivity and 90% specificity using ten-fold cross-validation |
| Khan et al. (2016)217 | 15 children and adolescents with ASD and 20 TD controls | Used MEG and structural MRI to investigate abnormal functional connectivity | Three neurophysiological measures | Discriminant analysis | Averaged 90% sensitivity and 95% specificity with ten-fold cross-validation |
| Bosl et al. (2018)171 | 35 infants later diagnosed with ASD and 153 infants with no ASD diagnosis | Collected EEG measurements from 3 to 36 months of age to predict ASD diagnosis by 36 months of age | Subset of nonlinear invariant signal features selected from 1026 total | Radial basis function kernel SVM | Predicted ASD with 82–100% sensitivity and 88–99% specificity, depending on age, using leave-one-out cross-validation |
While EEG and MEG are less expensive techniques compared to MRI, they have their own sets of limitations. Connectivity measures from EEG/MEG are estimated to be proportional to the physiological connectivity, and there are also differences in head and brain size between children with ASD and their TD peers that may bias results (e.g., producing dissimilar distances between sensors and electrical signal propagation); EEG and MEG are also limited to short-range connectivity and are unable to evaluate long-range functional connectivity.132
6. Genetic and Epigenetic Markers of ASD
Evidence points to ASD having a strong genetic component, with one meta-analysis estimating heritability of the disorder to be 52%.8 The increased rate of recurrence in younger siblings of affected children71 further indicates a genetic role in ASD etiology. Evaluation of genetic variants is a common approach to studying the role of specific genes in ASD,133 but this approach only provides a statistical indicator of ASD risk134 and yields no diagnostic information about the disorder. More physiologically dynamic measures of ASD status can be found by analyzing gene expression patterns via transcriptomics,135–137 which measures RNA levels and is more indicative of the functional consequences of genetic variation in ASD. Potential contributions from a wide array of environmental factors in ASD9 are also suggestive of a role for epigenetic regulation whereby the expression of certain genes is influenced by external triggers. It naturally follows that such genetic and epigenetic information may provide value for screening and diagnosis of ASD.
6.1. Gene Expression
Transcriptomics studies involve measuring levels of RNA, typically messenger RNA, to quantify gene expression in body tissues. These measurements are commonly taken from blood, providing a straightforward path for clinical translation to an ASD biomarker. Table 8 summarizes recent studies that use multivariate analyses to distinguish individuals with ASD from TD individuals on the basis of their transcriptomics patterns. Classification accuracies in these studies are generally high and the sources of study data are diverse, with some studies making use of data repositories while others take their own measurements from specific cell types. Like with the neuroimaging studies, however, there are concerns here about small sample-to-variable ratios in several studies.
Table 8.
Summary of recent and representative studies aiming to distinguish individuals with ASD from TD individuals using multivariate analysis of patterns in gene expression and epigenetic activity. Reported sample sizes are the numbers used for classification and do not necessarily reflect the study’s total sample size.
| Reference | Study Participants | Experimental Methods | Key Features | Multivariate Technique | Key Results |
|---|---|---|---|---|---|
| Gene Expression | |||||
| Glatt et al. (2012)218 | 60 infants and toddlers at risk for ASD and 68 TD controls | Evaluated children’s profiles of messenger RNA expression in peripheral blood mononuclear cells | Expression intensities of 48 probes | Radial basis function SVM | Predicted a replication sample (half of samples) with 93% sensitivity, 88% specificity, and 0.91 AUROC |
| Kong et al. (2012)219 | 66 (104) children with ASD and 33 (82) non-ASD controls for training (validation) | Profiling of blood gene expression levels in participants | 55 genes | Partial least squares | Obtained 0.98 AUROC in the training set and 0.70 AUROC (68% accuracy) in the validation set |
| Hu and Lai (2013)220 | 87 individuals with ASD and 29 non-ASD individuals | Gene expression profiling of lymphoblastoid cell lines using DNA microarrays | 74 genes | SVM | Achieved 91% sensitivity and 61% specificity with leave-one-out cross-validation |
| Latkowski and Osowski (2015)221 | 82 children with ASD and 64 TD children | Used gene expression data from a publicly available database | Unspecified number of genes used in ensemble classifier | Gaussian kernel SVM with ensemble of classifiers | Classified with 96% sensitivity and 83% specificity with ten-fold cross-validation |
| Pramparo et al. (2015)222 | 87 (44) toddlers with ASD and 55 (29) non-ASD toddlers for discovery (replication) | Profiling of leukocyte RNA expression in participants | Four co-expression modules containing 762 unique genes | Logistic regression | Achieved 75% accuracy, 77% sensitivity, and 72% specificity in replication set |
| Guan et al. (2016)223 | 104 children with ASD and 82 non-ASD controls | Used data on peripheral blood gene expression from Kong et al. (2012) | Three unique sets of five genes | Distance from multivariate centroid | In the validation set (half of samples), classified with 72%−76% accuracy |
| Nazeen et al. (2016)224 | 671 total samples from human ASD studies | Used high-throughput gene expression data from data repositories for conditions that co-occur with ASD | Genes overlapping the chemokine and Toll-like receptor signaling pathways | SVM, among others | Classified ASD versus non-ASD with average 70% classification accuracy with three-fold cross-validation |
| Oh et al. (2017)225 | 21 young adults with ASD and 21 TD controls | Used a microarray data set publicly available from a database | 19 differentially expressed probes | SVM, k-nearest neighbors, discriminant analysis | Achieved up to 94% accuracy, 100% sensitivity, and 87.5% specificity on the validation set (16 samples) |
| Epigenetic Activity | |||||
| Mundalil Vasu et al. (2014)226 | 55 individuals with ASD and 55 TD controls | Measured microRNA profiles in serum of participants | Five differentially expressed microRNAs | ROC analysis† | Classified with AUROC up to 0.91, with associated 85% sensitivity, 87% specificity |
| Hicks et al. (2016)227 | 24 children with ASD and 21 TD children | Measured salivary microRNA levels | 14 top-ranked microRNAs | Partial least squares | Classified with 100% sensitivity and 96% specificity (AUROC = 0.97). |
| Cirnigliaro et al. (2017)228 | 30 children with ASD and 25 TD children | Profiled serum expression of microRNAs | One microRNA, miR-140–3p | Logistic regression | Averaged 63% sensitivity and 68% specificity with 100-random subsampling cross-validation |
| Hicks et al. (2018)142 | 238 children with ASD and 218 non-ASD children | Measured salivary levels of five subtypes of RNA, including microRNA | 32 RNAs | Radial kernel SVM | Predicted the test set (84 total samples) with 82% sensitivity and 88% specificity (AUROC = 0.88) |
Study performs classification, but only through univariate approaches.
6.2. Epigenetic Activity
Epigenetic mechanisms reflect environmental contributions to a disorder/disease state and may offer further potential for ASD biomarkers.138 One particular focus of research in this area is microRNAs, which interact with messenger RNA to provide post-transcriptional regulation of gene expression.139–141 Although microRNA is not as widely analyzed as gene expression, quantification of microRNA provides a unique aspect to studying how genetic factors can be leveraged for ASD diagnosis. Recent papers looking at the use of microRNA for diagnosis are reviewed in Table 8, with blood and saliva samples having both been used with varying levels of success. Everything else equal, a saliva-based test would be preferred as it would be less invasive than a blood test and would likely be more appealing for younger patients. The investigation by Hicks et al.142 using salivary RNA levels (including, but not limited to, microRNAs) for identification of ASD obtained good accuracy in a validation set with a relatively large number of participants; these results are encouraging for the use of epigenetic markers in diagnostic testing.
7. Metabolic Markers
Abnormalities in metabolism may underlie the etiology of ASD40 and have become a popular focal point of ASD biomarker research. Metabolite studies measured through peripheral tissue are relatively inexpensive, allow large sample sizes and time-dependent sampling, and are well-suited for a clinical setting.143 However, a barrier to effective implementation is the need to control for environmental/external factors such as diet. The following subsections discuss metabolite studies collected from peripheral tissues and their roles in the development of ASD biomarkers.
7.1. Blood Metabolites
Analysis of blood is minimally invasive and can provide information on various types of cellular components. While DNA, RNA, and proteins have unique structural compositions, metabolite structure and physical properties vary and no single technique exists to comprehensively measure them.144 Concentrations of blood metabolites are also closely influenced by diet, medication, metabolite solubility, and possible hemolysis during sample processing, necessitating a level of rigor in controlling for these factors. Some studies have looked at discrimination of ASD and TD individuals from blood metabolites using univariate approaches145–147 with varying degrees of success. Studies using multivariate analysis to further characterize blood-based metabolic patterns for ASD classification are listed in Table 9. There is clearly substantial variation in the types of metabolites measured and the classification accuracies offered by analysis of these metabolites. Plasma markers from two particular metabolic pathways, the folate-dependent one-carbon metabolism and transsulfuration pathways, have shown exceptional promise as potential ASD biomarkers and are discussed in further detail later in this review.
Table 9.
Summary of recent and representative studies aiming to distinguish individuals with ASD from TD individuals using multivariate analysis of potential blood-based metabolite biomarkers. Reported sample sizes are the numbers used for classification and do not necessarily reflect the study’s total sample size.
| Reference | Study Participants | Experimental Methods | Key Features | Multivariate Technique | Key Results |
|---|---|---|---|---|---|
| Momeni et al. (2012)229 | 22 children with ASD and 27 TD children | Analyzed plasma protein/peptide concentrations using mass spectrometry | Three differentially expressed peptides | Discriminant analysis | Classification of samples without hemolysis yielded 95% sensitivity and 85% specificity |
| West et al. (2014)230 | 52 children with ASD and 30 TD children | Measured concentrations of plasma metabolites through various mass spectrometry-based techniques | 80 or 160 metabolites depending on classifier | SVM, partial least squares discriminant analysis | Predicted 21-sample validation set with AUROC of 0.84 (SVM) and 0.81 (partial least squares) |
| Wang et al. (2016)231 | 73 (100) children with ASD and 63 (100) TD children in discovery (validation) sets | Quantified serum metabolites with ultra-performance liquid chromatography and mass spectrometry | Docosahexaenoic acid and sphingosine 1-phosphate | Logistic regression | Achieved 90% sensitivity and 74% specificity for predicting the validation set |
| Howsmon et al. (2017)158 | 83 children with ASD and 76 TD children | Analyzed levels of plasma markers related to DNA methylation and oxidative stress | Seven transmethylation/transsulfuration measurements | Discriminant analysis | Classified with 98% sensitivity and 96% specificity using leave-one-out cross-validation |
| Anwar et al. (2018)232 | 38 children with ASD and 31 TD children | Investigated protein damage through quantification of glycation end-products in plasma and urine analysis | Four plasma protein adduct residues and two amino acids | SVM, among several other techniques | Observed 89% accuracy, 90% sensitivity, and 87% specificity using two-fold cross-validation |
| Barone et al. (2018)233 | 83 children with ASD and 79 TD children | Quantified acyl-carnitine and amino acid levels from dried blood spot specimens collected at time of the study | Eight acyl-carnitines | Naive Bayes | Predicted a 38-sample holdout set with 73% sensitivity and 63% specificity |
| Chen et al. (2018)234 | 32 children with ASD and 20 TD children | Profiled the serum proteome using fractionation and mass spectrometry techniques | Eight differentially expressed protein peaks | k-nearest neighbors | Achieved 99% sensitivity and 87% specificity using cross-validation |
| Shen et al. (2018)235 | 30 children with ASD and 30 TD children | Used isobaric tags for relative and absolute quantitation to measure medium- and low-abundance plasma proteins | Five plasma proteins | Combined ROC analysis | Classified with 0.98 AUROC, better than the AUROCs of the individual proteins |
| Howsmon et al. (2018)163 | 154 children and adolescents with ASD, compiled from three clinical trials | Validated classification with DNA methylation/oxidative stress markers presented by Howsmon et al. (2017)158 | Five transmethylation/transsulfuration measurements | Discriminant analysis, among other techniques | Predicted an independent validation set of individuals with ASD with up to 88% sensitivity |
| Smith et al. (2019)236 | 253 (263) infants with ASD and 85 (79) TD infants in training (testing) set | Examined amino acid dysregulation metabotypes (AADMs) in blood plasma | Six AADMs | Ratios of AADMs to different amino acids | In the test set, sensitivities ranged from 8–14% and specificities ranged from 92100% |
| Zou et al. (2019)165 | 89 children with ASD and 89 TD children | Measured serum concentrations of folate-related metabolites | Six folate-related markers | Discriminant analysis | Correctly classified 84% of participants using leave-one-out cross-validation (87% sensitivity, 85% specificity) |
In a retrospective immunoassay study, logistic regression was able to differentiate children diagnosed with ASD using 15 serum biomarkers measured from newborn blood spot specimens.148 Although newborn blood spot analysis represents an opportunity at birth for predicting a future ASD diagnosis, it also faces many sources of uncertainty spanning from the pre-analytical stage of blood collection to the actual analysis of the blood. Among these are the quality of the dried blood spots, choice of collection card, variation in sample quality due to biological factors (such as viscosity and hematocrit level), and contamination.149 Additionally, metabolic profiles at birth may not necessarily be reflective of abnormal metabolism/pathophysiology that manifest later in life and a future ASD diagnosis may also depend upon environmental factors during early childhood that an analysis at birth cannot take into account. If all or even some of these factors can be accounted for, however, then newborn blood spots may be a promising route for early identification of ASD cases.
Plasma amino acids150 and erythrocyte fatty acids151 have frequently been suggested as possible biomarkers of ASD. However, methodological variation across studies raises uncertainty regarding the conclusions of these investigations. In addition, previous studies by the authors employing multivariate analyses152,153 have reported little diagnostic value from these measures. Therefore, specific discussions of these measurements have been excluded from this review.
7.2. Excretory Metabolites
Metabolomics studies may also analyze the composition of the body’s excreted waste products. Compared to other discussed approaches, the collection of urinary and fecal samples is relatively easy and noninvasive. However, the compositions of these samples are mostly reflective of compounds leaving the body, and can be difficult to interpret with respect to abnormal metabolic processes in the body. For example, it may not always be clear whether an elevated concentration of a fecal metabolite indicates increased bodily intake and/or production of this metabolite, overactive excretion of this metabolite, or a combination of factors. Similar to blood metabolites, excretory measures are also influenced by dietary and lifestyle factors that should be controlled for to aid interpretability. The results of studies using multivariate analysis to study urinary and fecal metabolites indicate a reasonable ability to classify ASD from these measurements (Table 10), albeit in small samples of participants and with a limited range of multivariate techniques used.
Table 10.
Summary of recent and representative studies aiming to distinguish individuals with ASD from TD individuals using multivariate analysis of potential excretory (urinary and fecal) metabolite biomarkers. Reported sample sizes are the numbers used for classification and do not necessarily reflect the study’s total sample size.
| Reference | Study Participants | Experimental Methods | Key Features | Multivariate Technique | Key Results |
|---|---|---|---|---|---|
| Nadal-Desbarats et al. (2014)237 | 30 children with ASD and 28 TD children | Measured urinary metabolite profiles combined from two nuclear magnetic spectroscopy techniques | Minimum number of metabolites combined from both techniques | Partial least squares discriminant analysis | Achieved a prediction accuracy of 83% with 0.92 AUROC |
| Diémé et al. (2015)238 | 30 children with ASD and 32 TD children | Evaluated urine metabolite levels using nuclear magnetic spectroscopy and mass spectrometry techniques | 46 metabolites combined across techniques | Partial least squares discriminant analysis | Predicted a 16-sample validation set with 0.91 AUROC, 100% sensitivity, and 75% specificity |
| Gevi et al. (2016)239 | 30 children with ASD and 30 TD children | Quantified urinary metabolite concentrations through liquid chromatography and mass spectrometry | 25 urinary metabolites | Partial least squares discriminant analysis | Classified individuals with 0.89 AUROC |
| Kang et al. (2018)240 | 21 children with ASD and 23 TD children | Assess metabolite profiles and microbial compositions in participants’ fecal samples | Five fecal metabolites | Discriminant analysis | With leave-one-out cross-validation, obtained 78% sensitivity and 81% specificity |
8. Diagnostics Involving Folate-Dependent One-Carbon Metabolism (FOCM)
Folate, not naturally synthesized in animals, activates folate-dependent one-carbon metabolism (FOCM). Folate is important for biosynthesis of purine and thymidine, maintaining amino acid homeostasis by converting glycine to serine and synthesizing methionine, maintaining epigenetics through homocysteine re-methylation, and producing and consuming redox species.154 The transsulfuration (TS) pathway is intertwined with FOCM and is responsible for the production of glutathione, a primary antioxidant that assists with maintaining intracellular redox status and removal of toxins from the body.155 Abnormalities within these pathways, specifically a reduced ratio of S-adenosylmethionine to S-adenosylhomocysteine (suggesting decreased capacity for DNA methylation) and an increased ratio of oxidized to reduced glutathione (indicating greater levels of intracellular oxidative stress), have been closely associated with ASD pathophysiology and also may offer value towards a diagnostic marker.156
8.1. Discovery of Folate-Dependent One-Carbon Metabolism (FOCM) Biomarkers
One of the most promising candidates to date for a clinical ASD biomarker is a blood-based test using FOCM/TS measurements. In a previous study by the authors, seven FOCM/TS measures from the Integrated Metabolic and Genomic Endeavor study157 related to methylation and redox status were used to distinguish 83 children with ASD from 76 TD children (age 3–10) with 97% classification accuracy, 98% sensitivity, and 96% specificity via discriminant analysis with leave-one-out cross-validation.158 This work also uncovered significant correlations between FOCM/TS metabolites and measures of adaptive behavior, suggesting a connection between metabolic abnormalities and observed symptoms. An independent investigation analyzed the same data set while implementing a more advanced method of selecting measurements for classification and achieved similar classification results, providing validation of the initial findings.159
A follow-up study using baseline FOCM/TS data for 154 children/adolescents with ASD (age 2–17) from three clinical trials160–162 was able to validate a trained classifier with up to 88% sensitivity163; measures of specificity were not evaluated since this validation set did not include TD participants. Using the same sets of clinical trial data, it was further found that multivariate analysis of changes in FOCM/TS measurements could be used to characterize changes in adaptive behavior resulting from three metabolic interventions (methylcobalamin with low-dose folinic acid, tetrahydrobiopterin, or high-dose folinic acid).164 Multivariate analysis of folate-related markers collected from a separate study in China also showed promise for diagnosing ASD.165 Measurements from FOCM and TS describing DNA methylation and redox status may thus offer value not just as diagnostic markers, but also as indicators of treatment outcome. Despite the success of these studies, it still remains to be determined whether these measurements would be able to predict a future ASD diagnosis in infants and toddlers, which should be the true goal of any biomarker for the disorder. Furthermore, it needs to be investigated how results hold up for classifying children with ASD from children who have non-ASD related developmental delays. A current barrier to clinical translation of a FOCM/TS blood test is that certain measurements require specialized equipment and/or methods to quantify that are currently not widely available in clinics. It would be desirable to identify a subset of these measurements that yield reasonable diagnostic value while being easily measured by a standard blood panel.
8.2. Accounting for Epidemiological Prevalence
To successfully translate a classifier’s performance in a study cohort to its clinical potential in the population at large, the epidemiological prevalence of the investigated disorder or disease must be accounted for.166 In studies of psychiatric disorders, such as ASD, where the prevalence in the study population is often much greater than the true epidemiological prevalence, a classifier will likely underestimate the number of false positives and yield a relatively inflated number of false negatives. While this will have no effect on classifier sensitivity and specificity, it will provide an inaccurate representation of the positive and negative predictive values for the proposed diagnostic test. Obtaining a more accurate estimate of a classifier’s clinical utility requires that the Bayes’ adjusted positive and negative predictive values (PPVadj and NPVadj, respectively) be calculated166 by incorporating the true population prevalence:
| (1) |
| (2) |
Most studies do not account for epidemiological prevalence and instead limit their calculation of PPV and NPV to the study population, thus introducing the aforementioned uncertainty regarding applicability of the classifier to the overall population. Including only a population of individuals at high risk for the disorder in the study can help to alleviate this concern, as the study prevalence is likely to be more reflective of the epidemiological prevalence in a high-risk population. Furthermore, in a clinical setting it would likely be impractical, both logistically and economically, to test everyone from the overall population for a disorder; thus, limiting the classifier’s scope to just high-risk individuals or individuals where there are already concerns regarding their development would improve overall translation potential. That being said, there would still be value in understanding the prevalence of the disorder in the high-risk study population compared to the high-risk population at large.
For classifiers with exceptional separation between ASD and TD study cohorts, lack of adjustment for epidemiological prevalence will likely have a less noticeable impact when translated to a clinical setting. Introducing a greater proportion of participants without the disorder when the two groups are already well-separated may yield relatively minor changes to the positive and negative predictive values. In cases where this does not hold, however, the threshold for classification can be moved to optimize the trade-off between these two values. To help demonstrate this point, Figure 3A shows the result of classification (with leave-one-out cross-validation) from FOCM/TS measurements presented by Howsmon et al.158 At the original classification threshold, the sensitivity, sensitivity, PPV, and NPV are all high (Figure 3B); however, with a 1.7% overall prevalence of ASD, the PPVadj and NPVadj become 30.0% and 99.9%, respectively. Clearly such a low PPVadj is unsatisfactory, but by a slight adjustment of the classification threshold a more optimal PPVadj and NPVadj can be obtained while maintaining good sensitivity and specificity (Figure 3C). At this new adjusted threshold, which correctly classifies all TD participants, the PPVadj is 100% and the NPVadj is 99.9% (with 95% sensitivity and 100% specificity, compared to 98% sensitivity and 96% specificity with the original threshold). As can be seen from these numbers, adjusting the threshold is a viable approach for trading off classification accuracy with desired clinical outcomes such as higher PPVadj.
Fig 3.

Classification with leave-one-out cross-validation using seven measurements from the folate-dependent one-carbon metabolism (FOCM) and transsulfuration (TS) pathways as reported by Howsmon et al.158 (A) Classifier scores for participants in the autism spectrum disorder (ASD) and typically developing (TD) cohorts. (B) Confusion matrix when individuals having a classifier score less than 0.26 (the original classification threshold) are predicted as having ASD. Assuming a 1.7% prevalence of ASD in the general population, the Bayes’ adjusted positive and negative predictive values, indicated in parentheses, are 30.0% and 99.9%, respectively. (C) Confusion matrix when individuals having a classifier score less than 0 (the adjusted classification threshold) are predicted as having ASD. The Bayes’ adjusted positive and negative predictive values using this threshold, indicated in parentheses, are 100% and 99.9%, respectively.
8.3. Heterogeneous Presentation of ASD and Biomarker Discovery
One of the points often brought up in the context of discussions of biomarkers and diagnostic tests for ASD is the very heterogeneous presentation of the disorder. It is becoming widely-acknowledged that there is no one underlying cause for all the different presentations of ASD and that a variety of different, often still unknown, gene-environmental interactions are responsible for ASD. However, identifying biomarkers does not require identification of one or more root causes of ASD. Instead, biomarkers and diagnostic tests rely on correlations of measured quantities with the disorder and understanding causation, while highly desirable, is not required. Developing diagnostic procedures based upon biomarkers is thus a much weaker condition than determining one of the root causes underlying ASD. For example, it is conceivable that most of the children diagnosed with ASD have certain abnormalities in their metabolic function even if they show very different presentations of ASD, which may also result from different underlying causes; the data from the papers cited in this section certainly indicate that this seems to be the case.
Another point to consider for future work in this field is that children with ASD may show certain abnormalities in their metabolic function that are similar to those exhibited by children with other non-ASD-related conditions. To address this point, it is essential to not just perform comparisons of a cohort diagnosed with ASD against their TD peers, but also to perform comparison of children with ASD against children who have non-ASD-related developmental delays. Only such a comparison will be able to determine if the metabolic abnormality found when investigating ASD versus TD cohorts are indeed unique to ASD or may be indicative of a more general developmental delay (that may or may not be related to ASD).
9. Prediction of ASD Risk based on Maternal Factors
Maternal factors affect the risk of having a child with ASD. As previously discussed, the sibling recurrence rate of ASD is approximately 11-fold greater than the general population risk.71 Therefore, already having a child with ASD is an indicator for being at higher risk of having another child with ASD (high-risk mothers) compared to their peers who have TD children (low-risk mothers). An emerging area of ASD biomarker research involves the application of multivariate analysis to maternal measures, such as metabolite concentrations and medical history, to predict the risk of the child being diagnosed with ASD. The number of studies in this area are limited, but warrant discussion. It should be noted that the timing of the maternal assessment (prenatal versus postnatal, for example) would likely affect the findings of these types of assessments.
9.1. Maternal Blood Metabolites
The Markers of Autism Risk in Babies — Learning Early Signs (MARBLES) study is a prospective study investigating environmental factors in high-risk pregnant mothers that contribute to a child being eventually diagnosed with ASD.167 A recent study compared twenty FOCM/TS measurements of pregnant high- and low-risk mothers from blood samples at each trimester using multivariate analysis168 with the goal of identifying stronger predictors of child ASD risk. In this study, a single set of metabolites was found to predict if a mother belonged to the high- or low-risk category with 80–90% accuracy. These results present a step towards determining a maternal blood test for ASD risk in a child, and emphasize the importance of the FOCM and TS pathways in ASD pathophysiology. However, further validation of these findings is required.
In another study, maternal serum levels of vitamin D were found to be moderately predictive of the risk of a pregnant mother having a child with ASD.169 Among several serum measurements evaluated at the first trimester of pregnancy, decreased 25 hydroxyvitamin D3 was the strongest indicator of whether the child would later be diagnosed with ASD (on a univariate basis), yielding a sensitivity of 76% and specificity of 74%.
9.2. Maternal Medical History
The application of multivariate analysis to health surveys and interviews may allow for further probing of individuals’ medical characteristics. One study interviewed mothers of children with ASD and TD children to investigate various risk factors for ASD, such as parental ages at conception or chemical exposures during pregnancy, and used these data to train an artificial neural network for differentiating ASD and TD children.170 Employing an optimized form of two-fold cross-validation, this study attained a mean overall accuracy of 80% for classifying the two groups. Such analysis can also provide insight into the maternal factors that contribute to the risk of ASD.
10. Conclusions
Despite the many promising advances being made towards a viable multivariate biomarker for ASD, there still remain several barriers that need to be carefully considered. One of these is cost; although state-of-the-art screening tools may offer the greatest opportunity for early identification of ASD, these tools must also be affordable if they are to be successfully implemented on a large scale. Second, the heterogeneous, “spectrum” nature of ASD means that limiting classifier/biomarker designations to “having ASD” or “not having ASD” leaves a large grey area where the unique risk profiles of different children are not accurately represented171; different subtypes of ASD172 may have different biomarkers, limiting the utility of a one-size-fits-all approach to diagnostic testing. Factors such as gender differences, the presence of comorbid conditions, and changes in brain function throughout life, and how these affect biomarker interpretation, also need to be eventually addressed.142 For the majority of the reviewed studies, their findings also still require validation in independent cohorts, which would ideally come from separate research groups. Governmental approval of these approaches and assessing their feasibility in a clinical setting, not just a research setting, also pose significant challenges to successful implementation.
Although each of the approaches covered in this review have their individual advantages, they also have their individual disadvantages. For example, behavioral assessments are established, inexpensive, and the least invasive but are the most subjective and require specialized training. Neuroimaging approaches provide arguably the most complete picture of brain structure/function but are expensive and especially reliant on patient compliance; the link of brain structure to behavior will also need to be better understood. Transcriptomic and metabolic blood tests are fast and inexpensive but may require specialized laboratory tests and may be difficult to interpret without behavioral context. Implementing a multimodal approach to diagnosis may help to alleviate some of the respective concerns with these approaches while still capitalizing on their unique advantages.
Acknowledgements
The authors gratefully acknowledge partial financial support from the National Institutes of Health (Grant 1R01AI110642-01A1).
Footnotes
Publisher's Disclaimer: This is a PDF file of an unedited manuscript that has been accepted for publication. As a service to our customers we are providing this early version of the manuscript. The manuscript will undergo copyediting, typesetting, and review of the resulting proof before it is published in its final form. Please note that during the production process errors may be discovered which could affect the content, and all legal disclaimers that apply to the journal pertain.
Disclosure of Interests
J. Hahn is an inventor on the patent application “Method for predicting autism”, US Patent App. 16/002,329.
References
- 1.American Psychiatric Association: Diagnostic and Statistical Manual of Mental Disorders: DSM-V. Fifth edition. Washington, D.C.: American Psychiatric Publishing; 2013. [Google Scholar]
- 2.Baio J, Wiggins L, Christensen DL, et al. : Prevalence of autism spectrum disorder among children aged 8 years - Autism and Developmental Disabilities Monitoring Network, 11 sites, United States, 2014. MMWR Surveill Summ 67:1–23, 2018. [DOI] [PMC free article] [PubMed] [Google Scholar]
- 3.Braun KVN, Christensen D, Doernberg N, et al. : Trends in the prevalence of autism spectrum disorder, cerebral palsy, hearing loss, intellectual disability, and vision impairment, metropolitan Atlanta, 1991–2010. PLoS ONE 10:e0124120, 2015. [DOI] [PMC free article] [PubMed] [Google Scholar]
- 4.Kogan MD, Vladutiu CJ, Schieve LA, et al. : The prevalence of parent-reported autism spectrum disorder among US children. Pediatrics 142:e20174161, 2018. [DOI] [PMC free article] [PubMed] [Google Scholar]
- 5.Leigh JP, Du J: Brief report: Forecasting the economic burden of autism in 2015 and 2025 in the United States. J Autism Dev Disord 45:4135–4139, 2015. [DOI] [PubMed] [Google Scholar]
- 6.Buescher AVS, Cidav Z, Knapp M, et al. : Costs of autism spectrum disorders in the United Kingdom and the United States. JAMA Pediatr 168:721–728, 2014. [DOI] [PubMed] [Google Scholar]
- 7.Baxter AJ, Brugha TS, Erskine HE, et al. : The epidemiology and global burden of autism spectrum disorders. Psychol Med 45:601–613, 2015. [DOI] [PubMed] [Google Scholar]
- 8.Gaugler T, Klei L, Sanders SJ, et al. : Most genetic risk for autism resides with common variation. Nat Genet 46:881–885, 2014. [DOI] [PMC free article] [PubMed] [Google Scholar]
- 9.Mandy W, Lai M-C: Annual Research Review: The role of the environment in the developmental psychopathology of autism spectrum condition. J Child Psychol Psychiatry 57:271–292, 2016. [DOI] [PubMed] [Google Scholar]
- 10.Emberti Gialloreti L, Mazzone L, Benvenuto A, et al. : Risk and protective environmental factors associated with autism spectrum disorder: Evidence-based principles and recommendations. J Clin Med 8:217, 2019. [DOI] [PMC free article] [PubMed] [Google Scholar]
- 11.Zwaigenbaum L, Bryson SE, Brian J, et al. : Stability of diagnostic assessment for autism spectrum disorder between 18 and 36 months in a high-risk cohort. Autism Res 9:790–800, 2016. [DOI] [PubMed] [Google Scholar]
- 12.McPartland JC: Considerations in biomarker development for neurodevelopmental disorders. Curr Opin Neurol 29:118–122, 2016. [DOI] [PMC free article] [PubMed] [Google Scholar]
- 13.Zwaigenbaum L, Penner M: Autism spectrum disorder: Advances in diagnosis and evaluation. BMJ 361:k1674, 2018. [DOI] [PubMed] [Google Scholar]
- 14.American Psychiatric Association: Diagnostic and Statistical Manual of Mental Disorders: DSM-IVTR. Fourth edition, text revision. Washington, D.C.: American Psychiatric Publishing; 2000. [Google Scholar]
- 15.Simms GO, Organization WH, Staff WHO, et al. : The ICD-10 Classification of Mental and Behavioural Disorders: Clinical Descriptions and Diagnostic Guidelines. World Health Organization; 1992. [Google Scholar]
- 16.Lord C, Rutter M, Le Couteur A: Autism Diagnostic Interview-Revised: A revised version of a diagnostic interview for caregivers of individuals with possible pervasive developmental disorders. J Autism Dev Disord 24:659–685, 1994. [DOI] [PubMed] [Google Scholar]
- 17.Lord C, Rutter M, Goode S, et al. : Autism diagnostic observation schedule: A standardized observation of communicative and social behavior. J Autism Dev Disord 19:185–212, 1989. [DOI] [PubMed] [Google Scholar]
- 18.Fein D, Barton M, Dumont-Mathieu T: Optimizing outcome in autism spectrum disorders. Policy Insights Behav Brain Sci 4:71–78, 2017. [Google Scholar]
- 19.Hampton J, Strand PS: A review of Level 2 parent-report instruments used to screen children aged 1.5–5 for autism: A meta-analytic update. J Autism Dev Disord 45:2519–2530, 2015. [DOI] [PubMed] [Google Scholar]
- 20.Lai M-C, Lombardo MV, Baron-Cohen S: Autism. The Lancet 383:896–910, 2014. [DOI] [PubMed] [Google Scholar]
- 21.Siu AL, Bibbins-Domingo K, Grossman DC, et al. : Screening for autism spectrum disorder in young children: US Preventive Services Task Force recommendation statement. JAMA 315:691–696, 2016. [DOI] [PubMed] [Google Scholar]
- 22.Costanzo V, Chericoni N, Amendola FA, et al. : Early detection of autism spectrum disorders: From retrospective home video studies to prospective ‘high risk’ sibling studies. Neurosci Biobehav Rev 55:627–635, 2015. [DOI] [PubMed] [Google Scholar]
- 23.Brian J, Bryson SE, Smith IM, et al. : Stability and change in autism spectrum disorder diagnosis from age 3 to middle childhood in a high-risk sibling cohort. Autism 20:888–892, 2016. [DOI] [PubMed] [Google Scholar]
- 24.Barbaro J, Dissanayake C: Diagnostic stability of autism spectrum disorder in toddlers prospectively identified in a community-based setting: Behavioural characteristics and predictors of change over time. Autism 21:830–840, 2017. [DOI] [PubMed] [Google Scholar]
- 25.Clark MLE, Barbaro J, Dissanayake C: Continuity and change in cognition and autism severity from toddlerhood to school age. J Autism Dev Disord 47:328–339, 2017. [DOI] [PubMed] [Google Scholar]
- 26.Ozonoff S, Young GS, Landa RJ, et al. : Diagnostic stability in young children at risk for autism spectrum disorder: A Baby Siblings Research Consortium study. J Child Psychol Psychiatr 56:988–998, 2015. [DOI] [PMC free article] [PubMed] [Google Scholar]
- 27.Brett D, Warnell F, McConachie H, et al. : Factors affecting age at ASD diagnosis in UK: No evidence that diagnosis age has decreased between 2004 and 2014. J Autism Dev Disord 46:1974–1984, 2016. [DOI] [PMC free article] [PubMed] [Google Scholar]
- 28.Soke GN, Maenner MJ, Christensen D, et al. : Prevalence of co-occurring medical and behavioral conditions/symptoms among 4- and 8-year-old children with autism spectrum disorder in selected areas of the United States in 2010. J Autism Dev Disord 48:2663–2676, 2018. [DOI] [PMC free article] [PubMed] [Google Scholar]
- 29.Shattuck PT, Durkin M, Maenner M, et al. : Timing of identification among children with an autism spectrum disorder: Findings from a population-based surveillance study. J Am Acad Child Adolesc Psychiatry 48:474–483, 2009. [DOI] [PMC free article] [PubMed] [Google Scholar]
- 30.Davidovitch M, Stein N, Koren G, et al. : Deviations from typical developmental trajectories detectable at 9 months of age in low risk children later diagnosed with autism spectrum disorder. J Autism Dev Disord 48:2854–2869, 2018. [DOI] [PubMed] [Google Scholar]
- 31.Sacrey L-AR, Zwaigenbaum L, Bryson S, et al. : Developmental trajectories of adaptive behavior in autism spectrum disorder: A high-risk sibling cohort. J Child Psychol Psychiatry, 2018. [DOI] [PubMed] [Google Scholar]
- 32.Emerson ND, Morrell HER, Neece C: Predictors of age of diagnosis for children with autism spectrum disorder: The role of a consistent source of medical care, race, and condition severity. J Autism Dev Disord 46:127–138, 2016. [DOI] [PubMed] [Google Scholar]
- 33.Herlihy LE, Brooks B, Dumont-Mathieu T, et al. : Standardized screening facilitates timely diagnosis of autism spectrum disorders in a diverse sample of low-risk toddlers. J Dev Behav Pediatr 35:85–92, 2014. [DOI] [PMC free article] [PubMed] [Google Scholar]
- 34.Khowaja MK, Hazzard AP, Robins DL: Sociodemographic barriers to early detection of autism: Screening and evaluation using the M-CHAT, M-CHAT-R, and follow-up. J Autism Dev Disord 45:1797–1808, 2015. [DOI] [PMC free article] [PubMed] [Google Scholar]
- 35.Rubenstein E, Durkin MS, Harrington RA, et al. : Relationship between advanced maternal age and timing of first developmental evaluation in children with autism. J Dev Behav Pediatr 39:601, 2018. [DOI] [PMC free article] [PubMed] [Google Scholar]
- 36.Reaven J, Blakeley-Smith A, Culhane-Shelburne K, et al. : Group cognitive behavior therapy for children with high-functioning autism spectrum disorders and anxiety: A randomized trial. J Child Psychol Psychiatry 53:410–419, 2012. [DOI] [PMC free article] [PubMed] [Google Scholar]
- 37.Reichow B, Barton EE, Boyd BA, et al. : Early intensive behavioral intervention (EIBI) for young children with autism spectrum disorders (ASD). Cochrane Db Syst Rev, 2012. [DOI] [PubMed] [Google Scholar]
- 38.Storch EA, Arnold EB, Lewin AB, et al. : The effect of cognitive-behavioral therapy versus treatment as usual for anxiety in children with autism spectrum disorders: A randomized, controlled trial. J Am Acad Child Adolesc Psychiatry 5ss2:132–142.e2, 2013. [DOI] [PubMed] [Google Scholar]
- 39.Green J, Pickles A, Pasco G, et al. : Randomised trial of a parent-mediated intervention for infants at high risk for autism: Longitudinal outcomes to age 3 years. J Child Psychol Psychiatry 58:1330–1340, 2017. [DOI] [PMC free article] [PubMed] [Google Scholar]
- 40.Cheng N, Rho JM, Masino SA: Metabolic dysfunction underlying autism spectrum disorder and potential treatment approaches. Front Mol Neurosci 10:34, 2017. [DOI] [PMC free article] [PubMed] [Google Scholar]
- 41.French L, Kennedy EMM: Annual Research Review: Early intervention for infants and young children with, or at-risk of, autism spectrum disorder: A systematic review. J Child Psychol Psychiatry 59:444–456, 2018. [DOI] [PubMed] [Google Scholar]
- 42.Penner M, Rayar M, Bashir N, et al. : Cost-effectiveness analysis comparing pre-diagnosis autism spectrum disorder (ASD)-targeted intervention with Ontario’s Autism Intervention Program. J Autism Dev Disord 45:2833–2847, 2015. [DOI] [PubMed] [Google Scholar]
- 43.Peters-Scheffer N, Didden R, Korzilius H, et al. : Cost comparison of early intensive behavioral intervention and treatment as usual for children with autism spectrum disorder in the Netherlands. Res Dev Disabil 33:1763–1772, 2012. [DOI] [PubMed] [Google Scholar]
- 44.Aron L, Loprest P: Disability and the education system. Future Child 22:97–122, 2012. [DOI] [PubMed] [Google Scholar]
- 45.Frye RE, Rossignol DA: Identification and treatment of pathophysiological comorbidities of autism spectrum disorder to achieve optimal outcomes. Clin Med Insights Pediatr 10:43–56, 2016. [DOI] [PMC free article] [PubMed] [Google Scholar]
- 46.Randolph-Gips M, Srinivasan P: Modeling autism: A systems biology approach. J Clin Bioinforma 2:17, 2012. [DOI] [PMC free article] [PubMed] [Google Scholar]
- 47.Parellada M, Penzol MJ, Pina L, et al. : The neurobiology of autism spectrum disorders. Eur Psychiatry 29:11–19, 2014. [DOI] [PubMed] [Google Scholar]
- 48.Hughes HK, Mills Ko E, Rose D, et al. : Immune dysfunction and autoimmunity as pathological mechanisms in autism spectrum disorders. Front Cell Neurosci 12:405, 2018. [DOI] [PMC free article] [PubMed] [Google Scholar]
- 49.McElhanon BO, McCracken C, Karpen S, et al. : Gastrointestinal symptoms in autism spectrum disorder: A meta-analysis. Pediatrics 133:872–883, 2014. [DOI] [PubMed] [Google Scholar]
- 50.Biomarkers Definitions Working Group: Biomarkers and surrogate endpoints: Preferred definitions and conceptual framework. Clin Pharmacol Ther 69:89–95, 2001. [DOI] [PubMed] [Google Scholar]
- 51.Lyons TJ, Basu A: Biomarkers in diabetes: Hemoglobin A1c, vascular and tissue markers. Transl Res 159:303–312, 2012. [DOI] [PMC free article] [PubMed] [Google Scholar]
- 52.Albert MA: Biomarkers and heart disease. J Clin Sleep Med 7:S9–S11, 2011. [DOI] [PMC free article] [PubMed] [Google Scholar]
- 53.Walsh MF, Nathanson KL, Couch FJ, et al. : Genomic biomarkers for breast cancer risk. Adv Exp Med Biol 882:1–32, 2016. [DOI] [PMC free article] [PubMed] [Google Scholar]
- 54.Lombardo MV, Lai M-C, Baron-Cohen S: Big data approaches to decomposing heterogeneity across the autism spectrum. Mol Psychiatry 1, 2019. [DOI] [PMC free article] [PubMed] [Google Scholar]
- 55.Zhao Y, Castellanos FX: Annual Research Review: Discovery science strategies in studies of the pathophysiology of child and adolescent psychiatric disorders - promises and limitations. J Child Psychol Psychiatry 57:421–439, 2016. [DOI] [PMC free article] [PubMed] [Google Scholar]
- 56.Jacob S, Wolff JJ, Steinbach MS, et al. : Neurodevelopmental heterogeneity and computational approaches for understanding autism. Transl Psychiatry 9:63, 2019. [DOI] [PMC free article] [PubMed] [Google Scholar]
- 57.Itani S, Lecron F, Fortemps P: Specifics of medical data mining for diagnosis aid: A survey. Expert Syst Appl 118:300–314, 2019. [Google Scholar]
- 58.Vargason T, Howsmon DP, McGuinness DL, et al. : On the use of multivariate methods for analysis of data from biological networks. Processes 5:36, 2017. [DOI] [PMC free article] [PubMed] [Google Scholar]
- 59.Cortes C, Vapnik V: Support-vector networks. Mach Learn 20:273–297, 1995. [Google Scholar]
- 60.Cox DR: The regression analysis of binary sequences. J Royal Stat Soc B Met 20:215–242, 1958. [Google Scholar]
- 61.Fisher RA: The use of multiple measurements in taxonomic problems. Ann Eugenic 7:179–188, 1936. [Google Scholar]
- 62.Breiman L, Friedman JH, Olshen RA, et al. : Classification and Regression Trees. 1st ed. New York, NY: Chapman & Hall/CRC; 1984. [Google Scholar]
- 63.Pearson K: On lines and planes of closest fit to systems of points in space. Lond Edinb Dubl Philos Mag 2:559–572, 1901. [Google Scholar]
- 64.MacQueen J: Some methods for classification and analysis of multivariate observations In: Proceedings of the Fifth Berkeley Symposium on Mathematical Statistics and Probability, Volume 1: Statistics. Berkeley, CA, USA: University of California Press; 1967. p. 281–297.. [Google Scholar]
- 65.Kohonen T: Self-organized formation of topologically correct feature maps. Biol Cybern 43:59–69, 1982. [Google Scholar]
- 66.Hajian-Tilaki K: Receiver operating characteristic (ROC) curve analysis for medical diagnostic test evaluation. Caspian J Intern Med 4:627–635, 2013. [PMC free article] [PubMed] [Google Scholar]
- 67.Kohavi R: A study of cross-validation and bootstrap for accuracy estimation and model selection. In: Proceedings of the 14th International Joint Conference on Artificial Intelligence - Volume 2 San Francisco, CA, USA: Morgan Kaufmann Publishers Inc.; 1995. p. 1137–1143.. [Google Scholar]
- 68.Charman T, Gotham K: Measurement issues: Screening and diagnostic instruments for autism spectrum disorders - lessons from research and practice. Child Adolesc Ment Health 18:52–63, 2013. [DOI] [PMC free article] [PubMed] [Google Scholar]
- 69.Thabtah F: Machine learning in autistic spectrum disorder behavioral research: A review and ways forward. Inform Health Soc Care 1–20, 2018. [DOI] [PubMed] [Google Scholar]
- 70.Woolfenden S, Sarkozy V, Ridley G, et al. : A systematic review of the diagnostic stability of autism spectrum disorder. Res Autism Spectr Disord 6:345–354, 2012. [Google Scholar]
- 71.Ozonoff S, Young GS, Carter A, et al. : Recurrence risk for autism spectrum disorders: A Baby Siblings Research Consortium study. Pediatrics 128:e1–e7, 2011. [DOI] [PMC free article] [PubMed] [Google Scholar]
- 72.Ozonoff S, Iosif A-M: Changing conceptualizations of regression: What prospective studies reveal about the onset of autism spectrum disorder. Neurosci Biobehav Rev 100:296–304, 2019. [DOI] [PMC free article] [PubMed] [Google Scholar]
- 73.Duda M, Daniels J, Wall DP: Clinical evaluation of a novel and mobile autism risk assessment. J Autism Dev Disord 46:1953–1961, 2016. [DOI] [PMC free article] [PubMed] [Google Scholar]
- 74.Fusaro VA, Daniels J, Duda M, et al. : The potential of accelerating early detection of autism through content analysis of YouTube videos. PLoS ONE 9:e93533, 2014. [DOI] [PMC free article] [PubMed] [Google Scholar]
- 75.Kanne SM, Carpenter LA, Warren Z: Screening in toddlers and preschoolers at risk for autism spectrum disorder: Evaluating a novel mobile-health screening tool. Autism Res 11:1038–1049, 2018. [DOI] [PubMed] [Google Scholar]
- 76.Tariq Q, Daniels J, Schwartz JN, et al. : Mobile detection of autism through machine learning on home video: A development and prospective validation study. PLoS Medicine 15:e1002705, 2018. [DOI] [PMC free article] [PubMed] [Google Scholar]
- 77.Thabtah F, Kamalov F, Rajab K: A new computational intelligence approach to detect autistic features for autism screening. Int J Med Inform 117:112–124, 2018. [DOI] [PubMed] [Google Scholar]
- 78.Puerto E, Aguilar J, López C, et al. : Using multilayer fuzzy cognitive maps to diagnose autism spectrum disorder. Appl Soft Comput 75:58–71, 2019. [Google Scholar]
- 79.Narzisi A, Muratori F, Buscema M, et al. : Outcome predictors in autism spectrum disorders preschoolers undergoing treatment as usual: insights from an observational study using artificial neural networks. Neuropsychiatr Dis Treat 11:1587–1599, 2015. [DOI] [PMC free article] [PubMed] [Google Scholar]
- 80.Bhat AN, Galloway JC, Landa RJ: Relation between early motor delay and later communication delay in infants at risk for autism. Infant Behav Dev 35:838–846, 2012. [DOI] [PMC free article] [PubMed] [Google Scholar]
- 81.LeBarton ES, Landa RJ: Infant motor skill predicts later expressive language and autism spectrum disorder diagnosis. Infant Behav Dev 54:37–47, 2019. [DOI] [PubMed] [Google Scholar]
- 82.MacDonald M, Lord C, Ulrich D: The relationship of motor skills and adaptive behavior skills in young children with autism spectrum disorders. Res Autism Spectr Disord 7:1383–1390, 2013. [DOI] [PMC free article] [PubMed] [Google Scholar]
- 83.Sparaci L, Northrup JB, Capirci O, et al. : From using tools to using language in infant siblings of children with autism. J Autism Dev Disord 48:2319–2334, 2018. [DOI] [PMC free article] [PubMed] [Google Scholar]
- 84.Esposito G, Pasca S: Motor abnormalities as a putative endophenotype for autism spectrum disorders. Front Integr Neurosci 7:43, 2013. [DOI] [PMC free article] [PubMed] [Google Scholar]
- 85.Xuejun Kong MD, Wang BK, Park J, et al. : Introduction of a new video-based eye tracking paradigm for early detection of ASD. North Am J Med Sci 10:133–135, 2017. [Google Scholar]
- 86.Gangi DN, Schwichtenberg A, Iosif A-M, et al. : Gaze to faces across interactive contexts in infants at heightened risk for autism. Autism 22:763–768, 2018. [DOI] [PMC free article] [PubMed] [Google Scholar]
- 87.Jones W, Klin A: Attention to eyes is present but in decline in 2–6-month-old infants later diagnosed with autism. Nature 504:427–431, 2013. [DOI] [PMC free article] [PubMed] [Google Scholar]
- 88.Campbell K, Carpenter KL, Hashemi J, et al. : Computer vision analysis captures atypical attention in toddlers with autism. Autism 23:619–628, 2019. [DOI] [PMC free article] [PubMed] [Google Scholar]
- 89.Moore A, Wozniak M, Yousef A, et al. : The geometric preference subtype in ASD: Identifying a consistent, early-emerging phenomenon through eye tracking. Mol Autism 9:19, 2018. [DOI] [PMC free article] [PubMed] [Google Scholar]
- 90.Fletcher-Watson S, Hampton S: The potential of eye-tracking as a sensitive measure of behavioural change in response to intervention. Sci Rep 8:14715, 2018. [DOI] [PMC free article] [PubMed] [Google Scholar]
- 91.Murias M, Major S, Davlantis K, et al. : Validation of eye-tracking measures of social attention as a potential biomarker for autism clinical trials. Autism Res 11:166–174, 2018. [DOI] [PubMed] [Google Scholar]
- 92.Warlaumont AS, Richards JA, Gilkerson J, et al. : A social feedback loop for speech development and its reduction in autism. Psychol Sci 25:1314–1324, 2014. [DOI] [PMC free article] [PubMed] [Google Scholar]
- 93.Fusaroli R, Lambrechts A, Bang D, et al. : Is voice a marker for autism spectrum disorder? A systematic review and meta-analysis. Autism Res 10:384–407, 2017. [DOI] [PubMed] [Google Scholar]
- 94.Golestan S, Soleiman P, Moradi H: A comprehensive review of technologies used for screening, assessment, and rehabilitation of autism spectrum disorder. arXiv e-prints 1807:arXiv:1807.10986, 2018. [Google Scholar]
- 95.Liu X, Wu Q, Zhao W, et al. : Technology-facilitated diagnosis and treatment of individuals with autism spectrum disorder: An engineering perspective. Appl Sci 7:1051, 2017. [Google Scholar]
- 96.Dehkordi PS, Moradi H, Mahmoudi M, et al. : The design, development, and deployment of RoboParrot for screening autistic children. Int J of Soc Robotics 7:513–522, 2015. [Google Scholar]
- 97.Moradi H, Amiri SE, Ghanavi R, et al. : Autism screening using an intelligent toy car In: Ochoa SF, Singh P, Bravo J, editors. Ubiquitous Computing and Ambient Intelligence. Springer International Publishing; 2017. p. 817–827.. [Google Scholar]
- 98.Anzulewicz A, Sobota K, Delafield-Butt JT: Toward the Autism Motor Signature: Gesture patterns during smart tablet gameplay identify children with autism. Sci Rep 6:31107, 2016. [DOI] [PMC free article] [PubMed] [Google Scholar]
- 99.Li D, Karnath H-O, Xu X: Candidate biomarkers in children with autism spectrum disorder: A review of MRI studies. Neurosci Bull 33:219–237, 2017. [DOI] [PMC free article] [PubMed] [Google Scholar]
- 100.Pappaianni E, Siugzdaite R, Vettori S, et al. : Three shades of grey: Detecting brain abnormalities in children with autism using source-, voxel- and surface-based morphometry. Eur J Neurosci 47:690–700, 2018. [DOI] [PubMed] [Google Scholar]
- 101.Müller R-A, Fishman I: Brain connectivity and neuroimaging of social networks in autism. Trends Cogn Sci 22:1103–1116, 2018. [DOI] [PMC free article] [PubMed] [Google Scholar]
- 102.McKinnon CJ, Eggebrecht AT, Todorov A, et al. : Restricted and repetitive behavior and brain functional connectivity in infants at risk for developing autism spectrum disorder. Biol Psychiatry Cogn Neurosci Neuroimaging 4:50–61, 2019. [DOI] [PMC free article] [PubMed] [Google Scholar]
- 103.Andrews DS, Marquand A, Ecker C, et al. : Using pattern classification to identify brain imaging markers in autism spectrum disorder. Curr Top Behav Neurosci 40:413–436, 2018. [DOI] [PubMed] [Google Scholar]
- 104.Mash LE, Reiter MA, Linke AC, et al. : Multimodal approaches to functional connectivity in autism spectrum disorders: An integrative perspective. Dev Neurobiol 78:456–473, 2018. [DOI] [PMC free article] [PubMed] [Google Scholar]
- 105.Nair A, Keown CL, Datko M, et al. : Impact of methodological variables on functional connectivity findings in autism spectrum disorders. Hum Brain Mapp 35:4035–4048, 2014. [DOI] [PMC free article] [PubMed] [Google Scholar]
- 106.Ming X, O’Connor M: The utility of MRI in children with autism spectrum disorder. Autism Open Access 6:164, 2016. [DOI] [PMC free article] [PubMed] [Google Scholar]
- 107.Horga G, Kaur T, Peterson BS: Annual Research Review: Current limitations and future directions in MRI studies of child- and adult-onset developmental psychopathologies. J Child Psychol Psychiatry 55:659–680, 2014. [DOI] [PMC free article] [PubMed] [Google Scholar]
- 108.Lange N, Travers BG, Bigler ED, et al. : Longitudinal volumetric brain changes in autism spectrum disorder ages 6–35 years. Autism Res 8:82–93, 2015. [DOI] [PMC free article] [PubMed] [Google Scholar]
- 109.Ingalhalikar M, Parker WA, Bloy L, et al. : Creating multimodal predictors using missing data: Classifying and subtyping autism spectrum disorder. J Neurosci Methods 235:1–9, 2014. [DOI] [PubMed] [Google Scholar]
- 110.Libero LE, DeRamus TP, Lahti AC, et al. : Multimodal neuroimaging based classification of autism spectrum disorder using anatomical, neurochemical, and white matter correlates. Cortex 66:46–59, 2015. [DOI] [PMC free article] [PubMed] [Google Scholar]
- 111.Jiao Y, Chen R, Ke X, et al. : Predictive models of autism spectrum disorder based on brain regional cortical thickness. Neuroimage 50:589–599, 2010. [DOI] [PMC free article] [PubMed] [Google Scholar]
- 112.Arbabshirani MR, Plis S, Sui J, et al. : Single subject prediction of brain disorders in neuroimaging: Promises and pitfalls. Neuroimage 145:137–165, 2017. [DOI] [PMC free article] [PubMed] [Google Scholar]
- 113.Chanel G, Pichon S, Conty L, et al. : Classification of autistic individuals and controls using cross-task characterization of fMRI activity. Neuroimage Clin 10:78–88, 2016. [DOI] [PMC free article] [PubMed] [Google Scholar]
- 114.Du Y, Fu Z, Calhoun VD: Classification and prediction of brain disorders using functional connectivity: Promising but challenging. Front Neurosci 12:525, 2018. [DOI] [PMC free article] [PubMed] [Google Scholar]
- 115.Jung M, Tu Y, Lang CA, et al. : Decreased structural connectivity and resting-state brain activity in the lateral occipital cortex is associated with social communication deficits in boys with autism spectrum disorder. Neuroimage 190:205–212, 2019. [DOI] [PubMed] [Google Scholar]
- 116.Uddin LQ, Dajani DR, Voorhies W, et al. : Progress and roadblocks in the search for brain-based biomarkers of autism and attention-deficit/hyperactivity disorder. Transl Psychiatry 7:e1218, 2017. [DOI] [PMC free article] [PubMed] [Google Scholar]
- 117.Yang D, Pelphrey KA, Sukhodolsky DG, et al. : Brain responses to biological motion predict treatment outcome in young children with autism. Transl Psychiatry 6:e948, 2016. [DOI] [PMC free article] [PubMed] [Google Scholar]
- 118.Yang YJD, Allen T, Abdullahi SM, et al. : Brain responses to biological motion predict treatment outcome in young adults with autism receiving Virtual Reality Social Cognition Training: Preliminary findings. Behav Res Ther 93:55–66, 2017. [DOI] [PubMed] [Google Scholar]
- 119.Di Martino A, Yan C-G, Li Q, et al. : The Autism Brain Imaging Data Exchange: Towards a large-scale evaluation of the intrinsic brain architecture in autism. Mol Psychiatry 19:659–667, 2014. [DOI] [PMC free article] [PubMed] [Google Scholar]
- 120.Retico A, Arezzini S, Bosco P, et al. : ARIANNA: A research environment for neuroimaging studies in autism spectrum disorders. Comput Biol Med 87:1–7, 2017. [DOI] [PubMed] [Google Scholar]
- 121.Payakachat N, Tilford JM, Ungar WJ: National Database for Autism Research (NDAR): Big data opportunities for health services research and health technology assessment. Pharmacoeconomics 34:127–138, 2016. [DOI] [PMC free article] [PubMed] [Google Scholar]
- 122.Maximo JO, Cadena EJ, Kana RK: The implications of brain connectivity in the neuropsychology of autism. Neuropsychol Rev 24:16–31, 2014. [DOI] [PMC free article] [PubMed] [Google Scholar]
- 123.Abraham A, Milham MP, Di Martino A, et al. : Deriving reproducible biomarkers from multi-site resting-state data: An autism-based example. Neuroimage 147:736–745, 2017. [DOI] [PubMed] [Google Scholar]
- 124.Bhaumik R, Pradhan A, Das S, et al. : Predicting autism spectrum disorder using domain-adaptive cross-site evaluation. Neuroinform 16:197–205, 2018. [DOI] [PubMed] [Google Scholar]
- 125.Haar S, Berman S, Behrmann M, et al. : Anatomical abnormalities in autism? Cereb Cortex 26:1440–1452, 2016. [DOI] [PubMed] [Google Scholar]
- 126.Katuwal GJ, Cahill ND, Baum SA, et al. : The predictive power of structural MRI in autism diagnosis. In: Conference Proceedings of the 37th Annual International Conference of the IEEE Engineering in Medicine and Biology Society Milan, Italy; 2015. p. 4270–4273.. [DOI] [PubMed] [Google Scholar]
- 127.Nielsen JA, Zielinski BA, Fletcher PT, et al. : Multisite functional connectivity MRI classification of autism: ABIDE results. Front Hum Neurosci 7:599, 2013. [DOI] [PMC free article] [PubMed] [Google Scholar]
- 128.Sen B, Borle NC, Greiner R, et al. : A general prediction model for the detection of ADHD and autism using structural and functional MRI. PLoS ONE 13:e0194856, 2018. [DOI] [PMC free article] [PubMed] [Google Scholar]
- 129.Kozhushko NJu, Nagornova ZV, Evdokimov SA, et al. : Specificity of spontaneous EEG associated with different levels of cognitive and communicative dysfunctions in children. Int J Psychophysiol 128:22–30, 2018. [DOI] [PubMed] [Google Scholar]
- 130.Mamashli F, Khan S, Bharadwaj H, et al. : Maturational trajectories of local and long-range functional connectivity in autism during face processing. Hum Brain Mapp 39:4094–4104, 2018. [DOI] [PMC free article] [PubMed] [Google Scholar]
- 131.Lloyd-Fox S, Blasi A, Pasco G, et al. : Cortical responses before 6 months of life associate with later autism. Eur J Neurosci 47:736–749, 2018. [DOI] [PMC free article] [PubMed] [Google Scholar]
- 132.O’Reilly C, Lewis JD, Elsabbagh M: Is functional brain connectivity atypical in autism? A systematic review of EEG and MEG studies. PLoS ONE 12:e0175870, 2017. [DOI] [PMC free article] [PubMed] [Google Scholar]
- 133.Vorstman JAS, Parr JR, Moreno-De-Luca D, et al. : Autism genetics: Opportunities and challenges for clinical translation. Nat Rev Genet 18:362–376, 2017. [DOI] [PubMed] [Google Scholar]
- 134.Insel TR: The NIMH Research Domain Criteria (RDoC) Project: Precision medicine for psychiatry. AJP 171:395–397, 2014. [DOI] [PubMed] [Google Scholar]
- 135.Ansel A, Rosenzweig JP, Zisman PD, et al. : Variation in gene expression in autism spectrum disorders: An extensive review of transcriptomic studies. Front Neurosci 10:601, 2017. [DOI] [PMC free article] [PubMed] [Google Scholar]
- 136.Ch’ng C, Kwok W, Rogic S, et al. : Meta-analysis of gene expression in autism spectrum disorder. Autism Res 8:593–608, 2015. [DOI] [PMC free article] [PubMed] [Google Scholar]
- 137.Tylee DS, Hess JL, Quinn TP, et al. : Blood transcriptomic comparison of individuals with and without autism spectrum disorder: A combined-samples mega-analysis. Am J Med Genet B Neuropsychiatr Genet 174:181–201, 2017. [DOI] [PMC free article] [PubMed] [Google Scholar]
- 138.Loke YJ, Hannan AJ, Craig JM: The role of epigenetic change in autism spectrum disorders. Front Neurol 6:107, 2015. [DOI] [PMC free article] [PubMed] [Google Scholar]
- 139.Hicks SD, Middleton FA: A comparative review of microRNA expression patterns in autism spectrum disorder. Front Psychiatry 7:176, 2016. [DOI] [PMC free article] [PubMed] [Google Scholar]
- 140.Kichukova TM, Popov NT, Ivanov HY, et al. : Circulating microRNAs as a novel class of potential diagnostic biomarkers in neuropsychiatric disorders. Folia Medica 57:159–172, 2016. [DOI] [PubMed] [Google Scholar]
- 141.Woldemichael BT, Mansuy IM: Micro-RNAs in cognition and cognitive disorders: Potential for novel biomarkers and therapeutics. Biochem Pharmacol 104:1–7, 2016. [DOI] [PubMed] [Google Scholar]
- 142.Hicks SD, Rajan AT, Wagner KE, et al. : Validation of a salivary RNA test for childhood autism spectrum disorder. Front Genet 9:534, 2018. [DOI] [PMC free article] [PubMed] [Google Scholar]
- 143.Bakulski KM, Halladay A, Hu VW, et al. : Epigenetic research in neuropsychiatric disorders: The “Tissue Issue.” Curr Behav Neurosci Rep 3:264–274, 2016. [DOI] [PMC free article] [PubMed] [Google Scholar]
- 144.Lu W, Su X, Klein MS, et al. : Metabolite measurement: Pitfalls to avoid and practices to follow. Annu Rev Biochem 86:277–304, 2017. [DOI] [PMC free article] [PubMed] [Google Scholar]
- 145.Altun H, Şahin N, Kurutaş EB, et al. : Assessment of malondialdehyde levels, superoxide dismutase, and catalase activity in children with autism spectrum disorders. Psychiatry Clin Psychopharmacol 28:408–415, 2018. [Google Scholar]
- 146.Khemakhem AM, Frye RE, El-Ansary A, et al. : Novel biomarkers of metabolic dysfunction is autism spectrum disorder: Potential for biological diagnostic markers. Metab Brain Dis 32:1983–1997, 2017. [DOI] [PubMed] [Google Scholar]
- 147.Wang L, Jia J, Zhang J, et al. : Serum levels of SOD and risk of autism spectrum disorder: A case-control study. Int J Dev Neurosci 51:12–16, 2016. [DOI] [PubMed] [Google Scholar]
- 148.Mizejewski GJ, Lindau-Shepard B, Pass KA: Newborn screening for autism: In search of candidate biomarkers. Biomark Med 7:247–260, 2013. [DOI] [PMC free article] [PubMed] [Google Scholar]
- 149.Zakaria R, Allen KJ, Koplin JJ, et al. : Advantages and challenges of dried blood spot analysis by mass spectrometry across the total testing process. EJIFCC 27:288–317, 2016. [PMC free article] [PubMed] [Google Scholar]
- 150.Zheng H-F, Wang W-Q, Li X-M, et al. : Body fluid levels of neuroactive amino acids in autism spectrum disorders: A review of the literature. Amino Acids 49:57–65, 2017. [DOI] [PMC free article] [PubMed] [Google Scholar]
- 151.Mazahery H, Stonehouse W, Delshad M, et al. : Relationship between long chain n-3 polyunsaturated fatty acids and autism spectrum disorder: Systematic review and meta-analysis of case-control and randomised controlled trials. Nutrients 9:155, 2017. [DOI] [PMC free article] [PubMed] [Google Scholar]
- 152.Howsmon DP, Adams JB, Kruger U, et al. : Erythrocyte fatty acid profiles in children are not predictive of autism spectrum disorder status: A case control study. Biomark Res 6:12, 2018. [DOI] [PMC free article] [PubMed] [Google Scholar]
- 153.Vargason T, Kruger U, McGuinness DL, et al. : Investigating plasma amino acids for differentiating individuals with autism spectrum disorder and typically developing peers. Res Autism Spectr Disord 50:60–72, 2018. [DOI] [PMC free article] [PubMed] [Google Scholar]
- 154.Ducker GS, Rabinowitz JD: One-carbon metabolism in health and disease. Cell Metab 25:27–42, 2017. [DOI] [PMC free article] [PubMed] [Google Scholar]
- 155.Lu SC: Regulation of glutathione synthesis. Mol Aspects Med 30:42–59, 2009. [DOI] [PMC free article] [PubMed] [Google Scholar]
- 156.Frye RE, Slattery JC, Quadros EV: Folate metabolism abnormalities in autism: Potential biomarkers. Biomark Med 11:687–699, 2017. [DOI] [PubMed] [Google Scholar]
- 157.Melnyk S, Fuchs GJ, Schulz E, et al. : Metabolic imbalance associated with methylation dysregulation and oxidative damage in children with autism. J Autism Dev Disord 42:367–377, 2012. [DOI] [PMC free article] [PubMed] [Google Scholar]
- 158.Howsmon DP, Kruger U, Melnyk S, et al. : Classification and adaptive behavior prediction of children with autism spectrum disorder based upon multivariate data analysis of markers of oxidative stress and DNA methylation. PLoS Comput Biol 13:e1005385, 2017. [DOI] [PMC free article] [PubMed] [Google Scholar]
- 159.Li G, Lee O, Rabitz H: High efficiency classification of children with autism spectrum disorder. PLoS ONE 13:e0192867, 2018. [DOI] [PMC free article] [PubMed] [Google Scholar]
- 160.Frye RE, DeLaTorre R, Taylor HB, et al. : Metabolic effects of sapropterin treatment in autism spectrum disorder: A preliminary study. Transl Psychiatry 3:e237, 2013. [DOI] [PMC free article] [PubMed] [Google Scholar]
- 161.Frye RE, Slattery J, Delhey L, et al. : Folinic acid improves verbal communication in children with autism and language impairment: A randomized double-blind placebo-controlled trial. Mol Psychiatry 23:247–256, 2018. [DOI] [PMC free article] [PubMed] [Google Scholar]
- 162.James SJ, Melnyk S, Fuchs G, et al. : Efficacy of methylcobalamin and folinic acid treatment on glutathione redox status in children with autism. Am J Clin Nutr 89:425–430, 2009. [DOI] [PMC free article] [PubMed] [Google Scholar]
- 163.Howsmon DP, Vargason T, Rubin RA, et al. : Multivariate techniques enable a biochemical classification of children with autism spectrum disorder versus typically-developing peers: A comparison and validation study. Bioeng Transl Med 3:156–165, 2018. [DOI] [PMC free article] [PubMed] [Google Scholar]
- 164.Vargason T, Kruger U, Roth E, et al. : Comparison of three clinical trial treatments for autism spectrum disorder through multivariate analysis of changes in metabolic profiles and adaptive behavior. Front Cell Neurosci 12:503, 2018. [DOI] [PMC free article] [PubMed] [Google Scholar]
- 165.Zou M, Sun C, Liang S, et al. : Fisher discriminant analysis for classification of autism spectrum disorders based on folate-related metabolism markers. J Nutr Biochem 64:25–31, 2019. [DOI] [PubMed] [Google Scholar]
- 166.Abu-Akel A, Bousman C, Skafidas E, et al. : Mind the prevalence rate: Overestimating the clinical utility of psychiatric diagnostic classifiers. Psychol Med 1–3, 2018. [DOI] [PubMed] [Google Scholar]
- 167.Hertz-Picciotto Irva, Schmidt Rebecca J., Walker Cheryl K., et al. : A prospective study of environmental exposures and early biomarkers in autism spectrum disorder: Design, protocols, and preliminary data from the MARBLES study. Environ Health Perspect 126:117004, 2018. [DOI] [PMC free article] [PubMed] [Google Scholar]
- 168.Hollowood K, Melnyk S, Pavliv O, et al. : Maternal metabolic profile predicts high or low risk of an autism pregnancy outcome. Res Autism Spectr Disord 56:72–82, 2018. [DOI] [PMC free article] [PubMed] [Google Scholar]
- 169.Chen J, Xin K, Wei J, et al. : Lower maternal serum 25(OH) D in first trimester associated with higher autism risk in Chinese offspring. J Psychosom Res 89:98–101, 2016. [DOI] [PubMed] [Google Scholar]
- 170.Grossi E, Veggo F, Narzisi A, et al. : Pregnancy risk factors in autism: A pilot study with artificial neural networks. Pediatr Res 79:339–347, 2016. [DOI] [PubMed] [Google Scholar]
- 171.Bosl WJ, Tager-Flusberg H, Nelson CA: EEG analytics for early detection of autism spectrum disorder: A data-driven approach. Sci Rep 8:6828, 2018. [DOI] [PMC free article] [PubMed] [Google Scholar]
- 172.Ousley O, Cermak T: Autism spectrum disorder: Defining dimensions and subgroups. Curr Dev Disord Rep 1:20–28, 2014. [DOI] [PMC free article] [PubMed] [Google Scholar]
- 173.Macari SL, Campbell D, Gengoux GW, et al. : Predicting developmental status from 12 to 24 months in infants at risk for autism spectrum disorder: A preliminary report. J Autism Dev Disord 42:2636–2647, 2012. [DOI] [PMC free article] [PubMed] [Google Scholar]
- 174.Chawarska K, Shic F, Macari S, et al. : 18-month predictors of later outcomes in younger siblings of children with autism spectrum disorder: A Baby Siblings Research Consortium study. J Am Acad Child Adolesc Psychiatry 53:1317–1327.e1, 2014. [DOI] [PMC free article] [PubMed] [Google Scholar]
- 175.Bussu G, Jones EJH, Charman T, et al. : Prediction of autism at 3 years from behavioural and developmental measures in high-risk infants: A longitudinal cross-domain classifier analysis. J Autism Dev Disord 48:2418–2433, 2018. [DOI] [PMC free article] [PubMed] [Google Scholar]
- 176.Wall DP, Dally R, Luyster R, et al. : Use of artificial intelligence to shorten the behavioral diagnosis of autism. PLoS ONE 7:e43855, 2012. [DOI] [PMC free article] [PubMed] [Google Scholar]
- 177.Wall DP, Kosmicki J, DeLuca TF, et al. : Use of machine learning to shorten observation-based screening and diagnosis of autism. Transl Psychiatry 2:e100, 2012. [DOI] [PMC free article] [PubMed] [Google Scholar]
- 178.Duda M, Kosmicki JA, Wall DP: Testing the accuracy of an observation-based classifier for rapid detection of autism risk. Transl Psychiatry 4:e424, 2014. [DOI] [PMC free article] [PubMed] [Google Scholar]
- 179.Wilson CE, Happé F, Wheelwright SJ, et al. : The neuropsychology of male adults with high-functioning autism or Asperger syndrome. Autism Res 7:568–581, 2014. [DOI] [PMC free article] [PubMed] [Google Scholar]
- 180.Kosmicki JA, Sochat V, Duda M, et al. : Searching for a minimal set of behaviors for autism detection through feature selection-based machine learning. Transl Psychiatry 5:e514, 2015. [DOI] [PMC free article] [PubMed] [Google Scholar]
- 181.Bone D, Bishop SL, Black MP, et al. : Use of machine learning to improve autism screening and diagnostic instruments: Effectiveness, efficiency, and multi-instrument fusion. J Child Psychol Psychiatry 57:927–937, 2016. [DOI] [PMC free article] [PubMed] [Google Scholar]
- 182.Cohen IL, Liu X, Hudson M, et al. : Using the PDD Behavior Inventory as a Level 2 screener: A classification and regression trees analysis. J Autism Dev Disord 46:3006–3022, 2016. [DOI] [PubMed] [Google Scholar]
- 183.Levy S, Duda M, Haber N, et al. : Sparsifying machine learning models identify stable subsets of predictive features for behavioral detection of autism. Mol Autism 8:65, 2017. [DOI] [PMC free article] [PubMed] [Google Scholar]
- 184.Feczko E, Balba NM, Miranda-Dominguez O, et al. : Subtyping cognitive profiles in autism spectrum disorder using a functional random forest algorithm. Neuroimage 172:674–688, 2018. [DOI] [PMC free article] [PubMed] [Google Scholar]
- 185.Crippa A, Salvatore C, Perego P, et al. : Use of machine learning to identify children with autism and their motor abnormalities. J Autism Dev Disord 45:2146–2156, 2015. [DOI] [PubMed] [Google Scholar]
- 186.Li B, Sharma A, Meng J, et al. : Applying machine learning to identify autistic adults using imitation: An exploratory study. PLoS ONE 12:e0182652, 2017. [DOI] [PMC free article] [PubMed] [Google Scholar]
- 187.Stahl D, Pickles A, Elsabbagh M, et al. : Novel machine learning methods for ERP analysis: A validation from research on infants at risk for autism. Dev Neuropsychol 37:274–298, 2012. [DOI] [PubMed] [Google Scholar]
- 188.Fujioka T, Inohara K, Okamoto Y, et al. : Gazefinder as a clinical supplementary tool for discriminating between autism spectrum disorder and typical development in male adolescents and adults. Mol Autism 7:19, 2016. [DOI] [PMC free article] [PubMed] [Google Scholar]
- 189.Liu W, Li M, Yi L: Identifying children with autism spectrum disorder based on their face processing abnormality: A machine learning framework. Autism Res 9:888–898, 2016. [DOI] [PubMed] [Google Scholar]
- 190.Frazier TW, Klingemier EW, Parikh S, et al. : Development and validation of objective and quantitative eye tracking–based measures of autism risk and symptom levels. J Am Acad Child Adolesc Psychiatry 57:858–866, 2018. [DOI] [PMC free article] [PubMed] [Google Scholar]
- 191.Wan G, Kong X, Sun B, et al. : Applying eye tracking to identify autism spectrum disorder in children. J Autism Dev Disord 49:209–215, 2019. [DOI] [PubMed] [Google Scholar]
- 192.Ecker C, Rocha-Rego V, Johnston P, et al. : Investigating the predictive value of whole-brain structural MR scans in autism: A pattern classification approach. Neuroimage 49:44–56, 2010. [DOI] [PubMed] [Google Scholar]
- 193.Ingalhalikar M, Parker D, Bloy L, et al. : Diffusion based abnormality markers of pathology: Toward learned diagnostic prediction of ASD. Neuroimage 57:918–927, 2011. [DOI] [PMC free article] [PubMed] [Google Scholar]
- 194.Wee C-Y, Wang L, Shi F, et al. : Diagnosis of autism spectrum disorders using regional and interregional morphological features. Hum Brain Mapp 35:3414–3430, 2014. [DOI] [PMC free article] [PubMed] [Google Scholar]
- 195.Gori I, Giuliano A, Muratori F, et al. : Gray matter alterations in young children with autism spectrum disorders: Comparing morphometry at the voxel and regional level. J Neuroimaging 25:866–874, 2015. [DOI] [PubMed] [Google Scholar]
- 196.Jin Y, Wee C-Y, Shi F, et al. : Identification of infants at high-risk for autism spectrum disorder using multiparameter multiscale white matter connectivity networks. Hum Brain Mapp 36:4880–4896, 2015. [DOI] [PMC free article] [PubMed] [Google Scholar]
- 197.Hazlett HC, Gu H, Munsell BC, et al. : Early brain development in infants at high risk for autism spectrum disorder. Nature 542:348–351, 2017. [DOI] [PMC free article] [PubMed] [Google Scholar]
- 198.Shen MD, Kim SH, McKinstry RC, et al. : Increased extra-axial cerebrospinal fluid in high-risk infants who later develop autism. Biol Psychiatry 82:186–193, 2017. [DOI] [PMC free article] [PubMed] [Google Scholar]
- 199.Deshpande G, Libero L, Sreenivasan KR, et al. : Identification of neural connectivity signatures of autism using machine learning. Front Hum Neurosci 7:670, 2013. [DOI] [PMC free article] [PubMed] [Google Scholar]
- 200.Uddin LQ, Supekar K, Lynch CJ, et al. : Salience network–based classification and prediction of symptom severity in children with autism. JAMA Psychiatry 70:869–879, 2013. [DOI] [PMC free article] [PubMed] [Google Scholar]
- 201.Plitt M, Barnes KA, Martin A: Functional connectivity classification of autism identifies highly predictive brain features but falls short of biomarker standards. Neuroimage Clin 7:359–366, 2015. [DOI] [PMC free article] [PubMed] [Google Scholar]
- 202.Yahata N, Morimoto J, Hashimoto R, et al. : A small number of abnormal brain connections predicts adult autism spectrum disorder. Nat Commun 7:11254, 2016. [DOI] [PMC free article] [PubMed] [Google Scholar]
- 203.Emerson RW, Adams C, Nishino T, et al. : Functional neuroimaging of high-risk 6-month-old infants predicts a diagnosis of autism at 24 months of age. Sci Transl Med 9:eaag2882, 2017. [DOI] [PMC free article] [PubMed] [Google Scholar]
- 204.Zhou Y, Yu F, Duong T: Multiparametric MRI characterization and prediction in autism spectrum disorder using graph theory and machine learning. PLoS ONE 9:e90405, 2014. [DOI] [PMC free article] [PubMed] [Google Scholar]
- 205.Iidaka T: Resting state functional magnetic resonance imaging and neural network classified autism and control. Cortex 63:55–67, 2015. [DOI] [PubMed] [Google Scholar]
- 206.Kam T-E, Suk H-I, Lee S-W: Multiple functional networks modeling for autism spectrum disorder diagnosis. Hum Brain Mapp 38:5804–5821, 2017. [DOI] [PMC free article] [PubMed] [Google Scholar]
- 207.Sadeghi M, Khosrowabadi R, Bakouie F, et al. : Screening of autism based on task-free fMRI using graph theoretical approach. Psychiatry Res Neuroimaging 263:48–56, 2017. [DOI] [PubMed] [Google Scholar]
- 208.Syed MA, Yang Z, Hu XP, et al. : Investigating brain connectomic alterations in autism using the reproducibility of independent components derived from resting state functional MRI data. Front Neurosci 11:459, 2017. [DOI] [PMC free article] [PubMed] [Google Scholar]
- 209.Bi X, Wang Y, Shu Q, et al. : Classification of autism spectrum disorder using random support vector machine cluster. Front Genet 9:18, 2018. [DOI] [PMC free article] [PubMed] [Google Scholar]
- 210.Heinsfeld AS, Franco AR, Craddock RC, et al. : Identification of autism spectrum disorder using deep learning and the ABIDE dataset. Neuroimage Clin 17:16–23, 2018. [DOI] [PMC free article] [PubMed] [Google Scholar]
- 211.Kong Y, Gao J, Xu Y, et al. : Classification of autism spectrum disorder by combining brain connectivity and deep neural network classifier. Neurocomputing 324:63–68, 2019. [Google Scholar]
- 212.Bosl W, Tierney A, Tager-Flusberg H, et al. : EEG complexity as a biomarker for autism spectrum disorder risk. BMC Med 9:18, 2011. [DOI] [PMC free article] [PubMed] [Google Scholar]
- 213.Duffy FH, Als H: A stable pattern of EEG spectral coherence distinguishes children with autism from neuro-typical controls - a large case control study. BMC Med 10:64, 2012. [DOI] [PMC free article] [PubMed] [Google Scholar]
- 214.Khan S, Gramfort A, Shetty NR, et al. : Local and long-range functional connectivity is reduced in concert in autism spectrum disorders. PNAS 110:3107–3112, 2013. [DOI] [PMC free article] [PubMed] [Google Scholar]
- 215.Jamal W, Das S, Oprescu I-A, et al. : Classification of autism spectrum disorder using supervised learning of brain connectivity measures extracted from synchrostates. J Neural Eng 11:046019, 2014. [DOI] [PubMed] [Google Scholar]
- 216.Khan S, Michmizos K, Tommerdahl M, et al. : Somatosensory cortex functional connectivity abnormalities in autism show opposite trends, depending on direction and spatial scale. Brain 138:1394–1409, 2015. [DOI] [PMC free article] [PubMed] [Google Scholar]
- 217.Khan S, Hashmi JA, Mamashli F, et al. : Altered onset response dynamics in somatosensory processing in autism spectrum disorder. Front Neurosci 10:255, 2016. [DOI] [PMC free article] [PubMed] [Google Scholar]
- 218.Glatt SJ, Tsuang MT, Winn M, et al. : Blood-based gene expression signatures of infants and toddlers with autism. J Am Acad Child Adolesc Psychiatry 51:934–944.e2, 2012. [DOI] [PMC free article] [PubMed] [Google Scholar]
- 219.Kong SW, Collins CD, Shimizu-Motohashi Y, et al. : Characteristics and predictive value of blood transcriptome signature in males with autism spectrum disorders. PLoS ONE 7:e49475, 2012. [DOI] [PMC free article] [PubMed] [Google Scholar]
- 220.Hu VW, Lai Y: Developing a predictive gene classifier for autism spectrum disorders based upon differential gene expression profiles of phenotypic subgroups. N Am J Med Sci 6:107–116, 2013. [DOI] [PMC free article] [PubMed] [Google Scholar]
- 221.Latkowski T, Osowski S: Computerized system for recognition of autism on the basis of gene expression microarray data. Comput Biol Med 56:82–88, 2015. [DOI] [PubMed] [Google Scholar]
- 222.Pramparo T, Pierce K, Lombardo MV, et al. : Prediction of autism by translation and immune/inflammation coexpressed genes in toddlers from pediatric community practices. JAMA Psychiatry 72:386–394, 2015. [DOI] [PubMed] [Google Scholar]
- 223.Guan J, Yang E, Yang J, et al. : Exploiting aberrant mRNA expression in autism for gene discovery and diagnosis. Hum Genet 135:797–811, 2016. [DOI] [PubMed] [Google Scholar]
- 224.Nazeen S, Palmer NP, Berger B, et al. : Integrative analysis of genetic data sets reveals a shared innate immune component in autism spectrum disorder and its co-morbidities. Genome Biol 17:228, 2016. [DOI] [PMC free article] [PubMed] [Google Scholar]
- 225.Oh DH, Kim IB, Kim SH, et al. : Predicting autism spectrum disorder using blood-based gene expression signatures and machine learning. Clin Psychopharmacol Neurosci 15:47–52, 2017. [DOI] [PMC free article] [PubMed] [Google Scholar]
- 226.Mundalil Vasu M, Anitha A, Thanseem I, et al. : Serum microRNA profiles in children with autism. Mol Autism 5:40, 2014. [DOI] [PMC free article] [PubMed] [Google Scholar]
- 227.Hicks SD, Ignacio C, Gentile K, et al. : Salivary miRNA profiles identify children with autism spectrum disorder, correlate with adaptive behavior, and implicate ASD candidate genes involved in neurodevelopment. BMC Pediatr 16:52, 2016. [DOI] [PMC free article] [PubMed] [Google Scholar]
- 228.Cirnigliaro M, Barbagallo C, Gulisano M, et al. : Expression and regulatory network analysis of miR-140–3p, a new potential serum biomarker for autism spectrum disorder. Front Mol Neurosci 10:250, 2017. [DOI] [PMC free article] [PubMed] [Google Scholar]
- 229.Momeni N, Bergquist J, Brudin L, et al. : A novel blood-based biomarker for detection of autism spectrum disorders. Transl Psychiatry 2:e91, 2012. [DOI] [PMC free article] [PubMed] [Google Scholar]
- 230.West PR, Amaral DG, Bais P, et al. : Metabolomics as a tool for discovery of biomarkers of autism spectrum disorder in the blood plasma of children. PLoS ONE 9:e112445, 2014. [DOI] [PMC free article] [PubMed] [Google Scholar]
- 231.Wang H, Liang S, Wang M, et al. : Potential serum biomarkers from a metabolomics study of autism. J Psychiatry Neurosci 41:27–37, 2016. [DOI] [PMC free article] [PubMed] [Google Scholar]
- 232.Anwar A, Abruzzo PM, Pasha S, et al. : Advanced glycation endproducts, dityrosine and arginine transporter dysfunction in autism - a source of biomarkers for clinical diagnosis. Mol Autism 9:3, 2018. [DOI] [PMC free article] [PubMed] [Google Scholar]
- 233.Barone R, Alaimo S, Messina M, et al. : A subset of patients with autism spectrum disorders show a distinctive metabolic profile by dried blood spot analyses. Front Psychiatry 9:636, 2018. [DOI] [PMC free article] [PubMed] [Google Scholar]
- 234.Chen Y-N, Du H-Y, Shi Z-Y, et al. : Serum proteomic profiling for autism using magnetic bead-assisted matrix-assisted laser desorption ionization time-of-flight mass spectrometry: A pilot study. World J Pediatr 14:233–237, 2018. [DOI] [PubMed] [Google Scholar]
- 235.Shen L, Zhang K, Feng C, et al. : iTRAQ-based proteomic analysis reveals protein profile in plasma from children with autism. Proteomics Clin Appl 12:1700085, 2018. [DOI] [PubMed] [Google Scholar]
- 236.Smith AM, King JJ, West PR, et al. : Amino acid dysregulation metabotypes: Potential biomarkers for diagnosis and individualized treatment for subtypes of autism spectrum disorder. Biol Psychiatry 85:345–354, 2019. [DOI] [PMC free article] [PubMed] [Google Scholar]
- 237.Nadal-Desbarats L, Aïdoud N, Emond P, et al. : Combined 1 H-NMR and 1 H– 13 C HSQC-NMR to improve urinary screening in autism spectrum disorders. Analyst 139:3460–3468, 2014. [DOI] [PubMed] [Google Scholar]
- 238.Diémé B, Mavel S, Blasco H, et al. : Metabolomics study of urine in autism spectrum disorders using a multiplatform analytical methodology. J Proteome Res 14:5273–5282, 2015. [DOI] [PubMed] [Google Scholar]
- 239.Gevi F, Zolla L, Gabriele S, et al. : Urinary metabolomics of young Italian autistic children supports abnormal tryptophan and purine metabolism. Mol Autism 7:47, 2016. [DOI] [PMC free article] [PubMed] [Google Scholar]
- 240.Kang D-W, Ilhan ZE, Isern NG, et al. : Differences in fecal microbial metabolites and microbiota of children with autism spectrum disorders. Anaerobe 49:121–131, 2018. [DOI] [PubMed] [Google Scholar]