

Abstract
Conventional strategies for drug metabolite identification employ a combination of liquid chromatography-mass spectrometry (LC-MS), which offers higher throughput but provides limited structural information, and nuclear magnetic resonance spectroscopy, which can achieve the most definitive identification but lacks throughput. Ion mobility-mass spectrometry (IM-MS) is a rapid, two-dimensional analysis that separates ions on the basis of their gas-phase size and shape (reflected by collision cross section, CCS) and their mass-to-charge (m/z) ratios, respectively. The rapid nature of IM separation combined with the structural information provided by CCS make IM-MS a promising technique for obtaining more structural information of drug metabolites without sacrificing analytical throughput. Here, we present an in vitro-biosynthesis coupled with IM-MS strategy for rapid generation and analysis of drug metabolites. Drug metabolites were generated in vitro using pooled subcellular fractions derived from human liver and analyzed using a rapid flow injection-IM-MS method. We measured CCS values for 19 parent drugs and their 37 metabolites generated in vitro (78 values in total), representing a wide variety of metabolic modifications. Post-IM fragmentation and computational modeling were used to support metabolite identifications and explore the structural characteristics driving behaviors observed in IM separation. Overall, we found the effects of metabolic modifications on the gas-phase structures of the metabolites to be highly dependent upon the structural characteristics of the parent compounds and the specific position of the modification. This in vitro-biosynthesis coupled with rapid IM-MS analysis workflow represents a promising platform for rapid and high-confidence identification of drug metabolites, applicable at a large scale.
Graphical Abstract
Introduction
Drug metabolism is the process by which drugs are chemically modified by human body, generally facilitating their removal from the body.1 This process is carried out by a diverse assortment of drug-metabolizing enzymes, most of which catalyze oxidation of or conjugation of specific chemical groups to target compounds.2–4 Specifically, drug metabolism reactions include Phase-I metabolism, such as oxidation and dealkylation catalyzed by cytochrome P450s (CYPs), and Phase-II metabolism, such as conjugation with glutathione and glucuronic acid catalyzed by glutathione S-transferases (GSTs) and UDP-glucuronosyltransferase (UGTs), respectively (Figure 1A). Understanding whether and how drugs are metabolized is a critical component of the drug development process, since metabolism is often an important determinant of drug clearance and metabolites may exert unexpected bioactivities or toxicities.5,6 Mass spectrometry (MS) has played an essential role in advancing the field of drug metabolism. Over the past decade, liquid chromatography (LC)-coupled with tandem MS and high-resolution MS, in combination with various scan modes and post-acquisition data processing methods, has greatly increased the specificity and sensitivity of drug metabolite identification.7,8 However, the throughput of such identification processes is low as LC separation could be lengthy and/or post-acquisition processing methods need to be customized for each drug. Furthermore, structural information obtained from LC-MS analysis is limited. Definitive assignment of metabolite structure can be achieved using nuclear magnetic resonance (NMR) spectroscopy, but this technique requires large amount of materials and thus is both costly and low throughput.8 There exists, therefore, a demand for techniques that allow enhanced structural characterization of drug metabolites without sacrificing analytical throughput.
Figure 1.
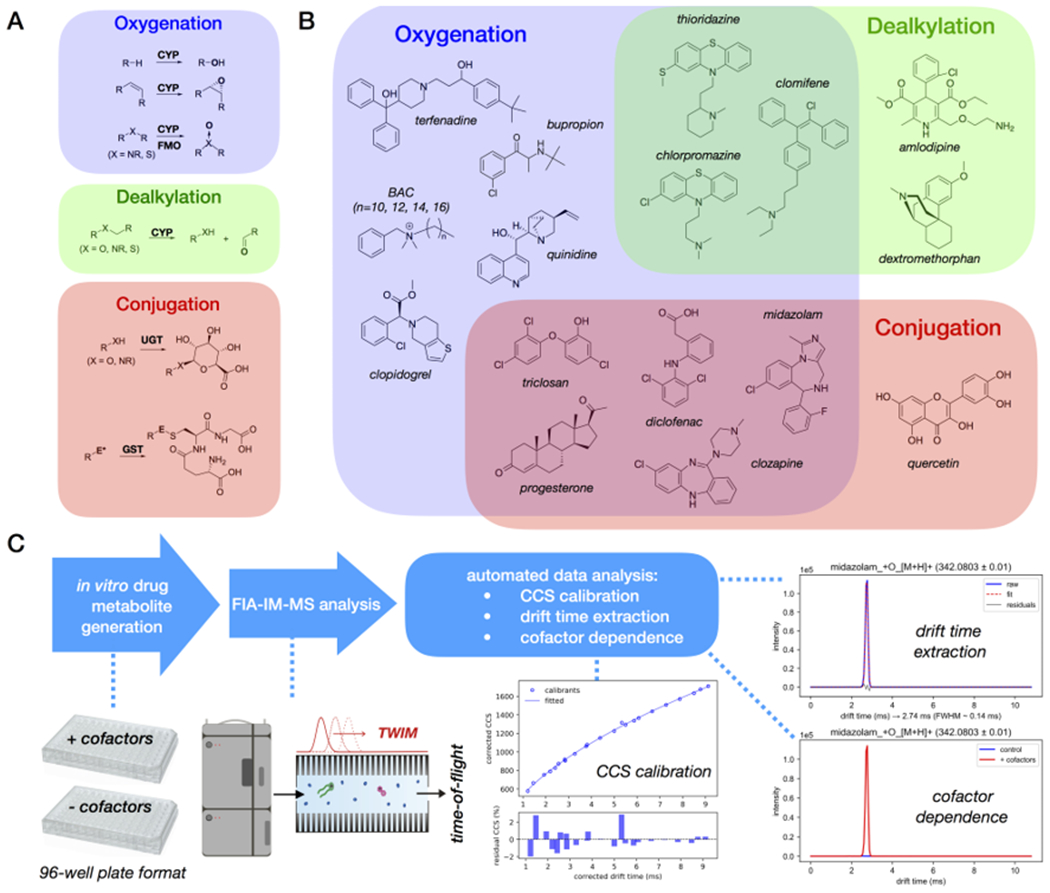
(A) Representative reactions of Phase-I and Phase-II drug metabolism; E* designates electrophile. (B) Selected drug compounds for this study that can undergo Phase-I and/or Phase-II transformations; (C) Overall workflow of this work, from in vitro-metabolite generation, FIA-IM-MS analysis, to automated data processing.
Ion mobility (IM) spectrometry is a rapid gas-phase separation technique based on the size and shape of the analytes in the gas phase, which is orthogonal to the polarity-based LC separations.9–13 In IM separation, ions are driven through a neutral buffer gas under the influence of either a static electric field (as in drift tube IM, DTIM) or a dynamic electric field (as in traveling wave IM, TWIM),14,15 where they are differentially slowed down due to their interactions with the gas molecules. The mobility of an ion in IM separation is determined by its collision cross section (CCS), a unique physical property determined by its size, shape, and long-range and short-range interactions with the drift gas in the gas-phase. When IM is coupled to MS (IM-MS), a two-dimensional separation on the basis of CCS-to-charge ratio and mass-to-charge ratio (m/z) is achieved. Due to the rapid nature of the IM separation (millisecond scale), IM-MS can be coupled with traditional liquid chromatography to provide three-dimensional separation (LC-IM-MS) without sacrificing the throughput. Furthermore, the orthogonal separation by IM-MS over traditional MS can enable the abbreviation, or even complete omission at times, of LC separations to enhance the analytical throughput.
In recent years, several groups, including us, have measured CCS values for large collections of compounds, covering a diverse range of biomolecule and small molecule chemical space.16–27 These studies have revealed a number of characteristic trends in CCS vs. mass associated with specific chemical classes, attributable to the intrinsic relationship between CCS and chemical structure. More specifically, for a given m/z, compounds from different chemical classes display distinct ranges of CCS values, owing to different degrees of structural compactness among different molecular classes. Different classes of biomolecules (e.g. lipids, peptides, carbohydrates) follow distinct trends and only occupy narrow regions of the CCS-mass two-dimensional conformational space.16 Our recent report on 1440 CCS values of 1425 drug and drug-like small molecules suggested that overall, these molecules cover a much broader range of molecular space than individual biomolecular classes, but a specific class of drugs, such as various classes of antimicrobials, corticosteroids, ion channel blockers, etc., tend to occupy a tight and distinct region in the CCS-mass conformational space.20 A few studies have been carried out to characterize drug metabolites by IM-MS, such as products of aromatic hydroxylation and glucuronidation,28–30 which demonstrated some advantages of IM-MS in differentiating positional isomers. However, no systemic study has been conducted to explore the structural characteristics of drug metabolites and how various chemical modifications change the gas-phase behavior of the metabolites relative to their corresponding parent compounds in IM-MS analysis.
Studying drug metabolites systematically and at a large scale is challenging because there are limited number of commercially available standards of drug metabolites and the cost is high for such standards. To overcome this challenge, we first developed a biosynthesis system that can effectively generate both Phase-I and Phase-II metabolites from parent drugs using subcellular fractions of human liver. We then measured CCS values of 19 parent drugs and their 37 metabolites generated in vitro (78 values total) using rapid flow injection analysis (FIA) coupled with a TWIM-MS system with CCS being calibrated with a combination of poly-DL-alanines (PolyAla) and drug-like molecules. Post-IM fragmentation and computational modeling were used to validate the identities of the metabolites and to rationalize unusual behaviors observed in IM separation and multimodal CCS distributions of certain metabolites.
EXPERIMENTAL SECTION
Materials
Poly-DL-alanine, acetaminophen, betaine hydrochloride, and drug standards were purchased from Sigma-Aldrich (St. Louis, MO). Drug CCS calibrants were obtained as descried previously.20 Human liver microsomes (HLM) and S9-fraction (S9) pooled from 100 male and 100 female individuals were purchased from Sekisui XenoTech (Kansas City, KS). C12, C14, and C16 benzalkonium chlorides (BACs) and the synthetic precursors necessary for synthesizing additional BACs and ω-hydroxy BAC analogs were purchased from Sigma-Aldrich (St. Louis, MO). Synthesis of BACs and their ω-OH analogs is detailed in the Supporting Information.
In Vitro Drug Metabolite Generation
Drug metabolites were generated in vitro using pooled human liver microsomes (HLM) and S9-fraction (S9) in a 96-well plate format. First, a mixture of HLM and S9 (0.2 mg protein/mL, each) containing GSH (5 mM) and MgCl2 (5 mM) was prepared in buffer (0.1 M phosphate, pH 7.4). Alamethicin was added at 0.01 mg/mL, and the mixture incubated on ice for 20 min. 90 μL of the pre-treated HLM/S9 mixture was added to each well of a 96-well plate, then 0.5 μL of each drug stock (10 mM in DMSO) were added to duplicate wells. An activation mixture containing 10 mM NADPH and 50 mM UDPGA was prepared in the same buffer. The plate was heated to 37 °C in a water bath, then reactions were initiated by addition of 10 μL of activation mixture (or buffer for cofactor-free controls). The reactions proceeded at 37 °C for 40 min, then the plate was removed from the water bath and cooled on ice for 10 min. Subsequently, 100 μL of ice-cold acetonitrile containing MS internal standards was added to each well to quench the reactions and precipitate proteins. The plate was centrifuged at 3500 x G for 15 min at 4 °C to pellet precipitated proteins, and the supernatant was transferred to a fresh 96-well plate for IM-MS analysis.
Ion Mobility-Mass Spectrometry Analysis
TWIM-MS analysis was performed on a Waters Synapt G2-Si mass spectrometer (Waters Corp., Milford, MA) equipped with an electrospray ionization (ESI) source using nitrogen as the drift gas. ESI conditions are detailed in the Supporting Information. Mass calibration was performed using sodium formate for the range of m/z 50–1200. IM separations were performed at a traveling wave velocity of 500 m/s and height of 40 V. For post-IM fragmentation analyses, collision energy was added to the transfer region using a ramp from 30 to 50 V. FIA was performed with a Waters Acquity FTN UPLC connected to the ESI source of the IM-MS. Sample injections (5 μL) were made using a 0.3 mL/min flow of 50% water with 0.1% formic acid / 50% methanol with 0.1% formic acid. Data was acquired for 0.5 min with a 1s scan time over m/z 50–1200, which resulted in approximately 14 scans across the eluted peak from FIA. The full 96-well plate was analyzed on three separate days over two months.
TWIM CCS Calibration
Drift tube CCS values in nitrogen (DTIMCCSN2) for a series of singly-charged polyalanines (n = 2-14) and a mixture of drug-like compounds were used for calibration of TWIM drift times into CCS (TWIMCCSN2), as described previously for the measurement of CCS values of 1425 drugs.20 Briefly, arrival time distributions (ATDs) for polyalanines and drug-like CCS calibrants were extracted from the raw data using accurate mass with a window of ± 0.01 Da and a CCS calibration curve was constructed from reference data in an automated fashion using a Python script developed in-house (see Data Analysis below). Drift times for each calibrant were obtained as the mean from a least-squares fit of a Gaussian function on the ATD. Drift times were corrected for mass-dependent flight time to give the corrected drift times (td’) and reference CCS values were corrected for ion charge state (Z) and reduced mass with the drift gas to give the corrected CCS (CCS’).31 A calibration curve was generated by fitting these corrected values to a function of the form CCS’ = A(td’+t0)B, where A, t0 and B were the fitted parameters.32,33 The CCS calibration curve displaying randomly distributed fit residuals with a maximal absolute error < 3% was considered acceptable.
Data Analysis
IM-MS data analysis was performed using a Python script developed in-house. The data analysis script uses the Waters MassLynx SDK (https://interface.waters.com/masslynx/) to directly extract ATDs from raw data files using accurate mass and a selection window of ± 0.01 Da. A list of accurate masses for ions of parent compounds and their expected metabolites was compiled by manual inspection of the raw data and consulting the literature for commonly observed human hepatic metabolites. Using this list of masses, ATDs were extracted for all parent compounds and observed metabolites, and drift time of each compound was obtained automatically by least-squares fitting of the Gaussian function to each ATD. All ATDs along with Gaussian fits and residuals were manually inspected for sufficient intensity (> 1e3), appropriate peak width (FWHM < 1 ms), and lack or presence of multimodality. For each observed metabolite, ATDs were extracted from both cofactor-containing reaction samples and cofactor-free controls to establish cofactor-dependent formation as confirmation of the presence of a metabolite.
Computational modeling and CCS calculation
Parent compounds or metabolites displaying unusual or complex IM behavior were further investigated using computational modeling and CCS calculation. Compound SMILES structures were obtained from PubChem and manually modified to reflect the relevant ESI adduct and metabolic modifications (if present). OpenBabel34 was used to generate initial 3D structures from the SMILES strings (using the MMFF9435 force field) and produce inputs for further structural optimization in the semi-empirical molecular modeling software MOPAC.36 Initial structures were further optimized in MOPAC in two steps: a rough optimization, followed by a more precise optimization and calculation of thermodynamic properties. The roughly optimized structure was used as the input for a dynamic reaction coordinate (DRC) simulation in MOPAC: a time-resolved simulation in which the system is allowed to exchange kinetic and potential energy while conserving total internal energy (akin to traditional molecular dynamics). For each DRC simulation, excess kinetic energy was added to the system such that the total internal energy (potential + kinetic) of the system matched the vibrational energy predicted for the simulation temperature (310 K) from the thermodynamic calculations. The resulting simulation trajectories were analyzed using tools from the GROMACS software suite.37 For each trajectory, plots of various system characteristics (potential energy, radius of gyration, etc.) vs. simulation time were generated and visually inspected for aberrant behavior. For each compound, initial structure generation was repeated 6 times, resulting in slightly different starting structures and therefore distinct simulation results. All replicate simulation trajectories for a single compound were concatenated and all sampled conformations were used for clustering analysis using GROMACS. Central structures from each of the fitted clusters were assigned weights on the basis of cluster size, and structures with weights contributing at least 3% to the overall average were carried through to CCS calculation. Theoretical CCS values in N2 were calculated for each central structure using a trajectory method in MobCal modified for using N2 as a drift gas.38,39 Each CCS calculation was performed in triplicate using different pseudo-random number generator seeds and an averaged CCS value was obtained for each conformation. The final theoretical CCS value for each compound was obtained as the weighted average of all relevant clustered structures and their calculated CCS values, using the previously determined weights.
RESULTS AND DISCUSSION
In Vitro Biosynthesis of Drug Metabolites and Measurement of their CCS
We first aim to develop an in vitro biosynthesis system to generate metabolites with diverse structures from a diverse range of drugs so that the effect of metabolic transformations on gas-phase structures of drugs can be systemically studied. Human liver fractions, such as S9 and microsomal fractions, are commonly used for in vitro drug metabolism studies. The S9 fractions contain the cytosol, which mainly contains GSTs, sulfotransferases, and other water-soluble enzymes, and microsomes, which mainly contain CYPs and UGTs. We used the drug, midazolam, as a probe molecule to optimize the in vitro system conditions. Midazolam is known to undergo mono and di-hydroxylation, direct glucuronidation, and consecutive hydroxylation/glucuronidation reactions, so it would be a good probe for both Phase-I and Phase-II reactions (Figure S1).40 We found that although the S9 fraction contains all the necessary drug-metabolizing enzymes, addition of a separate HLM fractions to the S9 fraction is needed to generate sufficient amounts of primary metabolites by CYPs for the formation of secondary metabolites by UGTs and GSTs. Alamethicin, a pore-forming polypeptide, was also added to the S9/HLM stock to enable access of the potential substrates to UGTs, which are located on the lumen side of microsomes.41 In order to represent the range of metabolic modifications, we chose 19 structurally diverse drug or drug-like compounds that readily undergo Phase-I and/or Phase-II drug metabolic reactions (Figure 1B). For each drug, the reactions were carried out with or without enzyme activating cofactors, such as NADPH (for CYPs) and UDPGA (for UGTs) so that enzyme-specific products can be identified. A workflow of this process and the subsequent steps is shown in Figure 1C.
Each reaction mixture was analyzed using a FIA-IM-MS method. TWIMCCSN2 values were calibrated using a mixture of polyalanines (n=2-14) and drug-like compounds with known DTIMCCSN2 values as described previously.20 37 metabolites were consistently observed from the 19 parent compounds. CCS values were obtained for all parent compounds and metabolites in triplicate, with high reproducibility (average of 0.3% inter-day RSD). Figure 2A summarizes the CCS vs. m/z values for all compounds and their metabolites, grouped by various routes of metabolism. The curve and shade in the background of the plot represents the power fit and the ± 10% range of the 1440 drug and drug-like CCS values we reported previously,20 which illustrates the conformational space of this set of compounds and their metabolites relative to the broad trend for drug-like compounds.
Figure 2.
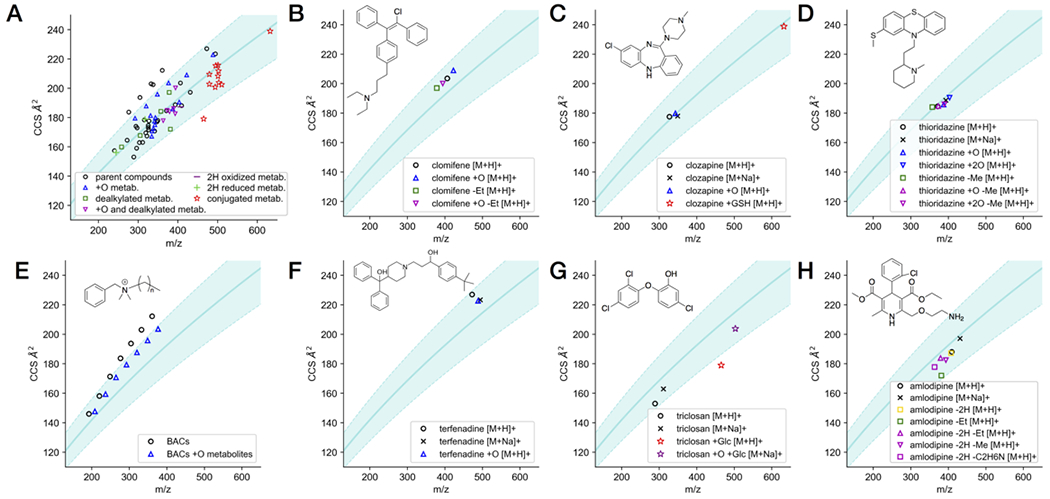
(A) IM-MS conformational space plot showing the 78 CCS values of 19 parent drugs and their 37 metabolites. (B-H) CCS values of the parent and metabolites of selected individual drugs in IM-MS plot. All data points represent the average of three measurements. The curve and shade in the background of the plot represents the power fit and the ± 10% range of the 1440 drug and drug-like CCS values we reported previously.20
Additionally, a dimensionless compaction factor (C) was calculated according to the following equation (Eq. 1) to quantify the relative structural compaction/expansion of metabolites relative to their corresponding parent compounds:
| Eq. 1 |
Eq. 1 is derived from the relationship between the masses of spheres having the same density and their areas, and is adapted from a similar analysis recently applied to studying the hydrophobicity of amino acids as it correlates to the packing efficiency of the amino acid oligomers.42 The dimensionless factor C describes deviation from ideal isotropic growth (with respect to CCS and mass changes due to metabolism), with C < 1 indicating the metabolite becomes less compact than the parent while C > 1 indicating the metabolite becomes more compact than the parent. Calculated compaction factors for all metabolites relative to their parent compounds are summarized in Table S1.
Considering all parent compounds and metabolites together, it is difficult to discern any characteristic global trends in CCS vs. m/z for specific routes of metabolism as most of the parent compounds and their +O metabolites and/or dealkylation metabolites occupy a relative tight space close to the center power-fit line. On the broad scale, conjugation products with glucuronic acid (GA) and glutathione (GSH) separate from Phase-I metabolites, mostly attributable to the large increase in mass.
However, closer examination of the trend of changes for individual compounds suggest that the conformational changes due to different routes of metabolism are dependent upon the structure of the parent compound. For compounds like clomifene, clozapine, and thioridazine (Figure 2B–D), primary metabolites from oxygenation or dealkylation reactions displayed relatively linearly increased or decreased CCS, corresponding to the change in mass imparted by the metabolic modification (e.g. oxygenated metabolites tended to have increased CCS coinciding with the increase in mass from the addition of oxygen). Furthermore, secondary metabolites formed from a combination of oxygenation and dealkylation reactions displayed CCS shifts corresponding to the net change in mass from the different modifications. These observations suggest that for some compounds, metabolic modifications do not significantly alter the gas-phase conformations of the parent compounds beyond the simple increase/decrease in size imparted by the metabolic modification itself. This conclusion is further supported by the fact that for most of these metabolites, compaction factor values tended to be very close to 1, indicating a similar gas-phase packing efficiency between parent and metabolites.
Unusual trends in CCS changes upon metabolism were observed for some lipid-like molecules, such as the series of BACs with alkyl chain lengths of 10, 12, 14 and 16 carbons and terfenadine. Oxygenated metabolites were observed in these reactions, and each had CCS values smaller than their parent compounds despite their increased mass. The compaction factors for each of these metabolites were all >1, indicating structural compaction in the metabolites relative to the parent compounds. A common CYP-mediated metabolic modification for compounds containing long alkyl chains in fatty acids is hydroxylation at the ω or ω-1 position.43 Indeed, we recently confirmed the formation of the ω and ω-1-hydroxyl-products as the major metabolites of these BACs.44 For the BACs, this would introduce a polar moiety at the opposite end of the positively charged quaternary ammonium group, leading to a potential intramolecular ion-dipole interaction that could explain the observed structural compaction of the gas-phase conformations of the metabolites relative to the parent compounds. Additionally, the magnitude of this effect increased with alkyl chain length, suggesting dependence on the flexibility of the alkyl chain. To further investigate this effect, a larger series of BACs with alkyl chain lengths ranging from 4 to 16 carbons and their corresponding ω-OH metabolites were synthesized and analyzed by IM-MS (Figure 2E). The parent BACs and their ω-OH metabolites occupied distinct trends in the CCS vs. m/z plot, with the metabolite trend falling below that of the parent compounds. While ω-OH derivatives of short chain BACs still increased relative to the parent compounds, the extent of increase is small relative to the power-fit trend line of the parent compounds. C8 BAC appears to be the turning point, where the CCSs of the metabolites become less than the matching parent compounds. Notably, the magnitude of the compaction factors increases with the chain length, consistent with the observed chain-length dependence of the structural compaction of the metabolites (Table S1).
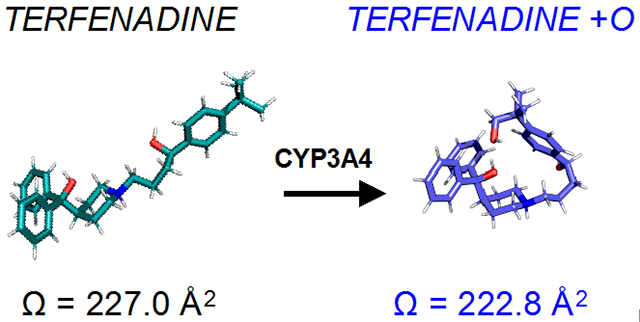
A similar trend to the BACs, though at a smaller magnitude, was also observed between terfenadine and its oxygenated metabolite (Figure 2F). The compaction of the +O metabolite relative to the parent compound is evident from the compaction factor of 1.042. Terfenadine has structural similarity to the BACs, being a somewhat linear, hydrophobic molecule with positive charge localized on one side. The introduction of a polar moiety at the opposite end of the molecule could allow for intramolecular interaction with the positive charge, similar to the ω-OH metabolites of BACs. Indeed, terfenadine is known to be hydroxylated at the tert-butyl group in hepatic metabolism (principally by CYP3A4),45 supporting this proposed mechanism of structural compaction. The decreases in CCS values of metabolites despite their added mass is counterintuitive to the expected relationship between mass and CCS, illustrating the complexity of conformational changes that can be induced by metabolic modifications.
The antibacterial agent triclosan is a small molecule containing three chlorine atoms, making it considerably dense in the gas phase relative to other drug-like small molecules (Figure 2G). Both the protonated species and sodiated adduct of the parent compound were observed, with the sodiated adduct displaying a larger CCS relative to its mass than the protonated species. A primary glucuronide metabolite was observed (triclosan +Glc), in addition to a secondary glucuronide metabolite putatively formed from an oxygenated primary metabolite (triclosan +O, +Glc). The primary glucuronide is more structurally compact for its mass than the secondary glucuronide, which is on the similar trend to the adducts of the parent compounds in the overall drug-like molecule CCS vs. m/z 2D plot. Indeed, the primary and secondary glucuronides have compaction factors of 1.174 and 1.102, respectively, indicating that relative to the parent compound, the primary glucuronide undergoes more structural compaction upon metabolism than the secondary glucuronide.
Amlodipine (Figure 2H) contains a central dihydropyridine ring that can undergo a two-electron oxidation to form the pyridine analog (amlodipine −2H). The CCS of the pyridine metabolite is not significantly different from the parent (compaction factor = 1.002), however, comparison of the desethylated metabolite (amlodipine -Et) to its pyridine analog (amlodipine −2H, -Et) reveals a distinct increase in CCS upon dehydrogenation (−2H). Indeed, comparing both the desethylated (-Et) metabolite and the −2H-Et (pyridine) metabolite to the parent compound, the compaction factors were 1.043 and 0.972, respectively, which quantitatively supports the large reduction in the compactness of the dehydrogenation metabolite. In other words, dehydrogenation of the dihydropyridine ring has no observable effect on the gas-phase conformation of the parent compound, but induces a dramatic increase in the size of the desethylated metabolite. This observation illustrates that even for similar or related compounds, the structural changes imparted by a given modification may differ significantly.
Post-Mobility Fragmentation to facilitate Metabolite Identification
A separate IM-MS analysis was performed on the reaction mixtures in which post-IM fragmentation was conducted to further validate the structures of the metabolites. For some compounds, the site of metabolic modification is known based on literature or apparent from the compound’s structure, such as for deethylation of clomifene (Figure S2D) or glucuronidation of diclofenac (Figure S2H) (see Supporting Information). Other compounds, however, contain multiple sites where metabolic modifications may occur, leading to potential positional isomers. Post-IM fragmentation could help differentiate such positional isomers. For example, Figure 3A shows the ATDs of dextromethorphan (DEX) and several fragments observed in post-IM fragmentation experiments, where all of the observed fragment ATDs align with that of the parent compound, supporting their assignment as fragments of DEX. DEX contains two methyl groups attached to heteroatoms (O and N), both of which can undergo dealkylation reactions.46 The metabolites resulting from either dealkylation are isobaric, and there is no indication of multiple metabolites being present based on the ATD of the demethylated metabolite of DEX (DEX -Me, Figure 3B). Of the several fragments of the parent DEX, three contained the O-methyl moiety but not the N-methyl moiety, making these fragments diagnostic of demethylation at the O position. Indeed, the demethylated analogues of these three fragments were observed from the DEX -Me metabolite, confirming the identity of this metabolite as the O-desmethyl product. This observation is consistent with the previous report that the dominant hepatic metabolite of DEX is the loss of the O-methyl group over the N-methyl group.46 This example illustrates the degree of specificity in identification of metabolites that can be reached by combining fragmentation data with structural information from IM-MS analyses. Additional fragmentation ATDs of other parent compounds and metabolites can be found in the Supporting Information.
Figure 3.
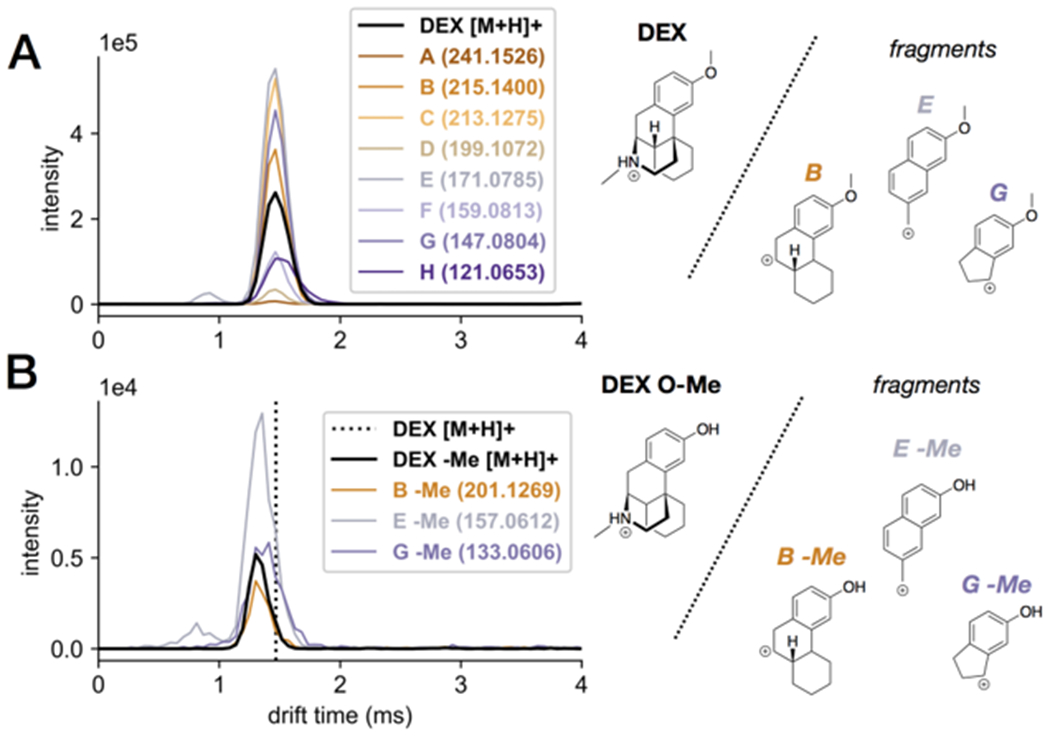
Extracted ATDs for the fragments of (A) the parent dextromethorphan (DEX) and (B) its demethylated metabolite (DEX O-Me), confirming that the metabolite is the Odemethylated product, instead of the N-demethylated product. Parent drift time is shown as a dotted line in B.
Computational Modeling of Unusual Behavior of BACs, Terfenadine, and Their Oxygenated Metabolites in IM-MS
A chain length-dependent decrease in CCS upon ω-hydroxylation was observed for a series of BACs with alkyl chain lengths of 4 to 16 carbons (Figure 2E). Using computational modeling and theoretical CCS calculation with MobCal as described in Experimental Section, we examined the structural basis for this observed gas-phase compaction upon ω-hydroxylation of BACs. Figure 4A summarizes the theoretical CCS for BACs and their +O metabolites, in comparison with their measured values. The theoretical CCS for the parent compounds show excellent agreement with their corresponding measured values, with the exception of C16 BAC, for which the theoretical CCS is significantly lower than the measured value. The modeled CCS values for the +O metabolites are systematically underestimated relative to the experimental values, with an average error of −3.7%. Plotting the theoretical CCS vs. the experimental values (Figure 4B) more clearly illustrates the agreement between the theoretical and experimental CCS for the parent compounds, as well as the systematic underestimation in the calculated CCS values for the metabolites. The alkyl chain length-dependent decrease in CCS upon ω-hydroxylation becomes particularly evident by plotting the ratio of parent to +O metabolite CCS, which displays a steady increase with alkyl chain length for the measured values (Figure 4C). Despite the systematic errors in the modeled CCS of the +O metabolites, the overall trend in this ratio is recapitulated, albeit with greater variance. These data indicate that the theoretical simulations sufficiently captured the structural characteristics of BACs and their ω-OH metabolites to reproduce the observed structural compaction occurring upon ω-hydroxylation.
Figure 4.
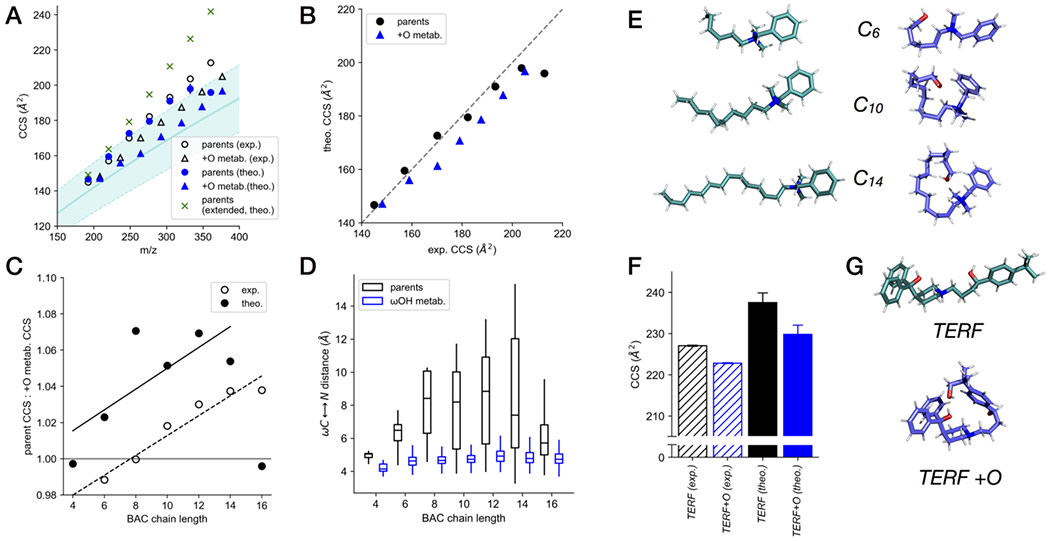
Comparison of experimental measurements and computational modeling of benzalkonium chlorides (BACs) and terfenadine with their hydroxylated metabolites. (A) Comparison of trends of experimental CCS values of the parent BACs and their metabolites with the trends of the theoretical CCS values in the CCS-m/z plot. (B) Correlation between experimental and theoretical CCS values for parent BACs and their metabolites. (C) Comparison of the ratios of parent/metabolite CCS values obtained experimentally and computationally. (D) Distribution of ω-C-to-N distances of all sampled conformations of BACs and their metabolites. (E) Representative gas-phase conformations of BACs and their metabolites with alkyl chain lengths of C6, C10, and C14 from computational sampling. (F) Comparison of experimental and computational CCS values for terfenadine (TERF) and its hydroxylated metabolite. (G) Representative gas-phase conformations of terfenadine and its metabolite from computational sampling.
In order to gain insight on what structural characteristics were driving the observed trends in CCS, all of the simulations used to produce the theoretical CCS values were analyzed for the distributions of intramolecular distance between the nitrogen of the quaternary ammonium moiety and the ω-carbon of the alkyl chain (Figure 4D,E). These distance distributions reflect the overall degree of intramolecular interaction between the two ends of these molecules, which in turn influences their structural compactness and therefore CCS. For the parent BACs, the distance distributions generally increased in spread and magnitude with increasing alkyl chain length, with the exception of C16 BAC, which displayed a much more compact distribution with a lower magnitude for its size relative to the other BACs. Comparing this result to trend in theoretical CCS for fully extended BAC conformers (Figure 4A), it seems that the computational error for C16 BAC is likely due limitations in the semi-empirical molecular modeling theory used here to represent systems beyond a certain size. Overall, these results indicate that the observed increase in CCS with alkyl chain length for the parent BACs can be justified by their increasingly dynamic alkyl chains, and thus having a lower degree of overall structural compactness. In contrast, the +O metabolites displayed very compact distance distributions that are nearly invariant with alkyl chain length, indicating a strong propensity toward intramolecular interaction between the ω-OH group and the quaternary ammonium group. The consequence of this interaction is a structural compaction that leads to a lower trend than the parent compounds in the CCS-mass 2D plot.
However, we note that the observed trend of the theoretical parent CCSs is significantly lower than the trend of the CCS calculated from the fully extended parent conformations, which indicates that the parent compounds, being highly dynamic, adopt intermediately compact conformations between the fully extended conformations and those of the metabolites. It is also possible that the addition of the highly polarized OH in the metabolites could increase the potential for long-range interactions with the drift gas relative to the parent BACs, making apparent CCS for the metabolites larger than one may expect on the basis of size alone. While both factors could contribute to the smaller differences between the trendlines of the measured CCS values of the parents and the metabolites than one might expect from the fully extended and the fully compact conformations, the intermediate compactness of the parent compounds appear to the major factor.
Computational modeling was also performed on terfenadine and its oxygenated metabolite, since these displayed similar behavior to the BACs and their ω-OH metabolites. The theoretical CCS values for terfenadine and its hydroxylated metabolite were both larger than the experimental values (Figure 4F), however, the relationship between the parent and metabolite CCS values was recapitulated: the metabolite displayed slightly lower CCS than the parent, indicating some degree of structural compaction due to the metabolic modification. Representative structures for the parent and hydroxylated metabolite (Figure 4G) support the notion that an intramolecular polar-polar interaction involving the hydroxyl group drives structural compaction in the metabolite.
Taken together, these results demonstrate that metabolic modifications can impact the structural characteristics of certain compounds with considerable magnitude when intramolecular interactions are either introduced or disrupted. Furthermore, these structural effects may not be strictly mediated by the immediate chemical environment of the metabolic modification, but could be through longer-range intramolecular interactions with the modifications.
Bimodal ATD of Quercetin Glucuronides
Both the protonated and sodiated adducts of quercetin glucuronide (quercetin +Glc) displayed bimodal ATDs (Figure 5A,B). A bimodal ATD for a single mass in IM-MS generally arises from conformational heterogeneity or the presence of structurally distinct isomers, either constitutional (e.g. different sites of protonation or sodiation)20,47,48 or diastereomeric. The observation of similar behavior between the protonated and sodiated adducts suggests the presence of more than one constitutional isomer, rather than conformational heterogeneity or different ionization sites since these effects are likely to present differently between different types of MS adducts. Quercetin contains five hydroxyl groups (Figure 5B), and glucuronidation has been observed to occur at all but the 5-position in hepatic metabolism, with the 7-position being the dominant regioisomer.49 Therefore, it is likely that the two peaks observed in the ATD for quercetin glucuronide correspond to a mixture of these regioisomers.
Figure 5.
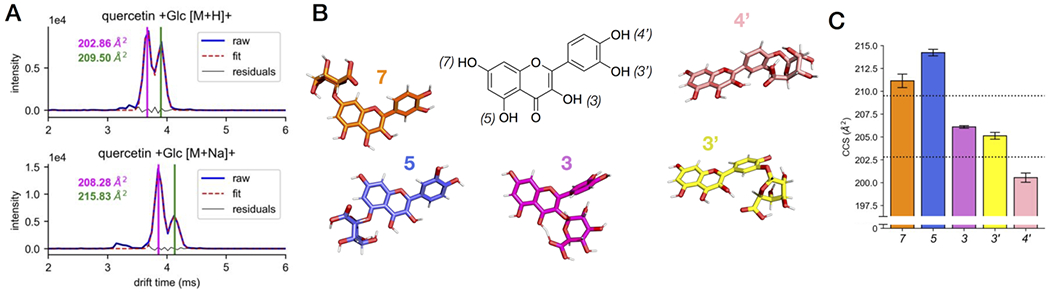
Bimodal distributions of glucuronides of quercetin. (A) ATDs of protonated species and sodiated adducts of quercetin glucuronides. (B) Gas-phase conformations of regioisomers of quercetin glucuronides. (C) Computational CCS values (bar graph) of different regioisomers of quercetin glucuronides in comparison with experimental values (dotted line).
Post-IM fragmentation was not informative on the positional isomers as no cross-ring or between-ring fragments were observed. Therefore, we used computational modeling and CCS calculation to gain some insight on the gas-phase conformations of both protonated and sodiated adducts of all regioisomers of quercetin glucuronides (including the 5-glucuronide). In contrast to the BACs, which had many energetically similar conformations due to their structural flexibility and dynamic nature, the glucuronides of quercetin have less conformational flexibility and are thus appropriately represented by single minimum energy structures obtained from a large ensemble of conformations. The lowest energy conformations for all protonated glucuronide isomers are presented in Figure 5B, and their modeled CCS values are summarized in Figure 5C. Comparison of the theoretical CCS values with those obtained from the two peaks observed experimentally (dotted lines) suggest that the smaller CCS value has contributions from the 3-, 3’-, and/or 4’-glucuronides, while the larger CCS value can be attributed to the 7-glucuronide, since the 5-glucuronide is not expected to be formed in hepatic metabolism. The same results were observed from computational modeling of the sodiated adducts and are detailed in the Supporting Information. These results demonstrate that for some compounds, insights from IM data and computational modeling can be used to elucidate the contributions of various regioisomers to a sample and guide further inquiry.
CONCLUSION
We have developed an integrated strategy for in vitro biosynthesis of drug metabolites and subsequent structural analysis by IM-MS, which can be scaled up for high-throughput workflows. Using this strategy, we generated and analyzed metabolites of a diverse panel of drugs and found that characteristic changes in CCS associated with drug metabolism are dependent upon both the type and position of the chemical modification and the structural characteristics of the parent compound. The same chemical modification can have drastically different effects on the gas-phase conformations (or CCS) of different parent compounds, likewise, different chemical modifications on the same parent compound can have distinct effects. We propose that such relationship between CCS, metabolic modifications, and parent compound structures could be leveraged for the prediction of IM behavior of unknown metabolites using data-driven approaches, e.g., machine learning. We anticipate the experimental platform described herein will facilitate the characterization of drug metabolites in a large scale, which would provide a large drug metabolite CCS database that can be used to build such predictive model, which could significantly increase the efficiency and throughput of early-stage drug metabolite identification and structural elucidation during drug development.
Supplementary Material
ACKNOWLEDGMENT
We thank Prof. Matthew F. Bush at the UW and Prof. Michael T. Bowers at UC-Santa Barbara for helpful discussion on the computational modeling approaches. We also thank the constructive suggestions made by the reviewers, particularly reviewer 2 for suggesting interpreting gas-phase compaction in a more rigorous, quantitative way using the compaction factor.
Funding Sources
This work was supported by the Drug Metabolism Transport and Pharmacogenetics Research Fund of the School of Pharmacy at the University of Washington (UW), UW CoMotion Innovation Gap Fund, and startup funds from the Department of Medicinal Chemistry to L.X. L.X. and D.H.R. also acknowledge supports from Nation Institutes of Health grants (R01HD092659 and R01GM127579). R.P.S. is supported by the Environmental Pathology and Toxicology Training Grant funded by National Institutes of Health (T32ES007032).
Footnotes
Supporting Information
The Supporting Information is available free of charge on the ACS Publications website.
Synthesis of benzalkonium chlorides and metabolites; computational modeling workflow; computational modeling of sodiated adduct of quercetin glucuronide; CCS values of all drugs and metabolites; fragmentation data (PDF)
REFERENCES
- (1).Silverman RB; Holladay MW The Organic Chemistry of Drug Design and Drug Action; Elsevier Inc., 2014. [Google Scholar]
- (2).Zanger UM; Schwab M Pharmacol Ther 2013, 138, 103–141. [DOI] [PubMed] [Google Scholar]
- (3).Board PG; Menon D Biochim. Biophys. Acta 2013, 1830, 3267–3288. [DOI] [PubMed] [Google Scholar]
- (4).Tukey RH; Strassburg CP Annu. Rev. Pharmacol. Toxicol 2000, 40, 581–616. [DOI] [PubMed] [Google Scholar]
- (5).Fura A; Shu YZ; Zhu M; Hanson RL; Roongta V; Humphreys WG J. Med. Chem 2004, 47, 4339–4351. [DOI] [PubMed] [Google Scholar]
- (6).Park BK; Kitteringham NR; Maggs JL; Pirmohamed M; Williams DP Annu. Rev. Pharmacol. Toxicol 2005, 45, 177–202. [DOI] [PubMed] [Google Scholar]
- (7).Wen B; Zhu M Drug Metab. Rev 2015, 47, 71–87. [DOI] [PubMed] [Google Scholar]
- (8).Prakash C; Shaffer CL; Nedderman A Mass Spectrom. Rev 2007, 26, 340–369. [DOI] [PubMed] [Google Scholar]
- (9).Clemmer DE; Hudgins RR; Jarrold MF J. Am. Chem. Soc 1995, 117, 10141–10142. [Google Scholar]
- (10).von Helden G; Wyttenbach T; Bowers MT Science 1995, 267, 1483–1485. [DOI] [PubMed] [Google Scholar]
- (11).McLean JA; Ruotolo BT; Gillig KJ; Russell DH Int. J. Mass Spectrom 2005, 240, 301–315. [Google Scholar]
- (12).Kanu AB; Dwivedi P; Tam M; Matz L; Hill HH Jr. J. Mass Spectrom 2008, 43, 1–22. [DOI] [PubMed] [Google Scholar]
- (13).Fenn LS; Kliman M; Mahsut A; Zhao SR; McLean JA Anal. Bioanal. Chem 2009, 394, 235–244. [DOI] [PMC free article] [PubMed] [Google Scholar]
- (14).Pringle SD; Giles K; Wildgoose JL; Williams JP; Slade SE; Thalassinos K; Bateman RH; Bowers MT; Scrivens JH Int. J. Mass Spectrom 2007, 261, 1–12. [Google Scholar]
- (15).May JC; McLean JA Anal. Chem 2015, 87, 1422–1436. [DOI] [PMC free article] [PubMed] [Google Scholar]
- (16).May JC; Goodwin CR; Lareau NM; Leaptrot KL; Morris CB; Kurulugama RT; Mordehai A; Klein C; Barry W; Darland E; Overney G; Imatani K; Stafford GC; Fjeldsted JC; McLean JA Anal. Chem 2014, 86, 2107–2116. [DOI] [PMC free article] [PubMed] [Google Scholar]
- (17).Paglia G; Williams JP; Menikarachchi L; Thompson JW; Tyldesley-Worster R; Halldorsson S; Rolfsson O; Moseley A; Grant D; Langridge J; Palsson BO; Astarita G Anal. Chem 2014, 86, 3985–3993. [DOI] [PMC free article] [PubMed] [Google Scholar]
- (18).Zhou Z; Shen X; Tu J; Zhu ZJ Anal. Chem 2016, 88, 11084–11091. [DOI] [PubMed] [Google Scholar]
- (19).Hines K; Herron J; Xu LJ Lipid Res. 2017, 58, 809–819. [DOI] [PMC free article] [PubMed] [Google Scholar]
- (20).Hines KM; Ross DH; Davidson KL; Bush MF; Xu L Anal. Chem 2017, 89, 9023–9030. [DOI] [PMC free article] [PubMed] [Google Scholar]
- (21).Hines KM; Waalkes A; Penewit K; Holmes EA; Salipante SJ; Werth BJ; Xu L mSphere 2017, 2, e00492–00417. [DOI] [PMC free article] [PubMed] [Google Scholar]
- (22).Hines KM; Xu L Chem Phys Lipids 2019, 219, 15–22. [DOI] [PMC free article] [PubMed] [Google Scholar]
- (23).Zheng X; Aly NA; Zhou Y; Dupuis KT; Bilbao A; Paurus VL; Orton DJ; Wilson R; Payne SH; Smith RD; Baker ES Chem Sci 2017, 8, 7724–7736. [DOI] [PMC free article] [PubMed] [Google Scholar]
- (24).Zhou Z; Xiong X; Zhu ZJ Bioinformatics 2017, 33, 2235–2237. [DOI] [PubMed] [Google Scholar]
- (25).Bijlsma L; Bade R; Celma A; Mullin L; Cleland G; Stead S; Hernandez F; Sancho JV Anal. Chem 2017, 89, 6583–6589. [DOI] [PubMed] [Google Scholar]
- (26).Nichols CM; May JC; Sherrod SD; McLean JA Analyst 2018, 143, 1556–1559. [DOI] [PMC free article] [PubMed] [Google Scholar]
- (27).Picache JA; Rose BS; Balinski A; Leaptrot KL; Sherrod SD; May JC; McLean JA Chem Sci 2019, 10, 983–993. [DOI] [PMC free article] [PubMed] [Google Scholar]
- (28).Shimizu A; Ohe T; Chiba M Drug Metab Dispos 2012, 40, 1456–1459. [DOI] [PubMed] [Google Scholar]
- (29).Shimizu A; Chiba M Drug Metab Dispos 2013, 41, 1295–1299. [DOI] [PubMed] [Google Scholar]
- (30).Reading E; Munoz-Muriedas J; Roberts AD; Dear GJ; Robinson CV; Beaumont C Anal. Chem 2016, 88, 2273–2280. [DOI] [PubMed] [Google Scholar]
- (31).Ruotolo BT; Benesch JL; Sandercock AM; Hyung SJ; Robinson CV Nat. Protoc 2008, 3, 1139–1152. [DOI] [PubMed] [Google Scholar]
- (32).Hines KM; May JC; McLean JA; Xu L Anal. Chem 2016, 88, 7329–7336. [DOI] [PMC free article] [PubMed] [Google Scholar]
- (33).Forsythe JG; Petrov AS; Walker CA; Allen SJ; Pellissier JS; Bush MF; Hud NV; Fernandez FM Analyst 2015, 140, 6853–6861. [DOI] [PubMed] [Google Scholar]
- (34).O’Boyle NM; Banck M; James CA; Morley C; Vandermeersch T; Hutchison GR J Cheminform 2011, 3, 33. [DOI] [PMC free article] [PubMed] [Google Scholar]
- (35).Halgren TA Journal of Computational Chemistry 1996, 17, 490–519. [Google Scholar]
- (36).Stewart JJ J Comput Aided Mol Des 1990, 4, 1–105. [DOI] [PubMed] [Google Scholar]
- (37).Abraham MJ; Murtola T; Schulz R; Páll S; Smith JC; Hess B; Lindahl E SoftwareX 2015, 1.-, 19–25. [Google Scholar]
- (38).Shvartsburg AA; Jarrold MF Chem Phys Lett 1996, 261, 86–91. [Google Scholar]
- (39).Campuzano I; Bush MF; Robinson CV; Beaumont C; Richardson K; Kim H; Kim HI Anal. Chem 2012, 84, 1026–1033. [DOI] [PubMed] [Google Scholar]
- (40).Klieber S; Hugla S; Ngo R; Arabeyre-Fabre C; Meunier V; Sadoun F; Fedeli O; Rival M; Bourrie M; Guillou F; Maurel P; Fabre G Drug Metab Dispos 2008, 36, 851–862. [DOI] [PubMed] [Google Scholar]
- (41).Walsky RL; Bauman JN; Bourcier K; Giddens G; Lapham K; Negahban A; Ryder TF; Obach RS; Hyland R; Goosen TC Drug Metab Dispos 2012, 40, 1051–1065. [DOI] [PubMed] [Google Scholar]
- (42).Hoffmann W; Langenhan J; Huhmann S; Moschner J; Chang R; Accorsi M; Seo J; Rademann J; Meijer G; Koksch B; Bowers MT; von Helden G; Pagel K Angew Chem Int Ed Engl 2019, 58, 8216–8220. [DOI] [PubMed] [Google Scholar]
- (43).Hardwick JP Biochem. Pharmacol 2008, 75, 2263–2275. [DOI] [PubMed] [Google Scholar]
- (44).Seguin R; Herron J; Dempsey J; Lopez V; Xu L 2019, Under revision. [Google Scholar]
- (45).Ling KH; Leeson GA; Burmaster SD; Hook RH; Reith MK; Cheng LK Drug Metab Dispos 1995, 23, 631–636. [PubMed] [Google Scholar]
- (46).Kerry NL; Somogyi AA; Bochner F; Mikus G Br J Clin Pharmacol 1994, 38, 243–248. [DOI] [PMC free article] [PubMed] [Google Scholar]
- (47).Lalli PM; Iglesias BA; Toma HE; de Sa GF; Daroda RJ; Silva Filho JC; Szulejko JE; Araki K; Eberlin MN J. Mass Spectrom 2012, 47, 712–719. [DOI] [PubMed] [Google Scholar]
- (48).Lapthorn C; Dines TJ; Chowdhry BZ; Perkins GL; Pullen FS Rapid Commun. Mass Spectrom 2013, 27, 2399–2410. [DOI] [PubMed] [Google Scholar]
- (49).Boersma MG; van der Woude H; Bogaards J; Boeren S; Vervoort J; Cnubben NH; van Iersel ML; van Bladeren PJ; Rietjens IM Chem. Res. Toxicol 2002, 15, 662–670. [DOI] [PubMed] [Google Scholar]
Associated Data
This section collects any data citations, data availability statements, or supplementary materials included in this article.