

SUMMARY
Cell proliferation and inflammation are two metabolically demanding biological processes. How these competing processes are selectively executed in the same cell remains unknown. Here, we report that the enzyme carbamoyl-phosphate synthetase, aspartyl transcarbamoylase, and dihydroorotase (CAD) deamidates the RelA subunit of NF-κB in cancer cells to promote aerobic glycolysis and fuel cell proliferation in tumorigenesis. This post-translational modification switches RelA function from mediating the expression of NF-κB-responsive genes to that of glycolytic enzymes, thus shunting the cell’s inflammatory response to aerobic glycolysis. Further, we profiled diverse human cancer cell lines and found that high CAD expression and a subset of RELA mutations correlated with RelA deamidation. And by use of inhibitors of key glycolytic enzymes, we validated the pivotal role of RelA deamidation in tumorigenesis of cancer cell lines. This work illuminates a mechanism by which protein deamidation selectively specifies gene expression and consequent biological processes.
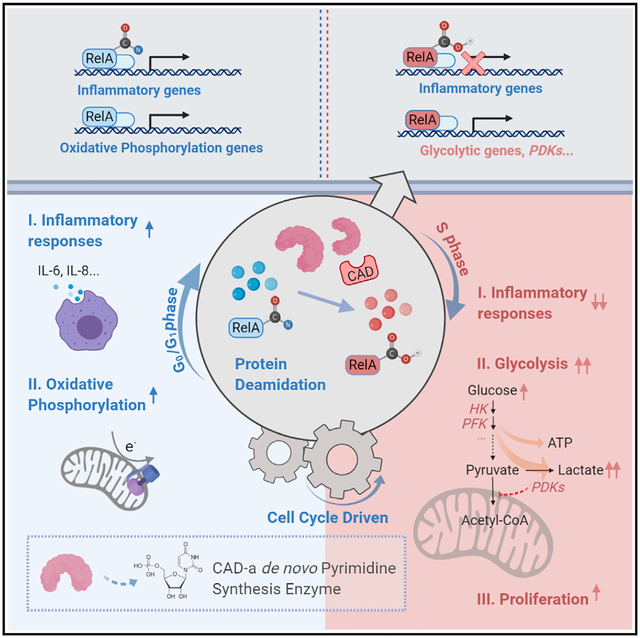
Graphical Abstract
In Brief
CAD, the rate-limiting enzyme of the de novo pyrimidine synthesis pathway, deamidates RelA to promote aerobic glycolysis and cell proliferation at the expense of NF-κB-dependent gene expression and an inflammatory response.
INTRODUCTION
Inflammation is a protective response to external insults such as tissue damage or microbial infection. Activated nuclear factor-κB (NF-κB) upregulates the expression of genes underpinning a broad spectrum of biological processes such as an immune response, inflammation, development, apoptosis, and tumorigenesis (Zhang et al., 2017). In response to microbial infection, pattern recognition receptors (PRRs) detect microbe-associated molecular patterns to induce the expression of inflammatory genes (Takeuchi and Akira, 2010). Localized in distinct anatomic cellular compartments, PRRs dimerize with their cognate adaptor molecules to activate two closely related kinases, the IKK and IKK-related TBK-1 complexes. IKK and TBK-1 activate NF-κB and interferon regulatory factors (IRFs), respectively (Seth et al., 2006). Activated NF-κB, along with other transcription factors, drives the gene expression of immune function, establishing an antiviral inflammatory response that culminates in cytokine production (Sen and Baltimore, 1986).
Central to core cellular biological processes is the metabolic status of a cell. Mounting an inflammatory response and cell proliferation are two metabolically demanding processes that require dedicated metabolic machinery. Recent studies suggest the emerging theme that upon infection, a cell funnels its metabolic fluxes to support the initiation and sustenance of an inflammatory response that constitutes primarily a transcriptional pathway, resulting in the production of cytokines and chemokines (Mogilenko et al., 2019). In proliferating cells, metabolism is directed to support biomass accumulation in preparation for cell division (Locasale and Cantley, 2011). Although the coordination between metabolism and inflammation or metabolism and cell proliferation is well appreciated, these processes are primarily investigated in immune cells and cancer cells in isolation, respectively. How inflammation, such as that triggered by innate immune activation, and cell proliferation are coordinated in the same cell remains elusive. For example, it has been observed that immune activation is often suppressed, particularly in S phase of cycling cells, yet how such cell cycle regulation is achieved is unclear (Ankers et al., 2016).
Glutamine amidotransferases (GATs) constitute a family of metabolic enzymes that extract nitrogen from glutamine to synthesize nucleotides, amino acids, glycoproteins, and the enzyme cofactor nicotinamide adenine dinucleotide (NAD), which are building blocks for cell growth and proliferation (Massière and Badet-Denisot, 1998). In mammals, the trifunctional enzyme carbamoyl-phosphate synthetase, aspartyl-transcarbamoylase, and dihydroorotase (CAD) catalyzes the first three sequential steps of de novo pyrimidine synthesis (Shoaf and Jones, 1973). The first step of carbamoyl-phosphate synthesis is rate limiting for de novo pyrimidine synthesis, endowing CAD with diverse regulatory mechanisms. In response to growth factor stimulation, CAD is phosphorylated and activated by MAP (mitogen-activated protein) kinase (Graves et al., 2000) and S6K (Ben-Sahra et al., 2013; Robitaille et al., 2013) to promote pyrimidine synthesis and facilitate subsequent cell proliferation. Our understanding of the role of CAD is limited to its enzymatic activity in catalyzing de novo pyrimidine synthesis. We reported here that CAD functions as a RelA deamidase. RelA (also known as p65) is the transcriptionally active subunit of the prototype NF-κB dimer containing RelA and p50 (Nolan et al., 1991; Sen and Baltimore, 1986). Activated NF-κB transactivates the expression of a large array of inflammatory genes, including cytokines and chemokines. We found that CAD deamidates RelA and diminishes NF-κB activation in a cell cycle-dependent manner. Moreover, CAD-deamidated RelA promotes aerobic glycolysis and inhibits mitochondrial oxidative phosphorylation via activating the expression of key glycolytic enzymes to fuel cell proliferation. This study describes a nonmetabolic activity (i.e., deamidation) of a nucleotide-synthesizing enzyme in promoting aerobic glycolysis and suppressing inflammation, and one that underpins the proliferation and tumorigenesis of diverse human cancer cell lines.
RESULTS
Identification of CAD as a Negative Regulator of NF-κB Activation
Our previous studies showed that a cellular GAT deamidates RIG-I to avoid antiviral cytokine production, suggesting that GATs can regulate fundamental biological processes via deamidation. To test this idea, we performed a focused screen to assess NF-κB activation when cellular GATs were depleted with short hairpin (sh)RNA as we recently reported (Li et al., 2019). The human genome encodes 11 GATs participating in the synthesis of nucleotides, amino acids, glycoproteins, and NAD (Figure S1A). The screen demonstrated that knockdown of CAD significantly increased NF-κB activation by reporter as-says (Figure 1A). Further analysis indicated that depletion of CAD consistently increased the expression of NF-κB-responsive genes, such as IL-8, in 293T cells in response to Sendai virus (SeV) infection or TNF-α treatment (Figures 1B and S1B). Similar results were obtained in CAD-depleted human THP-1 monocytes and BJ5 fibroblasts upon SeV infection (Figures 1C and S1C). Furthermore, we generated CAD knockout 293T cells via CRISPR-Cas9 and found that CAD knockout resulted in greater ICAM1 and IL-8 gene expression versus wild-type cells (Figure 1D). The greater gene expression correlated with elevated cytokine production in THP-1 cells upon SeV infection or lipopolysaccharide (LPS) treatment (Figure 1E). Finally, CAD depletion in colorectal HCT116 cells also led to greater IL-8 gene expression in response to Salmonella typhimurium infection (Figures S1D and S1E) versus normal cells. Interestingly, Salmonella typhimurium infection modestly induced the expression of CAD, but not that of the other GATs, in HCT116 cells (Figure S1F).
Figure 1. CAD Negatively Regulates NF-κB Activation.
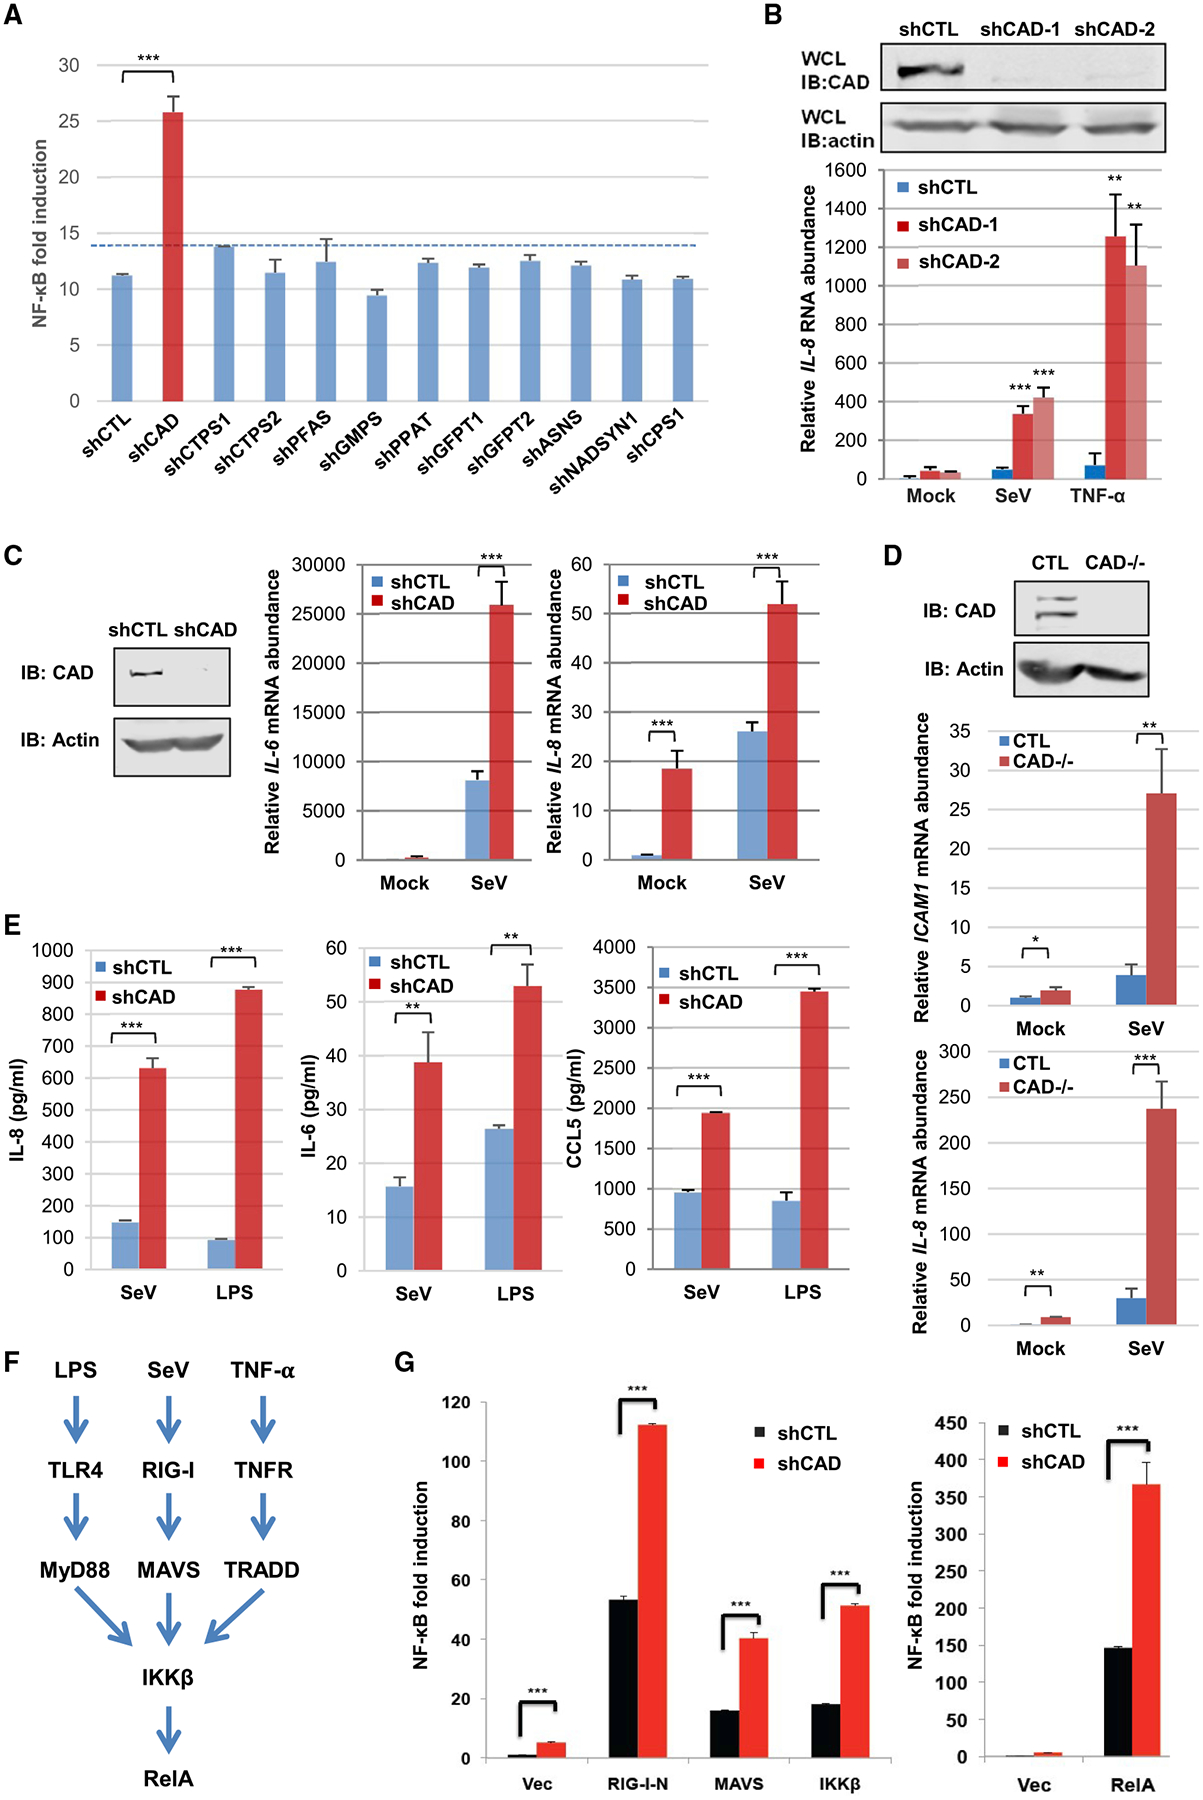
(A) NF-κB luciferase reporter assay from 293T cells with shRNA targeting indicated cellular glutamine amidotransferases upon Sendai virus (SeV) infection. CTPS: CTP synthetase; PFAS: phosphoribosylformylglycinamidine synthetase; GMPS: GMP synthetase; GFPT: glutamine fructose-6-phosphate amidotransferase; ASNS: Asparagine synthetase; NADSYN1: NAD synthetase 1; CPS1: carbamoyl-phosphate synthetase; and PPAT: phosphoribosyl pyrophosphate amidotransferase. CAD, please see text.
(B) Immunoblots of CAD from whole cell lysates (WCLs) of 293T cells depleted for CAD by two different shRNAs (shCAD-1 and shCAD-2) versus a control shRNA (shCTL) (top) and IL-8 abundance in 293T cells depleted for CAD and after infection with SeV or treatment with TNF-α (bottom).
(C) Immunoblots of CAD from WCLs of human THP-1 monocytes (left panels) and IL-6 or IL-8 abundance in control (shCTL) or CAD-depleted (shCAD) THP-1 cells after SeV infection.
(D) Immunoblots of CAD from WCLs of CTL and CAD-knockout 293T cells (top panels) and ICAM1 or IL-8 abundance in CTL and CAD-knockout 293T cells infected with SeV (bottom panels).
(E) IL-8, IL-6, and CCL5 concentration from THP-1 monocytes treated with SeV or lipopolysaccharide (LPS).
(F) Diagram of the NF-κB pathway that can be triggered by distinct stimuli, which converge at the IKK kinase complex.
(G) NF-κB luciferase reporter assay from 293T cells transfected with indicated components of the RIG-I-RelA pathway.
Data are presented as mean ± SD. Significance was calculated using two-tailed, unpaired Student’s t test. **p < 0.01; ***p < 0.001; ns, non-significant. See also Figures S1 and S2.
To determine the specificity of CAD in NF-κB activation, we found that CAD depletion did not significantly increase the IFN-β reporter expression (Figure S1G). Though CAD knockdown may reduce intracellular pyrimidine concentration, supplementing CAD-depleted HCT116 cells with uridine had no effect on NF-κB activation in 293T cells (Figure S1H). Furthermore, knockdown of UMP synthetase (UMPS), an enzyme downstream of CAD, had no effect on SeV-induced NF-κB activation (Figure S1I). These results show that CAD negatively regulates NF-κB activation independent of pyrimi-dine synthesis.
CAD Deamidates RelA to Inhibit NF-κB Activation
CAD demonstrates an inhibitory effect on NF-κB activation that can be triggered by multiple physiological stimuli, which engage distinct cellular receptors and converge at the downstream IKK kinase (Figure 1F), suggesting that CAD acts on a component(s) of the shared portion of the NF-κB pathway. Indeed, CAD knockdown resulted in greater NF-κB activation induced by the ectopic expression of all components of the RIG-I-NF-κB pathway, including the constitutively active N-terminal caspase activation and recruitment domains (CARDs) (RIG-I-N), MAVS, IKKβ, and RelA (Figure 1G), whereas overexpression of CAD inhibited NF-κB activation (Figures S1J and S2A). These results suggest that CAD likely targets RelA to diminish NF-κB activation.
To test whether the glutamine amidotransferase activity is important for the inhibition of NF-κB activation, we created an enzyme-deficient mutant of CAD in which the active site, cysteine 252 (C252), was replaced with serine, designated CAD-C/S. Reporter assays indicated that wild-type CAD potently, while CADC/S mutant marginally, diminished NF-κB activation in a dose-dependent manner (Figure 2A). We then examined whether CAD interacted with RelA and found that endogenous CAD and RelA were readily co-precipitated in 293T cells (Figure S2B). By contrast, CAD failed to co-precipitate with RelB and cRel (Figure S2C). The residual p50 precipitated by CAD is likely due to the RelA subunit that interacts with both p50 and CAD. Mutational analysis indicated that the N-terminal domain (amino acids 1 to 311) of RelA is sufficient and necessary to interact with CAD in transfected 293T cells (Figure S2D).
Figure 2. CAD Deamidates RelA to Inactivate NF-κB.
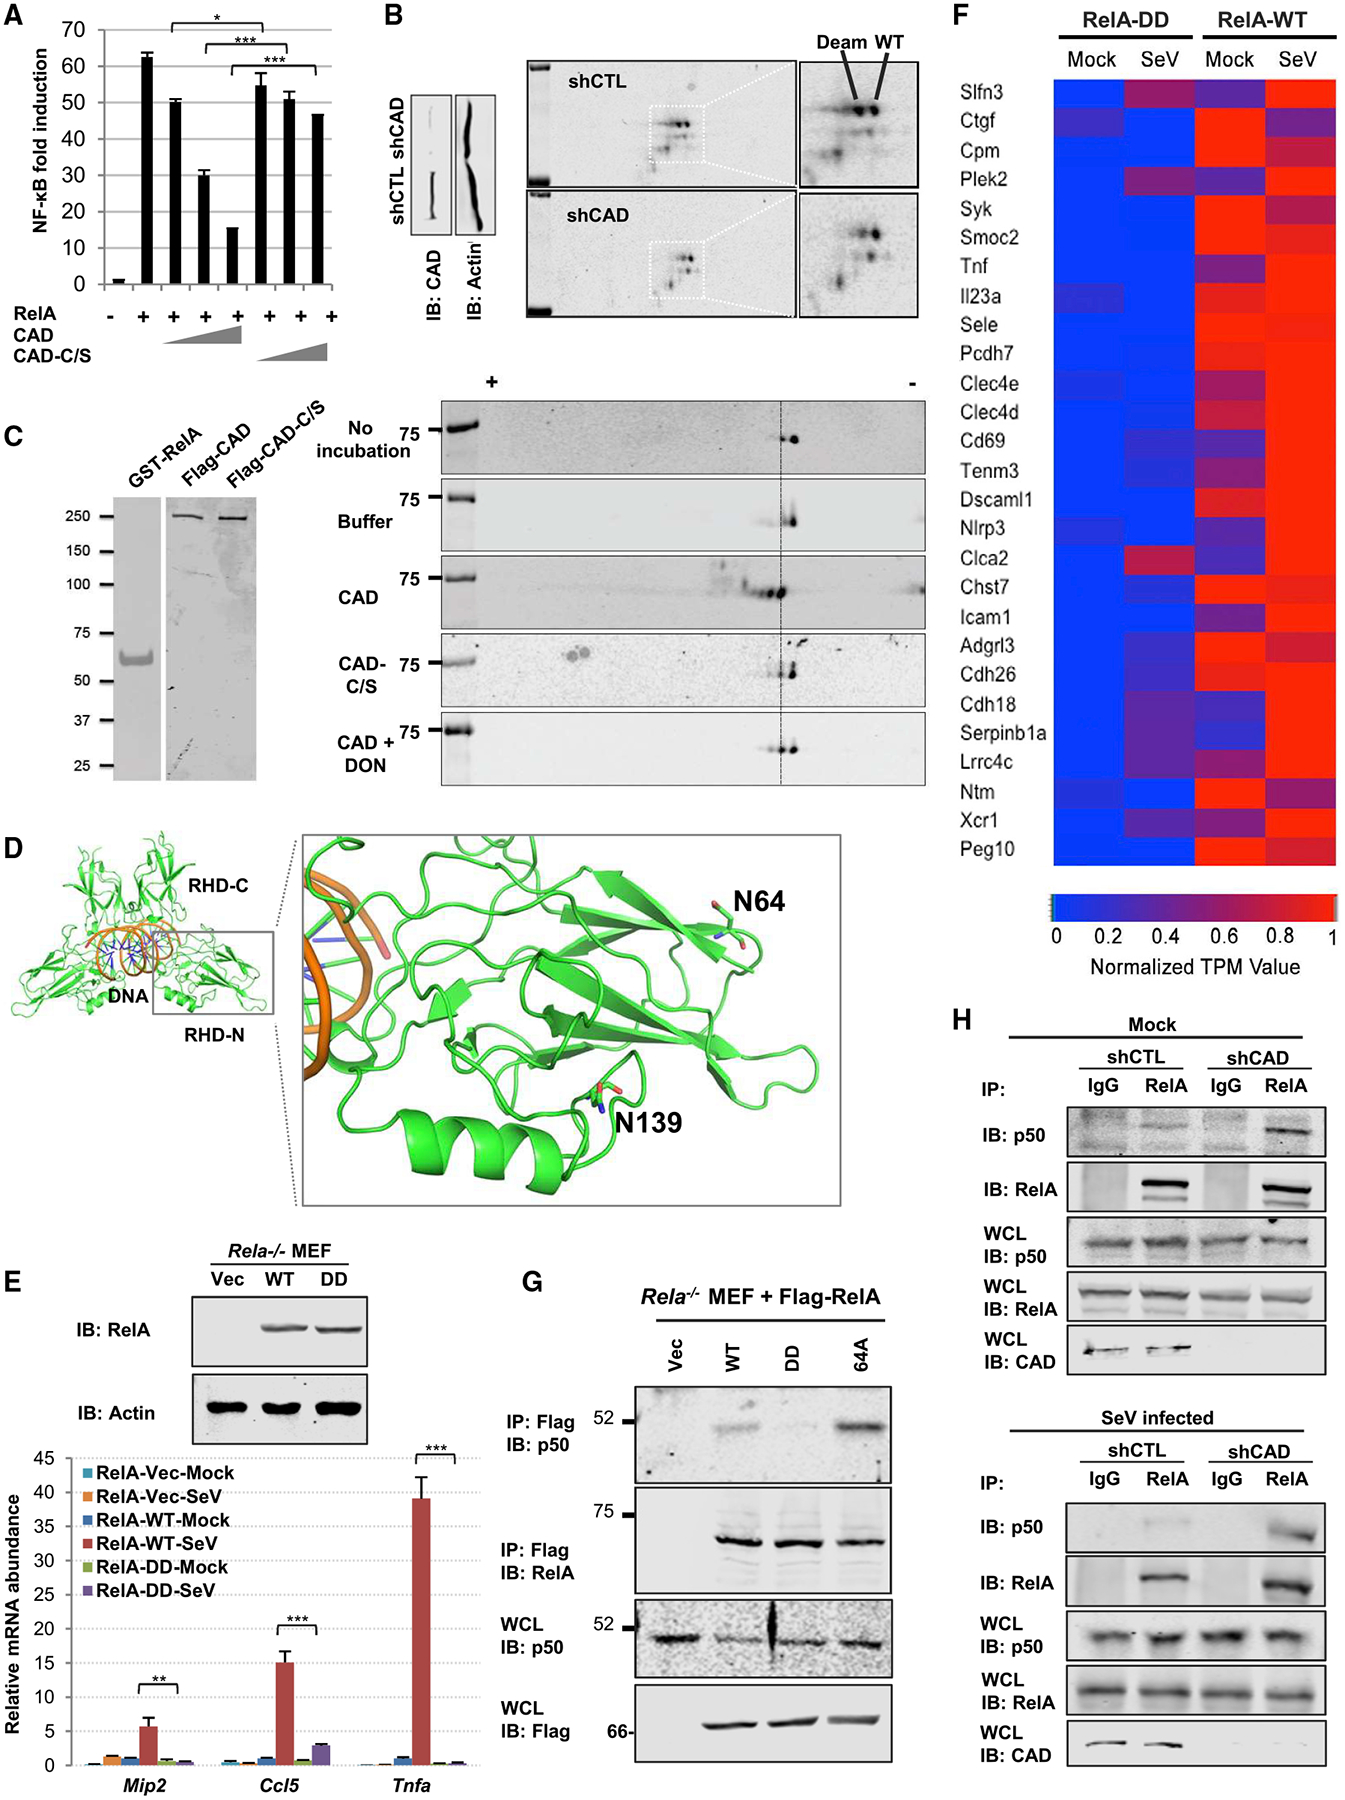
(A) NF-κB luciferase reporter assay from 293T cells with increasing amount of a plasmid containing CAD or the enzyme-deficient CAD-C/S.
(B) Immunoblots of whole cell lysates (WCLs) of control (shCTL) or CAD-depleted (shCAD) human HCT116 cells after regular SDS-PAGE (left panels) or two-dimensional gel electrophoresis (2DGE) (right panels). WT and Deam denote wild-type and deamidated RelA, respectively.
(C) Silver stains of purified GST-RelA, CAD, and CAD-C/S (left panel). Immunoblots of in vitro deamidation reactions analyzed by 2DGE (right panel).
(D) Structure of the Rel Homology Domain with the deamidated sites, N64 and N139, which locate within two loops of the insertion region. PDB: 1RAM.
(E and F) Immunoblots of WCLs from Rela−/− MEFs reconstituted with vector, RelA-WT, or RelA-DD (top panels). The mRNA abundance of Mip2, Ccl5, and Tnfa in reconstituted MEFs infected with SeV (E). A heatmap representing NF-κB-dependent gene expression of the reconstituted MEFs (F).
(G) Immunoblots of precipitated proteins and WCLs from reconstituted MEFs as described in (E) that were treated with TNF-α.
(H) Immunoblots of precipitated proteins and WCLs from control (shCTL) or CAD-depleted (shCAD) 293T cells under mock- (top panels) or SeV-infected (bottom panels) conditions.
Data are presented as mean ± SD. Significance was calculated using two-tailed, unpaired Student’s t test. *p < 0.05; ***p < 0.001; ns, non-significant. See also Figures S3 and S4.
To assess whether CAD deamidates RelA, we monitored the charge status of RelA by two-dimensional gel electrophoresis (2DGE) upon CAD depletion in human HCT116 cells. In control HCT116 cells, two distinct species of RelA were detected (Figure 2B). When CAD was depleted with shRNA, the more negatively charged species was greatly reduced, indicative of diminished deamidation (Figure 2B). Endogenous RelA was highly deamidated in transfected 293T cells, while overexpressed CAD further deamidated RelA and depleted the undeamidated species without altering the charge status of p50 (Figure S3A), indicating the specificity of CAD-mediated RelA deamidation. Medium from CAD-knockdown cells did not suppress RelA deamidation, indicating that the intrinsic deamidase activity of CAD is required to deamidate RelA in a cell autonomous manner (Figure S3B). We then purified RelA with or without exogenously expressed CAD and analyzed RelA post-translational modifications by tandem mass spectrometry. This analysis identified two sites, asparagine 64 and 139, that experienced an increase in deamidation with CAD expression (Figures S3C and S3D). To assess the specificity of the deamidation, we generated a RelA mutant that contains two N>D mutations (i.e., N64D and N139D), referred to as RelA-DD. Exogenous expression of CAD shifted wild-type RelA, but not RelA-DD, toward the positive side of the gel strip (Figure S3E). This result suggests that there are no additional sites within RelA that can be deamidated by CAD.
To test whether CAD is a bona fide deamidase, we purified GST-RelA, CAD, and the enzyme-deficient CAD-C/S mutant to high homogeneity (Figure 2C, left panel) and performed an in vitro deamidation assay. Purified GST-RelA demonstrated two species by 2DGE, with a minor species migrating toward the positive side of the strip (Figure 2C). Compared to the control reaction, CAD shifted RelA toward the positive end of the gel strip, yielding two more new species compared to the control reaction (Figure 2C). Importantly, the CAD-C/S mutant did not shift RelA, and the glutamine amidotransferase inhibitor DON (500 nM) significantly reduced the amount of the two new species that were engendered by CAD. These results show that CAD deamidates RelA in cells and in vitro.
RelA is one of the most extensively studied members of the Rel family of transcription factors that share a conserved rel homology domain (RHD, Figure 2D). The crystal structure of RelA RHD has been solved in various complexes including the Rel homodimer bound to DNA (PDB code: 1RAM) (Chen et al., 1998). The two deamidation sites are both located within the RHD-N subdomain of RelA, which has a typical beta-sandwich structure. One of the deamidation sites, N64, is located on the βB-βC Loop, whereas the other deamidation site, N139, is located on the so-called “insertion region” of RelA. Both sites are far away from the DNA-binding and dimerization interfaces, providing no clear indication concerning how deamidation impacts RelA function (Figure 2D). Thus, we used the deamidated RelA-DD mutant to determine the effect of deamidation on NF-κB-dependent gene expression. Reporter assays indicated that single deamidation mutants, RelA-64D and RelA-139D, were partly impaired in their abilities to activate NF-κB. Remarkably, the RelA-DD mutant showed residual activity to activate the NF-κB promoter (Figure S3F). These RelA mutants were expressed at levels similar to that of wild-type RelA. We have also generated RelA mutants containing N64A (RelA-64A) and N139A (RelA-139A) mutations. While RelA-139A was impaired in its capacity to activate NF-κB, RelA-64A more potently activated the NF-κB promoter than wild-type RelA (Figure S3G and data not shown). Consistent with that, RelA-64A was more resistant to CAD-mediated deamidation, assessed by 2DGE and inhibition by reporter assays, than wild-type RelA (Figures S3H and S3I).
To gain insight into the role of deamidation in RelA-mediated gene expression, we first reconstituted RelA-deficient (Rela−/−) mouse embryonic fibroblasts (MEFs) with wild-type RelA or the deamidated RelA-DD (Figure 2E, top panel) and analyzed the expression of a few known NF-κB-responsive genes. This analysis showed that SeV infection potently induced the expression of NF-κB-responsive genes in Rela−/− MEFs reconstituted with wild-type RelA, but failed to induce the expression of Mip2 and Tnfa and only weakly induced that of Ccl5 in cells reconstituted with RelA-DD (Figure 2E). RNA sequencing analysis further showed that, upon SeV infection, NF-κB-dependent genes were among the most significantly reduced in gene expression in Rela−/− MEFs reconstituted with RelA-DD (Figure 2F). Furthermore, we introduced N64D and N139D mutations into the Rela locus of BL6 mouse, designated RelA-DD knockin (Figure S4A). We isolated primary MEFs and found that SeV infection induced significantly lower expression of Cxcl-1, Il-8, and Tnfa (Figure S4B). Finally, RelA-depleted HCT116 cells reconstituted with wild-type RelA and RelA-DD (Figure S4C) recapitulated the differential expression profile of NF-κB-dependent genes (Figure S4D), while RelA-64A more robustly upregulated NF-κB-dependent gene expression than wild-type RelA. These results show that deamidation impairs the transcriptional activation of NF-κB-dependent genes by RelA.
To probe the molecular mechanism by which deamidation negatively impacts RelA-mediated NF-κB activation, we analyzed the interaction with IκBα and p50 and the nuclear translocation of RelA. CoIP assays showed that, compared to wild-type RelA, RelA-DD and RelA-64A showed comparable and reduced interactions with IκBα, respectively (Figure S4E). Fractionation of nuclei and cytoplasm indicated that RelA-DD accumulated in the nucleus with similar kinetics as wild-type RelA upon TNF-α treatment (Figure S4F). By contrast, compared to wild-type RelA, RelA-DD and RelA-64A demonstrated lower and higher interaction with p50, respectively (Figure 2G). The same pattern of p50 interaction was observed in these reconstituted HCT116 cells under mock and TNF-α-treated conditions (Figure S4G). When CAD was depleted in 293T cells, more p50 was precipitated with RelA in resting and SeV-infected cells, supporting that CAD-mediated deamidation negatively regulates RelA interaction with p50 (Figure 2H). The p50-interacting activity of these RelA proteins correlated well with their ability to activate NF-κB. This result agrees with the observation that the p50-RelA dimer has the highest affinity for the promoter of NF-κB-responsive genes (Phelps et al., 2000). To test the regulatory role of CAD on p50-mediated NF-κB induction, we engineered p50-deficient 293T cells for SeV infection. Real-time analysis indicated that CAD depletion had minimal effect on the induction of NF-κB-dependent gene expression in p50-deficient cells (Figures S4H and S4I). This result indicates that CAD negatively regulated NF-κB-dependent gene expression mediated by the p50-p65 complex. We further performed a ChIP assay to probe the promoter-associated RelA using reconstituted HCT116 cells. This analysis demonstrated that wild-type RelA, but not RelA-DD, precipitated a significant amount of DNA of the promoter sequences of TNFα, IκBα, and IL-8 (Figure S4J). These results show that deamidation impairs the ability of RelA to interact with p50, which recruits RelA to the promoter of NF-κB-responsive genes.
RelA Deamidation and Reduced Expression of NF-κB-Responsive Genes Are Cell Cycle-Dependent
In proliferating cells, CAD is activated in S phase to promote nucleotide synthesis in preparation for DNA replication (Sigoillot et al., 2003). To probe the deamidase activity of CAD during cell proliferation, we analyzed RelA deamidation in synchronized cycling cells. HCT116 cells were arrested by lovastatin at G1 phase and released for cell cycle progression, validated by immunoblotting analyses of cyclins E, A, and B (Figures 3A and 3B). Analysis of RelA by 2DGE indicated that RelA deamidation peaked at 20 h after release, which corresponded to late S phase and quickly diminished thereafter (Figure 3C). The enzymatic activity in pyrimidine synthesis of CAD is activated by phosphorylation of serine 1859 (S1859) mediated by S6K (Ben-Sahra et al., 2013; Robitaille et al., 2013). We thus engineered HCT116 cells expressing a Flag-epitope at the carboxyl-terminus of the endogenous CAD, which allowed us to purify CAD for in vitro biochemical analysis. We first analyzed CAD phosphorylation and found CAD phosphorylation (S1859) peaked at 20 h and remained high from 16 to 24 h after release from lovastatin (Figure 3D). When purified CAD was analyzed by in vitro RelA deamidation, we observed that the RelA-deamidating activities paralleled the phosphorylation of S1859 (Figure 3E). We also treated cells with double thymidine, which arrests cells in S phase (Figure S5A), and analyzed RelA deamidation after release. This analysis showed that a large fraction of RelA was deamidated in S phase and that this fraction diminished when cells exited from S phase (Figure S5B). The phosphorylation of S1859 of CAD also correlated with the level of deamidated RelA (Figures S5B and S5C). These results suggest that the deamidase activity of CAD is high during S phase, likely concurrent with its pyrimidine-synthesizing activity.
Figure 3. RelA Deamidation and NF-κB Downregulation Is Cell Cycle-Dependent.
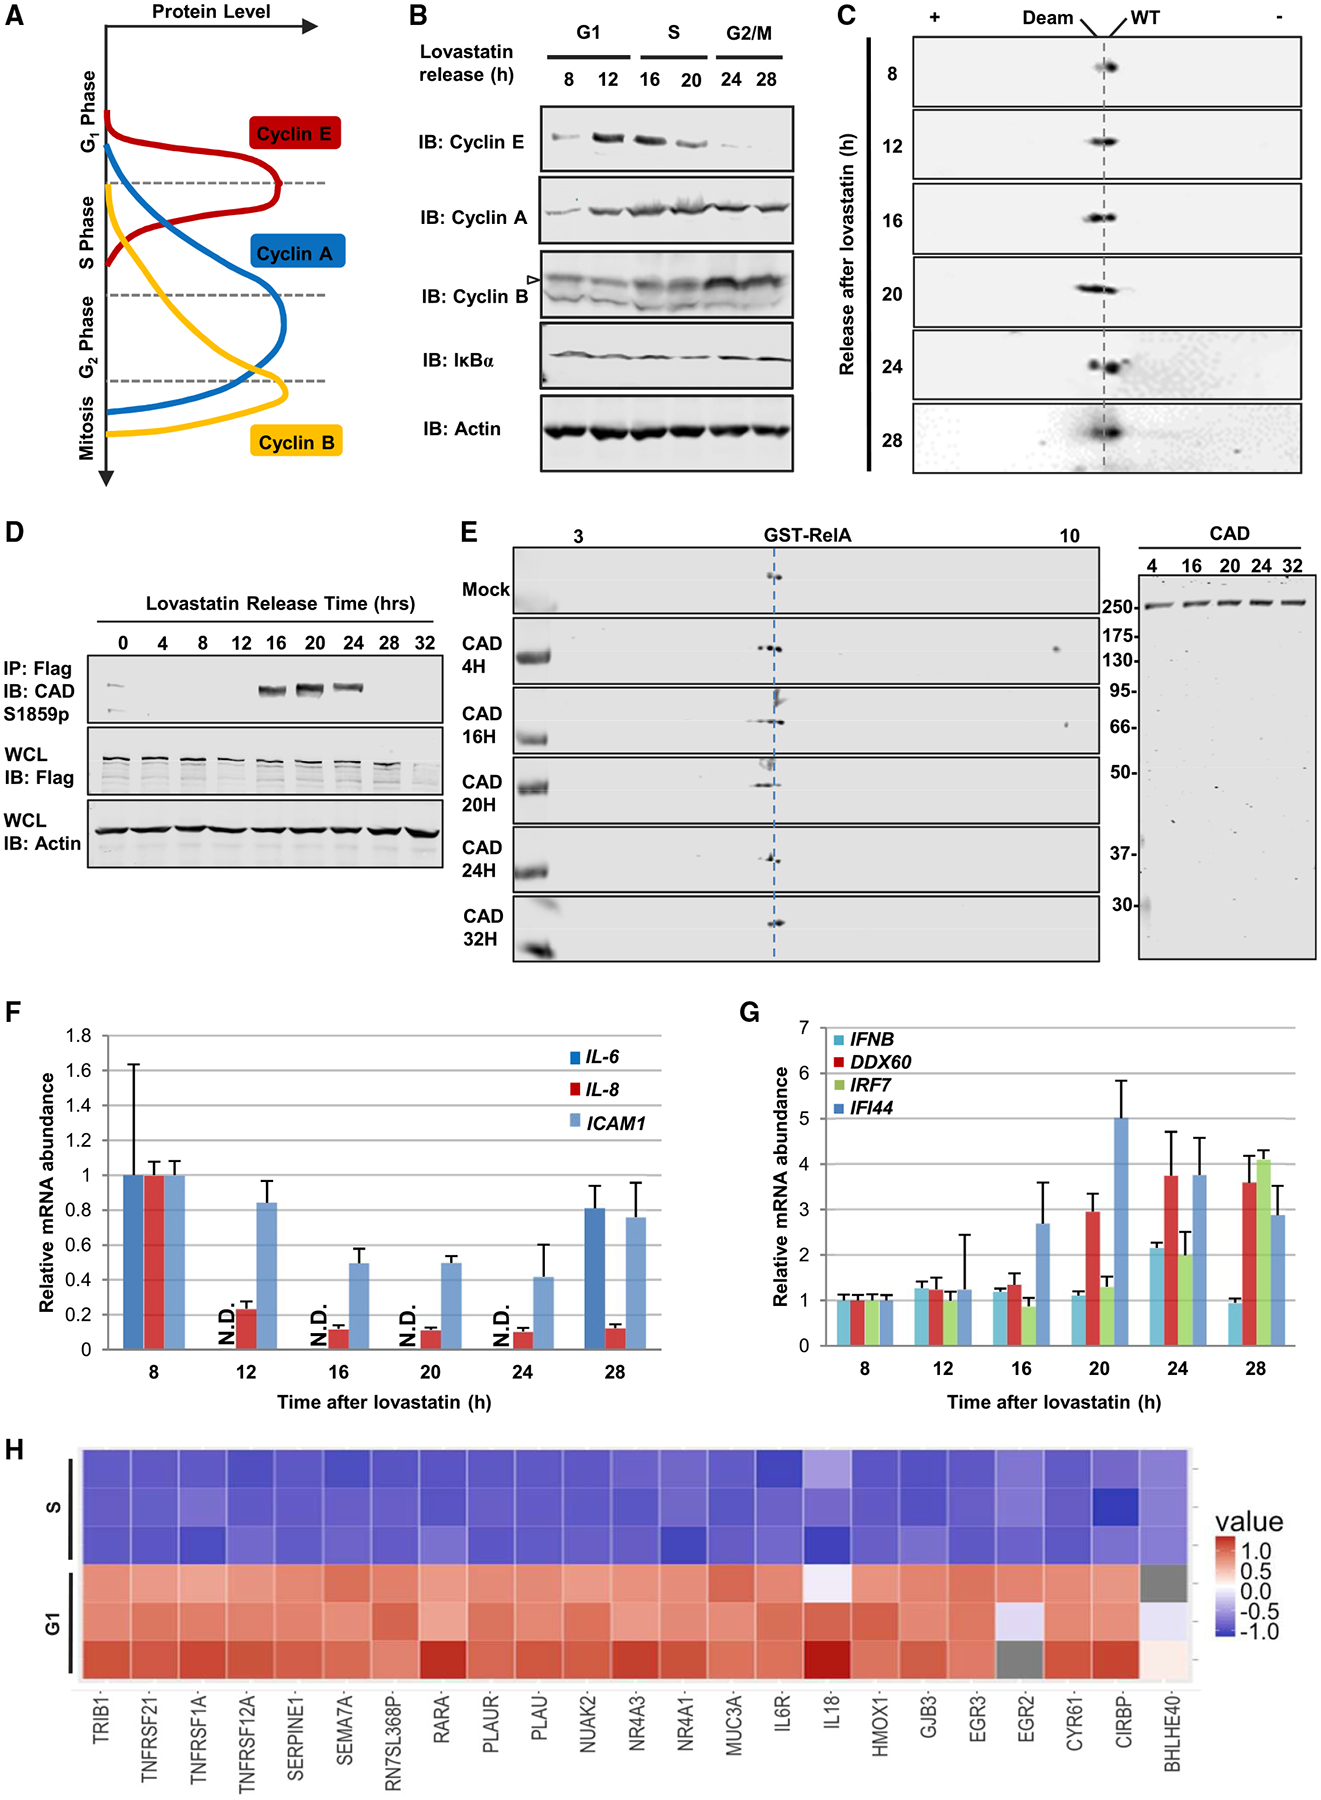
(A) Diagram showing distinct cell cycle phases marked by corresponding cyclin expression.
(B and C) Immunoblots of whole cell lysates (WCLs) from HCT116 cells released at indicated time points after lovastatin arrest analyzed by regular SDS-PAGE (B) or two-dimensional gel electrophoresis (2DGE) (C). Deam: deamidated; WT, wild-type.
(D and E) Immunoblots of precipitated CAD or WCLs from HCT116 Flag-CAD knockin cells (D). Immunoblots of in vitro deamidation with precipitated CAD at indicated time points analyzed by 2DGE (E).
(F and G) The mRNA abundance of IL-6, IL-8, and ICAM1 (F) or IFNB, DDX60, IRF7, and IFI44 (G) in HCT116 harvested at indicated time after lovastatin arrest.
(H) A heatmap showing the relative expression level of representative NF-κB-responsive genes in HCT116 cells synchronized in S and G1 phase with lovastatin. See also Figures S5 and S6.
Concomitant with RelA deamidation, the expression levels of NF-κB-dependent genes were downregulated with the progression into S phase. The downregulation of IL-6 and IL-8 expression showed quick and robust kinetics paralleling RelA deamidation, compared to the slow downregulation of ICAM1 expression (Figure 3F). Moreover, SeV-induced IL-8 expression inversely correlated with RelA deamidation during cell cycle; i.e., IL-8 expression peaked at 6 h after double thymidine release when RelA deamidation was the lowest (Figure S5D). In stark contrast, the expression of four interferon-related genes, i.e., IFNβ, DDX60, IRF7, and IFI44, increased gradually with the progression of cell cycle (Figure 3G). In BJ5 fibroblast cells, the expression of these two categories of genes segregated during cell cycle (Figures S5E and S5F). We further validated the lower NF-κB activation in S phase by RNA sequencing analysis using HCT116 cells synchronized in G1 and S phase. This analysis showed that the expression levels of NF-κB-dependent genes, including SERPINE1, IL-18, IL-6R, and the TNFR superfamily (TNFRSF1A, 12A, and 21), were downregulated in S phase (Figure 3H), but those of interferon-related genes (IFI44, IRF7, and MX2) were not (Figure S5G). Thus, NF-κB activation is suppressed during S phase via RelA deamidation.
To probe the role of CAD in inhibiting NF-κB activation in S phase, we introduced RelA-64A and wild-type RelA into HCT116 cells and analyzed the expression of IL-6, ICAM1, and IL-8. Remarkably, RelA-64A, compared to wild-type RelA, led to greater IL-6 and ICAM1 expression in S phase, while it sustained IL-8 expression (Figure S5H). The expression of all three genes was downregulated in HCT116 cells expressing wild-type RelA. Furthermore, we depleted CAD expression with shRNA and examined the expression of NF-κB-dependent genes. CAD knockdown in HCT116 cells (Figure S6A) resulted in slightly higher EGR1 expression and much higher ICAM1 expression in S phase versus control cells (Figure S6B). Thus, knockdown of CAD or ectopic expression of the deamidation-resistant RelA-64A mutant lead to greater expression of NF-κB-dependent genes in S phase.
To determine whether CAD-mediated RelA deamidation is regulated during innate immune activation, we monitored RelA charge change upon LPS treatment or SeV infection. Compared to the mock-treated group, the deamidated species of RelA was detectably reduced in LPS-treated or SeV-infected groups (Figure S6C). Consistent with NF-κB activation, LPS treatment and SeV infection increased RelA phosphorylation of serine 536. Furthermore, using the Flag-tagged CAD HCT116 cells, we affinity-purified CAD from mock-treated, LPS-treated, and SeV-infected cells and carried out in vitro RelA deamidation assay. This analysis indicated that LPS treatment and SeV infection inhibited the deamidase activity of CAD (Figure S6D). These results indicate that CAD-mediated RelA deamidation is negatively regulated by signals to activate NF-κB.
Deamidated RelA Promotes Aerobic Glycolysis and Cell Proliferation
While culturing HCT116 cells, we observed that the medium of RelA-depleted cells reconstituted with RelA-DD turned yellow much sooner than that of cells reconstituted with wild-type RelA or RelA-64A. Quantification of lactate production from these cells showed that the reconstituted expression of RelA-DD and wild-type RelA, but not that of RelA-64A, resulted in higher lactate production by ~70% and ~30%, respectively (Figure S7A). Extracellular acidification rate (ECAR) analysis further showed that HCT116 cells reconstituted with RelA-DD generated much more lactate than those expressing wild-type RelA and RelA-64A (Figure 4A). Glucose uptake analysis using 2-deoxyglucose (2-DG) indicated that RelA-DD increased glucose uptake by ~40%, while RelA-64A reduced it by ~30% (Figure 4B). Similarly, RelA-DD knockin MEFs demonstrated significantly higher glucose consumption and lactate production compared to wild-type MEFs (Figures S7B and S7C). In contrast, the oxygen consumption rate (OCR) showed that RelA-64A resulted in much greater mitochondrial respiration and that wild-type RelA did so to a lesser extent (Figure 4C), while RelA-DD induced a smaller, but detectable, increase. These results suggest that RelA deamidation switches cellular metabolic program from mitochondrial oxidative phosphorylation to aerobic glycolysis.
Figure 4. CAD-Mediated RelA Deamidation Is Crucial for Glycolysis and Cell Proliferation.
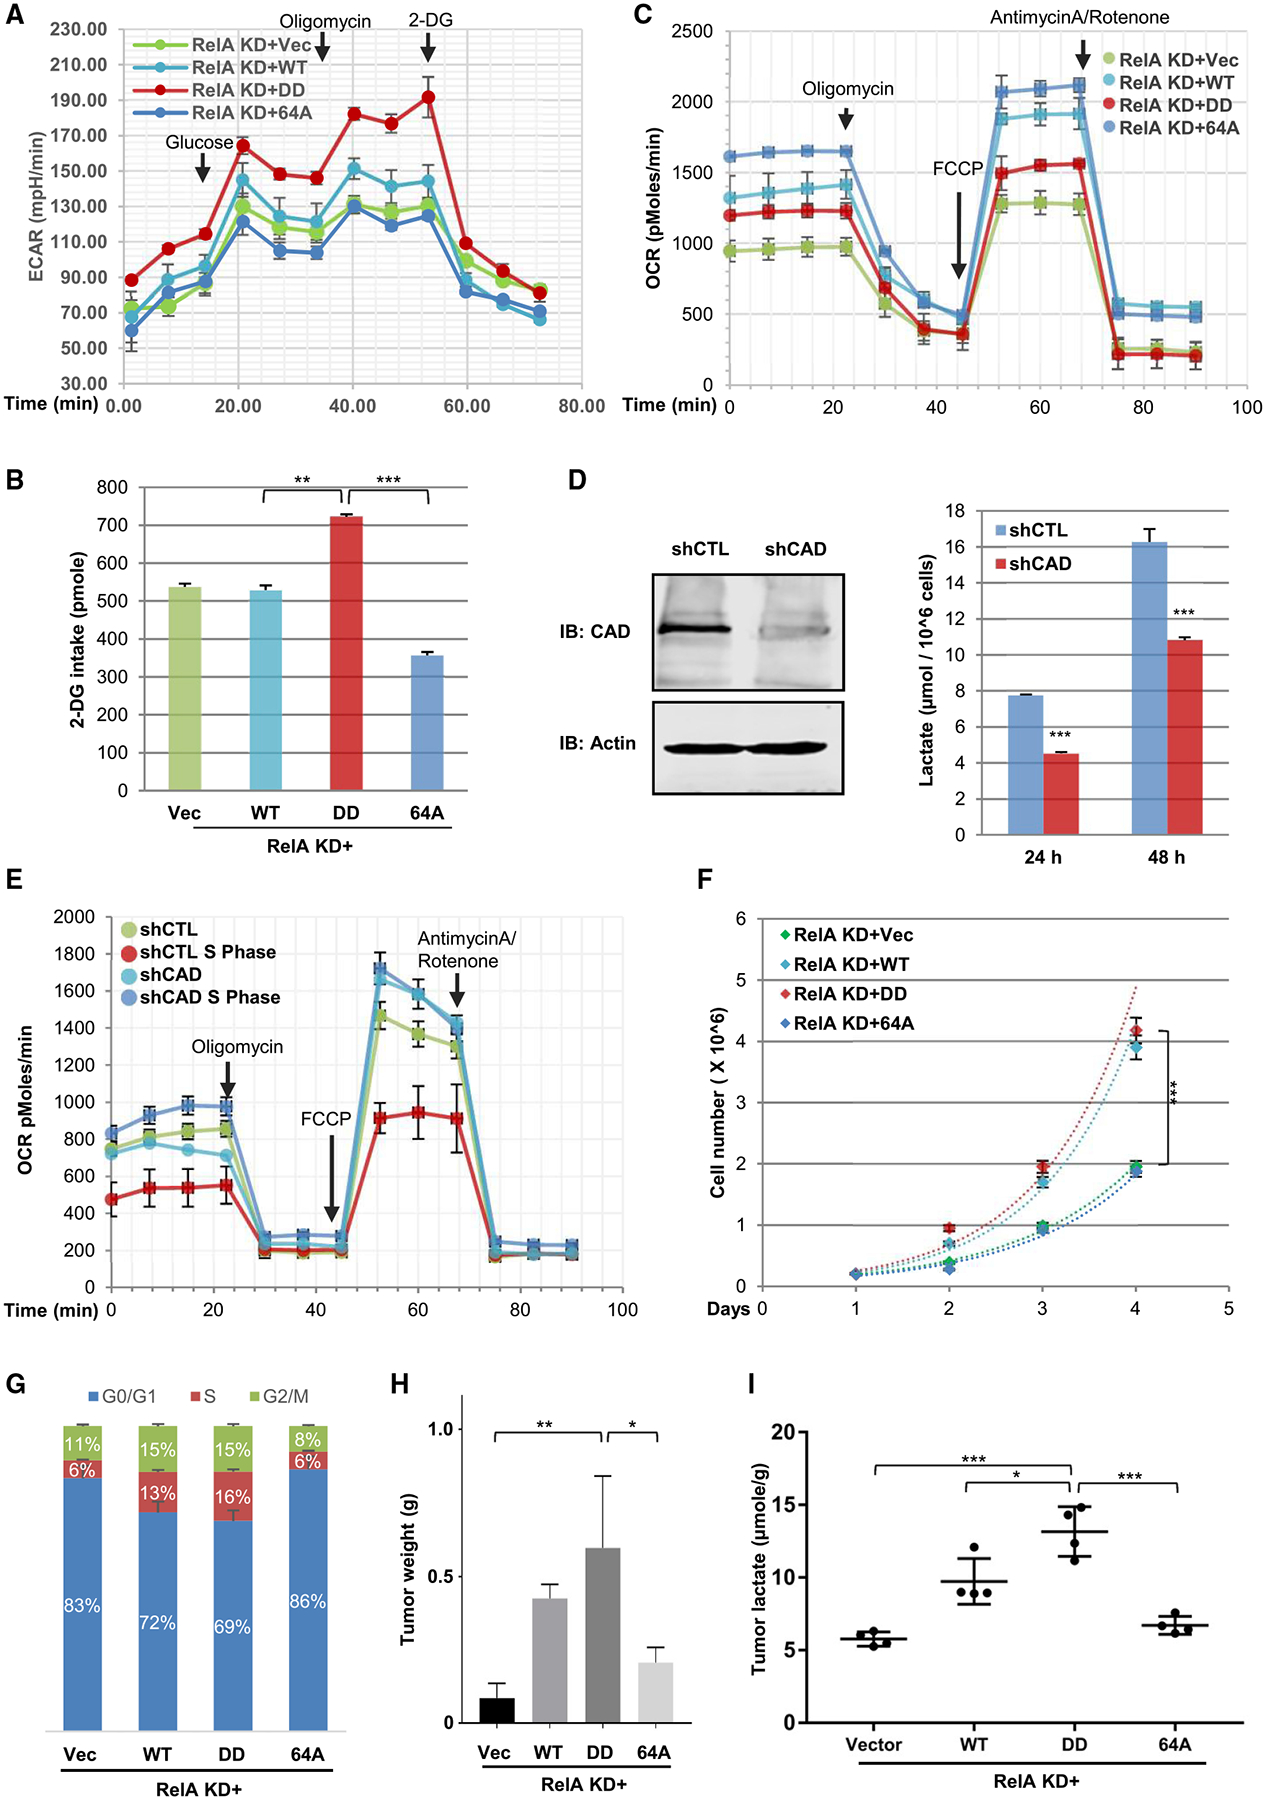
(A) Extracellular acidification rate recorded from RelA-knockdown (KD) HCT116 cells reconstituted with wild-type (WT), RelA-DD (DD), or RelA-64A (64A) and treated with indicated agents.
(B) Intracellular 2-DG of reconstituted HCT116 cells as described in (A) determined at 20 min after addition.
(C) Oxygen consumption rates (OCRs) of reconstituted HCT116 cells as described in (A) treated with indicated agents.
(D and E) Immunoblots of whole cell lysates of control (CTLs) and CAD-depleted (shCAD) HCT116 cells (left panels) and lactate in the medium measured at 14 h after passaging (D). OCR of control (shCTL) or CAD-depleted (shCAD) HCT116 cells either unsynchronized or S-phase-synchronized with double thymidine block (E).
(F and G) Cell proliferation of reconstituted HCT116 cells (as in A) analyzed by cell enumeration over time (F) or staining with propidium iodide and flow cytometry (G).
(H and I) Tumor weight (H) and lactate levels (I) of tumors derived from reconstituted HCT116 cells as described in (A).
Data are presented as mean ± SD. Significance was calculated using two-tailed, unpaired (paired for Figure 4F) Student’s t test. **p < 0.01; ***p < 0.001; ns, non-significant. See also Figure S7.
Next, we determined whether CAD had effects similar to RelA-DD. Depletion of CAD in HCT116 cells significantly reduced lactate production (Figure 4D). Moreover, HCT116 cells synchronized to S phase also demonstrated elevated ECAR, and shRNA-mediated depletion of CAD abolished the increase in extracellular acidification of S phase HCT116 cells (Figure S7D). In contrast, synchronizing HCT116 cells to S phase reduced OCR, and knockdown of CAD abolished the reduction of OCR induced by S phase synchronization (Figure 4E). CAD depletion also led to a slightly higher OCR in unsynchronized HCT116 cells, likely due to the small percentage of cells cycling in S phase. Furthermore, the expression of RelA-64A, but not that of wild-type RelA, abolished the increase in EACR induced by S phase synchronization (Figure S7E) that correlated with elevated OCR (Figure S7F). These results support the conclusion that CAD-mediated RelA deamidation suppresses mitochondrial oxidative phosphorylation and promotes glycolysis.
To assess the biological significance of RelA deamidation, we examined cell proliferation and tumorigenesis of RelA-depleted HCT116 cells reconstituted with wild-type and mutant RelA. In RelA-depleted HCT116 cells, reconstituted expression of wild-type RelA and RelA-DD resulted in significantly greater cell proliferation, while that of RelA-64A had no detectable effect (Figure 4F). Similarly, expression of RelA-DD, but not that of RelA-64A, in RelA-depleted SW480 colorectal cancer cells led to greater lactate production and cell proliferation (Figures S7G and S7H). To determine the role of CAD in deamidating RelA and promoting cell proliferation, we depleted CAD and ectopically expressed RelA-DD in HCT116 cells (Figure S7I). Not surprisingly, CAD depletion impaired the proliferation of HCT116 cells, and expression of RelA-DD partly restored the proliferation (Figure S7J). Consistent with this, expression of wild-type RelA in RelA-knockdown HCT116 cells resulted in greater population of S phase cells from 6% to 13%, and RelA-DD increased the S phase population to 15%, whereas RelA-64A had no effect (Figure 4G). Cells in G2 and M phase were 11% and 15% in cells expressing wild-type RelA and RelA-DD, respectively, and it was 8% in those expressing RelA-64A. When these reconstituted HCT116 cells were subcutaneously transplanted into nude mice, we found that RelA-DD, and to a lesser extent wild-type RelA, potently promoted tumor formation, as assessed by tumor size (Figure S7K) and weight (Figures 4H and S7L). Notably, RelA-64A also yielded slightly greater tumors versus control, likely due to its inhibition of apoptosis. Lactate production from tumors derived from these reconstituted cell lines also correlated with their ability to promote tumor formation (Figure 4I). These results collectively show that deamidated RelA promotes cell proliferation and tumor growth.
Deamidated RelA Programs Metabolism via Regulating Gene Expression
We analyzed RNA sequencing data derived from RelA knockdown HCT116 cells reconstituted with wild-type RelA, RelA-DD, and RelA-64A. This data identified a subset of metabolic enzymes that were differentially regulated by RelA-DD and RelA-64A (Figure 5A). Notably, these enzymes cluster into the glycolysis, pentose phosphate pathway, nucleotide biosynthesis, and tricarboxylic acid (TCA) cycle. Real-time PCR analysis focusing on key glycolytic enzymes and transporters revealed that the expression of glucose transporter (Glut3), hexokinases (HK2 and 4), phosphofructose kinases (PFKP, PFKM, and PFKL), pyruvate dehydrogenase kinases (PDK1, 2, and 3), pyruvate carboxylase (PC) and glutamate-pyruvate transaminase (GPT) were induced by RelA-DD and wild-type RelA, but not RelA-64A (Figures 5B and S8A). When compared to wild-type RelA, RelA-DD similarly induced the expression of PFK (P, M, and L) and PK (M1, M2, and LR) and more potently induced Glut3, HK4, and PDK3 (Figure S8A). RelA-64A either failed to induce or only weakly induced most of these enzymes, indicating the promoter specificity of deamidated RelA. Interestingly, PK (M1 and M2) and LDH (A and B) were equally induced by wild-type RelA, RelA-DD, and RelA-64A (Figure S8A). Immunoblotting analysis indicated that RelA-DD elevated the protein levels of PC, PDK2, PDK3, HK4, and PFKP, while wild-type RelA had modest effects and RelA-64A had no effect on their protein expression (Figure 5C). Consistent with the upregulation of PDK by RelA-DD, the phosphorylation of serine 293 of pyruvate dehydrogenase α subunit (PDHA1) was readily detected in cells reconstituted with RelA-DD. In CAD-depleted cells, reconstituted expression of RelA-DD restored the expression of PC, PDK2, and PFKP (Figure S8B). On the other hand, RelA-DD induced lower levels of expression of components of the mitochondrial respiration chain compared to wild-type RelA and RelA-64A, including those of the ATP synthase, complex I, III, and IV (Figure 5D). Thus, the deamidated RelA-DD and deamidation-resistant RelA-64A preferentially upregulate the expression of key glycolytic enzymes and mitochondrial respiration components, respectively.
Figure 5. Metabolic Reprogramming by Deamidated RelA.
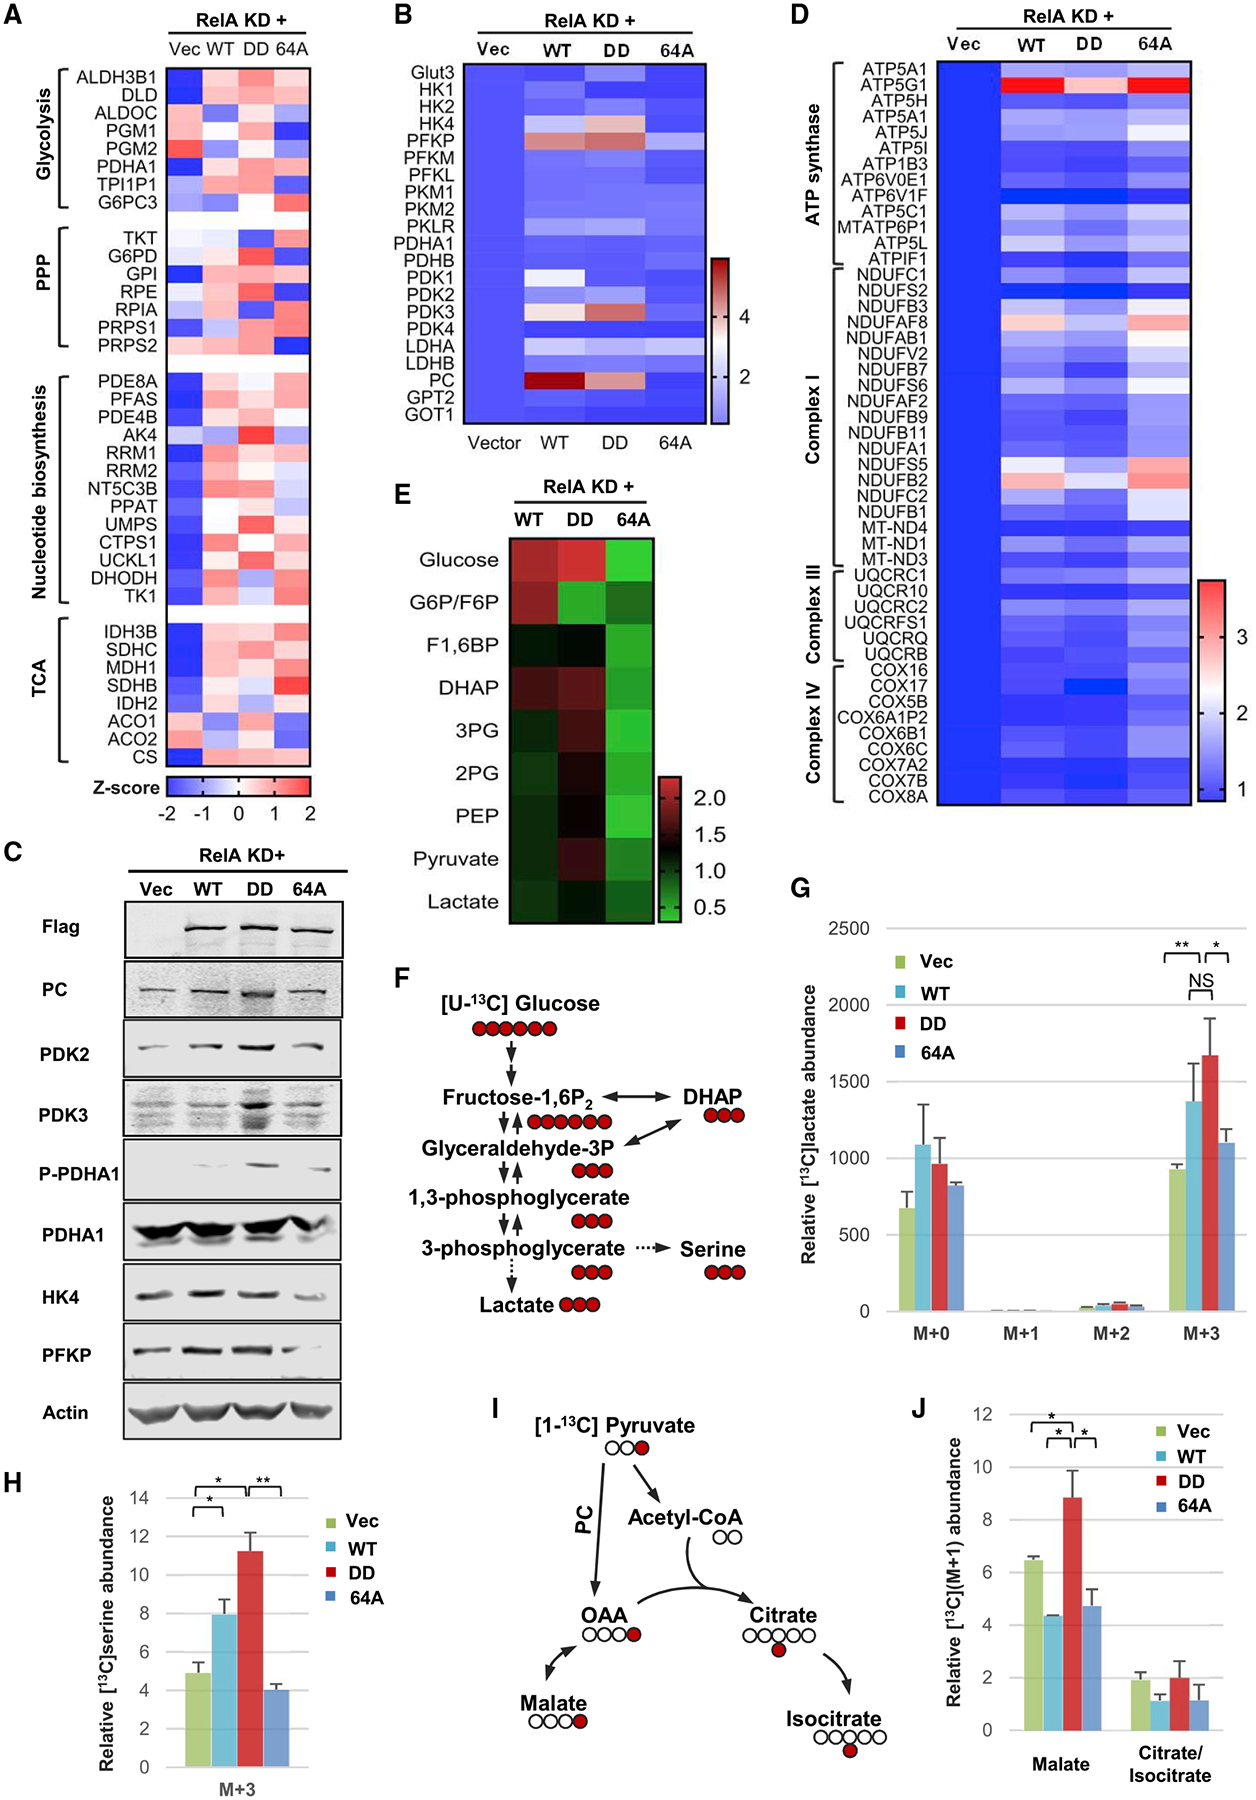
(A–C) A heatmap showing the expression of genes related to glycolysis, the pentose phosphate pathway (PPP), nucleotide and tricarboxylic acid (TCA) cycle (A) of the glycolytic pathway (B) and of mitochondrial oxidative phosphorylation (C), derived from RNA sequencing analysis of RelA-knockdown (KD) HCT116 cells reconstituted with wild-type RelA, RelA-DD, and RelA-64A.
(D) Immunoblots of whole cell lysates from reconstituted HCT116 cells as described in (A).
(E) A heatmap showing glycolytic intermediates of reconstituted HCT116 cells as described in (A).
(F–H) Diagram of the isotope labeling of selected glycolytic intermediates using [U-13C]glucose (F). Intracellular lactate (G) and glycolytic serine (H) of reconstituted HCT116 (as described in A) traced with [U-13C]glucose and analyzed by mass spectrometry. M+a indicates the mass of lactate or serine (+a) universally labeled with [U-13C]glucose.
(I and J) Diagram of the conversion of pyruvate to malate reflecting pyruvate carboxylase (PC) activity using [1-13C]pyruvate (I) and mass spectrometry analysis of intracellular M+1 malate and citrate (isocitrate) (J).
Data are presented as mean ± SD. Significance was calculated using two-tailed, unpaired Student’s t test. **p < 0.01; ***p < 0.001; ns, non-significant. See also Figure S8.
To probe the role of CAD in glycolytic enzyme expression during cell cycle, we synchronized HCT116 cells with lovastatin (Figure S8C) and analyzed the expression of a few representative enzymes, including PDKs, PFKP, PC, and HK4. Real-time analysis indicated that all enzymes demonstrated cell cycle-dependent induction peaking at 20 h after release, concurrent with the peak RelA deamidation in late S phase (Figures S8D and S8E). Robust induction was observed for PDK2, PFKP, and PC, while modest or weak induction was observed for the rest of the tested genes. The induction of these glycolytic genes by RelA-DD, and to a lesser extent by wild-type RelA, was also observed in tumors derived from reconstituted HCT116 cell lines (Figure S8F). The upregulation of glycolytic genes by RelA-DD was further validated by chromatin immunoprecipitation and real-time PCR analysis that RelA-DD showed 2- to 4-fold higher binding to the promoters of GLUT3, HK4, PFKP, PDK2, and PDK3 in reconstituted HCT116 cells (Figure S8G). Finally, primary RelA-DD knockin MEFs have significantly higher expression of glycolytic genes compared to wild-type MEFs (Figure S8H). Thus, the induction of glycolytic enzymes parallels CAD-mediated RelA deamidation in a cell cycle-dependent manner.
To validate the function of upregulated glycolytic enzymes, we analyzed the intracellular concentrations of key intermediates of the glycolytic pathway in reconstituted HCT116 cells. We found that RelA-DD expression resulted in greater amount of nearly all intracellular metabolites of the glycolytic pathway, compared to RelA-64A (Figure 5E). These metabolites include glucose, fructose1,6-bisphosphate (F1,6BP), dihydroxyacetone phosphate (DHAP), 3-phosphoglycerate (3-PG), 2-phosphoglycerate (2-PG), phosphoenol pyruvate (PEP), pyruvate, and lactate. Compared to wild-type RelA and RelA-64A, RelA-DD led to greater concentration of intracellular metabolites in the lower portion of the glycolysis pathway, such as 3-PG, 2-PG, PEP, and pyruvate. Wild-type RelA demonstrated an intermediate phenotype with moderately higher intracellular glycolytic metabolites. Additionally, RelA-DD led to higher intracellular concentrations of acetyl-CoA, citrate, isocitrate, aconitate, and α-ketoglutarate (Figure S8I). These metabolites constitute the so-called reductive carboxylation pathway, which shunts carbon from glutamine to fatty acid synthesis (Metallo et al., 2011). Finally, RelA-DD also resulted in greater nucleotide levels, particularly ADP, GDP, CDP, UDP, and UTP, compared to RelA-64A (Figure S8J), suggesting the upregulation of the pentose phosphate pathway.
To monitor the activity of the glycolytic pathway, we determined the intracellular accumulation of glucose-derived carbon in lactate after feeding reconstituted HCT116 cells with isotope-labeled [U-13C]glucose (Figure 5F). At 15 min after isotope addition, RelA-DD resulted in greater lactate labeling up by ~70%, while wild-type RelA did to a lesser extent and RelA-64A had a marginal effect (Figure 5G). The accumulation of intermediates of the lower portion of the glycolytic pathway suggests the flux of glycolytic metabolites into its branched pathways, such as the serine-glycine pathway (Figure 5F). Thus, we determined glycolytic serine synthesis with the isotope-labeled [U-13C]glucose. Indeed, RelA-DD and wild-type RelA resulted in greater glycolytic serine synthesis by 120% and 60%, respectively, while that of RelA-64A did the opposite (Figure 5H).
To assess the activity of PC that converts pyruvate into oxoacetate and subsequently malate (Figure 5I), we labeled reconstituted HCT116 cells with [1-13C]pyruvate and determined the level of M+1 malate, which indicates flux from pyruvate. Consistent with the upregulated expression of PC, RelA-DD led to greater amount of M+1 malate (up by ~33%), while wild-type RelA and RelA-64A had the opposite effect (down by ~33%) (Figure 5J). Interestingly, wild-type RelA and RelA-64A resulted in lower intracellular citrate (isocitrate) labeling by ~40%, whereas RelA-DD had no effect (Figure 5J). The reduction in malate and citrate (isocitrate) labeling from pyruvate is likely due to elevated NF-κB activation and subsequent oxidative phosphorylation via TCA cycle. These results collectively show that RelA-DD promotes, while RelA-64A inhibits, flux from glucose to lactate, serine, and malate.
RelA Deamidation Underpins the Elevated Glycolysis of Diverse Cancer Cell Lines
CAD-mediated RelA deamidation promotes glycolytic metabolism and cell proliferation, implying its contribution to tumorigenesis. We assessed CAD expression, RelA deamidation, glycolytic gene expression, and lactate production of a panel of human cancer cell lines that originate from the lung, colorectum, breast, head, and neck. In general, CAD expression correlated well with RelA deamidation in these diverse cell lines (Figures 6A and S9A). Specifically, cell lines with high CAD expression and high deamidated RelA included MCF7, MDA-MB-231, SW480, HCT116, HT29, H522, H358, H1648, and H23 (Figure S9A). Importantly, RelA deamidation correlated with upregulated expression of glycolytic genes and lactate production in these cancer cell lines (Figures 6B, 6C, and S9B). Of head and neck cancer cells, D562 and SCC-15 demonstrated high RelA deamidation and high glycolytic gene expression (Figures S9C and S9D). To probe the role of RelA deamidation in programming aerobic glycolysis, we ectopically expressed wild-type RelA, RelA-DD, and RelA-64A in cancer cell lines that showed no detectable deamidated RelA and low lactate production. These included two colorectal (DLD-1 and LoVo), one breast (T47D), and one lung (H1975) cancer cell line (Figure S9A). In DLD-1 cells, RelA-DD induced the expression of key glycolytic enzymes, including PDKs, HK4, PC, and PFKP, while RelA-64A upregulated the expression of IL-8 (Figure 6D). The induction of these glycolytic enzymes by RelA-DD was substantiated by elevated lactate production (Figure 6E). Similarly, RelA-DD, but not RelA-64A, induced the expression of PDK2 and PDK3 and resulted in greater lactate production up by >110% in LoVo cells (Figures S9E and S9F), which also correlated with a higher cell proliferation rate (Figure S9G). In T47D breast and H1975 lung cancer cells, RelA-DD upregulated the expression of glycolytic genes, while RelA-64A induced IL-8 expression (Figures S10A and S10B). In RelA-depleted SW480 cells, RelA-DD upregulated the expression of HK4, PDK3, PC, and PFKP, while RelA-64A activated that of IL-8 as well as PC, PFKP, and HK4 (Figure S10C). These results show that deamidated RelA, but not deamidation-resistant RelA-64A, upregulates glycolytic gene expression.
Figure 6. CAD-Mediated RelA Deamidation Is Crucial for Diverse Human Cancer Cells.
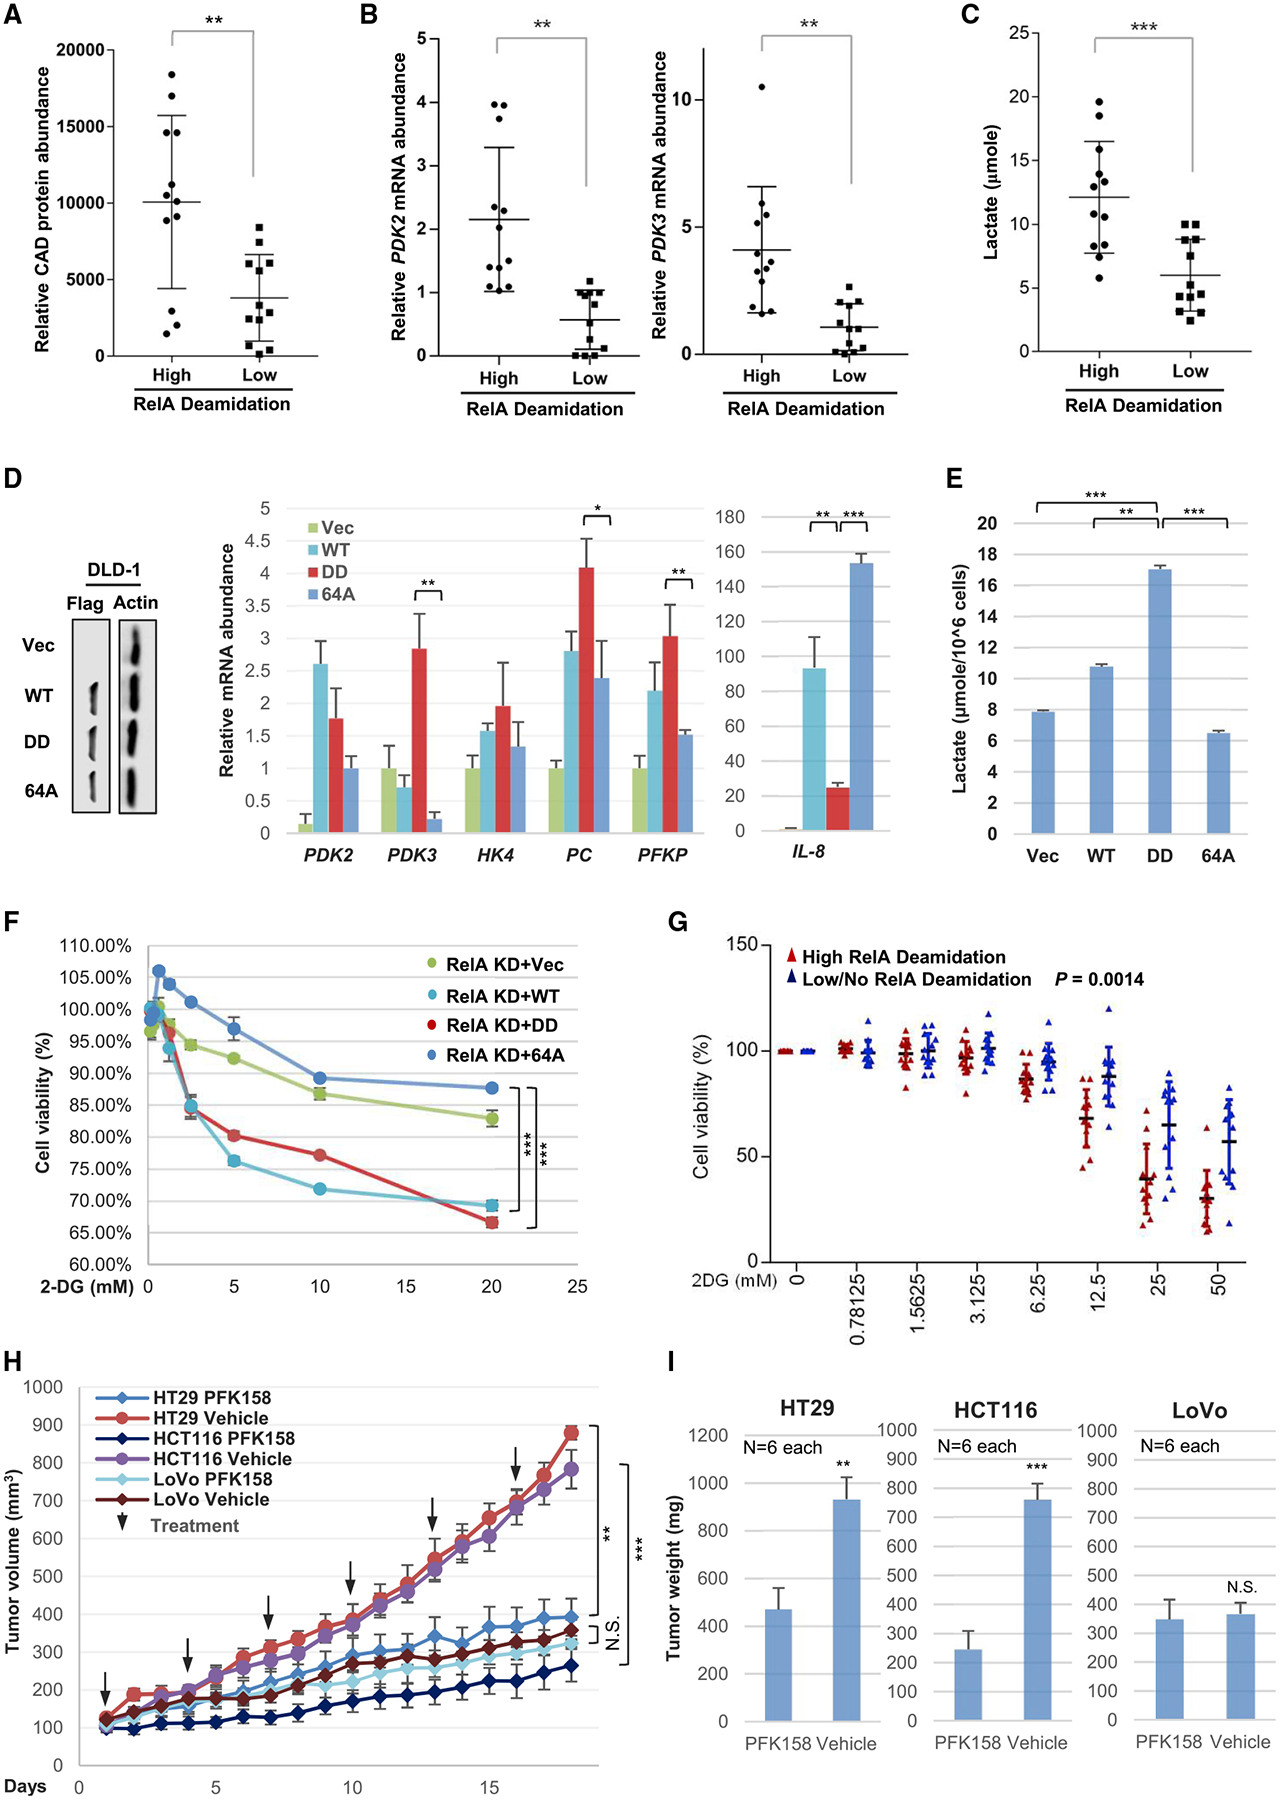
(A–C) Human cancer cell lines of the lung, colorectum, and breast were assayed for RelA deamidation and grouped into high- and low-deamidation categories. The mRNA abundance of CAD (A), PDK2 and PDK3 (B), and lactate concentration (C) quantified in medium at 14 h after passaging.
(D and E) Immunoblots of whole cell lysates from DLD-1 colorectal cancer cells, with low levels of CAD and RelA deamidation, which express exogenous wild-type RelA (WT), RelA-DD and RelA-64A (left panels), and relative mRNA abundance of indicated glycolytic genes analyzed by real-time PCR (D). Lactate concentration in medium at 14 h after passaging (E).
(F) Cell viability of RelA-knockdown (RelA KD) HCT116 cells reconstituted with wild-type RelA (WT), RelA-DD (DD), or RelA-64A (64A) and treated with 2-deoxyglucose (2-DG).
(G) Cell viability of the panel of human cancer cell lines treated with 2-DG as analyzed in (F). Red and blue dots denote individual data point of cancer cell lines with high and low levels of RelA deamidation, respectively.
(H and I) Tumor growth in mice inoculated with HT29 and HCT116 colorectal cancer cells with high CAD and RelA deamidation, and LoVo with low CAD and RelA deamidation, and treated with vehicle or PFK158 (an inhibitor of PFPKB3, 25 mg/kg) (I), and tumor weight in euthanized mice (J).
Data are presented as mean ± SD. Significance was calculated using two-tailed, unpaired (paired for Figures 6F–6H) Student’s t test. **p < 0.01; ***p < 0.001; ns, non-significant. See also Figures S9 and S10.
Next, we tested whether the glycolysis elevated by deamidated RelA renders these cells sensitive to glycolytic inhibitors. To test this idea, we first applied 2-DG to reconstituted HCT116 cell lines. We found that RelA-DD and wild-type RelA sensitized HCT116 cells to 2-DG, while RelA-64A had no apparent effect (Figure 6F). Using a panel of 24 cancer cell lines, we profiled their sensitivity to 2-DG by determining cell growth. This analysis showed that cell lines with high RelA deamidation also demonstrated high sensitivity to 2-DG (Figures 6G and S10D). On the other hand, cell lines with low RelA deamidation were generally resistant to 2-DG treatment. Similar results were obtained with PFK158 (Clem et al., 2013), an inhibitor of PFKFB3 (Figures S10E and S10F). These results indicate that CAD-mediated RelA deamidation is crucial for the glycolytic metabolism and proliferation of cancer cells.
To further explore the role of RelA deamidation in tumorigenesis, we determined whether cancer cells with high RelA deamidation are more sensitive to PFK158, a PFKP inhibitor, in nude mice than those with low RelA deamidation. We chose three human colorectal cancer cell lines, two with high RelA deamidation (HCT116 and HT29) and one with low RelA deamidation (LoVo). These cells were transplanted into nude mice and PFK158 was applied every 3 days. Remarkably, PFK158 reduced the growth rate of tumors derived from HCT116 and HT29 cells by ~80% and ~75%, respectively (Figure 6H). This was further supported by final tumor weight (Figures 6I and S10G). By contrast, PFK158 had no significant effect on the growth or weight of tumors derived from LoVo cells (Figures 6H, 6I, and S10G). In conclusion, RelA deamidation correlates with sensitivity to inhibitors of glycolytic enzymes in cancer cells.
A Subset of Cancer-Associated Mutations Render RelA Highly Deamidated and the Ability to Promote Glycolysis and Fuel Cell Proliferation
NF-κB transcription factors are implicated in oncogenesis, most notably for their function in provoking inflammation and resisting apoptosis, although opposing activities in tumorigenesis were reported (Perkins, 2004). Our study showed that deamidated RelA predisposes cells to aerobic glycolysis and fuels cell proliferation, suggesting its contribution to carcinogenesis. Mutations in the RELA gene are found in a number of human cancers, but their roles in tumorigenesis have not yet been characterized (Figure 7A). Exploring the human TCGA (The Canceer Genome Atlas) dataset, we focused on those mutations that cluster in the Rel homology domain. We introduced these mutations into human RelA and examined NF-κB activation by reporter assays. We reasoned that mutations impairing NF-κB activation likely give RelA new functions, e.g., glycolytic reprogramming. An NF-κB reporter assay identified a panel of mutations that partly or severely impair NF-κB activation of RelA (Figure 7B). Mutations of R33H, R187C, V199A, E211K, or I250V partly impaired, while mutations of G208S, G209V, D243Y, P256L, or S276F abolished, NF-κB activation (Figure 7C). These RelA mutants were expressed in LoVo cells that have low RelA deamidation to assess their deamidation status. RelA mutants containing R187C, V1991A, G209V, and E211K showed higher deamidation as analyzed by 2DGE (Figure 7D). Moreover, the expression of these four RelA mutants in RelA-depleted HCT116 cells induced the expression of HK4, PFKP, PDK2, and PDK3, and the production of lactate (Figures 7E and 7F). The RelAR33H mutant, although with low deamidation, upregulated the expression of glycolytic enzymes and promoted lactate production via unknown mechanisms likely independent of RelA deamidation. The increase in glycolytic metabolism also correlated with elevated cell proliferation (Figure 7G). Finally, these RelA mutants promoted tumor formation in nude mice, indicative of their growth-promoting activity in vivo (Figure 7H). Collectively, these results indicate that a subset of RelA mutations endow RelA with glycolysis-promoting activity, fueling cell proliferation and tumor progression.
Figure 7. Naturally Occurring RelA Mutations in Human Cancers Predispose RelA to Deamidation and Glycolysis to Fuel Cell Proliferation.
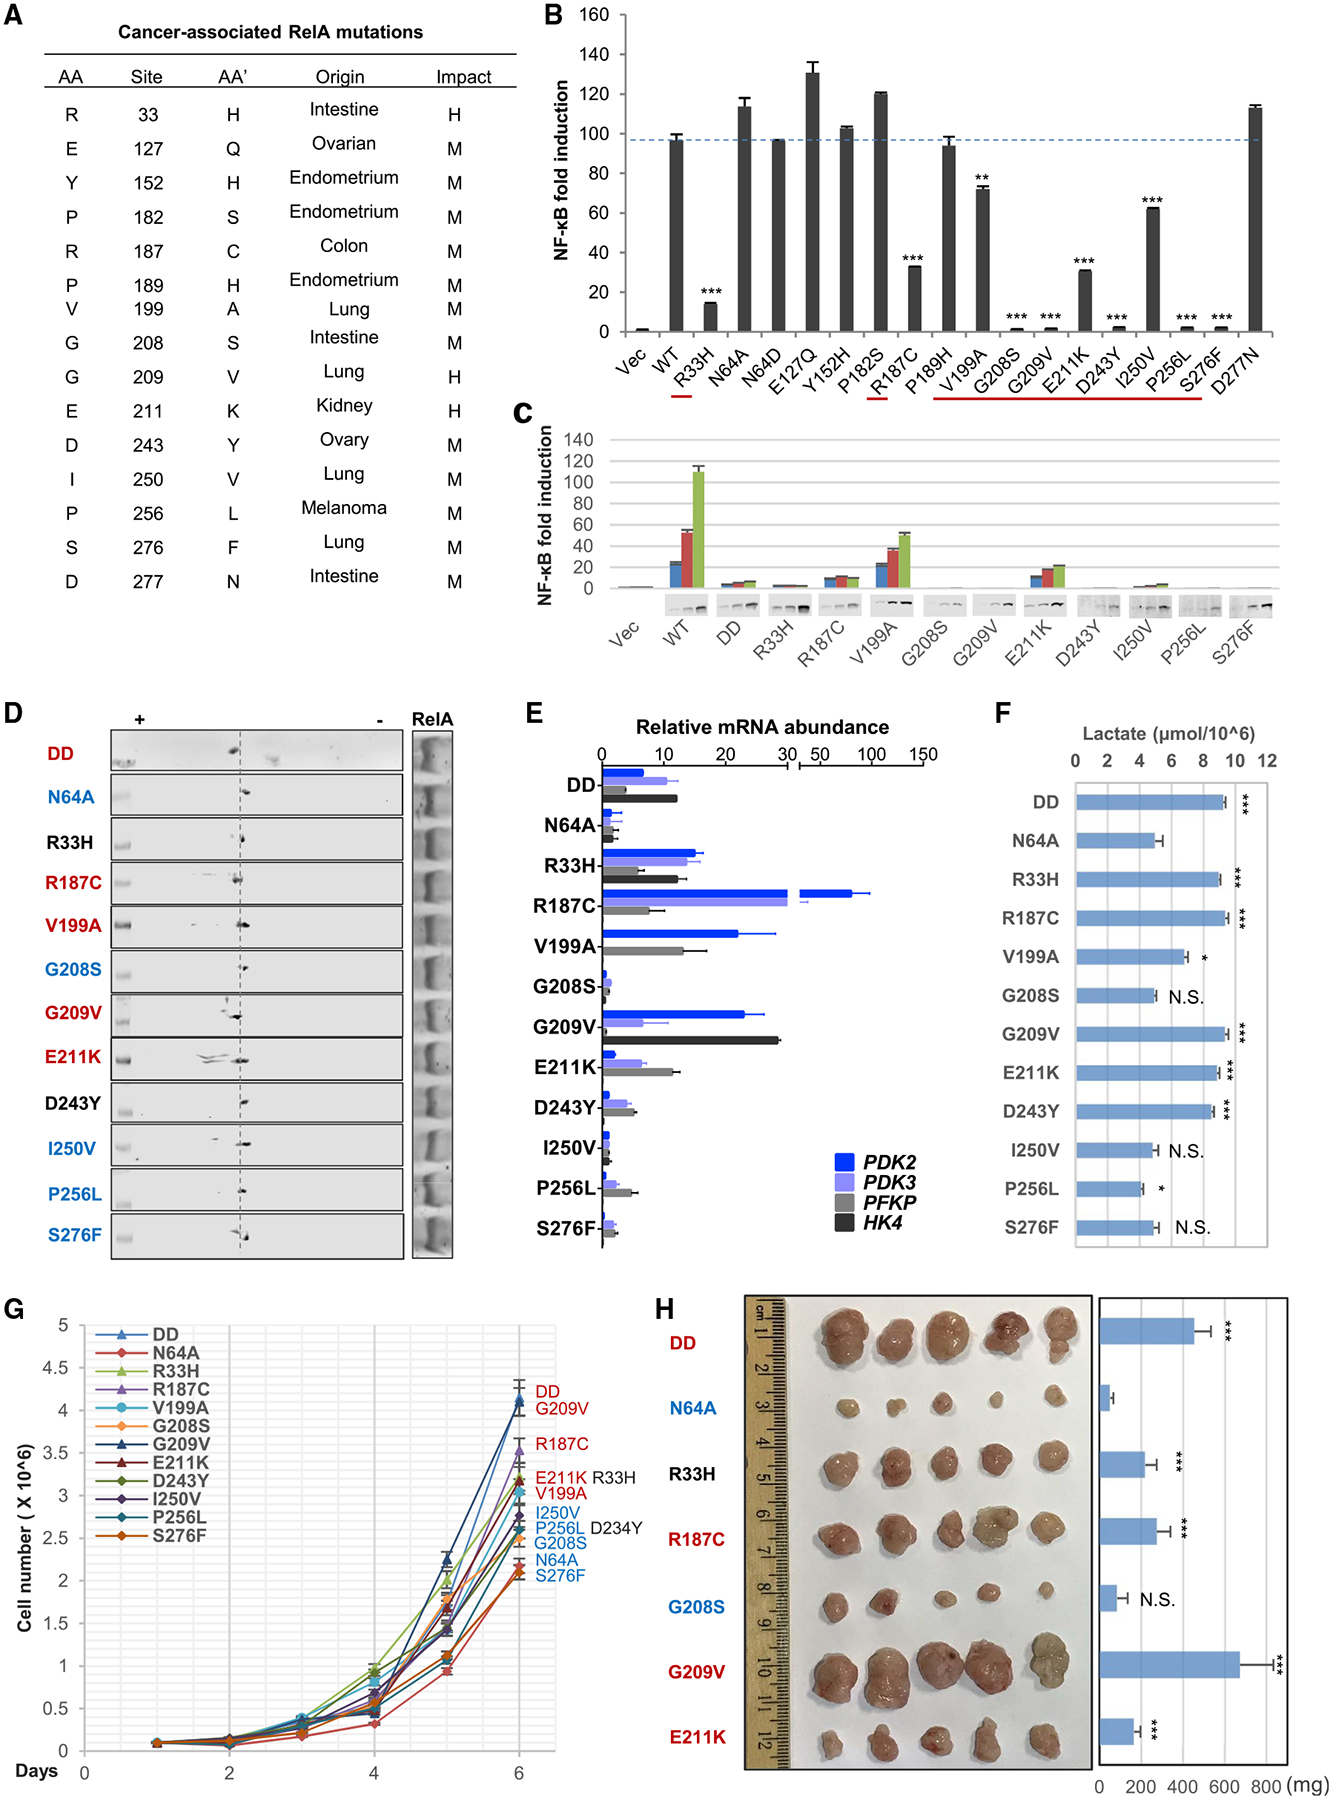
(A–C) Naturally occurring mutations in human RELA characterized from TCGA public domain (A), NF-κB activation by RelA mutants analyzed by luciferase reporter assay, with those of reduced NF-κB activation underlined by red lines (B), and NF-κB activation of the underlined RelA mutants by luciferase report assay with immunoblots of RelA proteins at the bottom (C).
(D–F) Immunoblots after two-dimensional gel electrophoresis analysis of whole cell lysates from LoVo cells reconstituted with RelA mutants of reduced NF-κB activation (D). RelA mutants in red indicate elevated deamidation. The mRNA abundance of glycolytic genes analyzed by real-time PCR (E), and lactate production in the medium at 14 h after passaging (F).
(G and H) Cell proliferation (G) and tumor formation in nude mice (H) of reconstituted HCT116 cells as described in (D).
Data are presented as mean ± SD. Significance was calculated using two-tailed, unpaired Student’s t test. **p < 0.01; ***p < 0.001; ns, non-significant.
DISCUSSION
Key cellular biological processes are often coupled to the metabolic status of a cell. Our understanding of how metabolism is tailored for distinct bioprocesses, such as immune responses, cell replication, and transformation, has advanced significantly in the past two decades, specifically from studies using immune and cancer cells. However, how distinct metabolically demanding bioprocesses, such as an inflammatory response and cell proliferation, are coordinated in the same cell remains poorly defined. We report here that during cell cycle progression, CAD-mediated RelA deamidation shuts down NF-κB-mediated proinflammatory responses, whereas aerobic glycolysis is promoted to fuel cell proliferation. Our study uncovers a mechanism by which cells funnel energy and metabolic flux to support replication; namely, via deamidation of a key transcription factor to specify downstream gene expression.
CAD Is a Bona Fide Protein Deamidase
To date, CAD has been studied for its activity in de novo pyrimidine synthesis that supports the increased need for nucleotides during cell proliferation (Sigoillot et al., 2003). We report here that CAD also programs cellular metabolism via deamidating RelA, thus driving the expression of key metabolic enzymes, particularly those of the glycolytic pathway. This study identifies CAD as a genuine deamidase that is sufficient to deamidate RelA in vitro and in cells, supporting the hypothesis that cellular GATs are intrinsically protein deamidases in metazoans. In synchronized cells, RelA deamidation peaks in late S phase, when CAD is known to be active in catalyzing pyrimidine synthesis, suggesting that the deamidase activity of CAD parallels its nucleotide-synthesizing activity in cell proliferation. Conceivably, both the activity in pyrimidine synthesis and ability to promote glycolysis via deamidation of RelA by CAD are required for anabolism in S phase and cell proliferation. Aerobic glycolysis driven by CAD-mediated RelA deamidation supplies glycolytic intermediates for nucleotide synthesis, setting up the stage for CAD-mediated pyrimidine synthesis.
Our study on the deamidase activity of CAD supports the emerging theme that metabolic enzymes can assume a nonmetabolic function. For example, glycolytic enzymes are originally known to act on central carbon metabolites, which are small molecules in nature. However, pyruvate kinase M2 (PKM2) has been recently shown to localize to the nucleus and phosphorylate his-tone H3 (Yang et al., 2012), thereby regulating gene expression via epigenetic modification. An in vitro screen using protein micro-assay identified more than 100 human proteins that can be phosphorylated by PKM2, suggesting more regulatory roles of PKM2 beyond metabolism (He et al., 2016). HK1 can autophosphorylate and phosphorylate histone H2A (Adams et al., 1991), although the biological significance of its kinase activity remains unknown. Similarly, 6-phosphofructo-2-kinase/fructose-2,6-bisphophatase 4 (PFKFB4) phosphorylates and activates the oncogenic steroid receptor coactivator 3 (SRC-3) to drive breast cancer (Dasgupta et al., 2018). These enzymes, together with CAD and PFAS, demonstrate enzymatic activity to modify both small molecules (such as metabolites) and large proteins under physiological conditions, qualifying them as moonlighting enzymes (Huberts and van der Klei, 2010). Whether other GATs possess nonmetabolic activities via protein deamidation to regulate fundamental biological processes begs for further investigation.
Deamidation Shunts RelA from Mediating the Expression of Inflammatory Genes to that of Glycolytic Enzymes
NF-κB-regulated gene expression underpins a diverse spectrum of biological processes such as inflammation, apoptosis, and tumorigenesis. RelA is the transcriptionally active subunit of the prototype p50-RelA dimer. Post-translational modifications, e.g., phosphorylation and acetylation, of RelA have been reported to choreograph the timing and intensity of expression of NF-κB-responsive genes via recruitment of transcription coactivators or suppressors (Huang et al., 2010). For example, phosphorylation of serine 276 within the transactivation domain of RelA facilitates the interaction with CBP-p300 and subsequent activation of RelA-bound promoters (Zhong et al., 1998). On the other hand, phosphorylation of serine 536 of RelA in macrophages induces RelA degradation to terminate NF-κB activation (Pradère et al., 2016). Our study describes an unprecedented function of deamidation in shunting expression of NF-κB-dependent genes to that of glycolytic enzymes. Interestingly, RelA deamidation also downregulates the expression of components of mitochondrial oxidative phosphorylation. This is consistent with the report that NF-κB activation is required to promote mitochondrial oxidative phosphorylation via regulated gene expression (Mauro et al., 2011). Previous structural analyses have provided no hints regarding how deamidation specifies the selectivity of promoters that RelA transactivates. Our biochemical analysis indicates that RelA-DD behaves similarly to wild-type RelA in binding to IκBα and translocating into the nucleus in response to TNF-α, but failed to associate with NF-κB-responsive promoters. Gel shift analysis using the N-terminal DNA-binding domain of RelA demonstrated that deamidation had no effect on its ability to directly bind an NF-κB consensus sequence (data not shown). These results suggest that RelA-DD either is not recruited to the promoter or is not tethered to the promoter after recruitment. The deamidated RelA-DD is severely impaired in its ability to interact with p50 compared to wild-type RelA, supporting the conclusion that deamidation abolishes the ability of RelA to interact with p50 and to activate NF-κB-responsive inflammatory gene expression.
In S phase, when CAD is highly active, cells replicate their genome in preparation for cell division. Transcription imposes an inevitable threat to hinder DNA replication machinery, which can lead to DNA damage and genomic instability (García-Muse and Aguilera, 2016). Thus, active transcription is restricted only to genes essential for the cell cycle, such as cyclins, cyclin-dependent kinases, and DNA replication components (Fischer and Müller, 2017). CAD-mediated deamidation and abrogation of the expression of NF-κB-dependent genes may ensure the shutdown of gene expression unnecessary for the cell cycle to prevent transcription-replication collision. Indeed, activated CAD resides in the nucleus (Sigoillot et al., 2005) and may deamidate nuclear RelA to prevent the expression of inflammatory genes.
How does deamidated RelA activate the expression of glycolytic enzymes? Transcription factors function as ensembles that contain additional coregulators and their responsive elements in the promoter. Cell cycle-dependent transcription factors may cooperate with deamidated RelA at the promoters of the glycolytic enzymes to enable RelA-mediated gene expression. E2F coactivators regulate the expression of genes crucial for the G1 to S transition and are implicated in RelA-mediated gene expression under various conditions (Ankers et al., 2016; Araki et al., 2008). Future experiments, determining whether cell cycle-dependent transcription factors such as E2F and Myc (Meyer and Penn, 2008) are involved in gene expression induced by deamidated RelA, will elucidate the mechanism of deamidation in specifying promoters of transcription.
Glycolysis Enabled by Deamidated RelA Is Crucial for Tumorigenesis
Aerobic glycolysis is crucial for normal cell proliferation and is a hallmark of highly proliferative cancerous cells (Hanahan and Weinberg, 2011). Stratifying a number of human cancer cell lines of the colorectum, breast, and lung for their CAD expression, RelA deamidation and expression of glycolytic enzymes identified nearly half of them with a signature gene expression pattern driven by deamidated RelA. Moreover, a number of RelA mutants that are frequently found in human tumors demonstrated reduced NF-κB activation alongside increased RelA deamidation and aerobic glycolysis. These findings suggest that the gain of function in metabolic reprogramming of tumor-associated RelA mutants, although it impairs NF-κB activation, is advantageous for cancer cell proliferation. Indeed, inhibitors of key glycolytic transporters or enzymes (e.g., GPI and PFPK) potently suppress the growth of human cancer cell lines ex vivo and in vivo in concordance with their level of CAD-mediated RelA deamidation.
NF-κB activation facilitates tumorigenesis via halting apoptosis of cancerous cells and maintaining smoldering inflammation of the tumor microenvironment (Zhang et al., 2017). Here, we uncovered a cryptic function of RelA in promoting aerobic glycolysis, cancer cell proliferation, and tumorigenesis. CAD deamidates RelA to enable its alternate function in activating glycolytic enzyme expression and promoting aerobic glycolysis, thus coupling glycolysis to nucleotide synthesis. The upregulated glycolytic enzymes, such as Glut3, HK4, PFKP, PKLR, PDK3, and PC, translate into significantly elevated intracellular metabolites, particularly those of the lower portion, of the glycolytic pathway. The accumulation of these metabolites may facilitate flux into the serine-glycine synthesis pathway that provides one-carbon units for nucleotide synthesis (Vander Heiden et al., 2009). Indeed, the expression of RelA-DD, but not RelA-64A, up-regulates glycolytic serine synthesis by ~120%. The effect of the glycolytic serine synthesis is further accentuated by the report that the glycolytic serine synthesis is coupled to serine uptaken from extracellular milieu to avoid one-carbon unit wasting (Pa-cold et al., 2016), implying that the net increase in intracellular serine may be amplified by elevated uptake rate. In addition to one-carbon unit, aerobic glycolysis also supplies reducing power in the form of NADH or NADPH vital for the synthesis of nucleotides, lipids, amino acids, and other cellular building blocks (Cantor and Sabatini, 2012). The glycolysis-branched pentose phosphate pathway (PPP) also generates NADPH, and multiple components of the PPP pathway were upregulated by deamidated RelA-DD. The elevated expression of PC and PDK is expected to funnel pyruvate to synthesize oxaloacetate and malate. The glycolytic malate synthesis likely facilitates the balance of reducing power and carbon intermediates between the cytosol and the mitochondrial compartment, an essential process for proliferating cells (LaNoue and Williamson, 1971; Locasale and Cantley, 2011). Thus, CAD-mediated RelA deamidation choreographs a metabolic program to promote nucleotide synthesis. In essence, CAD-mediated deamidation and downstream gene expression, empowered by deamidated RelA, are common features of cancer cells, unveiling a fundamental mechanism underlying tumor-associated aerobic glycolysis and suggesting alternative cancer therapies.
Limitations of Study
The limitation of this study is the reliance on cultured cells, and thus future work entailing genetically modified rodent models (e.g., RelA-DD knockin and CAD-inducible knockout) will be necessary to establish the in vivo physiological and pathological roles of CAD-mediated RelA deamidation. Likewise, in vivo studies with genetically engineered animal models of human cancer are needed to determine whether this pathway can be pharmacologically targeted to treat cancer. In addition to tumor cells, immune cells such as T cells and macrophages quickly engage a glycolytic metabolic program to enable immune activation when encountered with microbial antigens (Chang et al., 2013; Fox et al., 2005; O’Neill et al., 2016). Whether the CAD-mediated RelA deamidation contributes to these metabolic processes as well remains to be determined.
STAR★METHODS
RESOURCE AVAILABILITY
Lead Contact
Further information and requests for reagents should be directed and will be fulfilled by the Lead Contact, Pinghui Feng (pinghuif@usc.edu).
Materials availability
All unique/stable reagents generated in this study are available from the Lead Contact without restriction.
Data and Code Availability
The accession numbers for RNA-sequencing datasets reported in this paper are publicly available at the NCBI Gene Expression Omnibus database (https://www.ncbi.nlm.nih.gov/geo) under accession numbers GEO: GSE132868 and GSE132871.
EXPERIMENTAL MODEL AND SUBJECT DETAILS
Cell Culture
HEK293T, HCT116, SW480, HT29, Rela−/− mouse embryonic fibroblasts (MEF) and hTERT immortalized human fibroblasts (BJ5) were cultured in Dulbecco’s modified Eagle’s medium (DMEM, Corning) supplemented with 10% heat-inactivated fetal bovine serum (FBS; HyClone), penicillin (100 U/mL) and streptomycin (100 μg/mL). THP-1, T47D, H1975 and DLD-1 cells were cultured in RPMI 1640 medium supplemented with 10% FBS and antibiotics. LoVo cells were cultured in F12K medium (Thermofisher) supplemented with 10% FBS and antibiotics. All other cancer cell lines were cultured in their corresponding medium according to the ATCC recommendation.
Mice
Inbred and outbred male homozygous Foxn1nu mice (6 weeks of age) were purchased from the Jackson Laboratory and were subjected to sterile animal housing. Mice of 7-week-old were used for all the tumor xenograft experiments. Mice were randomized into the different treatment and control groups equilibrated for body weight and age. Mice were fed with regular diet. All experiments were performed following approval by the IACUC committee of University of Southern California (protocol number: 11730). Mice were held in SPF conditions on an individually ventilated rack HEPA-filtered system, on a 12:12 light cycle, with average temperatures ranging from 70°F to 74°F. Direct bedding consists of either “Sani-Chips” (hardwood chips) or “Diamond Dry” paper processing by-product. Mice were fed with either Purina 5053 Pico Lab irradiated rodent diet or Purina 5525 Pico Lab high energy irradiated breeder diet, and with reverse osmosis water from an automatic watering source.
Microbes
Sendai virus (Cantell strain) was purchased from Charles River. Salmonella Typhimurium was a gift from Dr. Andrew Ouellette at University of Southern California.
Plasmids
Luciferase reporter plasmids for the NF-κB, IFN-β promoter, RelA and its truncated mutants, RIG-I-N, MAVS, IKKβ, TBK1 and RelA were described previously (Dong et al., 2010; Dong and Feng, 2011; Dong et al., 2012; He et al., 2015; Seth et al., 2005). The non-silencing (control) shRNA and shRNA for human glutamine amidotransferases (CAD, PFAS, CTPS1/2, GMPS, PPAT, GFPT1/2, ASNS, NADSYN1, CPS1) and human UMPS were purchased from Thermo Scientific. Mammalian expression plasmid (pcDNA5 with Flag-tag sequence) for CAD was generated by molecular cloning, based on its cDNA construct purchased from Addgene. All point mutants, including CAD-C252S, RelA-N64A, RelA-N64D, RelA-N64D/N139D and cancer-associated RelA mutations were generated by site-directed mutagenesis and confirmed by sequencing. Lentiviral expression plasmids for RelA mutants were generated in the vectors of pCDH-CMV-EF1-PURO or pCDH-CMV-EF1-Hygro by molecular cloning.
METHOD DETAILS
Quantitative Real-time PCR (qRT-PCR)
Quantitative Real-time PCR was performed as previously described (Zhao et al., 2016). Cells were infected with the indicated shRNAs or synchronized to the indicated time point. Total RNA was extracted using TRIzol reagent (Invitrogen). Complementary cDNA was synthesized from total RNA using reverse transcriptase (Invitrogen). cDNA was diluted, and analyzed by qRT-PCR using SYBR Green Master Mix (Applied Biosystems) with Step-One PCR instrument (Applied Biosystems). Relative mRNA expression for each target gene was calculated by the 2−ΔΔCt method using β-actin as an internal control. The sequences of qRT-PCR primers are listed in Table S1.
Lentivirus-Mediated Stable Cell Line Construction
Lentiviruses were produced as previously described (Dong and Feng, 2011; Feng et al., 2008). Briefly, HEK293T cells were transfected with the packaging plasmids VSV-G, DR8.9 and the pCDH lentiviral expression vector or lentiviral shRNA plasmids. At 48 h post transfection, the supernatant was harvested and filtered (and concentrated by ultracentrifugation if necessary). HEK293T cells, MEFs, THP-1, HCT116, LoVo or HFF cells were infected with the supernatant in the presence of polybrene (8 μg/mL) with centrifugation at 1800 rpm for 50 min at 30°C. Cells were selected at 48 h post infection and maintained in 10% FBS DMEM supplemented with puromycin (1~2 μg/mL) or hygromycin (200 μg/mL).
To establish RelA-reconstituted HCT116 or SW480 cells, cells were infected with puromycin-resistent lentiviral shRNA targeting the 3′UTR of RelA mRNA and RelA depletion was validated by immunoblot. RelA-depleted cells were infected with hygromycin-resistent lentivirus containing wild-type RelA, RelA-DD or RelA-64A. Reconstituted cells were then selected and maintained with puromycin (1 μg/mL) and hygromycin (200 μg/mL).
To establish CAD-knockout and P50-knockout cell lines, HEK293T were transduced with lentivirus expressing sgRNA for P50 (pL-CRISPR.EFS.PAC-sgRNA-Targeting-P50, Table S1, Exon 6) or CAD (pL-CRISPR.EFS.PAC-sgRNA-Targeting-CAD, Table S1, Exon6) and selected with 1 μg/mL puromycin in DMEM containing 10% FBS. Medium was supplemented with 10 μg/mL Uridine post lentiviral infection for sgRNA targeting CAD. Single colonies were isolated and screened by immunoblotting with P50/CAD antibody. CAD knockout cell lines were kept culturing in the presence of 10 μg/mL Uridine.
To establish CAD-Flag knockin cell line, HCT116 was transduced with lentivirus expressing sgRNA for CAD (pL-CRISPR.EFS.PAC-sgRNA-Targeting-CAD, Table S1, Exon 43), together with the transfection of a donor plasmid (pFETCh_Donor, EMM0021, Addgene) containing 5′- and 3′-homology arms with sgRNA NGG-mutation. Single colonies were then isolated and screened by immunoblotting with CAD and Flag antibody. The positive clone was cultured in regular DMEM containing 10% FBS.
Microbes Infection and Molecule Treatment
Sendai virus was used for infection at [100 HA/mL]. Infection lasted for 2 h for the cell synchronization and two-dimensional gel electrophoresis (2DGE), 6 h for qRT-PCR analyses, 16 h for ELISA assays and 24 h for dual-luciferase reporter assays. Salmonella Typhimurium (PhoPc) was used for infection at 30 CFU/cell for 12 h. Recombinant TNF-α was administered at 10 ng/mL for 30 min for co-immunoprecipitation assays and 2DGE, and 6 h for qRT-PCR analyses. Lipopolysaccharide was administered at 100 ng/mL for 30 min for 2DGE analysis, 6 h for qRT-PCR analyses and 16 h for ELISA assays.
Mouse Embryonic Fibroblasts Extraction
Mouse embryonic fibroblasts were extracted from the fetuses of RelA-DD knock-in C57BL/6 mice (made by Cyagen) at day 14 of gestation. Briefly, the head and liver were removed, and the embryo was washed with PBS, minced and digested with Trypsin (Corning). DMEM containing 10% FBS was subsequently added and cells were cultured and passaged for 3 generations before being used for experiments.
Dual-Luciferase Reporter Assay
HEK293T cells, seeded in 24-well plates (~50% cell density), were transfected with an IFN-β or NF-κB reporter plasmid cocktail (50 ng of luciferase reporter plasmid and 5 ng of pRL Renilla luciferase control vector) and the expression plasmids (empty plasmid, one or multiple plasmids depending on the experiment) by calcium phosphate precipitation. Whole cell lysates at 30 h post-transfection were used to determine the activity of firefly luciferase and Renilla luciferase by a microplate reader (FLUOstar Omega). When Sendai virus (SeV) was used, cells were infected with SeV [100 HA/mL] at 24 h post-transfection and whole cell lysates were harvested at 48 h.
Protein Expression and Purification
HEK293T cells were transfected with the expression vector containing Flag-tagged genes of interest for 48 h. Cells were harvested and lysed with Triton X-100 buffer (20 mM Tris, pH 7.5, 150 mM NaCl, 1.5 mM MgCl2, 20 mM β-glycerophosphate, 1 mM sodium orthovanadate, 10% glycerol, 0.5 mM EGTA, 0.5% Triton X-100) supplemented with a protease inhibitor cocktail (Roche). Whole cell lysates were sonicated and centrifuged at 12,000 rpm for 15 min. Supernatant was harvested, filtered, pre-cleared with protein A/G agarose beads at 4°C for 1 h and then incubated with anti-Flag agarose beads at 4°C for 4 h. The agarose beads were washed extensively and eluted with 0.2 mg/mL 3xFlag peptide. The purity of the eluted proteins was analyzed by SDS gel electrophoresis and silver staining.
Co-immunoprecipitation (Co-IP) and Immunoblotting
For Co-IP using exogenous protein, HEK293T cells were transfected with indicated expression plasmids for 48 h. For Co-IP using endogenous proteins, cells were directly harvested for experiments. Whole cell lysates were prepared with NP40 buffer (50 mM Tris-HCl, pH 7.4, 150 mM NaCl, 1% NP-40, 5 mM EDTA) supplemented with 20 mM β-glycerophosphate and 1 mM sodium orthovanadate. Whole cell lysates were sonicated, centrifuged and pre-cleared with protein A/G agarose for 1 h. Pre-cleared samples were then incubated with indicated antibodies overnight and protein A/G agarose for 1 h at 4°C, or with antibody/glutathione-conjugated agarose for 4 h at 4°C. The agarose beads were washed extensively, and samples were eluted by boiling at 95°C for 10 min. Precipitated proteins were analyzed by SDS gel electrophoresis and immunoblotting.
All immunoblotting was performed using the indicated primary antibodies (1:1000 dilution) and IRDye800-conjugated secondary antibodies (1:10,000 dilution, Li-Cor). Proteins were visualized by Odyssey infrared imaging system (Li-Cor).
Oxygen Consumption Rate and Extracellular Acidification Rate
Approximately 1.5 × 10⁵ of HCT116 stable cells were seeded on a poly-D-lysine coated XF24 plate. Oxygen consumption rate (OCR) was measured using the mitochondrial stress test kit in Seahorse XF Base Medium media (10 mM glucose, 2 mM L-glutamine, and 1 mM sodium pyruvate) under basal conditions (ECAR) and in response to 1.0 μM oligomycin, 0.5 μM fluoro-carbonyl cyanide phenylhydrazone (FCCP) and 0.5 μM rotenone/antimycin A with the XF24 Extracellular Flux Analyzer (Agilent).
Approximately 3 × 10⁴ of HCT116 stable cells were seeded on a poly-D-lysine coated XF96 plate. Extracellular acidification rate (ECAR) was measured using the glycolysis stress test kit in Seahorse XF Base Medium media (10 mM glucose, 2 mM L-glutamine, and 1 mM sodium pyruvate) in response to 20 mM glucose, 1 μM oligomycin and 50 mM 2-Deoxyglucose with the XF96 Extracellular Flux Analyzer (Agilent).
Cell Proliferation Assay
The in vitro cell viability test was performed with Cell Proliferation Kit II (XTT) according to the manufacturer’s recommendation (Sigma). Briefly, cells were seeded at a density of 1 × 10⁴ cells per well in 96-well culture plates. After 15 h, the medium was replaced with one that contains increasing concentrations of 2-deoxyglucose (2-DG, Sigma) or PFK158 (SelleckChem) and cells were cultured for 24 h. XTT was then added to the medium and cell viability in each well was measured by absorption at a wavelength of 475 nm, with 660 nm as the reference wavelength. Each data point was performed in triplicate. Cell viability was presented as the percentage of absorption at a given concentration of inhibitors divided by the maximum absorption at zero concentration.
RNA Library Preparation and Sequencing
RNA sequencing libraries were prepared using the KAPA RNA-Seq library preparation kit (KAPA Biosystems, Roche) for mRNA sequencing according to the manufacturer’s protocol. RNA sequencing was performed on Illumina NextSeq 500 at the USC Molecular Genomics Core.
RNA sequencing results were processed using the new Tuxedo protocol. Reads were aligned to the hg38 genome or mm10 using HISAT (v2.1.0)(Kim et al., 2015). Transcripts were assembled and quantified using StringTie (v1.3.6)(Pertea et al., 2016). Differential gene expression was analyzed using DESeq2 (v1.16.1)(Love et al., 2014), genes were annotated using KEGG(Kanehisa et al., 2016) and GO(Mi et al., 2017) database, and annotated genes were subjected to clusterProfiler(Yu et al., 2012) for pathway enrichment analysis.
Sequencing data are available at: https://www.ncbi.nlm.nih.gov/geo/ with the ID number GSE132868 and GSE132871.
Lactate Colorimetric Assay
Cancer cells (2 × 10⁵) were seeded in 12-well for 14 h. The medium was harvested and filtered by a 10kD MW spin filter (Thermo) and lactate was measured by the Lactate Assay Kit (Sigma) according to the manufacturer’s protocol. Tumor samples were homogenized in lactate assay followed by filtering according to the manufacturer’s protocol.
Cell Synchronization
S phase Synchronization: HCT116/BJ5 cells were seeded at 20% confluency and then synchronized by double thymidine block method as previously described (Chen and Deng, 2018). Briefly, cells were cultured in their corresponding medium containing 2 mM thymidine for 15 h then replaced with fresh medium for 10 h, followed by a second thymidine block (2 mM) to synchronize cells at the S phase checkpoint. Upon releasing by replacement of fresh medium, cells were harvested at multiple time points for western blotting, two-dimensional gel electrophoresis and real-time PCR analysis on indicated proteins/genes.
G0/G1 phase Synchronization: HCT116/BJ5 cells were seeded at 40% confluency and then synchronized by lovastatin method as previously described (Javanmoghadam-Kamrani and Keyomarsi, 2008). Briefly, cells were arrested in G0/G1 phase by incubation with medium containing lovastatin (10 μM) for 15 h. Upon releasing by replacing medium containing 100-fold excess of mevalonate, cells were harvested at multiple time points for western blotting, two-dimensional gel electrophoresis and real-time PCR analysis on indicated proteins/genes.
Metabolic Profiling and Isotope Tracing
Reconstituted HCT116 cells (2 × 10⁷) per sample (in triplicates) were harvested for metabolomics analysis performed by Metabolon Inc.
Isotope tracing experiments were performed as previously described(Delfarah et al., 2019; Jang et al., 2018; Sauer, 2006). For glycolytic rate analysis, ‘reconstituted’ HCT116 cells were cultured with medium containing [U-13C]-labeled glucose (Cambridge Isotope Laboratories) for 15 min. For Pyruvate Carboxylase (PC) activity, ‘reconstituted’ HCT116 cells were cultured with medium containing [1-13C]-pyruvate for 30 min. Metabolite extraction was performed upon labeling. For extraction of intracellular metabolites, cells were washed on ice with 1 mL ice-cold 150 mM ammonium acetate (NH4AcO, pH 7.3). 1 mL of −80°C cold 80% MeOH was added to the wells, samples were incubated at −80°C for 20 min, then cells were scraped off and supernatants were transferred into microfuge tubes. Samples were pelleted at 4°C for 5 min at 15k rpm. The supernatants were transferred into microfuge tube, the cell pellets were re-extracted with 200 μl ice-cold 80% MeOH, spun down and the supernatants were combined. Metabolites were dried at room temperature under vacuum and re-suspended in water for LC-MS run.
Samples were randomized and analyzed on a Q Exactive Plus hybrid quadrupole-Orbitrap mass spectrometer coupled to an UltiMate 3000 UHPLC system (Thermo Scientific). The mass spectrometer was run in polarity switching mode (+3.00 kV/−2.25 kV) with an m/z window ranging from 65 to 975. Mobile phase A was 5 mMNH4AcO, pH 9.9, and mobile phase B was acetonitrile. Metabolites were separated on a Luna 3 μm NH2 100Å (150 × 2.0 mm) column (Phenomenex). The flowrate was 300 μl/min, and the gradient was from 15% A to 95% A in 18 min, followed by an isocratic step for 9 min and re-equilibration for 7 min. All samples were run in biological triplicate.
Metabolites were detected and quantified as area under the curve based on retention time and accurate mass (≤5 ppm) using the TraceFinder 3.3 (Thermo Scientific) software. Raw data was corrected for naturally occurring 13C abundance(Moseley, 2010).
Two-dimensional Gel Electrophoresis
Cells (1 × 10⁶) were lysed in 150 μl rehydration buffer (8 M Urea, 2% CHAPS, 0.5% IPG Buffer, 0.002% bromophenol blue) by three pulses of sonication and whole cell lysates were centrifuged at 20,000 g for 15 min. Supernatants were loaded to IEF strips for focusing with a program comprising: 20 V, 10 h (rehydration); 500 V, 1 h; 1000 V, 1 h; 1000–5000 V, 4 h; 5000 V, 4 h. After IEF, strips were incubated with SDS equilibration buffer (50 mM Tris-HCl [pH8.8], 6 M urea, 30% glycerol, 2% SDS, 0.001% Bromophenol Blue) containing 10 mg/mL DTT for 15 min and then SDS equilibration buffer containing 2-iodoacetamide for 15 min. Strips were washed with SDS-PAGE buffer, resolved by SDS-PAGE, and analyzed by immunoblotting.
In Vitro Deamidation Assay
GST-RelA, CAD and CAD-C/S mutant were purified from transfected 293T cells to homogeneity as determined by silver staining. In vitro on-column deamidation of RelA was performed as previously reported (He et al., 2015; Zhao et al., 2016). Briefly, ~0.2 μg of CAD or CAD C/S, and 0.6 μg of GST-RelA (bound to glutathione-conjugated agarose) were added to a total volume of 30 μl. The reaction was carried out at 30°C for 45 min in deamidation buffer (100 mM Tris–HCl at pH 8.0, 100 mM KCl, 1 mM dithiothreitol, 20.2 mM aspartate, 1.5 mM ATP, 200 mM phosphoribosyl 5′-pyrophosphate, 3.5 mM MgCl2, and 5 mM NaHCO3). Protein-bound GST beads were washed with deamidation buffer and GST-RelA was eluted with rehydration buffer (8 M Urea, 2% CHAPS, 0.5% IPG Buffer, 0.002% bromophenol blue) at room temperature. Samples were then analyzed by two-dimensional gel electrophoresis and immunoblotting.
Xenograft Nude Mouse Model
A total of 1 × 10⁶ ‘reconstituted’ HCT116 cells or 2 × 10⁶ LoVo stably expressing RelA mutant cells (in log phase growth) in 100 μL PBS were injected subcutaneously in the dorsal flank of the mice (n = 5). Tumor size were measured with calipers three times a week. The tumor volume was calculated using the equation: Volume = (length × width2)/2. Tumors were harvested and weighed at Day 35 for the reconstituted HCT116 cells and Day 40 for the LoVo stable cells.
A total of 1 × 10⁶ HT29, HCT116 or LoVo cells (in log phase growth) in 100 μL PBS were injected subcutaneously in the dorsal flank of the mice (n = 12). Once adequate tumor volumes became established (minimum 100 mm3), the animals were randomized and divided into two groups. One group received intraperitoneal PFK158 (SelleckChem, 25 mg/kg body weight in 5% DMSO, 45% PEG300, 1% Tween80, once every three days for a total of 6 injections) and the other group was injected with buffer. Body weight and tumor size were measured with calipers every day. Tumors were harvested and weighed at Day 18 post treatment.
Mass Spectrometry Analysis
For identification of deamidation sites, HEK293T/Flag-RelA stable cell line was transfected with an expression plasmid containing CAD or CAD-C/S (deamidase-dead) mutant. Flag-RelA was purified by anti-Flag-conjugated agarose beads for 4 h at 4°C. Beads were then extensively washed and RelA was eluted with 3xFlag peptide at 0.2 mg/mL. Purified RelA was subjected to SDS-PAGE electrophoresis and gel slices were prepared for in-gel digestion and Mass Spectrometry analysis (USC Mass Spectrometry Core Facility).
Propidium Iodide Staining
Reconstituted HCT116 cells (2 × 10⁵) were harvested and washed in PBS. Cells were then fixed in 70% Ethanol for 30 min at 4°C, washed with PBS and treated with 50 μL of PBS containing RNase (100 μg/mL). A volume of 200 μL PBS containing propidium iodide (50 μg/mL, Sigma) was then added to the solution. Cells were analyzed by FACSCalibur (BD Biosciences) and 10,000 events were collected per sample. Data was analyzed by FlowJo.
Data Mining with cBioPortal
All data mining was performed using cBioPortal (Cerami et al., 2012; Gao et al., 2013). The study database includes Cancer Cell Line Encyclopedia (novatis/broad, Nature 2012), Colorectal Adenocarcinoma (TCGA and Genentech, Nature 2012), Breat Invasive Carcinoma (TCGA, Nature, 2012), Brain Lower Grade Glioma (TCGA, PanCancer Atlas), Stomach Adenocarcinoma (TCGA, PanCancer Atlas), Kidney Renal Clear Cell Carcinoma (BGI, Nature Genetics), Kidney Renal Clear Cell Carcinoma (TCGA, Nature, 2013), Small Cell Lung Cancer (CLCGP, Nat Genet 2012), Small Cell Lung Cancer (Johns Hopkins, Nat Genet 2012), Lung Adenocarcinoma (Broad, Cell 2012), Lung Squamous Cell Carcinoma (TCGA, Nature 2012), Ovarian Serous Cystadenocarcinoma (TCGA, Provisional), Skin Cutaneous Melanoma (TCGA, Provisional) and Ulterine Corpus Endometrial Carcinoma (TCGA, Nature 2013). RelA mutations were selected based on their risk impact factor (Medium and High). All searches were performed according to the cBioPortal’s online instructions.
QUANTIFICATION AND STATISTICAL ANALYSIS
Data are presented as mean ± standard deviation (SD), if not stated in the figure legend. Statistical analyses were performed by un-paired, two-tailed Student’s t test (unless specified). For more than two groups data were analyzed by ANOVA followed by the un-paired Student’s t test. Statistical analyses were performed with Excel or Graphpad Prism. A p value less than 0.05 is considered statistically significant. *, p < 0.05; **, p < 0.01; ***, p < 0.001. No statistical methods were used to estimate sample size. All samples were included in the analyses.
Supplementary Material
KEY RESOURCES TABLE
| REAGENT or RESOURCE | SOURCE | IDENTIFIER |
|---|---|---|
| Antibodies | ||
| RelA, F-6, mouse monoclonal | Santa Cruz | Cat# sc-8008; RRID: AB_628017 |
| RelA, C-20, rabbit polyclonal | Santa Cruz | Cat# sc-372; RRID: AB_632037 |
| P50, E-10, mouse monoclonal | Santa Cruz | Cat# sc-8414; RRID: AB_628015 |
| IκBα, C-21, rabbit polyclonal | Santa Cruz | Cat# sc-371; RRID: AB_2235952 |
| GST, Z-5, rabbit polyclonal | Santa Cruz | Cat# sc-459; RRID: AB_631586 |
| GFP, B-2, mouse monoclonal | Santa Cruz | Cat# sc-9996; RRID: AB_627695 |
| H3, AH3–120, mouse monoclonal | Santa Cruz | Cat# sc-56616; RRID: AB_2263811 |
| Tubulin, B-7, mouse monoclonal | Santa Cruz | Cat# sc-5286; RRID: AB_628411 |
| Cyclin A, H-432, rabbit polyclonal | Santa Cruz | Cat# sc-751; RRID: AB_631329 |
| PCB, E-5, mouse monoclonal | Santa Cruz | Cat# sc-365672; RRID: AB_10851628 |
| PDK3, RR-2, mouse monoclonal | Santa Cruz | Cat# sc-100535; RRID: AB_2268026 |
| CAD, A301–374A, rabbit polyclonal | Bethyl Laboratories | Cat# A301–374A-T; RRID: AB_937745 |
| Cyclin B1, V152, mouse monoclonal | Cell Signaling | Cat# 4135; RRID: AB_2233956 |
| Cyclin E, HE12, mouse monoclonal | Cell Signaling | Cat# 4129; RRID: AB_2071200 |
| RelA S536, 93H1, rabbit monoclonal | Cell Signaling | Cat# 3033; RRID: AB_331284 |
| Phospho-CAD (Ser1859) Antibody, rabbit | Cell Signaling | Cat# 12662; RRID: AB_2750934 |
| Flag, M2, mouse monoclonal | Sigma | Cat# F3165; RRID: AB_259529 |
| β-Actin, Ab8226, mouse monoclonal | Abcam | Cat# ab8226; RRID: AB_306371 |
| Chemicals, Peptides, and Recombinant Proteins | ||
| 6-Diazo-5-oxo-L-norleucine (DON) | Sigma | Cat# D2141; CAS# 157-03-9 |
| Human recombinant TNF-α | R&D systems | Cat# 210-TA |
| Mouse recombinant TNF-α | R&D systems | Cat# 410-MT |
| Lipopolysaccharides (E.coli O111:B4) | Sigma | Cat# L3023 |
| Lovastatin | LKT Labs | Cat# M1678; CAS# 75330-75-5 |
| (±)-Mevalonolactone | Sigma | Cat# M4667; CAS# 674-26-0 |
| Thymidine | Sigma | Cat# T1895; CAS# 50-89-5 |
| Uridine | Sigma | Cat# U3003; CAS# 58-96-8 |
| 2-Deoxyglucose | Sigma | Cat# D8375; CAS# 154-17-6 |
| Propidium Iodide | Sigma | Cat# P4170; CAS# 25535-16-4 |
| [U13C] Glucose | Cambridge Isotope Lab | Cat# CLM-1396 |
| [1-13C] Pyruvate | Sigma | Cat# 490709; CAS# 87976-71-4 |
| PFK158 | SelleckChem | Cat# S8807 |
| Critical Commercial Assays | ||
| Lactate Assay Kit | Sigma | Cat# MAK064 |
| Cell Mitochondria Stress Test Kit | Agilent | Cat# 103010–100 |
| Cell proliferation kit II | Sigma | Cat# 11465015001 |
| Glucose Uptake Colorimetric Assay Kit | Sigma | Cat# MAK083 |
| TRI reagent | Molecular Research Center | Cat# TR 118 |
| SYBR Green Master Mix | Sigma | Cat# S4438 |
| Human CCL5 ELISA kit | R&D systems | Cat# DRN00B |
| Human IL6 ELISA kit | Proteintech | Cat# KE00007 |
| Human IL8 ELISA kit | Proteintech | Cat# KE00006 |
| KAPA RNA-seq library kit | Roche | Sequencing.roche.com |
| Deposited Data | ||
| ‘Reconstituted’ HCT116 RNA-seq data | This paper | GEO: GSE132868 |
| Synchronized HCT116 RNA-seq data | This paper | GEO: GSE132868 |
| ‘Reconstituted’ Rela−/− MEF RNA-seq data | This paper | GEO: GSE132871 |
| Mendeley Data | This paper | https://doi.org/10.17632/shnf4m8khn.1 |
| Experimental Models: Cell Lines | ||
| HEK293T | ATCC | Cat# ACS-4500; RRID: CVCL_4V93 |
| HCT116 | ATCC | Cat# CCL-247; RRID: CVCL_0291 |
| THP-1 | ATCC | Cat# TIB-202; RRID: CVCL_0006 |
| Rela−/− MEF | Dr. Linfeng Chen, UIUC | N/A |
| MCF-7 | Dr. Min Yu, USC | N/A |
| T47D | Dr. Min Yu, USC | N/A |
| BT474 | Dr. Min Yu, USC | N/A |
| SKBR3 | Dr. Min Yu, USC | N/A |
| MDAMB231 | Dr. Min Yu, USC | N/A |
| HS578T | Dr. Min Yu, USC | N/A |
| SW480 | Dr. Chengyu Liang, USC | N/A |
| DLD-1 | Dr. Chengyu Liang, USC | N/A |
| Lim2045 | Dr. Chengyu Liang, USC | N/A |
| RKO | Dr. Chengyu Liang, USC | N/A |
| HT29 | Dr. Chengyu Liang, USC | N/A |
| Colo26 | Dr. Chengyu Liang, USC | N/A |
| LoVo | Dr. Chengyu Liang, USC | N/A |
| H1944 | Dr. Ite Laird Offringa, USC | N/A |
| H1975 | Dr. Ite Laird Offringa, USC | N/A |
| H522 | Dr. Ite Laird Offringa, USC | N/A |
| PC9 | Dr. Ite Laird Offringa, USC | N/A |
| H358 | Dr. Ite Laird Offringa, USC | N/A |
| H1648 | Dr. Ite Laird Offringa, USC | N/A |
| H23 | Dr. Ite Laird Offringa, USC | N/A |
| H2347 | Dr. Ite Laird Offringa, USC | N/A |
| HCC827 | Dr. Ite Laird Offringa, USC | N/A |
| BJ5–5ta | ATCC | Cat# CRL-4001; RRID: CVCL_6573 |
| Flag-CAD Knockin HCT116 | Home made | N/A |
| RelA Knockin MEF | Home made | N/A |
| A-253, ATCC HTB-41 | ATCC | Cat# TCP-1012 |
| SCC-15, ATCC CRL-1623 | ATCC | Cat# TCP-1012 |
| SCC-25, ATCC CRL-1628 | ATCC | Cat# TCP-1012 |
| FaDu, ATCC HTB-43 | ATCC | Cat# TCP-1012 |
| SCC-9, ATCC CRL-1629 | ATCC | Cat# TCP-1012 |
| Detroit 562, ATCC CCL-138 | ATCC | Cat# TCP-1012 |
| Experimental Models: Organisms/Strains | ||
| Homozygous Foxn1nu | Jackson Laboratory | NU/J 002019 |
| Homozygous Foxn1nu outbred | Jackson Laboratory | J:NU 007850 |
| Oligonucleotides | ||
| Human GATs shRNA | Thermofisher | N/A |
| Human UMPS shRNA | Thermofisher | N/A |
| qPCR Primers, see Table S1 | N/A | N/A |
| ChIP-qPCR Primers, see Table S1 | N/A | N/A |
| sgRNA Primers, see Table S1 | N/A | N/A |
| Software and Algorithms | ||
| Graphpad Prism Version 7.00 | Graphpad | http://www.graphpad.com |
| FlowJo | Tree Star | http://www.flowjo.com |
| R | N/A | http://www.r-project.org |
| Partek Flow Genomic Analysis | Partek | http://www.partek.com |
| DESeq2 | R package | http://bioconductor.org/packages/release/bioc/html/DESeq2.html |
| clusterProfiler | R package | https://bioconductor.org/packages/release/bioc/html/clusterProfiler.html |
| HISAT | R package | https://ccb.jhu.edu/software/hisat2/index.shtml |
| StringTie | R package | http://ccb.jhu.edu/software/stringtie/index.shtml |
| ggplot2 | R package | https://cran.r-project.org/web/packages/ggplot2/index.html |
| Others | ||
| Sendai Virus (SeV) | Charles River | PI-1, SV |
| Salmonella Typhimirium wild-type | Dr. Andrew Ouellette, USC | N/A |
Highlights.
CAD, the rate-limiting de novo pyrimidine synthesis enzyme, deamidates RelA
Deamidation shunts RelA from mediating an inflammatory response to aerobic glycolysis
Deamidation of RelA occurs in a cell cycle-dependent manner
Cancer cells hijack RelA deamidation to promote glycolysis and tumorigenesis
Context and Significance.
Cell proliferation and inflammatory response are two metabolically competing biological processes in non-immune cells. For instance, highly proliferating cells produce lower levels of inflammatory cytokines than nonproliferating cells. How cell proliferation attenuates inflammatory response remains unclear. Here, Zhao and colleagues show that the enzyme carbamoyl-phosphate synthetase, aspartate transcarbamoylase, and dihydroorotase (CAD) deamidates RelA, a subunit of the pro-inflammatory mediator NF-κB, to shunt the cell’s gene expression from those encoding inflammatory mediators to glycolytic enzymes. They also found that various cancer cell lines hijack CAD-mediated RelA deamidation via high CAD expression and/or RelA mutations to promote glycolysis and thus tumor proliferation. These data suggest that glycolysis driven by CAD-mediated RelA deamidation can potentially guide the stratification and treatment of diverse human cancers.
ACKNOWLEDGMENTS
We thank Drs. Chengyu Liang, Min Yu, and Ite Offringa for human cancer cell lines, Lin-Feng Chen for Rela−/− MEFs, Jiang-Jian Hao for mass spectrometry analysis, Andrew Ouellette for Salmonella Typhimurium, and Bridget Samuel for proof-reading our manuscript. This work was supported by grants from NIDCR (DE028973 to J.Z., DE027556 and DE026003 to P.F.) and NCI (CA221521 to P.F.), startup funds from the Herman Ostrow School of Dentistry of USC (P.F.) and CAMS (CAMS-I2M and 2016-I2M-1-005 to T.J.), and grants from National Natural Science Foundation of China (31671371 to T.J.) and Central Public Interest Scientific Institution of Basal Research (2016ZX310195, 2017PT31026, and 2018PT31016 to T.J.).
Footnotes
SUPPLEMENTAL INFORMATION
Supplemental Information can be found online at https://doi.org/10.1016/j.cmet.2020.04.006.
DECLARATION OF INTERESTS
The authors declare no competing interests.
REFERENCES
- Adams V, Griffin LD, Gelb BD, and McCabe ER (1991). Protein kinase activity of rat brain hexokinase. Biochem. Biophys. Res. Commun 177, 1101–1106. [DOI] [PubMed] [Google Scholar]
- Ankers JM, Awais R, Jones NA, Boyd J, Ryan S, Adamson AD, Harper CV, Bridge L, Spiller DG, Jackson DA, et al. (2016). Dynamic NF-κB and E2F interactions control the priority and timing of inflammatory signalling and cell proliferation. eLife 5, 10.7554/eLife.10473.27185527. [DOI] [PMC free article] [PubMed] [Google Scholar]
- Araki K, Kawauchi K, and Tanaka N (2008). IKK/NF-kappaB signaling pathway inhibits cell-cycle progression by a novel Rb-independent suppression system for E2F transcription factors. Oncogene 27, 5696–5705. [DOI] [PubMed] [Google Scholar]
- Ben-Sahra I, Howell JJ, Asara JM, and Manning BD (2013). Stimulation of de novo pyrimidine synthesis by growth signaling through mTOR and S6K1. Science 339, 1323–1328. [DOI] [PMC free article] [PubMed] [Google Scholar]
- Cantor JR, and Sabatini DM (2012). Cancer cell metabolism: one hallmark, many faces. Cancer Discov 2, 881–898. [DOI] [PMC free article] [PubMed] [Google Scholar]
- Cerami E, Gao J, Dogrusoz U, Gross BE, Sumer SO, Aksoy BA, Jacobsen A, Byrne CJ, Heuer ML, Larsson E, et al. (2012). The cBio cancer genomics portal: an open platform for exploring multidimensional cancer genomics data. Cancer Discov 2, 401–404. [DOI] [PMC free article] [PubMed] [Google Scholar]
- Chang CH, Curtis JD, Maggi LB Jr., Faubert B, Villarino AV, O’Sullivan D, Huang SC, van der Windt GJ, Blagih J, Qiu J, et al. (2013). Posttranscriptional control of T cell effector function by aerobic glycolysis. Cell 153, 1239–1251. [DOI] [PMC free article] [PubMed] [Google Scholar]
- Chen G, and Deng X (2018). Cell Synchronization by Double Thymidine Block. Bio. Protoc 8, 10.21769/BioProtoc.2994. [DOI] [PMC free article] [PubMed] [Google Scholar]
- Chen YQ, Ghosh S, and Ghosh G (1998). A novel DNA recognition mode by the NF-kappa B p65 homodimer. Nat. Struct. Biol 5, 67–73. [DOI] [PubMed] [Google Scholar]
- Clem BF, O’Neal J, Tapolsky G, Clem AL, Imbert-Fernandez Y, Kerr DA 2nd, Klarer AC, Redman R, Miller DM, Trent JO, et al. (2013). Targeting 6-phosphofructo-2-kinase (PFKFB3) as a therapeutic strategy against cancer. Mol. Cancer Ther 12, 1461–1470. [DOI] [PMC free article] [PubMed] [Google Scholar]
- Dasgupta S, Rajapakshe K, Zhu B, Nikolai BC, Yi P, Putluri N, Choi JM, Jung SY, Coarfa C, Westbrook TF, et al. (2018). Metabolic enzyme PFKFB4 activates transcriptional coactivator SRC-3 to drive breast cancer. Nature 556, 249–254. [DOI] [PMC free article] [PubMed] [Google Scholar]
- Delfarah A, Parrish S, Junge JA, Yang J, Seo F, Li S, Mac J, Wang P, Fraser SE, and Graham NA (2019). Inhibition of nucleotide synthesis promotes replicative senescence of human mammary epithelial cells. J. Biol. Chem 294, 10564–10578. [DOI] [PMC free article] [PubMed] [Google Scholar]
- Dong X, and Feng P (2011). Murine gamma herpesvirus 68 hijacks MAVS and IKKβ to abrogate NFkB activation and antiviral cytokine production. PLoS Pathog 7, e1002336. [DOI] [PMC free article] [PubMed] [Google Scholar]
- Dong X, Feng H, Sun Q, Li H, Wu TT, Sun R, Tibbetts SA, Chen ZJ, and Feng P (2010). Murine gamma-herpesvirus 68 hijacks MAVS and IKKbeta to initiate lytic replication. PLoS Pathog 6, e1001001. [DOI] [PMC free article] [PubMed] [Google Scholar]
- Dong X, He Z, Durakoglugil D, Arneson L, Shen Y, and Feng P (2012). Murine gammaherpesvirus 68 evades host cytokine production via replication transactivator-induced RelA degradation. J. Virol 86, 1930–1941. [DOI] [PMC free article] [PubMed] [Google Scholar]
- Feng H, Dong X, Negaard A, and Feng P (2008). Kaposi’s sarcoma-associated herpesvirus K7 induces viral G protein-coupled receptor degradation and reduces its tumorigenicity. PLoS Pathog 4, e1000157. [DOI] [PMC free article] [PubMed] [Google Scholar]
- Fischer M, and Müller GA (2017). Cell cycle transcription control: DREAM/MuvB and RB-E2F complexes. Crit. Rev. Biochem. Mol. Biol 52, 638–662. [DOI] [PubMed] [Google Scholar]
- Fox CJ, Hammerman PS, and Thompson CB (2005). Fuel feeds function: energy metabolism and the T-cell response. Nat. Rev. Immunol 5, 844–852. [DOI] [PubMed] [Google Scholar]
- Gao J, Aksoy BA, Dogrusoz U, Dresdner G, Gross B, Sumer SO, Sun Y, Jacobsen A, Sinha R, Larsson E, et al. (2013). Integrative analysis of complex cancer genomics and clinical profiles using the cBioPortal. Sci. Signal 6, pl1. [DOI] [PMC free article] [PubMed] [Google Scholar]
- García-Muse T, and Aguilera A (2016). Transcription-replication conflicts: how they occur and how they are resolved. Nat. Rev. Mol. Cell Biol 17, 553–563. [DOI] [PubMed] [Google Scholar]
- Graves LM, Guy HI, Kozlowski P, Huang M, Lazarowski E, Pope RM, Collins MA, Dahlstrand EN, Earp HS 3rd, and Evans DR (2000). Regulation of carbamoyl phosphate synthetase by MAP kinase. Nature 403, 328–332. [DOI] [PubMed] [Google Scholar]
- Hanahan D, and Weinberg RA (2011). Hallmarks of cancer: the next generation. Cell 144, 646–674. [DOI] [PubMed] [Google Scholar]
- He S, Zhao J, Song S, He X, Minassian A, Zhou Y, Zhang J, Brulois K, Wang Y, Cabo J, et al. (2015). Viral pseudo-enzymes activate RIG-I via deamidation to evade cytokine production. Mol. Cell 58, 134–146. [DOI] [PMC free article] [PubMed] [Google Scholar]
- He CL, Bian YY, Xue Y, Liu ZX, Zhou KQ, Yao CF, Lin Y, Zou HF, Luo FX, Qu YY, et al. (2016). Pyruvate Kinase M2 Activates mTORC1 by Phosphorylating AKT1S1. Sci. Rep 6, 21524. [DOI] [PMC free article] [PubMed] [Google Scholar]
- Huang B, Yang XD, Lamb A, and Chen LF (2010). Posttranslational modifications of NF-kappaB: another layer of regulation for NF-kappaB signaling pathway. Cell. Signal 22, 1282–1290. [DOI] [PMC free article] [PubMed] [Google Scholar]
- Huberts DH, and van der Klei IJ (2010). Moonlighting proteins: an intriguing mode of multitasking. Biochim. Biophys. Acta 1803, 520–525. [DOI] [PubMed] [Google Scholar]
- Jang C, Chen L, and Rabinowitz JD (2018). Metabolomics and Isotope Tracing. Cell 173, 822–837. [DOI] [PMC free article] [PubMed] [Google Scholar]
- Javanmoghadam-Kamrani S, and Keyomarsi K (2008). Synchronization of the cell cycle using lovastatin. Cell Cycle 7, 2434–2440. [DOI] [PubMed] [Google Scholar]
- Kanehisa M, Sato Y, Kawashima M, Furumichi M, and Tanabe M (2016). KEGG as a reference resource for gene and protein annotation. Nucleic Acids Res 44 (D1), D457–D462. [DOI] [PMC free article] [PubMed] [Google Scholar]
- Kim D, Langmead B, and Salzberg SL (2015). HISAT: a fast spliced aligner with low memory requirements. Nat. Methods 12, 357–360. [DOI] [PMC free article] [PubMed] [Google Scholar]
- LaNoue KF, and Williamson JR (1971). Interrelationships between malate-aspartate shuttle and citric acid cycle in rat heart mitochondria. Metabolism 20, 119–140. [DOI] [PubMed] [Google Scholar]
- Li J, Zhao J, Xu S, Zhang S, Zhang J, Xiao J, Gao R, Tian M, Zeng Y, Lee K, et al. (2019). Antiviral activity of a purine synthesis enzyme reveals a key role of deamidation in regulating protein nuclear import. Sci. Adv 5, eaaw7373. [DOI] [PMC free article] [PubMed] [Google Scholar]
- Locasale JW, and Cantley LC (2011). Metabolic flux and the regulation of mammalian cell growth. Cell Metab 14, 443–451. [DOI] [PMC free article] [PubMed] [Google Scholar]
- Love MI, Huber W, and Anders S (2014). Moderated estimation of fold change and dispersion for RNA-seq data with DESeq2. Genome Biol 15, 550. [DOI] [PMC free article] [PubMed] [Google Scholar]
- Massière F, and Badet-Denisot MA (1998). The mechanism of glutamine-dependent amidotransferases. Cell. Mol. Life Sci 54, 205–222. [DOI] [PMC free article] [PubMed] [Google Scholar]
- Mauro C, Leow SC, Anso E, Rocha S, Thotakura AK, Tornatore L, Moretti M, De Smaele E, Beg AA, Tergaonkar V, et al. (2011). NF-κB controls energy homeostasis and metabolic adaptation by upregulating mitochondrial respiration. Nat. Cell Biol 13, 1272–1279. [DOI] [PMC free article] [PubMed] [Google Scholar]
- Metallo CM, Gameiro PA, Bell EL, Mattaini KR, Yang J, Hiller K, Jewell CM, Johnson ZR, Irvine DJ, Guarente L, et al. (2011). Reductive glutamine metabolism by IDH1 mediates lipogenesis under hypoxia. Nature 481, 380–384. [DOI] [PMC free article] [PubMed] [Google Scholar]
- Meyer N, and Penn LZ (2008). Reflecting on 25 years with MYC. Nat. Rev. Cancer 8, 976–990. [DOI] [PubMed] [Google Scholar]
- Mi H, Huang X, Muruganujan A, Tang H, Mills C, Kang D, and Thomas PD (2017). PANTHER version 11: expanded annotation data from Gene Ontology and Reactome pathways, and data analysis tool enhancements. Nucleic Acids Res 45 (D1), D183–D189. [DOI] [PMC free article] [PubMed] [Google Scholar]
- Mogilenko DA, Haas JT, L’homme L, Fleury S, Quemener S, Levavasseur M, Becquart C, Wartelle J, Bogomolova A, Pineau L, et al. (2019). Metabolic and Innate Immune Cues Merge into a Specific Inflammatory Response via the UPR. Cell 178, 263. [DOI] [PubMed] [Google Scholar]
- Moseley HN (2010). Correcting for the effects of natural abundance in stable isotope resolved metabolomics experiments involving ultra-high resolution mass spectrometry. BMC Bioinformatics 11, 139. [DOI] [PMC free article] [PubMed] [Google Scholar]
- Nolan GP, Ghosh S, Liou HC, Tempst P, and Baltimore D (1991). DNA binding and I kappa B inhibition of the cloned p65 subunit of NF-kappa B, a rel-related polypeptide. Cell 64, 961–969. [DOI] [PubMed] [Google Scholar]
- O’Neill LA, Kishton RJ, and Rathmell J (2016). A guide to immunometabolism for immunologists. Nat. Rev. Immunol 16, 553–565. [DOI] [PMC free article] [PubMed] [Google Scholar]
- Pacold ME, Brimacombe KR, Chan SH, Rohde JM, Lewis CA, Swier LJ, Possemato R, Chen WW, Sullivan LB, Fiske BP, et al. (2016). A PHGDH inhibitor reveals coordination of serine synthesis and one-carbon unit fate. Nat. Chem. Biol 12, 452–458. [DOI] [PMC free article] [PubMed] [Google Scholar]
- Perkins ND (2004). NF-kappaB: tumor promoter or suppressor? Trends Cell Biol 14, 64–69. [DOI] [PubMed] [Google Scholar]
- Pertea M, Kim D, Pertea GM, Leek JT, and Salzberg SL (2016). Transcript-level expression analysis of RNA-seq experiments with HISAT, StringTie and Ballgown. Nat. Protoc 11, 1650–1667. [DOI] [PMC free article] [PubMed] [Google Scholar]
- Phelps CB, Sengchanthalangsy LL, Malek S, and Ghosh G (2000). Mechanism of kappa B DNA binding by Rel/NF-kappa B dimers. J. Biol. Chem 275, 24392–24399. [DOI] [PubMed] [Google Scholar]
- Pradère JP, Hernandez C, Koppe C, Friedman RA, Luedde T, and Schwabe RF (2016). Negative regulation of NF-κB p65 activity by serine 536 phosphorylation. Sci. Signal 9, ra85. [DOI] [PMC free article] [PubMed] [Google Scholar]
- Robitaille AM, Christen S, Shimobayashi M, Cornu M, Fava LL, Moes S, Prescianotto-Baschong C, Sauer U, Jenoe P, and Hall MN (2013). Quantitative phosphoproteomics reveal mTORC1 activates de novo pyrimidine synthesis. Science 339, 1320–1323. [DOI] [PubMed] [Google Scholar]
- Sauer U (2006). Metabolic networks in motion: 13C-based flux analysis. Mol. Syst. Biol 2, 62. [DOI] [PMC free article] [PubMed] [Google Scholar]
- Sen R, and Baltimore D (1986). Multiple nuclear factors interact with the immunoglobulin enhancer sequences. Cell 46, 705–716. [DOI] [PubMed] [Google Scholar]
- Seth RB, Sun L, Ea CK, and Chen ZJ (2005). Identification and characterization of MAVS, a mitochondrial antiviral signaling protein that activates NF-kappaB and IRF 3. Cell 122, 669–682. [DOI] [PubMed] [Google Scholar]
- Seth RB, Sun L, and Chen ZJ (2006). Antiviral innate immunity pathways. Cell Res 16, 141–147. [DOI] [PubMed] [Google Scholar]
- Shoaf WT, and Jones ME (1973). Uridylic acid synthesis in Ehrlich ascites carcinoma. Properties, subcellular distribution, and nature of enzyme complexes of the six biosynthetic enzymes. Biochemistry 12, 4039–4051. [DOI] [PubMed] [Google Scholar]
- Sigoillot FD, Berkowski JA, Sigoillot SM, Kotsis DH, and Guy HI (2003). Cell cycle-dependent regulation of pyrimidine biosynthesis. J. Biol. Chem 278, 3403–3409. [DOI] [PubMed] [Google Scholar]
- Sigoillot FD, Kotsis DH, Serre V, Sigoillot SM, Evans DR, and Guy HI (2005). Nuclear localization and mitogen-activated protein kinase phosphorylation of the multifunctional protein CAD. J. Biol. Chem 280, 25611–25620. [DOI] [PubMed] [Google Scholar]
- Takeuchi O, and Akira S (2010). Pattern recognition receptors and inflammation. Cell 140, 805–820. [DOI] [PubMed] [Google Scholar]
- Vander Heiden MG, Cantley LC, and Thompson CB (2009). Understanding the Warburg effect: the metabolic requirements of cell proliferation. Science 324, 1029–1033. [DOI] [PMC free article] [PubMed] [Google Scholar]
- Yang W, Xia Y, Hawke D, Li X, Liang J, Xing D, Aldape K, Hunter T, Alfred Yung WK, and Lu Z (2012). PKM2 phosphorylates histone H3 and promotes gene transcription and tumorigenesis. Cell 150, 685–696. [DOI] [PMC free article] [PubMed] [Google Scholar]
- Yu G, Wang LG, Han Y, and He QY (2012). clusterProfiler: an R package for comparing biological themes among gene clusters. OMICS 16, 284–287. [DOI] [PMC free article] [PubMed] [Google Scholar]
- Zhang Q, Lenardo MJ, and Baltimore D (2017). 30 Years of NF-κB: A Blossoming of Relevance to Human Pathobiology. Cell 168, 37–57. [DOI] [PMC free article] [PubMed] [Google Scholar]
- Zhao J, Zeng Y, Xu S, Chen J, Shen G, Yu C, Knipe D, Yuan W, Peng J, Xu W, et al. (2016). A Viral Deamidase Targets the Helicase Domain of RIG-I to Block RNA-Induced Activation. Cell Host Microbe 20, 770–784. [DOI] [PMC free article] [PubMed] [Google Scholar]
- Zhong H, Voll RE, and Ghosh S (1998). Phosphorylation of NF-kappa B p65 by PKA stimulates transcriptional activity by promoting a novel bivalent interaction with the coactivator CBP/p300. Mol. Cell 1, 661–671. [DOI] [PubMed] [Google Scholar]
Associated Data
This section collects any data citations, data availability statements, or supplementary materials included in this article.
Supplementary Materials
Data Availability Statement
The accession numbers for RNA-sequencing datasets reported in this paper are publicly available at the NCBI Gene Expression Omnibus database (https://www.ncbi.nlm.nih.gov/geo) under accession numbers GEO: GSE132868 and GSE132871.