Abstract
Protein core repacking is a standard test of protein modeling software. A recent study of six different modeling software packages showed that they are more successful at predicting side chain conformations of core compared to surface residues. All the modeling software tested have multicomponent energy functions, typically including contributions from solvation, electrostatics, hydrogen bonding and Lennard–Jones interactions in addition to statistical terms based on observed protein structures. We investigated to what extent a simplified energy function that includes only stereochemical constraints and repulsive hard-sphere interactions can correctly repack protein cores. For single residue and collective repacking, the hard-sphere model accurately recapitulates the observed side chain conformations for Ile, Leu, Phe, Thr, Trp, Tyr and Val. This result shows that there are no alternative, sterically allowed side chain conformations of core residues. Analysis of the same set of protein cores using the Rosetta software suite revealed that the hard-sphere model and Rosetta perform equally well on Ile, Leu, Phe, Thr and Val; the hard-sphere model performs better on Trp and Tyr and Rosetta performs better on Ser. We conclude that the high prediction accuracy in protein cores obtained by protein modeling software and our simplified hard-sphere approach reflects the high density of protein cores and dominance of steric repulsion.
Keywords: protein core repacking, protein crystal structures, protein design, Rosetta, side chain conformations
Introduction
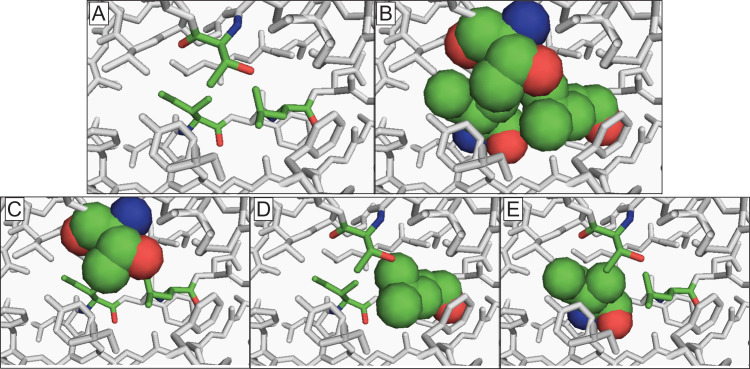
A grand challenge in biology is to design new protein–protein interactions for many potential applications including point of care diagnostics (Ruslinget al., 2010), sensors for proteinaceous biological warfare agents (Sapsfordet al., 2008) and more effective vaccines (Correiaet al., 2014). In order to design new proteins we must learn the rules for designing protein cores, which endow proteins and protein complexes with stability. Computational protein design provides a unique approach with which to gain fundamental insights into protein structure. It is important to benchmark the predictions made by computational design software against known protein crystal structures. A frequently used test for computational design software is side chain conformation recovery, where the side chains are removed from a protein crystal structure and the software attempts to recover the observed side chain conformations of all residues (Petersonet al., 2014). There are two categories of protein core repacking: one starts with all possible sequences and seeks to recover the wild type sequence (Dobson et al., 2006;Dantas et al., 2007) and the other starts with the wild type sequence and seeks to recover the observed combination of side chain dihedral angles. Here, we focus on the second type, where the side chains of core residues are removed simultaneously and all side chain dihedral angle combinations of the starting sequence are sampled. The optimal combination is predicted and compared to the observed structure (see Fig.1). Protein core repacking is a particularly meaningful test of computational design software developed to design stable variants of proteins (Goldenzweiget al., 2016) and design new protein–protein interactions (Fleishmanet al., 2011).
Fig. 1.
Illustration of single and combined rotations for protein core repacking studies using PDB: 1C7K. (A) We show a cluster of three interacting core residues (Thr, Leu, Val) shaded in green using stick representation with the rest of the protein shaded in gray. (B) For combined rotations, all three core residues, with atoms represented as spheres (C: green, N: blue, O: oxygen), are rotated simultaneously and the repulsive steric interactions are calculated between atoms in the three moving residues as well as between atoms in the residues with fixed side chains. (C–E) For single rotations, only one core residue ((C) Thr, (D) Leu or (E) Val) in the cluster is rotated at a time, while the others remain fixed. Steric interactions are calculated between atoms in the moving residue and atoms of all other residues in the protein. In all cases, each atom in the protein is represented as a sphere, but stationary atoms are shown here as sticks to highlight the residues that are not rotated.
In recent work, Petersonet al. (2014) performed side chain recovery for ~200 proteins using six different protein modeling software suites (SCWRL (Krivovet al., 2009), OSCAR (Liang et al., 2011), RASP (Miao et al., 2011), Rosetta (Kuhlman and Baker, 2000), Sccomp (Eyal et al., 2004) and FoldX (Gueroiset al., 2002)). The key component of computational protein design software is the energy function, which can include many terms: stereochemistry (potentials that enforce equilibrium bond lengths and angles derived from small molecule crystal structure data); statistical potentials derived from backbone-dependent side chain rotamer libraries (Dunbrack and Cohen, 1997,Shapovalov and Dunbrack, 2011); repulsive and attractive van der Waals atomic interactions; hydrogen bonding; electrostatics; solvation; disulfide bond energy (RASP-specific), and an ad hoc pairwise residue potential (Rosetta-specific). The energy functions differ in the specific form and relative weights assigned to each of these terms.
Overall, protein modeling software performs well for protein side chain recovery. In particular, Petersonet al. found that all six software packages obtain higher accuracy for their predictions for the side chain dihedral angle conformations for core residues compared to surface residues. In addition, the software packages achieve higher accuracy when predicting χ1 alone (90–95% within 40°) compared to predictions of side chain dihedral angle combinations, e.g. χ1 and χ2 (82–87% within 40° degrees for each). Because the rotamer recovery prediction accuracy for all the protein design software tested is higher for core residues, here we investigate to what extent an energy function that only includes stereochemistry and repulsive hard-sphere atomic interactions can repack protein cores.
We take a systematic approach to protein core repacking studies. We first study single residue rotations and then collective residue rotations, both using the hard-sphere model. This comparison allows us to determine if multiple sterically allowed side chain conformations are possible in the core. We then perform collective fixed-sequence core repacking calculations using Rosetta, a well-established protein design software package, and compare the results to those of the hard-sphere model. This comparison allows us to identify the dominant forces that determine side chain conformations in protein cores.
In the results section, we first describe studies of single residue rotations, where we sample all side chain dihedral angle combinations of a single core residue, keeping the side chain conformations of all other residues fixed to their crystal structure values. We evaluate the energy of each side chain dihedral angle combination and compare the lowest energy side chain dihedral angle combination for each core residue (Leu, Ile, Met, Phe, Ser, Thr, Trp, Tyr, Val) to the observed values. We find that the hard-sphere model achieves a prediction accuracy of greater than 90% (within 30°) for all residues except Met (84%) and Ser (38%). We compare the results of single residue rotations to the results of collective residue rotations, which provides insight into the number of possible ways to pack interacting core residues.
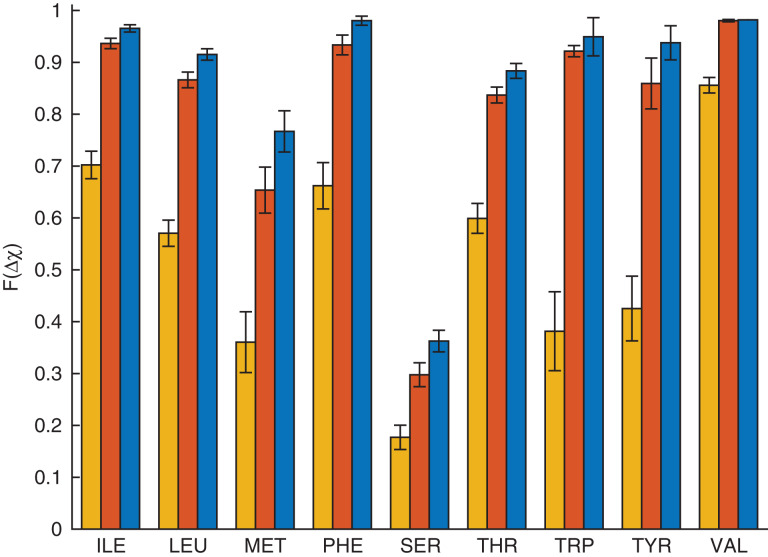
For collective residue rotations, we simultaneously rotate the side chains of all residues in each interacting cluster. We perform these calculations for the same clusters in all proteins using both the hard-sphere model and Rosetta. We observe the same high prediction accuracy for collective residue rotations as we did for single residue rotations for the hard-sphere model: greater than 90% accuracy (within 30°) for all core residues except for Met (77%) and Ser (36%) (see Figs5 and6). For combined rotations, Rosetta and the hard-sphere model give the same high prediction accuracy (≥90% within 30°) for Ile, Leu, Thr, Phe and Val (Fig.7). The hard-sphere model performs slightly better on aromatic residues than Rosetta, whereas Rosetta achieves much higher accuracy for Ser. We discuss potential explanations for these differences in the Results section. The cases for which the hard-sphere model does not achieve high prediction accuracy allow us to identify when additional interactions are necessary to predict side chain conformations.
Fig. 5.
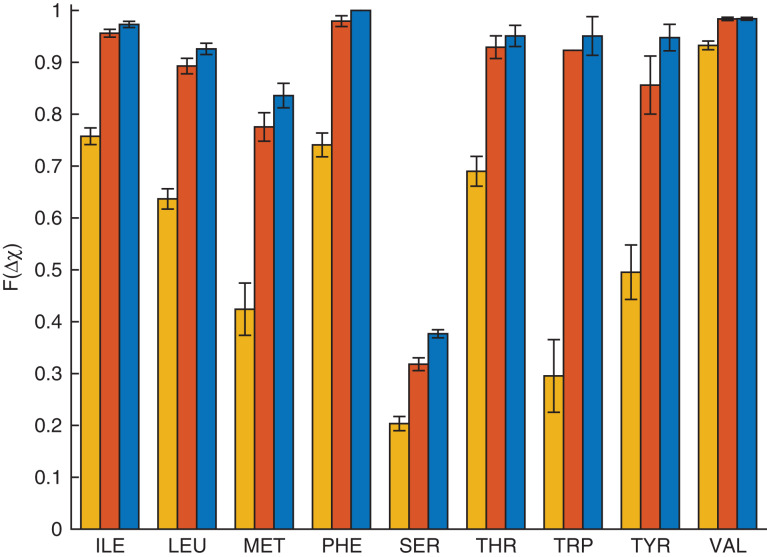
Combined rotations in the context of the protein core: the fraction (F(Δχ)) of each residue type for which the hard-sphere model prediction of the side chain conformation is Δχ < 10° (yellow, left bar), 20° (red, center bar) or 30° (blue, right bar) from the crystal structure for core residues in the Dunbrack 1.0 Å database.
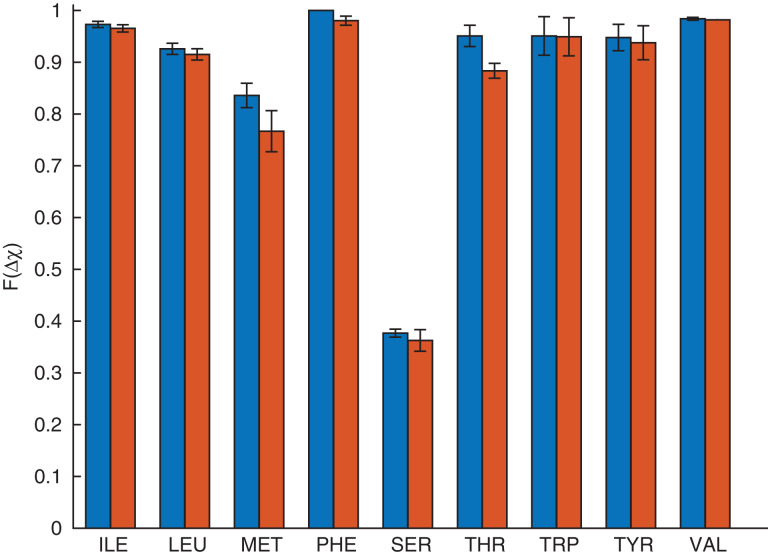
Fig. 6.
Comparison of the accuracy of single and combined rotations for core residues in the Dunbrack 1.0 Å database. Each bar shows the fraction of residues for which the hard-sphere model prediction of the side chain conformation is Δχ < 30° for single (blue, left bar) or combined (red, right bar) rotations.
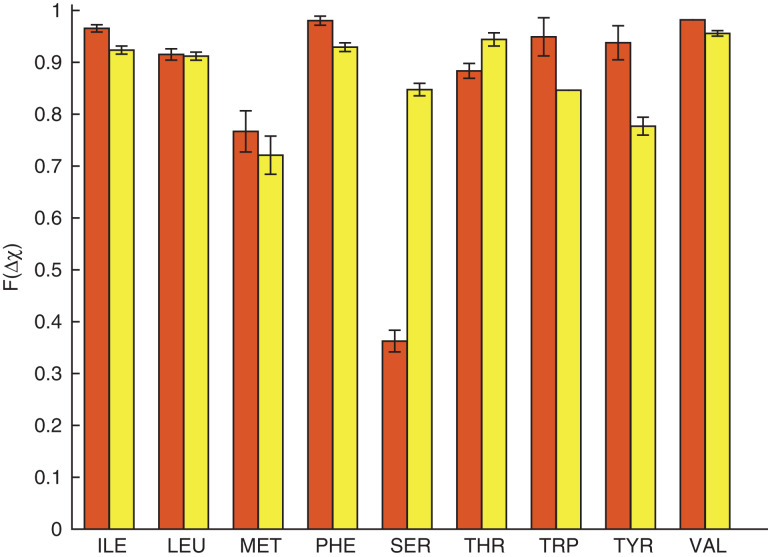
Fig. 7.
Comparison of the accuracy of combined rotations for core residues in the Dunbrack 1.0 Å database using the hard-sphere model (red, right bar) and Rosetta (yellow, right bar). Each bar shows the fractionF(Δχ) of residues for which the model prediction was Δχ < 30°.
Materials and methods
Data sets of protein crystal structures and core residues
We use the Dunbrack 1.0 Å database (Wang and Dunbrack, 2003,2005) of high-resolution protein crystal structures as the basis for our protein core repacking studies. The Dunbrack 1.0 Å database contains 221 proteins with resolution ≤1.0 Å, side chain B-factors per residue ≤30 Å2, R-factor ≤0.2 and sequence identity <50%. As a way to model the system at nonzero temperature and improve the statistics, variations in bond lengths and angles are implemented by replacing each side chain with different instances of the side chain taken from the Dunbrack 1.7 Å database, each with an independent set of side chain bond lengths and angles (Zhouet al., 2014). The Dunbrack 1.7 Å database contains ~800 proteins with resolution ≤1.7 Å (Dunbrack and Cohen, 1997). Additional studies were performed on a second database, the ‘HiQ54’ database (Leaver-Fay et al., 2013), which contains 54 non-redundant, single-chain monomeric proteins with resolution and MolProbity score <1.4 Å.
Our analysis focuses on the side chains of residues in protein cores. We have identified all core residues in the Dunbrack 1.0 Å database using a method described previously (Caballeroet al., 2016; Gaineset al., 2016). In brief, noncore atoms are identified that are on the surface of the protein or near an interior void with a radius ≥1.4 Å. In our strict definition, a core residues is defined as any residue containing exclusively core atoms (including hydrogen atoms). The numbers of each amino acid that occur as core residues in the Dunbrack 1.0 Å database are given in Table1.
Table I.
The number of each amino acid designated as core in the Dunbrack 1.0 Å database
| Amino acid | No. in Dunbrack 1.0 Å database |
|---|---|
| Ala | 529 |
| Asn | 50 |
| Asp | 78 |
| Arg | 6 |
| Cys | 142 |
| Gln | 17 |
| Glu | 31 |
| Gly | 453 |
| His | 24 |
| Ile | 453 |
| Leu | 355 |
| Lys | 3 |
| Met | 90 |
| Phe | 141 |
| Pro | 63 |
| Ser | 193 |
| Thr | 136 |
| Trp | 28 |
| Tyr | 69 |
| Val | 438 |
| Total | 849 |
Hard-sphere model
As described in previous work (Zhouet al., 2014;Gaineset al., 2016), the ‘hard-sphere’ model treats each atom i as a sphere that interacts pairwise with all other non-bonded atoms j via the purely repulsive Lennard–Jones potential:
where is the center-to-center separation between atomsi andj, is the Heaviside step function, ϵ is the energy scale of the repulsive interactions, = /2 and is the radius of atomi. The values for the atomic radii (Csp3, Caromatic: 1.5 Å; CO : 1.3 Å ; O: 1.4 Å; N: 1.3 Å; HC: 1.10 Å; HO,N: 1.00 Å and S: 1.75 Å) were obtained in prior work (Zhouet al., 2014) by minimizing the difference between the side chain dihedral angle distributions predicted by the hard-sphere dipeptide mimetic model and those observed in protein crystal structures for a subset of amino acid types. Hydrogen atoms were added using the REDUCE software program (Wordet al., 1999), which sets the bond lengths for C-H, N-H and S-H to 1.1, 1.0 and 1.3 Å, respectively, and the bond angles to 109.5° and 120° for angles involving Csp3 and Csp2 atoms, respectively. Additional dihedral angle degrees of freedom involving hydrogen atoms are chosen to minimize steric clashes (Wordet al., 1999).
Predictions of the side chain conformations of single amino acids are obtained by rotating each of the side chain dihedral angles (with a fixed backbone conformation, (Liu and Chen, 2016)) and finding the lowest energy conformations of the residue, where the energy includes both intra- and inter-residue steric repulsive interactions (Fig.1C–E). If the lowest energy conformation of the residue is degenerate (i.e. multiple dihedral angle configurations result in the same minimum energy), all lowest energy configurations are recorded. We then calculate the Boltzmann weight of the lowest energy side chain conformation of the residue, , where the temperatureT/ε = 10−2 approximates hard-sphere-like interactions. To sample bond length and angle fluctuations, each residue is replaced with random bond length and angle combinations taken from the Dunbrack 1.7 Å database and the new lowest energy conformation is found. We select 50 bond length and angle variants, and for each find the lowest energy dihedral angle conformation and corresponding values. We averagePi over the variants to obtain . We then compare the particular dihedral angle combination associated with the highest value ofPm to the side chain of the crystal structure. To assess the accuracy of the hard-sphere model in predicting the side chain dihedral angles of residues in protein cores, we calculated
If multiple side chain configurations were reported in the Protein Databank for a given protein, Δχ was calculated for all reported conformations with an occupancy ≥40% and the smallest value of Δχ was selected. We calculate the fractionF(Δχ) of residues with Δχ less than 10°, 20° and 30°. A discussion of the calculations of the error bars forF(Δχ) is included in theSupplemental Material.
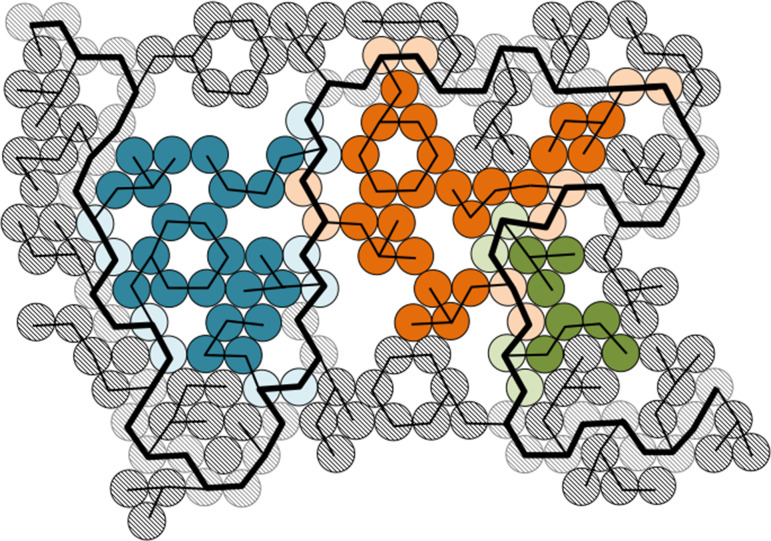
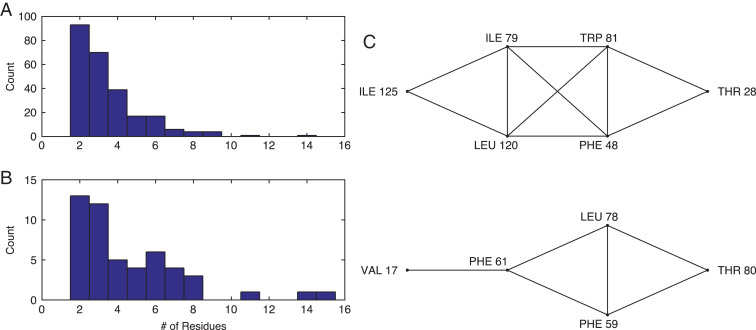
In addition to single residue rotations, we performed core repacking using combined rotations of interacting core residues in each protein with the wild type amino acid sequence. For the combined rotation method, all residues in an interacting cluster are rotated simultaneously (with fixed backbone conformations), and the global minimum energy conformation is identified (Fig.1B). A cluster of interacting residues is defined such that side chain atoms of each residue in the cluster only interact with other residues in the cluster, but do not interact with the side chains of other core residues in the protein (Fig.2). Specifically, if an atomic overlap is possible between two residues without an interaction with the protein backbone also occurring, those two residues are considered to be interacting. Examples of interaction networks between core residues in interacting clusters are given in Fig.3C. Ala, Gly and Pro were excluded from this analysis since these amino acids do not possess side chain dihedral angle degrees of freedom. In addition, we did not include Cys residues because they can form disulfide bonds. The Dunbrack 1.0 Å database includes 352 distinct clusters (with greater than 1 residue). A few clusters contained 10 or more residues, but these were not included in the analyses. We also removed clusters containing the charged residues Arg, Asp, Glu and Lys and the polar residues Asn, Gln and His, which are rare in protein cores (<10% of core residues). This resulted in a total of 250 clusters and 852 residues from the Dunbrack 1.0 Å database with sizes given in Fig.3. The frequency of each amino acid in these clusters is given in Table2. The HiQ54 database contains 50 core clusters with 2–15 residues per cluster (see Fig.3B).
Fig. 2.
Schematic in two dimensions of a protein that contains three core clusters. Each amino acid is represented by disk-shaped atoms that are connected by lines. The protein backbone is indicated by a thick black line, and the thinner lines form the side chains. Each residue contains two backbone atoms and between one and seven side chain atoms. ‘Surface’ residues are shaded gray. Any residue that is completely surrounded by other atoms is designated as a core residue. Each core cluster contains residues that interact with each other but do not interact with the side chains of residues in another cluster. For example, the cluster in blue has atoms that touch the backbone of the cluster in orange, but these atoms do not interact with the side chains of residues in the orange cluster without clashing with the backbone first. The three core clusters shown here contain five (blue), five (orange) and two (green) residues.
Fig. 3.
The distribution of cluster sizes in the (A) Dunbrack 1.0 Å and (B) HiQ54 databases. Each cluster is defined as a set of residues in a protein core that interact with each other, but not with any other side chains of other core residues. (C) Examples of interaction networks based on two clusters of core residues from protein PDB:1T3Y. The clusters contain eight (top) and five (bottom) residues, respectively. Each line in the network indicates interactions between two residues. For example, in the top cluster Ile 125 interacts with Ile 79 and Leu 120, but does not interact with Trp 81 or Val 17 (in another cluster).
Table II.
The number of each uncharged amino acid found in interacting clusters (with size greater than 1 residue) in the Dunbrack 1.0 Å database
| Amino acid | No. in clusters in Dunbrack 1.0 Å database |
|---|---|
| Ile | 163 |
| Leu | 179 |
| Met | 50 |
| Phe | 70 |
| Ser | 68 |
| Thr | 48 |
| Trp | 13 |
| Tyr | 29 |
| Val | 229 |
| Total | 849 |
Predictions from combined rotations for the side chain dihedral angle combinations of core residues in a given cluster are obtained by rotating each of the side chain dihedral angles of all residues in that cluster and identifying the lowest energy side chain dihedral angle combination, where the total energy includes the repulsive Lennard–Jones interactions between atoms on a single residue as well as atoms on different residues both in the given cluster and other residues in the protein. We represented the side chain dihedral angle combinations as a tree, where each level represents an amino acid and the nodes at each level represent the allowed side chain dihedral angle conformations for the corresponding residue. We then implement a depth-first search to find the global energy minimum and the corresponding side chain dihedral angle conformation. Bond lengths and angles were varied by sampling 30 bond length and angle variants from the Dunbrack 1.7 Å database. The Boltzmann weightPi for each variant was found and averaged over the variants to obtain, and Δχ was calculated as described above for single residue rotations.
Rosetta predictions
The prediction accuracy for collective core repacking using the hard-sphere model was compared to that from Rosetta (Leaver-Fayet al., 2011) for the same core clusters. We first generated relaxed structures for each protein studied, using Rosetta's fast relax protocol with backbone constraints that maintain the positions of the backbone heavy atoms near their crystal structure locations (Tykaet al., 2011;Liu and Chen, 2016). Fifty relaxed structures were produced and the five lowest energy structures were chosen for core repacking. Rotamer sampling on all side chain dihedral angles using the wild type amino acid sequence was set to the maximum value (i.e. the original rotamer value ± 0.25 standard deviations). For each of the five relaxed structures, we performed combined repacking of the residues in each core cluster and selected the output conformation with the lowest Rosetta energy. Δχ was calculated for each residue as described above, resulting in five Δχ values for each residue, which were used to obtain the average fractionF(Δχ) of residues with Δχ less than 10°, 20° and 30°. A sample Rosetta script and a description of the calculations of the error bars for F(Δχ) is given in theSupplemental Material.
Results
In previous studies, we have shown that the hard-sphere dipeptide model can recapitulate the observed side chain dihedral angle distributions of nonpolar, aromatic and polar amino acids (Cys, Ile, Leu, Phe, Ser, Thr, Trp, Tyr and Val) (Zhouet al., 2014). In more recent work (Caballeroet al., 2016), we showed that the hard-sphere model including both intra- and inter-residue interactions could predict the side chain dihedral angle conformations of single residues in protein cores. The prediction accuracy (within 20° of the observed structure) was greater than 90% for Ile, Leu, Phe, Thr, Trp, Tyr and Val. This prior work focused on rotations of the side chains of individual residues in protein cores. Here, we expand this work to examine the predictions obtained by the hard-sphere model from simultaneous rotations of multiple residues in protein cores (maintaining the wild type amino acid sequence), as well as to a larger database of protein crystal structures. To enable a detailed comparison with a well-established protein design software package, we compare the predictions of the hard-sphere model to those from Rosetta on the same sets of core residues.
In Fig.4, we investigate the accuracy of the hard-sphere model in predicting the side chain dihedral angles of individual residues in protein cores. For each amino acid (Ile, Leu, Met, Phe, Ser, Thr, Trp, Tyr and Val), we calculate the percentage of residues for which the predicted side chain dihedral angle conformation is within 10°, 20° and 30° of the crystal structure value. Consistent with our prior results, the hard-sphere model accurately predicts the side chain dihedral angle combinations of single residues in the context of the protein for Ile, Leu, Phe, Thr, Trp, Tyr and Val (≥90% within 30°). This result emphasizes that the purely repulsive hard-sphere model can accurately predict the side chain dihedral angle combinations for nonpolar and uncharged amino acids. The quantitative values of our results differ slightly from those found inCaballeroet al. (2016) because in the current study we use the much larger Dunbrack 1.0 Å database of protein crystal structures.
Fig. 4.
Single residue rotations in the context of the protein core: the fraction (F(Δχ)) of each residue type for which the hard-sphere model prediction of the side chain conformation is Δχ < 10° (yellow, left bar), 20° (red, center bar) or 30° (blue, right bar) from the crystal structure for core residues in the Dunbrack 1.0 Å database.
We find that the hard-sphere model is unable to predict with high accuracy, the observed side chain conformations for two residues that we studied: Ser and Met. Our results for Met are consistent with those found inVirruetta et al. (2016). In this prior work, we found that local steric interactions were insufficient to predict the shape of theP(χ3) distribution for Met. It was necessary to add attractive atomic interactions to the hard-sphere model to reproduce the observedP(χ3). Here, using only repulsive interactions, we predict ~80% of Met residues within 30°. Our results for Ser (only 38% within 30°) are also consistent with our prior work inCaballeroet al. (2016). We speculate that because the side chain of Ser is small, hydrogen-bonding interactions must be included to correctly place its side chain. In contrast, we suggest that the more bulky Thr and Tyr side chains cause steric interactions to determine the positioning of their side chains, even though they are able to form hydrogen bonds (Zhouet al., 2012).
We obtain similar results when we perform combined rotations of core residues using the hard-sphere model (Figs5 and6). Single and combined rotations have the same prediction accuracy, which shows that there are very few arrangements of the residues in a protein core that are sterically allowed and that the side chain conformations of most core residues are dominated by packing constraints. Slightly lower prediction accuracy is found for a few residues using combined rotations, because finding the conformation corresponding to the global energy minimum may improve the accuracy for one residue, while lowering the accuracy for another residue in the same cluster. We also performed single and collective repacking on the HiQ54 data set and found similar accuracies for both single and combined rotations for both data sets (These results are shown in theSupplementary Material).
We now compare the results of core repacking (with combined rotations) using the hard-sphere model to those found using Rosetta (Fig.7). For the residues Ile, Leu, Phe, Thr and Val, the hard-sphere model achieves a similar prediction accuracy to that obtained by Rosetta. The largest differences occur for Ser: Rosetta gives 85% (within 30°), while the hard-sphere model gives 36% (within 30°). We previously speculated that because the side chain of Ser is small, hydrogen-bonding interactions are more important for properly positioning its side chain than the side chain of Thr. Rosetta includes hydrogen-bonding interactions, which is likely the reason for its higher prediction accuracy.
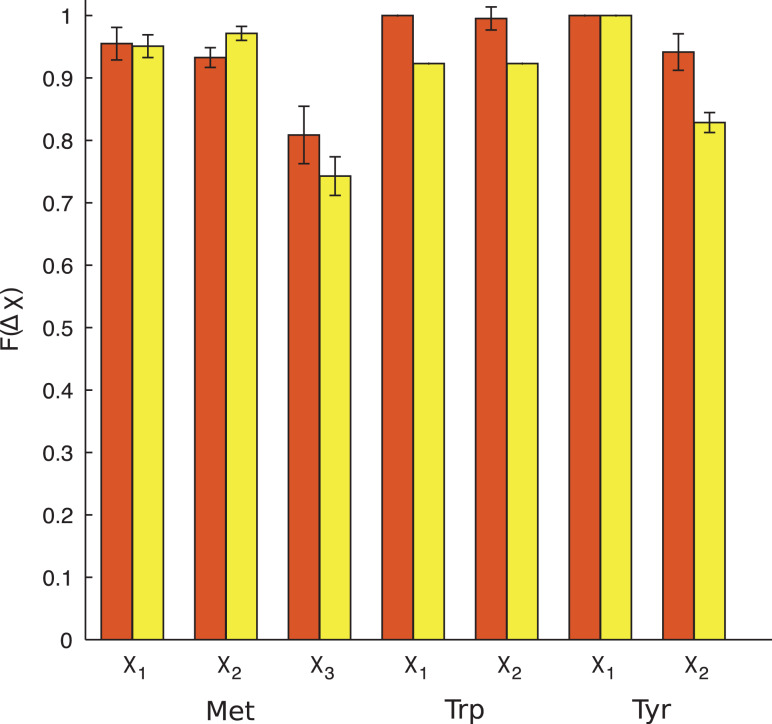
Rosetta obtains prediction accuracies of 85% and 78% (within 30°) for Trp and Tyr, respectively, while the hard-sphere model obtains 95% and 94% (within 30°) for Trp and Tyr, respectively (Fig.7). To further investigate this difference, we calculated Δχ for χ1 and χ2 separately for both residues (Fig.8). For Trp, the hard-sphere model performs slightly better than Rosetta at predicting χ1 and χ2. For Tyr, Rosetta and the hard-sphere model perform equally well for χ1, but the hard-sphere model performs better for χ2.
Fig. 8.
Comparison of the accuracy of combined rotations for core Met, Trp and Tyr residues in the Dunbrack 1.0 Å database using the hard-sphere model (red, left bar) and Rosetta (yellow, right bar). Each bar shows the fraction F(Δχ) of residues for which the model prediction was Δχ < 30° for each side chain dihedral angle separately.
For Met, both the hard-sphere model and Rosetta obtain prediction accuracies below 80% for Δχ < 30°. Both the hard-sphere model and Rosetta accurately predict χ1 and χ2 (above 90% within 30°), but have much lower prediction accuracies for χ3 (below 80% within 30°) (see Fig.8). In previous work, we showed that χ1 and χ2 of Met are well predicted using the hard-sphere model, whereas χ3 is not (Virruetaet al., 2016). This result holds true for both the dipeptide model as well as in the context of the protein core. In this previous study, we found that the addition of attractive atomic interactions improves the prediction of χ3 for Met. The current results for single and collective core repacking showing that the hard-sphere model yields low χ3 prediction accuracy for Met are consistent with the previous results. For Rosetta, the energy function includes statistical potentials that are based on backbone-dependent side chain dihedral angle rotamer libraries. Such potentials do not fully account for the local environment (i.e. side chain and backbone atoms of other residues). Instead, other terms in the Rosetta energy function, for example attractive and repulsive Lennard–Jones atomic interactions, are used to position the side chain in the local environment. We speculate that the low prediction accuracy for χ3 of Met using Rosetta indicates that the Lennard–Jones energy terms that account for local environment are not weighted appropriately to identify the correct rotamer for an individual Met. Because Met represents only 6% of core cluster residues, we do not pursue the modeling of Met further in this work.
Discussion
In this article, we showed several key results. First, single and collective core repacking using the hard-sphere model give the same prediction accuracies for the side chain conformations of seven of the most common core residues. This result implies that there are no alternative sterically allowed conformations of core residues other than those in the crystal structure. If alternative sterically allowed conformations existed, we would have found them using the collective repacking method and thus the prediction accuracy would have dramatically decreased relative to the value for single residue rotations. It does not. Thus, collective repacking reveals that the structures of protein cores are uniquely specified by steric interactions.
Second, the hard-sphere model obtains prediction accuracies that are as high or higher than Rosetta for Ile, Leu, Phe, Thr, Val, Trp and Tyr. Thus, hard-sphere interactions are dominant in determining side chain conformations for these residues. The hard-sphere model and Rosetta both give <80% prediction accuracy for Met, which is caused by poor prediction of the side chain dihedral angle χ3. Rosetta performs better on Ser, presumably because Rosetta includes hydrogen-bonding interactions, which specify the particular side chain conformation for each local environment. Interestingly, Thr and Tyr can both hydrogen bond, but can be accurately predicted using the hard-sphere model alone, presumably because they both have bulkier side chains than Ser. Third, we have shown that an energy function that only includes stereochemistry and repulsive hard-sphere atomic interactions can repack protein cores with high accuracy, which has important implications both for our understanding of protein structure and for application-specific protein design.
Why do the hard-sphere model and six computational protein design software packages studied in Petersonet al. obtain similar high prediction accuracies for many core residues? One reason is that protein cores are densely packed and thus steric repulsive interactions are dominant (Chothia, 1975;Richards, 1977;Liang and Dill, 2001;Seeliger and de Groot, 2007;Gaines et al., 2016). In addition, the weights of the repulsive atomic interactions and statistical potentials derived from backbone-dependent side chain dihedral angle rotamer libraries are large in comparison to other terms in the energy functions of the six software packages.
Supplementary Material
Acknowledgements
The authors thank R.L. Dunbrack, Jr. and J.S. and D.C. Richardson for providing the Dunbrack 1.0 Å and HiQ54 databases of protein crystal structures, respectively, and for their interest in this work and helpful discussions. The authors also thank D. Caballero for his initial development of codes for repacking protein cores using the hard-sphere model. We are grateful to the Raymond and Beverley Sackler Institute for Biological, Physical and Engineering Sciences at Yale, and and all its members for providing a both critical and supportive environment in which to perform this work.
Funding
This work was supported by the National Library of Medicine Training Grant [T15LM00705628 to J.C.G.]; National Science Foundation [NSF-PHY-1522467 to L.R. and C.S.O., NSF-DMR-1307712 to L.R.]; the Ford Foundation Pre-Doctoral Fellowship program to A.V.; the National Science Foundation Graduate Research Fellowships program to A.V.; and the Raymond and Beverly Sackler Institute for Biological, Physical and Engineering Sciences to J.C.G., A.V., C.S.O. and L.R. The authors benefited from the Facilities and staff of the Yale University Faculty of Arts and Sciences High Performance Computing Center and acknowledge the National Science Foundation [CNS 08-21132] that in part funded acquisition of the computational facilities. S.J.F. was funded by an individual grant from the Israel Science Foundation.
References
- Caballerao D., Virrueta A., O'Hern C.S. and Regan L. (2016)Protein Eng. Des. Sel.,29, 367–376. [DOI] [PubMed] [Google Scholar]
- Chothia C. (1975)Nature,254, 304–308. [DOI] [PubMed] [Google Scholar]
- Correia B.E., Bates J.T., Loomis R.J., et al. (2014)Nature, 507,201–206. [DOI] [PMC free article] [PubMed] [Google Scholar]
- Dantas G., Corrent C., Reichow S.L., et al. (2007)J. Mol. Biol., 366,1209–1221. [DOI] [PMC free article] [PubMed] [Google Scholar]
- Dobson N., Dantas G., Baker D. and Varani G. (2006)Structure,14, 847–856. [DOI] [PubMed] [Google Scholar]
- Dunbrack R.L. and Cohen F.E. (1997)Prot. Sci.,6, 1661–1681. [DOI] [PMC free article] [PubMed] [Google Scholar]
- Eyal E., Najmanovich R., McConkey B.J., Edelman M. and Sobelev V. (2004)J. Comput. Chem.,25, 712–724. [DOI] [PubMed] [Google Scholar]
- Fleishman S.J., Whitehead T.A., Ekiert D.C., Dreyfus C., Corn J.E., Strauch E.M., Wilson I.A. and Baker D. (2011)Science,332, 816–821. [DOI] [PMC free article] [PubMed] [Google Scholar]
- Gaines J.C., Smith W.W., Regan L. and O'Hern C.S. (2016)Phys. Rev. E,93, 032416. [DOI] [PubMed] [Google Scholar]
- Goldenzweig A., Goldsmith M., Hill S.E., et al. (2016)Mol. Cell., 63,337–346. [DOI] [PMC free article] [PubMed] [Google Scholar]
- Guerois R., Nielsen J.E. and Serrano L. (2002)J. Mol. Biol.,320, 369–387. [DOI] [PubMed] [Google Scholar]
- Krivov G.G., Shapovalov M.M. and Dunbrack R.L. (2009)Proteins,77, 778–795. [DOI] [PMC free article] [PubMed] [Google Scholar]
- Kuhlman B. and Baker D. (2000)Proc. Natl. Acad. Sci. U. S. A., 97,10383–10388. [DOI] [PMC free article] [PubMed] [Google Scholar]
- Leaver-Fay A., O'Meara M.J., Tyka M., et al. (2013)Methods Enzymol.,523, 109–143. [DOI] [PMC free article] [PubMed] [Google Scholar]
- Leaver-Fay A., Tyka M., Lewis S.M., et al. (2011)Methods Enzymol.,487, 545–574. [DOI] [PMC free article] [PubMed] [Google Scholar]
- Liang J. and Dill K. (2001)Biophys. J.,81, 751–766. [DOI] [PMC free article] [PubMed] [Google Scholar]
- Liang S., Zheng D., Zhang C. and Standley D.M. (2011)Bioinformatics,27, 2913–2914. [DOI] [PMC free article] [PubMed] [Google Scholar]
- Liu H. and Chen Q. (2016)Curr. Opin. Struct. Biol.,39, 89–95. [DOI] [PubMed] [Google Scholar]
- Miao Z., Cao Y. and Jiang T. (2011)Bioinformatics,27, 3117–3122. [DOI] [PubMed] [Google Scholar]
- Peterson L.X., Kang X. and Kihara D. (2014)Proteins,82, 1971–1984. [DOI] [PMC free article] [PubMed] [Google Scholar]
- Richards F.M. (1977)Ann. Rev. Biophys. Bioeng., 6,151–176. [DOI] [PubMed] [Google Scholar]
- Rusling J.F., Kumar C.V., Gutkind J.S. and Patel V. (2010)Analyst,135, 2496–2511. [DOI] [PMC free article] [PubMed] [Google Scholar]
- Sapsford K.E., Bradburne C., Delehanty J.B. and Medintz I.L. (2008)Mater. Today,11, 38–49. [Google Scholar]
- Seeliger D. and de Groot B.L. (2007)Proteins,68, 595–601. [DOI] [PubMed] [Google Scholar]
- Shapovalov M.M. and Dunbrack R.L. Jr. (2011)Structure,19, 844–858. [DOI] [PMC free article] [PubMed] [Google Scholar]
- Tyka M.D., Keedy D.A., Andre I., Dimaio F., Richardson J.S. and Baker D. (2011)J. Mol. Biol.,405, 607–618. [DOI] [PMC free article] [PubMed] [Google Scholar]
- Virrueta A., O'Hern C.S. and Regan L. (2016)Proteins,84, 900–911. [DOI] [PubMed] [Google Scholar]
- Wang. G. and Dunbrack R.L. Jr. (2003)Bioinformatics,19, 1589–1591. [DOI] [PubMed] [Google Scholar]
- Wang. G. and Dunbrack R.L. Jr. (2005)Nucleic Acids Res.,33, W94–W98. [DOI] [PMC free article] [PubMed] [Google Scholar]
- Word J.M., Lovell S.C., Richardson J.S. and Richardson D.C. (1999)J. Mol. Biol.,285, 1735–1747. [DOI] [PubMed] [Google Scholar]
- Zhou A.Q., O'Hern C.S. and Regan L. (2012)Biophys. J.,102, 2345–2352. [DOI] [PMC free article] [PubMed] [Google Scholar]
- Zhou A.Q., O'Hern C.S. and Regan L. (2014)Proteins,82, 2574–2584. [DOI] [PubMed] [Google Scholar]
Associated Data
This section collects any data citations, data availability statements, or supplementary materials included in this article.


