Abstract
Type 2 diabetes mellitus is a chronic disease that occurs among the general population. The insulin-lowering and homeostasis model assessment of insulin resistance-improving effects of inulin are unconfirmed. We conducted this meta-analysis to examine the efficiency and safety of inulin for improving insulin control, homeostasis model assessment of insulin resistance and HbA1c in patients with type 2 diabetes mellitus. We searched the Web of Science, PubMed, Embase and Cochrane Library databases for relevant articles published before June 1, 2019. In total, 225 randomized controlled trials regarding the efficiency of inulin for the treatment of type 2 diabetes mellitus compared to the efficacy of placebo or other treatments were examined. According to the inclusion and exclusion criteria, 9 trials with a total of 661 participants were included. We concluded that inulin supplementation can significantly improve fasting plasma glucose (SMD = −0.55, 95% CI –0.73 to −0.36, p = 0), HOMA-IR (SMD = −0.81, 95% CI –1.59 to −0.03, p = 0.042) and HbA1c (SMD = −0.69, 95% CI −0.92 to −0.46, p = 0). Further subgroup analyses revealed a significant role of inulin supplementation for treatment durations ≥8 weeks (p = 0.038 for insulin, p = 0.002 for HOMA-IR, p = 0.032 for FPG, p = 0 for HbA1c).
Keywords: inulin supplementation, type 2 diabetes mellitus, HOMA-IR, meta-analysis
Introduction
The worldwide prevalence of diabetes and its complications pose a health threat, and type 2 diabetes mellitus (T2DM) with its complications, such as diabetic nephropathy, diabetic retinopathy, diabetic foot and cardiovascular disease, are associated with the highest burden of mortality and disability.(1) The reduction or elimination of T2DM in whole populations is a fundamental goal in public health.(2) High energy intake and an imbalance of energy in to exercise are the major contributing causes of type 2 diabetes, which promote the abnormal glucose and lipids.(3) The increases in blood pressure, glucose and lipids are associated with impaired insulin secretion from the β-cells of pancreatic islets, insulin resistance in peripheral tissues, decreased glucose utilization in peripheral tissues, and abnormal hepatic glucose production.(4) Moreover, β-cell dysfunction is a primary defect in genetic T2DM.(5)
Inulin, a kind of water-soluble storage polysaccharide and nondigestible carbohydrate, is a type of fructan.(6) In recent years, inulin has been widely applied as a dietary supplement to improve blood glucose and lipids.(7–10) Furthermore, as a kind of dietary fiber with low caloric value and promoting absorption of calcium, its’ various nutritional and health benefits of inulin have been proved.(11–13) Compared to the β-glucan, a soluble fibers, which improves insulin resistance by regulating multiple receptors and activating PI3K/Akt signaling pathway, the mechanism of the inulin on glucose and lipids are under discussed.(14) The mechanism of the hypolipidemic effects of inulin in rats was discussed in 2017.(15) The mechanism for improving the lipid profile may be attributed to the increase in muscle lipoprotein lipase enzyme activity, which promotes the production of short-chain fatty acids.(16) Moreover, the increased production of the short-chain fatty acid (SCFA) acetate, propionate and butyrate in colonic are associated with the increased dietary intake such as whole-grain, resistant starches and inulin-type fructans, which improves the activity of gut microbiota and promotes the insulin sensitivity; this could be another potential mechanism around the insulin-lowering effects.(17–24) Another meta-analysis with 20 trials demonstrated a significant LDL-c lowering effect of inulin among individuals with metabolic abnormalities, but the meta-analysis failed to assess insulin control in T2DM patients.(25) Therefore, we conducted this analysis to evaluate the efficiency of inulin in T2DM patients based on the following indices: fasting plasma glucose (FPG), insulin, homeostasis model assessment of insulin resistance (HOMA-IR) and HbA1c, which are closely related to the prognosis of T2DM.
Methods
Literature search
We searched the Web of Science, PubMed, Embase and Cochrane Library databases for only English and randomized controlled trial (RCT) articles published before June 1, 2019. We used medical subject heading (MeSH) terms and comparable terms in the related databases to screen articles. The key search terms included (Inulin) AND (Diabetes Mellitus, Noninsulin-Dependent OR Diabetes Mellitus, Ketosis-Resistant OR Diabetes Mellitus, Type II OR Maturity-Onset Diabetes Mellitus OR Type 2 Diabetes OR Type 2 Diabetes Mellitus) AND (Randomized OR Randomized Controlled Trial).
Inclusion and exclusion criteria
The inclusion criteria for this study included the following: (1) published RCT articles written in English; (2) patients were diagnosed with T2DM and inulin supplementation was used as an intervention; (3) studies that provided the mean ± SD, mean ± SE or median (range) for the intervention and control groups for the baseline and the end of the trial; (4) the duration of the study was >5 weeks; (5) the form of inulin supplementation could be pure powder, a composite with a main ingredient of inulin or a capsule; (6) the typical frequency of intake and the dosage was not required; and (7) the parameters reported in the studies included at least insulin and HOMA-IR. Contrary to the above, the exclusion criteria included the following: (1) patients under 18 years or who were pregnant; (2) similar studies performed by the same authors with the same subjects and experimental data;(26,27) (3) the intervention group was administered other treatment with inulin supplementation but the control group was administered placebo/control food instead of the treatment; (4) lack of comparative data; and (5) data were reported as a diagram.
Data extraction
Two independent investigators (WZ and YT) were responsible for the selection of articles. From the full-text articles that were obtained, we screened the titles and abstracts and further extracted information regarding the design of each study, patient characteristics, number of participants, properties of the study population, duration of the intervention, year of publication, and mean ± SD. To minimize heterogeneity, the intervention duration of the included studies was considered, and different units were unified (parameters in mmol/L were converted to mg/dl by multiplying by 18). To ensure the integrity of the data, the corresponding authors of studies with vague or insufficient data were contacted by e-mail twice before excluding the study.
Evaluation of bias
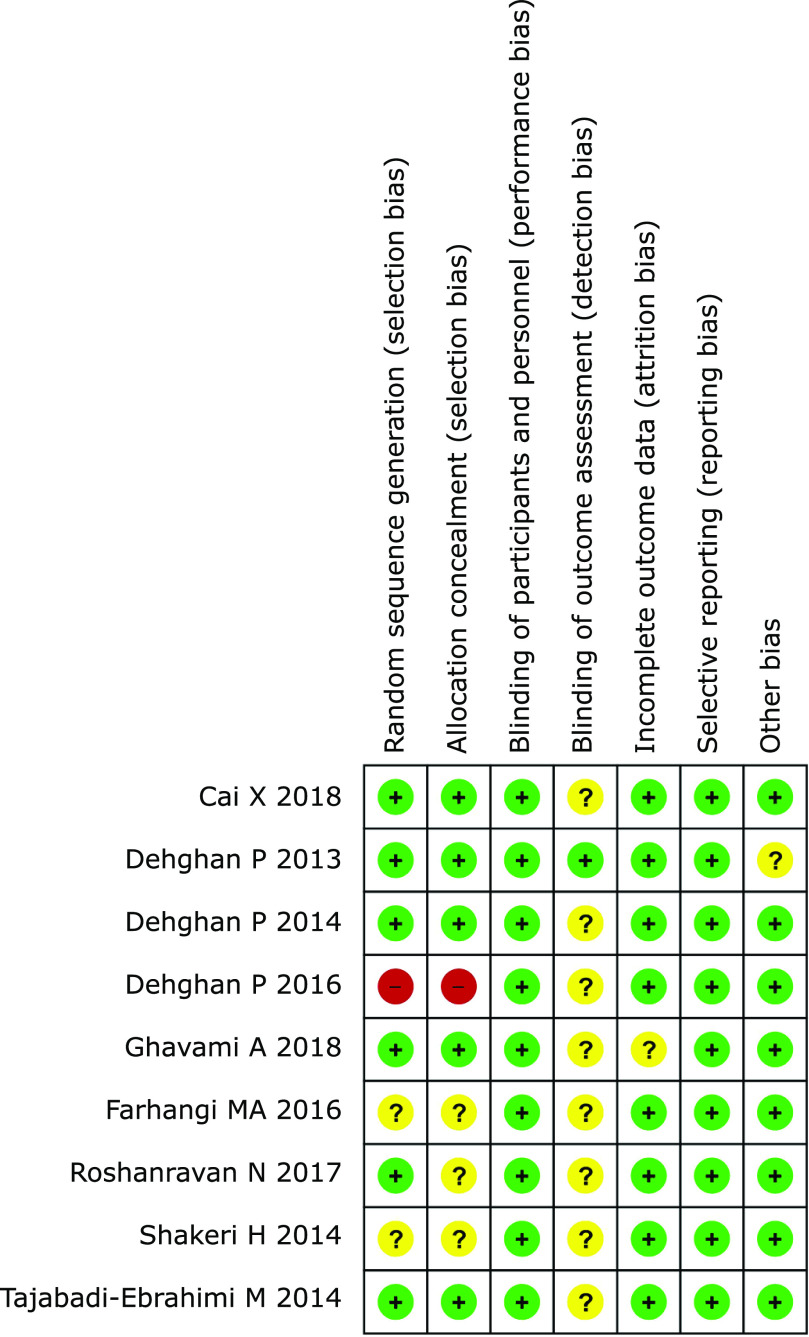
Review Manager (ver. 5.3) was applied to assess the risk of bias among the selected trials. There were 6 aspects included in the study quality assessment: random sequence generation, allocation concealment, blinding of participants and personnel, blinding of outcome assessment, incomplete outcome data, selective reporting and other bias. Each aspect was marked as low risk (in green), unclear risk (in yellow) or high risk (in red) (Fig. 2).
Statistical analysis
We extracted continuous variables and analyzed them using STATA (ver. 12.0). In the case of the mean ± SD, the data that were used to calculate the mean ± SE were converted to SD according to the following formula: mean = mean (after treatment) – mean (baseline); SD = SE × square root n (n: number of participants) and SD = square root [(SD baseline)2 + (SD after treatment)2 – (2R × SD baseline × SD after treatment)]; the correlation coefficient (R) = 0.5.(28) Additionally, the other formula could be used to convert the median.(29) The standardized mean difference (SMD) was used because of one different unit used to measure FPG,(30) and the other parameters were all examined in terms of weighted mean difference (WMD). The chi-squared and I-squared (I2) tests were used to assess statistical heterogeneity among the analyzed trials. When p<0.1 and I2>50%, which indicates significant heterogeneity, the random-effect model was applied. Otherwise, the fix-effect model was applied. Additionally, the significant differences between the intervention and control groups were indicated by a p value <0.05. SMD values close to 0 (p>0.05) indicated no statistical significance. In contrast, SMD was considered statistically significant when it was different from 0 (p<0.05). To explore the heterogeneity between studies, subgroup analyses were conducted based on the duration of intervention. We dropped one data point in the meta-analysis and subgroup analyses because its unit of HbA1c was mmol/mol, which cannot be converted to the commonly used unit of percentage (%).(31) The funnel plots and Begg’s test were conducted to assess publication bias. But only 9 studies were included in the meta-analysis, funnel plots and Begg’s test could not be performed.
Results
Study features
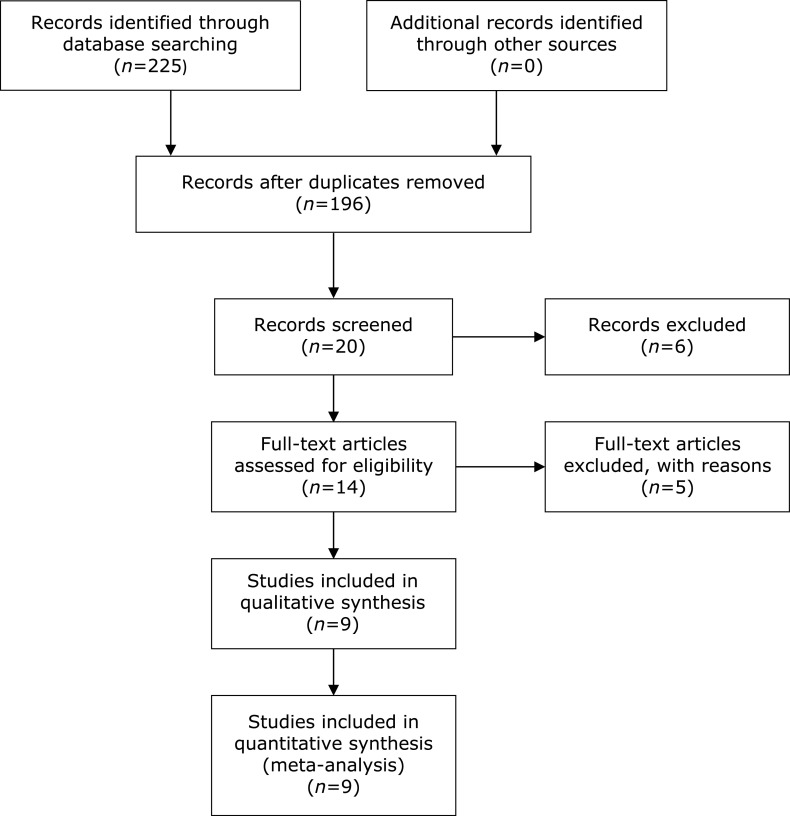
We included 225 articles from the Web of Science, PubMed, Embase and Cochrane Library databases at first. No additional records from other sources were found. Then, 14 studies were screened for further assessment. After the application of the inclusion and exclusion criteria, 3 studies(32–34) were excluded due to the third exclusion criterion, and one study(26) was excluded due to the second exclusion criterion. Additionally, although the trial performed by Bahmani et al.(35) reported the changes in alanine aminotransferase (ALT), aspartate aminotransferase (AST) and aspartic acid, it was excluded due to a lack of main parameters related to this study. A total of 9 RCTs that included a total of 661 participants were included in this meta-analysis by PRISMA diagram (Fig. 1).(36) In addition, the serum biochemical parameters from before and after treatment are shown in Supplemental Table 1*. Except for one study(30) that was conducted in China, the remaining 8 studies(27,31,37–42) were conducted in Iran. The design of all studies used double-blinding procedures, with the exception of 2 studies(27,42) that implemented triple-blinding methods. The duration of the interventions ranged from 6 weeks to 12 weeks, and the dosage of inulin supplementation ranged from 8.4 g to 10 g. The basic characteristics of the included trials are summarized in Table 1.
Fig. 1.
PRISMA diagram.
Table 1.
The basic characteristics of the included trials
| Author | Year | N (inter/cont) | Age (inter) | Age (cont) | Intervention |
Control | Duration | Study design | |
|---|---|---|---|---|---|---|---|---|---|
| Type | Dosage of inulin | ||||||||
| Cai X(30) | 2018 | 99 (49/50) | 60.94 ± 5.35 | 60.16 ± 5.84 | Milk powder co-supplemented with inulin and resistant dextrin | 10–30 g | Milk powder | 12 weeks | Double-blinded placebo RCT |
| Dehghan P(26) | 2013 | 54 (24/25) | 47.8 ± 10.1 | 48.7 ± 9.7 | Inulin | 10 g | Maltodextrin | 8 weeks | Triple-blinded placebo RCT |
| Dehghan P(27) | 2014 | 54 (27/25) | 48.4 ± 8.4 | 48.7 ± 9.7 | Oligofructose-enriched inulin | 10 g | Maltodextrin | 8 weeks | Triple-blinded placebo RCT |
| Dehghan P(40) | 2016 | 54 (27/22) | 48.07 ± 8.7 | 48.61 ± 9.16 | Oligofructose-enriched inulin | 10 g | Placebo | 2 months | Double-blinded placebo RCT |
| Ghavami A(38) | 2018 | 46 (23/23) | 41.5 ± 6.27 | 42.73 ± 5.95 | HP inulin | 10 g | Placebo | 6 weeks | Double-blinded placebo RCT |
| MA Farhangi(37) | 2016 | 54 (27/22) | 48.07 ± 8.7 | 48.61 ± 9.16 | Chicory enriched inulin | 10 g | Placebo | 2 months | Double-blinded placebo RCT |
| Neda Roshanravan(31) | 2017 | 60 (15/15) | 51.47 ± 6.46 | 51.73 ± 8.44 | Inulin powder + butyrate placebo | 10 g | Butyrate placebo + inulin placebo | 45 days | Double-blinded placebo RCT |
| Shakeri H(41) | 2014 | 78 (26/26) | 52.3 ± 10.8 | 52.3 ± 8.2 | Synbiotic bread (Lactobacillus sporogenes + inulin) | 8.4 g | Probiotic bread (Lactobacillus sporogenes) | 8 weeks | Double-blinded RCT |
| Tajabadi-Ebrahimi M(39) | 2014 | 81 (27/27) | 51.3 ± 10.4 | 53.4 ± 7.5 | Synbiotic bread (Lactobacillus sporogenes + inulin) | 8.4 g | Probiotic bread (Lactobacillus sporogenes) | 8 weeks | Double-blinded placebo RCT |
HP, high performance; RCT, randomized controlled trial.
Quality assessment
We applied Review Manager (ver. 5.3) to assess the quality of the included studies. Each parameter was unequal to the others due to the differences in the studies. In terms of random sequence generation, a total of 2 trials(37,41) demonstrated an unclear risk of bias, and one trial(40) demonstrated a high risk of bias. In terms of allocation concealment, a total of 3 trials(31,37,41) were considered as having an unclear risk of bias, and one(40) was considered to have a high risk of bias. All trials were marked as having a low risk of bias in terms of blinding participants and selective reporting. Regarding the blinding of the outcome assessment, a total of 8 trials(30,31,37–42) demonstrated an unclear risk. In terms of incomplete outcome data and other bias, each aspect had one trial(27,38) with an unclear risk of bias (Fig. 2).
Fig. 2.
Risk of bias. +: low risk of bias; −: high risk of bias; ?: unclear risk of bias.
Meta-analysis
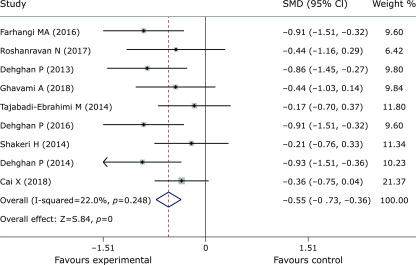
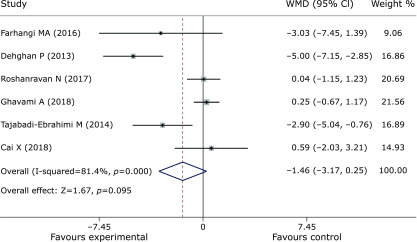
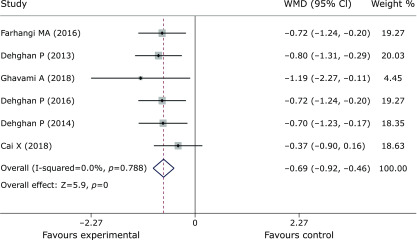
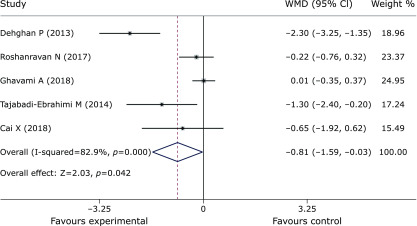
Pooled data from 9 trials(27,30,31,37–42) showed obvious efficacy for reducing FPG (SMD = –0.55, 95% CI –0.73 to –0.36, p = 0, Fig. 3). However, inulin supplementation did not display a positive effect on insulin control (SMD = –1.46, 95% CI –3.17 to 0.25, p = 0.095, Fig. 4). The meta-analysis of 6 studies(27,30,37,38,40,42) implied a distinct benefit in the intervention group (n = 177) for improving HbA1c, but the results demonstrated inconspicuous heterogeneity compared with the results of the control group (n = 167) (SMD = –0.69, 95% CI –0.92 to –0.46, p = 0, I2 = 0, Fig. 5). Moreover, inulin supplementation was effective when efficacy was measured by HOMA-IR (SMD = –0.81, 95% CI –1.59 to –0.03. p = 0.042, Fig. 6).
Fig. 3.
Forest plot of the meta-analysis comparing the experimental and control groups in terms of FPG.
Fig. 4.
Forest plot of the meta-analysis comparing the experimental and control groups in terms of insulin control.
Fig. 5.
Forest plot of the meta-analysis comparing the experimental and control groups in terms of HbA1c.
Fig. 6.
Forest plot of the meta-analysis comparing the experimental and control groups in terms of HOMA-IR.
Subgroup analyses
Subgroup analyses were performed according to the duration of the intervention (<8 weeks and ≥8 weeks) (Supplemental Fig. 1*). Because the dosage of inulin supplementation was not substantially different among the studies and because the dosage in the trial performed by Cai X et al.(30) was not specific, a subgroup analysis based on dosage was not conducted. When grouped by duration, significant improvements associated with a duration ≥8 weeks were observed in terms of insulin control (SMD = –2.62, 95% CI –5.1 to –0.14, p = 0.038), HOMA-IR (SMD = –1.49, 95% CI –2.44 to –0.53, p = 0.002), FPG (SMD = –0.57, 95% CI –0.77 to –0.37, p = 0.032) and HbA1c (SMD = –0.66, 95% CI –0.9 to –0.43, p = 0). Moreover, when the duration of the intervention was <8 weeks, only HbA1c was significantly different (SMD = –1.19, 95% CI –2.27 to –0.11, p = 0.032); this subgroup included one trial.(38)
Discussion
Patients with T2DM account for 90–95% of all patients with diabetes, and obesity is common.(43) In order to alleviate the condition of T2DM, a healthy diet and lifestyle are necessary. Dietary fiber can reduce the weight and postprandial blood glucose.(20,21,44) Inulin, with dietary fiber and prebiotic functions, is widely derived from vegetables and fruits like onion, leek, garlic, banana, wheat, rye and barley.(45,46) The physicochemical behavior of inulin is associated with the daily intake and the degree of polymerization (DP). And the DP of different sources of inulin is different, which is determined by processing history, growing conditions, weather, harvesting time and storage conditions.(47) The main difference between synthetic inulin and plant inulin is the polydispersity.(48) Due to the amount of inulin in food is relatively low, the supplement is applied for therapeutic effects. And the US FDA (Food and Drug Administration) confirmed that inulin is GRAS (Generally Recognized Safe Substance), and the daily effective intake is 5 g, the recommended maximum daily intake is 15–20 g in 2003. In addition, the β-glucan, another dietary fiber that has a similar functions to inulin, is mainly included in barley and oat.(49,50) It’s recommended minimum intake is 3 g/day.(51)
A systematic review of 9 RCTs of inulin supplementation in patients with T2DM revealed the beneficial efficacy of inulin on HOMA-IR, FPG and HbA1c. Although there was no significant improvement in insulin, the subgroup analysis revealed an insulin-lowering effect associated with a supplementation duration ≥8 weeks. The parameters assessed in this study are essential for the management of T2DM. Although the HOMA-IR value was calculated using fasting plasma insulin (FPI) concentration and FPG,(52) its cut-off value is important for healthcare management in various age, ethnic and sex groups among patients with different diseases.(53,54) According to international guidelines, patients with diabetes are recommended to undergo regular HbA1c tests, which monitor glycemic control over the prior 2–3 months.(55–57) Moreover, insulin control is also critical in terms of the progression and diagnosis of T2DM. When the insulin peak is lower than 60 mu U/ml, diabetic complications of retinopathy, sensory neuropathy, and renal disease are more likely to appear.(58)
Although inulin benefits notwithstanding, an article published in Cell demonstrated that dysregulated microbial fermentation of soluble fiber can induce icteric hepatocellular carcinoma (HCC) in mice.(59) To avoid the increased risk of HCC after inulin intake, the complication of inulin should also be concerned. The only reported adverse effects, reported in the trial by Cai X et al.,(30) were as follows: 3 patients felt dizzy, 4 experienced insomnia and sleepiness, 3 experienced gastrectasia, one had diarrhea and 5 experienced constipation. However, the adverse effects were no significant differences between experimental and control groups. Other studies did not show serious side effects. In addition to the utility of inulin supplementation measured based on the above parameters, several trials(33–35) also reported its effect on liver transaminases. However, the outcomes between the intervention and control groups did not demonstrate significant improvement from baseline to the end of the trial.
There are still some limitations in this analysis, and the findings should be interpreted cautiously. The assessment of a high risk of bias may affect the overall results of the analysis, and the impact of inulin supplementation may have been assessed to be greater than the actual impact due to the bias. In addition, the relatively small sample size may have resulted in an incorrect conclusion. In addition to the selected RCTs, 3 trials(27,40,42) were conducted by the same author within three years, and these study results may interact with each other and produce bias. Although data from each study was different, 8/9 studies were conducted in Iran. It does not rule out the possibility of mutual influence among authors, which may also produce bias. Moreover, the bias may also be produced due to the most studies were in women. Finally, bias existed due to a lack of blinded outcome assessment. Even if the experimenters and participants were blinded, the unclear risk of bias in trials was hard to avoid.
Subjects who received inulin supplementation demonstrated improvements in T2DM parameters, including lower HOMA-IR, HbA1c, and FPG levels than the subjects who did not receive inulin supplementation. Additionally, insulin control was improved during the treatment that was ≥8 weeks. Our study may offer dietitians a guide for treatment of T2DM in the future. However, additional studies including larger sample sizes and higher quality are needed to determine the true efficacy of inulin.
Author Contributions
WZ, QY and HH contributed to the conception and design of the study. WZ and YT conducted the literature search and data extraction and performed the statistical analyses. WZ, YT and JH drafted the manuscript. YY, QY and HH supervised the study. All authors gave final approval.
Abbreviations
- FPG
fasting plasma glucose
- HOMA-IR
homeostasis model assessment of insulin resistance
- RCTs
randomized controlled trial
- T2DM
type 2 diabetes mellitus
Funding
This research was supported by the Natural Science Foundation of China (grant no. 81171560), the “Par-Eu Scholars Program” of Chongqing City and the National Science and Technology Major Project of China (grant no. 2012ZX10002007001).
Conflict of Interest
No potential conflicts of interest were disclosed.
Supplementary Material
References
- 1.Zheng Y, Ley SH, Hu FB. Global aetiology and epidemiology of type 2 diabetes mellitus and its complications. Nat Rev Endocrinol 2018; 14: 88–98. [DOI] [PubMed] [Google Scholar]
- 2.King H, Dowd JE. Primary prevention of type 2 (non-insulin-dependent) diabetes mellitus. Diabetologia 1990; 33: 3–8. [DOI] [PubMed] [Google Scholar]
- 3.Pfeiffer AF, Klein HH. The treatment of type 2 diabetes. Dtsch Arztebl Int 2014; 111: 69–81; quiz 82. [DOI] [PMC free article] [PubMed] [Google Scholar]
- 4.Rehman K, Akash MSH. Mechanism of generation of oxidative stress and pathophysiology of type 2 diabetes mellitus: how are they interlinked? J Cell Biochem 2017; 118: 3577–3585. [DOI] [PubMed] [Google Scholar]
- 5.O’Rahilly SP, Nugent Z, Rudenski AS, et al. . Beta-cell dysfunction, rather than insulin insensitivity, is the primary defect in familial type 2 diabetes. Lancet 1986; 2: 360–364. [DOI] [PubMed] [Google Scholar]
- 6.Shoaib M, Shehzad A, Omar M, et al. . Inulin: properties, health benefits and food applications. Carbohydr Polym 2016; 147: 444–454. [DOI] [PubMed] [Google Scholar]
- 7.Forcheron F, Beylot M. Long-term administration of inulin-type fructans has no significant lipid-lowering effect in normolipidemic humans. Metabolism 2007; 56: 1093–1098. [DOI] [PubMed] [Google Scholar]
- 8.Pedersen A, Sandström B, Van Amelsvoort JM. The effect of ingestion of inulin on blood lipids and gastrointestinal symptoms in healthy females. Br J Nutr 1997; 78: 215–222. [DOI] [PubMed] [Google Scholar]
- 9.Russo F, Chimienti G, Riezzo G, et al. . Inulin-enriched pasta affects lipid profile and Lp(a) concentrations in Italian young healthy male volunteers. Eur J Nutr 2008; 47: 453–459. [DOI] [PubMed] [Google Scholar]
- 10.van Dokkum W, Wezendonk B, Srikumar TS, van den Heuvel EG. Effect of nondigestible oligosaccharides on large-bowel functions, blood lipid concentrations and glucose absorption in young healthy male subjects. Eur J Clin Nutr 1999; 53: 1–7. [DOI] [PubMed] [Google Scholar]
- 11.Cherbut C. Inulin and oligofructose in the dietary fibre concept. Br J Nutr 2002; 87 Suppl 2: S159–S162. [DOI] [PubMed] [Google Scholar]
- 12.Flamm G, Glinsmann W, Kritchevsky D, Prosky L, Roberfroid M. Inulin and oligofructose as dietary fiber: a review of the evidence. Crit Rev Food Sci Nutr 2001; 41: 353–362. [DOI] [PubMed] [Google Scholar]
- 13.Kruger MC, Chan YM, Kuhn-Sherlock B, et al. . Differential effects of calcium- and vitamin D-fortified milk with FOS-inulin compared to regular milk, on bone biomarkers in Chinese pre- and postmenopausal women. Eur J Nutr 2016; 55: 1911–1921. [DOI] [PubMed] [Google Scholar]
- 14.Chen J, Seviour R. Medicinal importance of fungal β-(1→3), (1→6)-glucans. Mycol Res 2007; 111 (Pt 6): 635–652. [DOI] [PubMed] [Google Scholar]
- 15.Han KH, Yamamoto A, Shimada KI, Kikuchi H, Fukushima M. Dietary fat content modulates the hypolipidemic effect of dietary inulin in rats. Mol Nutr Food Res 2017; 61. DOI: 10.1002/mnfr.201600635 [DOI] [PubMed] [Google Scholar]
- 16.Reis SA, Conceicao LL, Rosa DD, Dias MM, Peluzio Mdo C. Mechanisms used by inulin-type fructans to improve the lipid profile. Nutr Hosp 2014; 31: 528–534. [DOI] [PubMed] [Google Scholar]
- 17.David LA, Maurice CF, Carmody RN, et al. . Diet rapidly and reproducibly alters the human gut microbiome. Nature 2014; 505: 559–563. [DOI] [PMC free article] [PubMed] [Google Scholar]
- 18.Flint HJ, Scott KP, Duncan SH, Louis P, Forano E. Microbial degradation of complex carbohydrates in the gut. Gut Microbes 2012; 3: 289–306. [DOI] [PMC free article] [PubMed] [Google Scholar]
- 19.Guess ND, Dornhorst A, Oliver N, Frost GS. A randomised crossover trial: the effect of inulin on glucose homeostasis in subtypes of prediabetes. Ann Nutr Metab 2016; 68: 26–34. [DOI] [PubMed] [Google Scholar]
- 20.Liu S, Willett WC, Manson JE, Hu FB, Rosner B, Colditz G. Relation between changes in intakes of dietary fiber and grain products and changes in weight and development of obesity among middle-aged women. Am J Clin Nutr 2003; 78: 920–927. [DOI] [PubMed] [Google Scholar]
- 21.Ludwig DS, Pereira MA, Kroenke CH, et al. . Dietary fiber, weight gain, and cardiovascular disease risk factors in young adults. JAMA 1999; 282: 1539–1546. [DOI] [PubMed] [Google Scholar]
- 22.Macfarlane S, Macfarlane GT. Regulation of short-chain fatty acid production. Proc Nutr Soc 2003; 62: 67–72. [DOI] [PubMed] [Google Scholar]
- 23.Pereira MA, Jacobs DR, Jr, Pins JJ, et al. . Effect of whole grains on insulin sensitivity in overweight hyperinsulinemic adults. Am J Clin Nutr 2002; 75: 848–855. [DOI] [PubMed] [Google Scholar]
- 24.Robertson MD, Bickerton AS, Dennis AL, Vidal H, Frayn KN. Insulin-sensitizing effects of dietary resistant starch and effects on skeletal muscle and adipose tissue metabolism. Am J Clin Nutr 2005; 82: 559–567. [DOI] [PubMed] [Google Scholar]
- 25.Liu F, Prabhakar M, Ju J, Long H, Zhou HW. Effect of inulin-type fructans on blood lipid profile and glucose level: a systematic review and meta-analysis of randomized controlled trials. Eur J Clin Nutr 2017; 71: 9–20. [DOI] [PubMed] [Google Scholar]
- 26.Dehghan P, Pourghassem Gargari B, Asgharijafarabadi M. Effects of high performance inulin supplementation on glycemic status and lipid profile in women with type 2 diabetes: a randomized, placebo-controlled clinical trial. Health Promot Perspect 2013; 3: 55–63. [DOI] [PMC free article] [PubMed] [Google Scholar]
- 27.Dehghan P, Gargari BP, Jafar-Abadi MA, Aliasgharzadeh A. Inulin controls inflammation and metabolic endotoxemia in women with type 2 diabetes mellitus: a randomized-controlled clinical trial. Int J Food Sci Nutr 2014; 65: 117–123. [DOI] [PubMed] [Google Scholar]
- 28.Higgins JP, Altman DG, Gotzsche PC, et al. . The Cochrane Collaboration’s tool for assessing risk of bias in randomised trials. BMJ 2011; 343: d5928. [DOI] [PMC free article] [PubMed] [Google Scholar]
- 29.Hozo SP, Djulbegovic B, Hozo I. Estimating the mean and variance from the median, range, and the size of a sample. BMC Med Res Methodol 2005; 5: 13. [DOI] [PMC free article] [PubMed] [Google Scholar]
- 30.Cai X, Yu H, Liu L, et al. . Milk powder co-supplemented with inulin and resistant dextrin improves glycemic control and insulin resistance in elderly type 2 diabetes mellitus: a 12-week randomized, double-blind, placebo-controlled trial. Mol Nutr Food Res 2018; 62: e1800865. [DOI] [PubMed] [Google Scholar]
- 31.Roshanravan N, Mahdavi R, Alizadeh E, et al. . Effect of butyrate and inulin supplementation on glycemic status, lipid profile and glucagon-like peptide 1 level in patients with type 2 diabetes: a randomized double-blind, placebo-controlled trial. Horm Metab Res 2017; 49: 886–891. [DOI] [PubMed] [Google Scholar]
- 32.Tajabadi-Ebrahimi M, Sharifi N, Farrokhian A, et al. . A randomized controlled clinical trial investigating the effect of synbiotic administration on markers of insulin metabolism and lipid profiles in overweight type 2 diabetic patients with coronary heart disease. Exp Clin Endocrinol Diabetes 2017; 125: 21–27. [DOI] [PubMed] [Google Scholar]
- 33.Asemi Z, Aarabi MH, Hajijafari M, et al. . Effects of synbiotic food consumption on serum minerals, liver enzymes, and blood pressure in patients with type 2 diabetes: a double-blind randomized cross-over controlled clinical trial. Int J Prev Med 2017; 8: 43. [DOI] [PMC free article] [PubMed] [Google Scholar]
- 34.Asemi Z, Alizadeh SA, Ahmad K, Goli M, Esmaillzadeh A. Effects of beta-carotene fortified synbiotic food on metabolic control of patients with type 2 diabetes mellitus: a double-blind randomized cross-over controlled clinical trial. Clin Nutr 2016; 35: 819–825. [DOI] [PubMed] [Google Scholar]
- 35.Bahmani F, Tajadadi-Ebrahimi M, Kolahdooz F, et al. . The consumption of synbiotic bread containing Lactobacillus sporogenes and inulin affects nitric oxide and malondialdehyde in patients with type 2 diabetes mellitus: randomized, double-blind, placebo-controlled trial. J Am Coll Nutr 2016; 35: 506–513. [DOI] [PubMed] [Google Scholar]
- 36.Moher D, Liberati A, Tetzlaff J, Altman JG ; PRISMA Group . Preferred reporting items for systematic reviews and meta-analyses: the PRISMA statement. PLoS Med 2009; 6: e1000097. [DOI] [PMC free article] [PubMed] [Google Scholar]
- 37.Farhangi MA, Javid AZ, Dehghan P. The effect of enriched chicory inulin on liver enzymes, calcium homeostasis and hematological parameters in patients with type 2 diabetes mellitus: a randomized placebo-controlled trial. Prim Care Diabetes 2016; 10: 265–271. [DOI] [PubMed] [Google Scholar]
- 38.Ghavami A, Roshanravan N, Alipour S, et al. . Assessing the effect of high performance inulin supplementation via KLF5 mRNA expression in adults with type 2 diabetes: a randomized placebo controlled clinical trail. Adv Pharm Bull 2018; 8: 39–47. [DOI] [PMC free article] [PubMed] [Google Scholar]
- 39.Tajadadi-Ebrahimi M, Bahmani F, Shakeri H, et al. . Effects of daily consumption of synbiotic bread on insulin metabolism and serum high-sensitivity C-reactive protein among diabetic patients: a double-blind, randomized, controlled clinical trial. Ann Nutr Metab 2014; 65: 34–41. [DOI] [PubMed] [Google Scholar]
- 40.Dehghan P, Farhangi MA, Tavakoli F, Aliasgarzadeh A, Akbari AM. Impact of prebiotic supplementation on T-cell subsets and their related cytokines, anthropometric features and blood pressure in patients with type 2 diabetes mellitus: a randomized placebo-controlled trial. Complement Ther Med 2016; 24: 96–102. [DOI] [PubMed] [Google Scholar]
- 41.Shakeri H, Hadaegh H, Abedi F, et al. . Consumption of synbiotic bread decreases triacylglycerol and VLDL levels while increasing HDL levels in serum from patients with type-2 diabetes. Lipids 2014; 49: 695–701. [DOI] [PubMed] [Google Scholar]
- 42.Dehghan P, Pourghassem Gargari B, Asghari Jafar-abadi M. Oligofructose-enriched inulin improves some inflammatory markers and metabolic endotoxemia in women with type 2 diabetes mellitus: a randomized controlled clinical trial. Nutrition 2014; 30: 418–423. [DOI] [PubMed] [Google Scholar]
- 43.American Diabetes Association. Diagnosis and classification of diabetes mellitus. Diabetes Care 2010; 33 (Suppl 1): S62–S69. [DOI] [PMC free article] [PubMed] [Google Scholar]
- 44.Lightowler H, Thondre S, Holz A, Theis S. Replacement of glycaemic carbohydrates by inulin-type fructans from chicory (oligofructose, inulin) reduces the postprandial blood glucose and insulin response to foods: report of two double-blind, randomized, controlled trials. Eur J Nutr 2018; 57: 1259–1268. [DOI] [PubMed] [Google Scholar]
- 45.Mensink MA, Frijlink HW, van der Voort Maarschalk K, Hinrichs WL. Inulin, a flexible oligosaccharide I: review of its physicochemical characteristics. Carbohydr Polym 2015; 130: 405–419. [DOI] [PubMed] [Google Scholar]
- 46.Roberfroid M, Slavin J. Nondigestible oligosaccharides. Crit Rev Food Sci Nutr 2010; 40: 461–480. [DOI] [PubMed] [Google Scholar]
- 47.Flores AC, Morlett JA, Rodriguez R. Inulin potential for enzymatic obtaining of prebiotic oligosaccharides. Crit Rev Food Sci Nutr 2016; 56: 1893–1902. [DOI] [PubMed] [Google Scholar]
- 48.Wada T, Sugatani J, Terada E, Ohguchi M, Miwa M. Physicochemical characterization and biological effects of inulin enzymatically synthesized from sucrose. J Agric Food Chem 2005; 53: 1246–1253. [DOI] [PubMed] [Google Scholar]
- 49.He LX, Zhao J, Huang YS, Li Y. The difference between oats and beta-glucan extract intake in the management of HbA1c, fasting glucose and insulin sensitivity: a meta-analysis of randomized controlled trials. Food Funct 2016; 7: 1413–1428. [DOI] [PubMed] [Google Scholar]
- 50.Havrlentova M, Kraic J. Content of β-d-glucan in cereal grains. J Food Nutr Res (Slovak Republic) 2006;45:97–103. [Google Scholar]
- 51.Brown L, Rosner B, Willett WW, Sacks FM. Cholesterol-lowering effects of dietary fiber: a meta-analysis. Am J Clin Nutr 1999; 69: 30–42. [DOI] [PubMed] [Google Scholar]
- 52.Tang Q, Li X, Song P, Xu L. Optimal cut-off values for the homeostasis model assessment of insulin resistance (HOMA-IR) and pre-diabetes screening: developments in research and prospects for the future. Drug Discov Ther 2015; 9: 380–385. [DOI] [PubMed] [Google Scholar]
- 53.Gayoso-Diz P, Otero-González A, Rodriguez-Alvarez MX, et al. . Insulin resistance (HOMA-IR) cut-off values and the metabolic syndrome in a general adult population: effect of gender and age: EPIRCE cross-sectional study. BMC Endocr Disord 2013; 13: 47. [DOI] [PMC free article] [PubMed] [Google Scholar]
- 54.Quinn SM, Baur LA, Garnett SP, Cowell CT. Treatment of clinical insulin resistance in children: a systematic review. Obes Rev 2010; 11: 722–730. [DOI] [PubMed] [Google Scholar]
- 55.American Diabetes Association. Standards of medical care in diabetes-2016: summary of revisions. Diabetes Care 2016; 39 Suppl 1: S4–S5. [DOI] [PubMed] [Google Scholar]
- 56.Rydén L, Grant PJ, Anker SD, et al. . ESC Guidelines on diabetes, pre-diabetes, and cardiovascular diseases developed in collaboration with the EASD: the Task Force on diabetes, pre-diabetes, and cardiovascular diseases of the European Society of Cardiology (ESC) and developed in collaboration with the European Association for the Study of Diabetes (EASD). Eur Heart J 2013; 34: 3035–3087. [DOI] [PubMed] [Google Scholar]
- 57.Dunning T, Sinclair A, Colagiuri S. New IDF Guideline for managing type 2 diabetes in older people. Diabetes Res Clin Pract 2014; 103: 538–540. [DOI] [PubMed] [Google Scholar]
- 58.Turkington RW, Weindling HK. Insulin secretion in the diagnosis of adult-onset diabetes mellitus. JAMA 1978; 240: 833–836. [PubMed] [Google Scholar]
- 59.Singh V, Yeoh BS, Chassaing B, et al. . Dysregulated microbial fermentation of soluble fiber induces cholestatic liver cancer. Cell 2018; 175: 679–694.e622. [DOI] [PMC free article] [PubMed] [Google Scholar]
Associated Data
This section collects any data citations, data availability statements, or supplementary materials included in this article.


