

Abstract
The goal of this study was to identify differentially expressed genes (DEGs) responsible for peanut plant (Arachis hypogaea) defence against Puccinia arachidis (causative agent of rust disease). Genes were identified using a high-throughput RNA-sequencing strategy. In total, 86,380,930 reads were generated from RNA-Seq data of two peanut genotypes, JL-24 (susceptible), and GPBD-4 (resistant). Gene Ontology (GO) and KEGG analysis of DEGs revealed essential genes and their pathways responsible for defence response to P. arachidis. DEGs uniquely upregulated in resistant genotype included pathogenesis-related (PR) proteins, MLO such as protein, ethylene-responsive factor, thaumatin, and F-box, whereas, other genes down-regulated in susceptible genotype were Caffeate O-methyltransferase, beta-glucosidase, and transcription factors (WRKY, bZIP, MYB). Moreover, various genes, such as Chitinase, Cytochrome P450, Glutathione S-transferase, and R genes such as NBS-LRR were highly up-regulated in the resistant genotype, indicating their involvement in the plant defence mechanism. RNA-Seq analysis data were validated by RT-qPCR using 15 primer sets derived from DEGs producing high correlation value (R2 = 0.82). A total of 4511 EST-SSRs were identified from the unigenes, which can be useful in evaluating genetic diversity among genotypes, QTL mapping, and plant variety improvement through marker-assisted breeding. These findings will help to understand the molecular defence mechanisms of the peanut plant in response to P. arachidis infection.
Electronic supplementary material
The online version of this article (10.1007/s13205-020-02270-w) contains supplementary material, which is available to authorized users.
Keywords: RNA-seq, Plant-fungus interaction, Transcriptome, RT-qPCR, Rust disease
Introduction
Arachis hypogaea L., commonly known as peanut, is a self-pollinated, allotetraploid (2n = 4x = 40) with a genome size of 2891 Mbp (Chen et al. 2016). It is believed that A. hypogaea were developed through a natural cross among two species; A. ipaensis and A. duranensis followed by chromosome doubling (Mondal and Badigannavar 2018). Peanut is an important crop as its seeds are a key source of edible oil (Wan et al. 2018). Additionally, peanut also contains vital nutrients, such as vitamins, proteins, fatty acids, salts, and minerals, which contribute to the routine nutritional requirements in the human body (Chen et al. 2019). Semi-arid tropical and semi-tropical regions are suitable for the cultivation of peanuts. Approximately, 27 million ha of land in the world is under peanut cultivation, yielding up to 43 million tons of pods/annum (Liu et al. 2017). India is the second-highest producer of peanuts worldwide, contributing 6.8 million tons by cultivation from 5.8 million ha of its agricultural land during 2017 (faostat.fao.org).
The production of this crop is affected by three main types of foliar fungal disease, known as rust, early, and late leaf spot, which are caused by Puccinia arachidis, Cercospora arachidicola, and Phaeoisariopsis personata, respectively. The most commonly observed diseases leading to biotic stress in peanut plants are rust and early leaf spot, resulting in more than 50% yield losses (Subrahmanyam et al. 1984). Peanut rust infection causes not only a loss of crop productivity but also affects the quality of oil extracted from the seed, its haulm, and the yield of fodder. Various chemical agents and fungicides are available to regulate this disease, but the use of a fungicide is not a viable option economically and it is unsafe for human health and the environment. The development and characterization of naturally-resistant host-plant species is the most effective approach for implementing disease management without the use of hazardous chemical agents (Sujay et al. 2012). Traditionally, resistance to pathogen was established via the conventional breeding process in peanut, although conventional methods are laborious and consume more time and effort. In recent years, advancements in biotechnology and molecular biology have made it easier to identify the molecular markers responsible for host-plant resistance and facilitate the data availability of crop genomes (Varshney et al. 2014).
Various molecular methods, such as RFLP, AFLP, Microarray, and RNA sequencing, were utilized to analyse the gene expression levels in plants. RNA-Seq can be utilized for gene discovery, identification of SNPs, other functional markers, and comparative studies of transcriptomes under various physiological conditions that lead to altered metabolic processes. It has better practical reproducibility and greater accuracy in the estimation of entire gene expression levels in a genome (Liu et al. 2015). Molecular interactions between peanut plant and fungal pathogen P. arachidis have received very little attention, and no studies have been conducted in this regard so far, to the best of our knowledge. RNA-Seq analysis in A. hypogaea has been conducted during seed development (Zhang et al. 2012), to identify resistance to R. solanacearum infection (Chen et al. 2014), but no such study has been reported for P. arachidis pathogenesis. A similar study reported an interaction between Oryza sativa and Magnaporthe oryzae, a filamentous fungus as a causative agent of rice blast disease (Kawahara et al. 2012). A genome analysis study of Puccinia striiformis, a pathogen that causes wheat yellow rust, revealed the presence of two important proteins (polymorphic and haustorial expressed secreted proteins) responsible for pathogenicity (Cantu et al. 2013). In soybean, genome-wide annotation revealed that the WRKY family was an effective agent during soybean rust infection, caused by Phakopsora pachyrhizi (Bencke-Malato et al. 2014), as well as identified the genes involved in phenylpropanoid pathway during the defence mechanism (Hossain et al. 2018). The RNA-Seq database has important information about a huge number of active crops. At present, discovering such genic putative markers is fast and less expensive, and can be further applied in the resistant trait development program.
Materials and methods
Plant materials and experimental design
Peanut leaves samples of both genotypes were grown at the Department of Biotechnology and Biochemistry, Junagadh Agricultural University, Junagadh, Gujarat, India (21º30′23.2″N, 70º26′57.2″E). The selection of genotypes was based on the level of resistance against rust disease (Mondal et al. 2008). Inoculation was done on 40-day old plants of resistant as well as susceptible genotypes of A. hypogaea by spraying spore suspension (50,000 spores per ml water) mixed with Tween 80 (Sigma-Aldrich, MO, USA). The plots were irrigated and optimum growth conditions for A. hypogaea were maintained viz. high humidity and temperature at ~ 25 ℃, by covering the plots with a thin plastic sheet (Subrahmanyam et al. 1995). Infection was successful when spraying was done in the evening time. The control treatments received sterile water without any culture inoculation and were maintained under the same environmental conditions.
Leaves of both the genotypes were collected in triplicates at two different stages, i.e. control stage (before inoculation) and infected stage (24 h post-inoculation). All biological replicates were pooled, and samples were preserved in liquid nitrogen. These frozen samples were stored at − 80 ℃ for carrying out further experiments. Simultaneously, a microscopic study was carried out to study pathogen morphology and to investigate the release of uredospore which is necessary for confirmation of pathogenic activity (Fig. 1). Plants were kept under observation for 15 days post-inoculation to study disease development. During sporulation, orange colour pustules of rust could be observed on the abaxial leaf surface of peanut. Two types of samples were generated from both the genotypes and were designated as resistant infected (RI) and resistant control (RC) for resistance genotype, while susceptible infected (SI) and susceptible control (SC) for susceptible genotype, indicating infection stage and control stage respectively. As stated earlier, in the present study two variables were taken, one was based on variety (RI/SI) and another was based on biotic stress condition (RI/RC and SI/SC). The summary workflow of the experiment is shown in Fig. 2.
Fig. 1.

Disease symptoms and fungal spore morphological study by microscopy a Uredospore of Puccinia arachidis, b JL-24 (susceptible) (control) v/s (infected), c sporulation on peanut leaves, d electron microscopy of P. arachidis spore
Fig. 2.

A detailed workflow performed for the identification of DEGs and designing EST-SSRs in resistant and susceptible genotypes of Arachis hypogaea
Isolation of purified mRNA and cDNA library preparation
Total RNA was extracted from the leaf samples using the RNeasy Plant Mini Kit (Qiagen, CA, USA) as per the instructions provided by the manufacturer. Contamination by genomic DNA was taken care of by treating the extracted total RNA using DNase I (Fermentas, MA, USA) at 37 ℃ for 1 h. Contamination and degradation of RNA were monitored by electrophoresis on 1.2% denaturing formaldehyde agarose gel. The required concentration of RNA for sequencing was quantified using a Qubit RNA Assay Kit (Invitrogen, CA, USA). Further, the integrity of isolated RNA was assessed using RNA Nano 6000 Assay Kit, Bioanalyzer 2100 (Agilent Technologies, CA, USA). Isolation of mRNA from total RNA was performed by Dynabeads mRNA DIRECT Purification Kit (Invitrogen, CA, USA), and was further assessed by RNA 6000 Pico LabChip kit (Bioanalyzer 2100) (Agilent Technologies, CA, USA). To generate RNA-Seq data, cDNA libraries of samples were prepared using Ion Total RNA-Seq Kit v2 (Thermo Fisher Scientific, MA, USA). Purification of double-stranded cDNA and size selection was done using AMPure XP beads (Invitrogen, CA, USA). Enrichment of desired size fragments was performed by amplification of the library with barcoded primers. The cDNA libraries of 100 pM were assigned to create several copies of fragments by performing emulsion PCR process in the Ion torrent OT2 machine. Finally, the Ion Torrent S5 sequencer system (Thermo Fisher Scientific, MA, USA) with a 540 chips format was used to sequence the fragments created.
Alignments of generated read and Gene Ontology analysis of DEGs
Quality of RNA-Seq library was assessed by the Ion Torrent S5 pipeline and FastQC software (https://www.bioinformatics.babraham.ac.uk/projects/fastqc/) (Brown et al. 2017). To control sequence quality, low-quality data containing < 50 bp reads, homopolymers, adaptor dimers, and ambiguous bases (‘N’) were filtered using the PRINSEQ tool. Further, a downstream analysis was also performed to remove sequencing reads having quality scores lower than 25 (Schmieder and Edwards 2011). The genome-A (Arachis duranensis) and genome-B (Arachis ipaensis) from the two wild peanut diploid ancestors were used as the reference genome for alignment. GFF files for both genomes were retrieved from the PeanutBase website (https://peanutbase.org) and used for alignment (Peng et al. 2017). The filtered reads were mapped onto the reference genome of peanut using STAR 2.5.1a software (https://github.com/alexdobin/STAR/releases/) (Dobin and Gingeras 2015). DEGs among infected and control (non-infected) leaf samples of both the genotypes of peanut were identified by the Cuffdiff tool in the Cufflinks package (https://sihua.us/Cufflinks.htm) (Trapnell et al. 2010; Ghosh and Chan 2016). Moreover, the abundance of normalized transcripts was also estimated using the same tool and represented as fragments per kilobase per million mapped reads (fpkm) (Trapnell et al. 2009). For downstream statistical analysis of DEGs, a false discovery rate (FDR) of < 0.05 and p-value < 0.01 with at least a Log2 fold-change ≥ 1 were considered to produce high-quality data (Li et al. 2015). For the depiction and comparison of several expressed sequences shared by different samples in the form of Venn diagrams, VENNY software was used (Oliveros 2007). Cleaned reads per library are displayed in Table 1. Raw sequences for all rust infected leaf samples were deposited at https://www.ncbi.nlm.nih.gov/bioproject/PRJNA489546/ and those of control samples were deposited at https://www.ncbi.nlm.nih.gov/bioproject/PRJNA490412/.
Table 1.
Summary of reference based assembled transcripts from RNA-Seq of the susceptible and resistant genotypes of Arachis hypogea at control and infected stages
| SI | RI | SC | RC | |
|---|---|---|---|---|
| Number of transcripts | 14,916,661 | 17,502,719 | 17,336,240 | 36,625,310 |
| RNA-Seq length (bp) | 2,388,143,923 | 2,761,143,610 | 2,928,728,266 | 5,127,297,546 |
| Average transcript length (bp) | 160 | 158 | 169 | 140 |
| Total read counts after quality filtration | 12,669,594 (84.94%) | 14,779,667 (84.44%) | 15,038,010 (86.74%) | 31,262,640 (85.36%) |
| Number of uniquely mapped reads | 4,999,181 (39.46%) | 10,218,232 (69.14%) | 10,728,674 (71.34%) | 19,233,708 (61.52%) |
| Number of reads mapped to multiple loci | 2,099,015 (16.57%) | 3,747,309 (25.35%) | 3,757,635 (24.99%) | 9,796,877 (31.34%) |
| Average contig length after mapping (bp) | 137 | 147 | 152 | 125 |
Enriched GO analysis of DEGs was carried out by REVIGO software (Supek et al. 2011). Comparative GO analysis of RI/RC and SI/SC pairs was performed by WEGO software (Ye et al. 2006). In gene ontology, transcripts were classified into three different categories viz. cellular component, biological process, and molecular functions along with their fraction ratio based on the number of genes (Supek et al. 2011). For identification of important regulatory pathways and networks, KAAS (KEGG Automatic Annotation Server: https://www.genome.jp/kegg/kaas/) was used against the Arabidopsis thaliana and Glycine max gene datasets using the bi-directional best hit (BBH) method (Liu et al. 2013b).
Validation of RNA-Seq data by RT-qPCR
RT-qPCR technique was used to confirm the differently expressed genes identified by RNA-Seq analysis. Fifteen primer sets were designed for the 15 genes that were randomly selected from the pool of DEGs for RT-qPCR (Koringa et al. 2013; Rajkumar et al. 2015). RT-qPCR experiment was carried out in the ABI 7500 Fast Real-Time PCR Detection System (Thermo Fisher Scientific, MA, USA). Online primer designing tool, Primer3 was used for designing specific primers (Untergasser et al. 2007). A QuantiTech Reverse Transcription kit (Qiagen, CA, USA) was used to synthesize cDNA. The same RNA samples were used for both cDNA synthesis as well as RNA-Seq analysis. For RT-qPCR, designed primers (Table 2) and QuantiFast SYBR Green PCR Kit (Qiagen, CA, USA) were used. The program details of RT-qPCR set to obtain desired amplicons are as follows: initial denaturation with 95 ℃ for 5 min followed by 35 cycles of melting and annealing-extension at 95 ℃ for 10 s and 60 ℃ for 30 s, respectively. The reaction mixture was prepared by mixing 1 μl of template cDNA, 1 μl of specially designed forward and reverse primer (concentration of each primer: 10 pM), 10 μL SYBR Green Master Mix (2 ×) and the final reaction volume was made up to 20 μl by addition of nuclease-free water (Qiagen, CA, USA). The relative expression levels of target genes were calculated using the Livak’s − ΔΔ CT method (Livak and Schmittgen 2001). The RT-qPCR experiment was performed in three replicates for an individual sample. The actin gene was used as a reference gene for normalization (Jiang et al. 2011).
Table 2.
Random and gene-specific primers used for validation of RNA-Seq data using RT-qPCR
| Sr. No | Gene ID | Gene name | Primer sequence (forward) | Primer sequence (reverse) |
|---|---|---|---|---|
| 1 | Araip.N03N5 | Rubisco methyltransferase | TGTTTACACCAGTTGACGGATGA | CTGCAAACACGCATGAAGCA |
| 2 | Araip.R9908 | Trypsin-like serine protease | TGGGCTAAACCCGACAACAA | TTCTGCAAAAGACGGCTCAC |
| 3 | Araip.77S0D | Uncharacterised protein | AAGCCTCCTGCTGACAAACC | CGCAACGAAGAAAGCTCTGG |
| 4 | Araip.C41LK | Terpene synthase | TGTGGAGTACATCCATCCAACT | CACTATGACTGGAGTTTGGCTCT |
| 5 | Aradu.I4JWW | MYB transcription factor | CCCACACCAGGTGCCTTTAT | ATCTGGAACCCAACGGACAC |
| 6 | Aradu.Z1Y2A | Serine/threonine kinase | GCCTCTTCCAAACCAGCTCT | TCGCATGGTCACATCGTCAT |
| 7 | Aradu.P9J09 | Cellulose synthase | AAGGCACACCGAAGTACCAA | GGTTAAGGACAGGGTTAAGGC |
| 8 | Aradu.11T0C | Transcription initiation factor | TGTGTCCCTCATTCGTGCTT | TGGTTGCGGTTGATCCTTGT |
| 9 | Aradu.VE705 | WRKY family TF | CTCGCCAGTATATGGCCTCC | TTAGGGCAACTCACCGGAAC |
| 10 | Aradu.QH0IG | Cytochrome P450 protein | CTCGCCATGCTCTCTAGCTT | GTGGGTCAGTATGTTCCCCA |
| 11 | Aradu.D14Q2 | Thaumatin protein | ATGTTTACACCAGTTGACGGA | TGCAAACACGCATGAAGCATT |
| 12 | Araip.DAL9A | Protein kinase | GGCTGAAAGACACTTGATGGC | TAACGGTACAGGAGGCTGAC |
| 13 | Aradu.9AI6Q | Chitinase family protein | GGGAGTTAGTGGGTTGTAGCG | GTGCAAGGAGATGAAAGGCG |
| 14 | Aradu.V83DR | Transmembrane protein | TGTCTCTGGCAGATCAACAC | AGCAATGCTTGCACGATGTC |
| 15 | Aradu.R4V51 | TIR-NBS-LRR protein | TGAGTCTTTGTATCCCACTTCATCA | ACAATCGTATATAGTACGGAGGGC |
Expressed Sequence Tag–Simple Sequence Repeats (EST-SSR) mining, primer designing, and validation by PCR amplification
To detect EST-SSR markers, transcriptome data were first assembled using Trinity assembler (Grabherr et al. 2011), and these assembled contigs were utilised to generate SSR using the MIcroSAtellite (MISA) tool (Beier et al. 2017). Primers of 18–24 bp size of EST-SSRs in microsatellite sequences were designed using Primer3 (https://primer3.sourceforge.net/) (Untergasser et al. 2007) based on the following parameters: G/C content near 50%, annealing temperature between 57 ℃ and 63 ℃, and a minimum product length of 100–300 bp. From the total, 15 pairs of SSR primers were selected randomly and synthesized (Sigma-Aldrich, MO, USA) for validation by PCR reactions (Supplementary Table 9). To validate the SSR markers, genomic DNA was extracted and purified, and PCR was carried out to detect amplification for both genotypes of peanut using designed primers. PCR was conducted using 2 × PCR master mixes (Invitrogen, CA, USA), with the following profile: 1 cycle of 5 min at 94 ℃, 30 cycles of 1 min at 94 ℃, 45 s at 60 ℃ 1 min at 72 ℃, and a final cycle of 5 min at 72 ℃. The PCR products were analysed by electrophoresis on 2.5% agarose gel. The band sizes were determined against the appropriate DNA ladder (Invitrogen, CA, USA).
Results
Sequence alignment and RNA-Seq analysis
RNA-Seq was performed using the Ion Torrent S5 system (Jain et al. 2016; Hamid et al. 2018). This study was initiated with the objective of transcriptome analysis of resistant (GPBD-4) and susceptible (JL-24) genotypes of peanut involved in plant-pathogen interactions. Sequencing of cDNA libraries from all the samples viz. RC, RI, SC, and SI produced a total of 86,380,930 reads. The Ion S5 sequencing technology was used to obtain a read length of 150–250 bp in the generated libraries. An average read length of 156 bp was obtained during this process. Various tools were used to remove and trim the undesired products and to maintain the quality of the data. Details of the RNA-Seq run are summarised in Table 1. Only aligned and mapped reads were considered for subsequent analysis, which includes uniquely mapped reads for SI, RI, SC, and RC with an average matching rate of 60.36%.
DEGs analysis
Significant fold-change in the up- and down-regulated genes in infected tissues compared to the corresponding controls was found for both genotypes of peanut via the Cufflinks tool. With FDR < 0.05, p-value < 0.01, and Log2 fold-change ≥ 1, deferentially expressed transcripts were obtained in RI/RC as well as SI/SC. In total, 212 and 99 transcripts were up and down-regulated, respectively, when RI was compared with RC, i.e., the difference was noted within 24 h upon infection in the resistant variety (Supplementary Table 1). However, considerably fewer transcripts were up-regulated (18) compared to those down-regulated (257) in the case of SI with respect to SC (Supplementary Table 2). This indicates that resistance-related genes were induced upon infection in the resistant variety leading to the up-regulation of ~ 200 genes compared to that in the susceptible variety. The FDR value cut-off was set < 0.05, to achieve higher accuracy and significant genetic differences in RI and SI compared to their respective controls.
The correlation of distribution in fold-change with the gene number among the four sample libraries is presented in Fig. 3. Genes with more than an eight-fold difference between RI/RC mainly encoded chitinase, Glutathione S-Transferase (GST), polygalacturonase, terpene synthase, cytochrome P450 superfamily protein, pectinesterase, cysteine synthase, MLO-like protein for defence response, Serine/Threonine kinase family protein, F-box protein, oxidoreductase, GH3 auxin-responsive promoter, and WRKY family transcription factor (Supplementary Table 1). These highly expressed DEGs were expected to play a crucial role in the defence mechanisms during fungal pathogen infection in A. hypogaea.
Fig. 3.
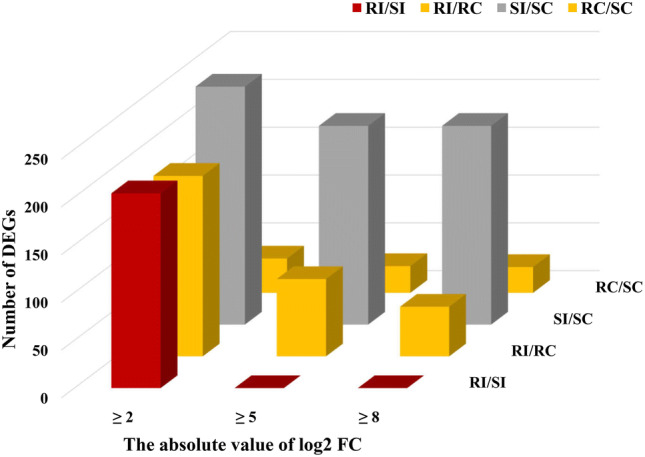
The Fold change wise distribution of DEGs under the comparison of four different samples
The distribution of unique and regular DEGs for the four sample types is shown in Fig. 4. In total 35 (4.2%), 254 (30.7%), 296 (35.8%), and 215 (26%) genes were discovered that were expressed diversely in RC v/s SC, SI v/s SC, RI v/s RC, and RI v/s SI, respectively. Eight (1%) genes were found to be common between SI v/s SC and RI v/s RC, 12 (1.5%) between SI v/s SC and RI v/s SI, two (0.2%) between RI v/s RC and RC v/s SC, and four (0.5%) between RI v/s RC and RI v/s SI. Eight DEGs associated with the GO terms ‘U-box superfamily protein’, ‘Pentatricopeptide repeat (PPR) protein’, ‘Phosphorylase protein’, and ‘Chitinase family protein’ were common between RI v/s RC and SI v/s SC. A detailed discussion of the comparative enriched GO analysis between resistant and susceptible genotype is presented in the next section.
Fig. 4.
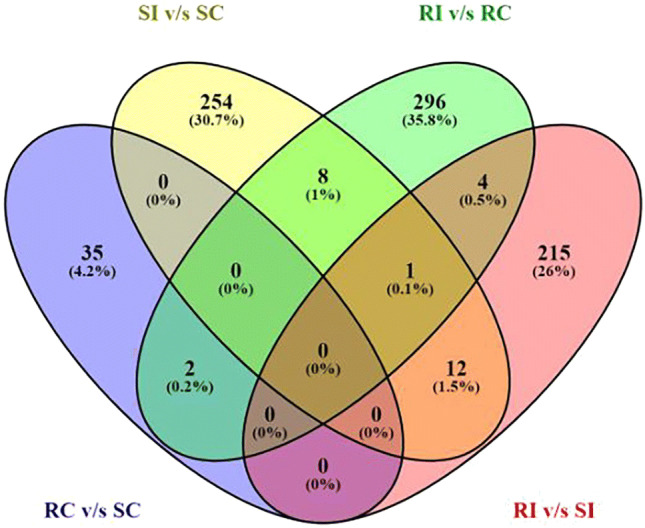
Venn diagram showing the distribution of unique and common DEGs among control and infected stages of susceptible and resistant variety
These DEGs represented a total of 747 non-redundant genes that were distributed across the ten chromosomes of peanut (Fig. 5). A mapping approach was adapted to develop closely linked markers for the rust resistance gene in peanut, where major Rust_QTL was found to be on the A03 chromosome (Mondal and Badigannavar 2018). It is interesting to note that in the present study, chromosome A03 carried possible defence-related protein-coding genes (Aradu.EZY28, Aradu.X29NW, Aradu.K5XM1, Aradu.2X14D, and Aradu.639I9) which were differentially expressed in RI/RC.
Fig. 5.

The total number of DEGs present on each chromosome of the peanut plant. A total number of DEGs on genome-A (A. duranensis) and genome-B (A. ipaensis). The X-axis represents different chromosomes. Y-axis represents number of genes on each chromosome
During pathogen infection of plants, the immune system of the plant relies on its ability to recognize foreign molecules followed by signal transduction, and it responds by involving many genes in different defensive pathways. DEGs related to plant defence mechanism were classified into six different groups; PR genes, defence-related (R) genes, signalling molecule-related genes, transcription factors, genes involved in secondary metabolic pathways, and photosynthesis-related genes (Table 3).
Table 3.
Selected DEGs of resistant variety of peanut plant related to plant defense against pathogen
| Gene name | Gene length | log2FC (RI/RC) | Description |
|---|---|---|---|
| Aradu.P0G7F, Aradu.23UZB | 2111, 3087 | 8.38, 6.20 | Polygalacturonase (glycoside hydrolase) |
| Aradu.FUK65, Aradu.KH972 | 3942, 11941 | 1.54, 8.25 | Beta glucosidase (glycoside hydrolase) |
| Aradu.9AI6Q, Aradu.118NW | 2021, 2499 | 8.58, 6.29 | Chitinase protein |
| Aradu.BZH82, Aradu.FPU8X | 13832, 3695 | 8.57, − 3.35 | Cellulose synthase |
| Aradu.D14Q2 | 9705 | 8.96 | Thaumatin protein |
| Aradu.N8G7F | 3910 | 8.25 | MLO-like protein |
| Aradu.K5XM1, Aradu.6HJ87, Aradu.QH0IG | 2656, 3775, 2648 | 9.17, 6.15, 3.40 | Cytochrome P450 protein |
| Aradu.E6KMV, Aradu.51L6N | 1523, 1104 | 8.35, − 3.36 | Glutathione S-transferase |
| Aradu.PP2DC, Aradu.SJ15T | 3578, 2980 | 8.79, 6.10 | F-box protein |
| Aradu.R4V51 | 3197 | 3.34 | TIR-NBS-LRR |
| Aradu.LYT7G, Aradu.6M72C, Araip.DAL9A | 3797, 7841, 3361 | 8.55, 6.74, − 3.72 | Protein kinase protein |
| Aradu.Z1Y2A, Aradu.X29NW | 5824, 5075 | 8.43, 1.64 | Serine/threonine kinase |
| Aradu.F623P | 7038 | − 3.37 | Leucine-rich repeat protein |
| Aradu.RG31X | 4603 | 9.24 | Ethylene-responsive transcription factor |
| Aradu.I4JWW, Araip.9P5VU, Aradu.85BTF | 5857, 2225, 1754 | 8.69, 3.68, 7.85 | MYB transcription factor |
| Aradu.VE705 | 1634 | 8.24 | WRKY transcription factor |
| Aradu.YNN2E | 3139 | 3.43 | GATA transcription factor |
| Aradu.U2NBF, Aradu.S4DGV | 9499, 2083 | 9.10, 7.09 | Heat shock protein |
| Aradu.PU456, Aradu.8JG2E | 7467, 3560 | 8.08, − 3.28 | Terpene synthase |
| Aradu.BM2KZ, Araip.SX3RK | 8741, 4227 | 1.28, − 3.70 | Caffeate O-methyltransferase (COMT) |
| Aradu.GZ2X7, Aradu.P7UBS, Araip.SP6BX | 4129, 3393, 2213 | 1.66, − 3.43, − 3.70 | Pentatricopeptide repeat (PPR) protein |
| Aradu.X6AKD | 1064 | 8.17 | Chlorophyll a/b binding protein |
| Aradu.B1CT2 | 978 | 1.43 | Thiamine thiazole synthase |
p-value < 0.01, Negative (−) value of log2FC indicates down regulation of DEGs
Expression analysis of PR genes related to cell wall modification during biotic stress
A well-known phenomenon in legumes is the differential expression of PR genes under different biotic and abiotic stresses (salinity, drought, wounding and cold stress) (Liu and Ekramoddoullah 2006; van Loon et al. 2006). The plant PR genes are involved in attacking pathogens by either the degradation of fungal cell wall components or modulating the osmotic balance upon fungal infection. The numbers shown in the bracket following gene name indicates its fold change. It was observed that the expression of polygalacturonase (8.38-fold) and chitinase proteins (8.58-fold) were up-regulated in the RI genotype. The hydrolysis of glycoside bonds in fungal cell wall polymers is catalysed by glycoside hydrolase (GH). The glycoside hydrolases gene family contains PR2 genes producing ß-1, 3-glucanases (8.25-fold) that hydrolyse ß-1,3-d-glucosidic links in ß-1,3-glucans of the fungal cell wall, and it was observed that these genes were up-regulated in the RI sample compared to in the RC sample. Cellulose synthase (8.57-fold) transcript was found to be highly expressed in the resistant genotype. This enzyme is involved in the synthesis of cellulose, a major component of the plant cell wall, which acts as a physical barrier to prevent pathogen invasion. Moreover, DEGs encoding Thaumatin (PR-5) protein (8.96-fold) were significantly up-regulated in the RI genotype compared to SI.
Differentially expressed defence mechanism-related R genes and defence-related hormone biosynthesis genes
In the resistant genotype, the expression of the defence-related genes, such as cytochrome P450 (9.17-fold), was up-regulated, which catalyses the oxidation of many substrates via molecular oxygen. DEG-encoding peroxidase (POD) (− 13.47-fold) was down-regulated with a distinct expression pattern in the susceptible genotype. Other defence-related genes, such as GST family protein and MLO-like protein, were up-regulated in the RI sample compared to the SI sample (Supplementary Table 3). Different R genes, such as nucleotide binding-leucine-rich repeat (NB-LRR), F-box, and MLO-like protein were found during DEG analysis (Table 3). In peanut rust interaction, the transcripts with the highest and most exclusive up-regulation were F-box protein (8.79-fold) followed by MLO-like proteins (8.25-fold) which play an important role in defence response in the infected sample of the resistant genotype. NB-LRR protein (3.34-fold) was up-regulated in RI compared to RC. Transcripts responsible for defence-related plant hormones were differentially up-regulated in resistant genotype compared to the susceptible genotypes with different fold-changes. Compared to RC, the transcript levels of Jasmonic acid (JA) biosynthesis genes, such as 12-oxophytodienoicacid reductase (1.43-fold) were generally up-regulated in RI, while lipoxygenase was down-regulated in SI when compared to SC.
Regulation of transcription factors (TF) and plant signalling molecule genes in response to infection
Transcription factors, such as ERF, WRKY, MYB, and BHLH play an important role in plant immunity by regulating the expression of defence-related genes. In the present study, the TFs such as ethylene-responsive TF (ERF) (9.24-fold), MYB TF (8.69-fold) and WRKY TF (8.24-fold) were overexpressed in RI compared to RC, whereas bZIP TF and basic helix-loop-helix (bHLH) DNA-binding protein and WRKY family TF were down-regulated in SI compared to SC. Transcription factors are involved in the activation of protein kinase and mitogen-activated protein kinase (MAPK) cascade for the defence mechanism (Qiu et al. 2008). Genes coding for signal transduction-related proteins, such as protein kinases and Serine/Threonine kinase, are up-regulated in the resistant infected genotype compared to the susceptible infected genotype (Supplementary Tables 3, 4).
Differentially expressed secondary metabolite genes and regulation of photosynthesis-related genes
The secondary metabolite-related transcripts, such as caffeoyl-CoA 3-O-methyltransferase (COMT) (1.28-fold) and terpene synthase (8.08-fold) were up-regulated in RI compared to RC. In the case of susceptible genotype, caffeoyl-CoA 3-O-methyltransferase (COMT) (− 12.39-fold) and terpene synthase (− 12.79-fold) were down-regulated in SI than in SC, indicating that the susceptible genotype is not able to produce sufficient secondary metabolites, such as terpenes and flavonoids, to defend against pathogens. In the present study, DEGs of photosynthesis-related genes, including various chlorophyll a/b binding protein domains (8.17-fold) and thiamine thiazole synthase (1.43-fold) were up-regulated in RI compared to the RC genotype. However, few photosynthesis-related genes were affected negatively in the resistant variety as well, because pentatricopeptide repeat (PPR) protein (− 3.43-fold) transcript expressions were down-regulated in the RI genotype compared to RC genotype. Nevertheless, in the susceptible genotype (both SI/SC), the similar gene (PPR protein) was found to be down-regulated at a greater level (− 13.61-fold) in infected resistant compared to control resistant genotype.
Enriched GO analysis by WEGO software for the comparison of resistant and susceptible genotypes
The GO classification by WEGO software (Ye et al. 2006) was used to identify the difference in functional categories between infected resistant (RI) and infected susceptible (SC) compared to their controls (RC and SC), respectively. DEGs set. The results of the comparative analysis of the GO terms between the resistant and susceptible genes are shown in Supplementary Fig. 1. In total, 603 genes of RI/RC and 514 genes of SI/SC were assigned with one or more GO terms. GO annotation in three major groups were found to produce a total of 1117 unigenes (Supplementary Table 5). In the comparative GO analysis of RI/RC and SI/SC, different GO terms were identified within the cellular component. Membrane (GO: 0016020), cell (GO: 0005623), and cell part (GO: 0044464) are the top three groups of cellular components. In the cellular component, GO terms, such as membrane part and protein-containing complex, were higher in number in RI/RC compared to SI/SC. In the case of molecular function, catalytic and transporter activity (GO: 0003824 and GO: 0005215, respectively), and binding activity (GO: 0005488) were found to be the three major groups, while transcription regulator activity and signal transducer activity were highly expressed in RI/RC than in SI/SC. During the comparative GO analysis of resistant and susceptible varieties, the metabolic and cellular processes (GO: 0008152 and GO: 0009987, respectively) and localization (GO: 0051179) were the top three groups in the biological process category as well as were highly expressed in RI/RC than in SI/SC.
Gene Ontology analysis of DEGs using the REVIGO tool
REVIGO software was used to accomplish GO enrichment analysis for differently expressed genes of all four samples (Supek et al. 2011). A total of 311 GO terms were assigned and the distribution of percentages of three major groups were as follows: 46.3% for molecular functions (MF) (144 GO terms), 42.77% for biological processes (BP) (133 GO terms), and 10.93% for cellular components (CC) (34 GO terms) (Supplementary Fig. 2). Generated GO terms of these three major groups are described in Supplementary Table 6. This mainly includes BP-like defence response to fungus (GO: 0050832), chitin catabolic process (GO: 0006032), SOS response (GO: 0009432), and response to wounding (GO: 0009611). This indicates the plant’s direct response towards fungal infection concerning protecting itself from the damage caused by the pathogen. Among the biological process category, based on the abundance of transcripts, protein phosphorylation was the main functional group followed by intracellular signal transduction and lipid metabolic processes, indicating their role in important signalling pathways, such as MAPK signalling pathways, which result in the production of catabolic enzymes to attack the pathogen. Within the cellular component category, based on gene expression, GO terms related to the membrane, integral component of the plasma membrane, N-acetyl transferase activity, and phosphatase activity were highly expressed in the given order, respectively. Whereas, MF related to transcription factor activity (GO: 0003712), GST activity (GO: 0004364), peroxidase activity (GO: 0004601), metal ion transmembrane transporter activity (GO: 0046873), and terpene synthase activity (GO: 0010333) were important functional groups involved in secondary metabolite production and the genetic regulation of important defence pathways.
Gene function analysis was performed in a systematic manner using the KEGG pathway database (Kanehisa and Goto 2000). KEGG analysis of the present study revealed a total of 558 genes that were allocated to 60 pathways (Supplementary Table 7). The main groups of transcripts belonged to metabolic pathways (64, 11.46%), followed by the biosynthesis of secondary metabolites (41, 7.34%) and carbon metabolism (27, 4.83%). DEGs were also analysed by the KEGG pathway to identify defence-linked regulatory mechanisms. Defence-related pathways, such as the MAPK signalling pathway (23, 4.12%), phenylalanine metabolism (17, 3.04%), plant hormone signal transduction (3, 0.53%), and plant-pathogen interactions (25, 4.48%) were the most enriched pathways of RI/RC that were found to be up-regulated during DEGs analysis, whereas such enriched pathways were down-regulated in SI/SC.
RT-qPCR of DEGs to confirm RNA-Seq analysis
A total of 15 transcripts were arbitrarily selected to design primers for RT-qPCR, which were used to confirm the reliability of the sequencing result. The RT-qPCR analysis showed that out of a total of 15ss transcripts used, 13 transcripts completely matched with the data obtained through RNA-Seq. For example, the expression of the Serine/Threonine kinase family protein, which is involved in the plant-pathogen-related response, was up-regulated in RI plants. The difference in terms of fold-change obtained from the data of RNA-Seq was 8.42-fold, while with RT-qPCR, it was 4.34-fold as observed in RI vs RC. Out of 15 random transcripts, six were related to pathogen defence response pathways and represented similar results in both analyses. However, similar expression tendency was not found in two randomly selected transcripts, i.e. GATA transcription factor and terpene synthase. The actin gene transcript was used as an endogenous control for normalizing the relative gene expression of transcripts (Supplementary Table 8). Comparative analysis of data obtained through both techniques had a positive correlation of 0.82. The values of log2 fold-change were also found to be consistent in expression. Supplementary Fig. 3 and Supplementary Table 8 depict correlation among RNA-Seq and RT-qPCR data.
Frequency and distribution of EST-SSRs in Arachis hypogaea
Specific filters were used to remove low-quality reads from initial generated data, which resulted in more than 73.34 million raw reads. The obtained reads were assembled into 257,823 contigs, which fell in a range of 419 to 2951 bp in length. Finally, 4511 EST SSRs were classified from 3983 sequences containing SSR (Table 4). The successful design of a total of 2892 primer sets was achieved using Primer3 software. To validate the designed primers for SSR, 15 primer sets were selected randomly for PCR amplification (Supplementary Table 9). All the randomly selected markers of both genotypes were successfully amplified, and amplicons were confirmed by 2.5% agarose gel electrophoresis (Supplementary Fig. 4). However, 2.5% gel was found to be inefficient for discrimination of the allelic variant of groundnut. Therefore, further confirmation is essential to recognise the allelic variants responsible for defence responsive mechanisms in groundnut. Even distribution was not observed in the proportion of different SSR unit sizes. In this study, tri-nucleotide repeats (67.32%) were the most abundant motif followed by dinucleotide (20.88%), single nucleotide (8.37%), tetranucleotide (2.15%), hexanucleotide (0.70%), and pentanucleotide (0.55%), respectively (Fig. 6). The average genome SSR was 5.4 kb in size. (AAG/CTT)n had the highest frequency of 19.06% in a genome compared to all other types of repeat motifs. Additionally, (AG/CT)n and (ATC/ATG)n with 14.14%, and 12.74%, respectively, were found in greater amounts. The RNA-Seq data of A. hypogaea were used to design EST-SSR primers. Details of specific primers are provided in Supplementary Table 9. For the application of EST-SSR primers, allelic variation needs to be established between the two varieties (i.e. resistant and susceptible) as a prerequisite for EST-SSR primers to be used for varietal selection.
Table 4.
Summary and statistics of identified EST-SSRs in Arachis hypogaea RNA-Seq using Trinity and MISA
| Parameters | Value |
|---|---|
| Analysed RNA-Seq sequences for SSR | 72,142 |
| Analysed sequences size (bp) | 30,256,167 |
| Identified total SSRs from sequences | 4511 |
| Total sequences containing SSR | 3983 |
| Total sequences with more than 1 SSR | 452 |
| Total SSR found in a compound formation | 292 |
| Primers designed from SSR | 2892 |
Fig. 6.

The frequency distribution of the EST-SSRs identified in peanut transcriptome data. a Distribution of the total number of EST-SSRs in different motif types. Di-, tri-, tetra-, penta-, hexa- and compound nucleotide repeats were analyzed. b Proportion distribution of selected motifs of trinucleotide repeats
Exclusively expressed genes in resistant and susceptible varieties of Arachis hypogaea
Overall, it was observed that four different defence-related genes; ERF (9.24-fold), MLO-like protein (8.25-fold), F-box protein (8.79-fold), and Thaumatin (8.96-fold) were exclusively expressed in the resistant variety during fungal infection, which helped it to sustain under biotic stress. Some important defence-related genes, such as lipoxygenase (− 10.78-fold) and pectin methyl-esterase inhibitor protein (− 12.01-fold), were found to be exclusively down-regulated in a susceptible variety during infection. Down-regulation of such defence-related genes in susceptible genotype could be the reason for disease development.
Discussion
Plants have well-established defence mechanisms against pathogen infection, such as physical barriers of the cell wall to prevent pathogen invasion, secondary metabolites that are toxic to the pathogens, and specific molecular pathways for protection (Zhang et al. 2017). Major defence mechanisms observed in peanut plants as a result of fungal infection are shown in Fig. 7. These defence mechanisms include, recognition of pathogen effector molecule by plant and lead to activation of TFs, PR proteins, oxidative enzymes and defence-related genes such as R-gene, GST, chitinase and cytochrome P450. In the present study, RNA-Seq technology was used to determine changes in the expression of genes among the two selected genotypes of peanut infected with P. arachidis.
Fig. 7.

Major defence mechanisms observed in peanut plants as a result of fungal infection. In peanut plants, three different defence mechanisms were found to be highly predominant in response to fungal infection. Fungal pathogen invades the plant cell with the help of haustorium to get access of water and nutrient. Pathogen effector molecule is recognized by the plant immune system, which activates protein kinase cascade followed by activation of transcription factors like WRKY and expression of defence related genes like, GST, Chitinase, and Cytochrome P450. Another defence mechanism results in oxidative burst leading to the production of enzymes such as peroxidase. In the second mechanism, plant cell expresses R-gene for production of NB-LRR protein, which leads to Hypersensitive Response and Systemic Acquired resistance. While in the third mechanism, Pathogen effector molecules are recognized by the host surface receptor proteins called pattern-recognition receptors (PRRs) which increase the MAPK activation
Increasing the expression of PR proteins specifies the beginning of systemic acquired resistance to various pathogens. Such proteins have an antifungal activity to various pathogenic fungi. Glycoside hydrolases (GHs) (PR-2 genes) produce ß-1,3-glucanases that hydrolyse the glycosidic bonds of fungal cell wall polymers (Garnica et al. 2013). In the case of the soybean plant, ß-1,3-glucanases level was doubled during an infected resistant variety during rust infection caused by Phakopsora pachyrhizi fungal pathogen (Soria-Guerra et al. 2010). In this study, up- and down-regulation of GH genes encoding defence-related enzymes, such as chitinase, were found in resistant and susceptible genotypes, respectively, during infection. Thaumatin belongs to PR protein class-5 and causes transmembrane pores in fungal cell membranes and acts as a permatin and hence has antifungal activity (Abad et al. 1996). Transcriptome analysis of a Glycine max also revealed an expression of the thaumatin gene for defence mechanism against Phakopsora pachyrhizi infection (Tremblay et al. 2010). Pectin methylesterases (PMEs) catalyses the demethylesterification of the homogalacturonan domains of pectin in the plant cell wall. Their activity is regulated by PME inhibitors (PMEIs), which function in plant responses to fungal infection (Liu et al. 2018).
Different defence-related genes, such as GST, cytochrome P450, and peroxidase were up-regulated in the resistant peanut genotype compared to the susceptible genotype in biotic stress. The GST enzymes play an important role in grass pea by protecting cells from secondary metabolites produced in response to rust pathogen attack (Garnica et al. 2013). The up-regulation of cytochrome P450 gene has been observed in infected Glycine tomentella during rust infection caused by Phakopsora pachyrhizi fungi. This cytochrome P450 is involved in the production of phyto-oxylipins, which play a critical role in plant defence response (Soria-Guerra et al. 2010). In this study, a similar trend of cytochrome P450 gene up-regulation was found in the infected resistant sample compared to control resistant sample.
R genes encode proteins that interact with avirulence (Avr) effector proteins to induce resistance responses called effector-triggered immunity (ETI), which leads to hypersensitive response (HR) to restrict pathogen growth in plant cells (Lee and Yeom 2015). In general, it was found that R genes, such as F-box protein, MLO-like protein, and TIR-NBS-LRR class protein were highly up-regulated in the resistant variety (Liu et al. 2013a). F-box genes are involved in the regulation of plant hormone signalling pathways (Auxin, gibberellins, ethylene and JA) and disease resistance (Yu et al. 2007). R genes play a role in defence mechanism during wilt infection in castor crop, rust infection in common bean and wheat crops (Kapadia et al. 2015; Ayyappan et al. 2015; Chandra et al. 2016). We found induction PR genes such as beta-1,3-glucanase, GST and chitinase. PR genes are induced by salicylic acid (SA) signalling pathway and finally, lead to programmed cell death (Tremblay et al. 2010). Genes associated with the JA biosynthetic pathway were found to be up-regulated in the RI genotype, including the gene 12-oxophytodienoic acid reductase (Aradu.U86RL). A similar trend of 12-oxophytodienoic acid reductase gene expression was observed in the Anemone coronaria plant during rust disease, caused by the basidiomycete Tranzschelia discolor fungi (Laura et al. 2015). While during the infection, the SI genotype exhibited the down-regulation of lipoxygenase-like genes (Aradu.AS232), which actively participate in the biosynthesis of JA. Lipoxygenases (LOXs) play an important role in plant defence against fungal infection by the production of defence-related components and stomata closing (Canonne et al. 2011; Mhaske et al. 2013).
The transcription factors ERF, WRKY, MYB, and bZIP are involved in disease resistance by regulating the synthesis of phytoalexin (antimicrobial) compounds (Mao et al. 2011; Alves et al. 2014). WRKY genes were found to be up-regulated in wheat when infected with Puccinia triticina, causing leaf rust infection (Chandra et al. 2016). ERF gene expression is linked to the regulation of ethylene and JA dependent defence response genes (Shafiei et al. 2007; Heyman et al. 2018). Several genes and TFs such as WRKY, MYB, bHLH, bZIP, and NAC were actively expressed in early defence responses in common bean-rust interaction (Ayyappan et al. 2015). In the present study, the MYB transcription factor was up-regulated (8.69-fold) in RI compared to in the RC genotype (Supplementary Tables 1). In plants, genes involved in signalling mechanisms play an important role in effecting early defence response (Chandra et al. 2016). We observed a high up-regulation of such genes, including protein kinase and serine/threonine kinase related transcripts (Aradu.6M72C, Aradu.LYT7G, and Aradu.ZTA1W). In this study, we found a higher expression of genes related to secondary metabolites, such as caffeate O-methyltransferase and terpenoids in infected resistant (GPBD-4) samples as compared to control, which may become important markers for the screening of resistant varieties in the defence response of plant against the pathogen. A similar trend of COMT gene expression was observed during rust infection in anemone plant (Laura et al. 2015). During biotic stress, the plant photosystem is suppressed, which leads to the down-regulation of photosynthesis-related genes during pathogen infection. The down-regulation of photosynthesis-related genes, such as chlorophyll a/b binding proteins and ribulose bisphosphate carboxylase, was found in the common bean (Phaseolus vulgaris) during fungal infection (Jain et al. 2016). Simultaneously, in the present study, photosynthesis-related genes, such as thiamine thiazole synthase and pentatricopeptide repeat (PPR) superfamily protein, were found to be down-regulated at a greater level in the infected susceptible genotype compared to the infected resistant genotype.
The RT-qPCR analysis indicated that the expression patterns of the chitinase family and disease resistance genes were similar to those of the transcriptome sequencing data. We hypothesized that these are important genes regulated in response to the fungal pathogen (Supplementary Table 8). The cellulose synthesis gene that plays a central role in determining the mechanical properties of plant cell walls was up-regulated in the resistant variety during RT-qPCR and had the same expression pattern in RNA-Seq analysis (Kesten et al. 2017; Hamid et al. 2019).
RNA-Seq is a cost-effective, rapid and efficient approach to develop SSR markers in various plant species, EST-SSRs identified in this study are likely to have polymorphism within genes related to fungal resistance. These molecular markers may also assist in the construction of a peanut genetic map and diversity analysis. Overall, these two techniques were found to be supportive of RNA-Seq analysis. Earlier studies on EST-SSR mining have been reported from peanut seed transcriptome data (Zhang et al. 2012), and the data obtained from the database for stress response in A. hypogaea (Bosamia et al. 2015). Biotechnology can play an important role in developing new varieties through marker-assisted selection. Gene expression studies through NGS has made specific genome sequence information available, and this enables the identification and development of genome-wide markers (Onaga and Wydra 2016; Tulsani et al. 2020). Such molecular markers and gene discoveries may assist in developing P. arachidis pathogen-resistant peanut varieties.
Conclusion
The transcriptome profile of resistant and susceptible genotypes of peanut plants against P. arachidis was studied by RNA-Seq technology. DEGs were found to be related to the regulatory pathway of metabolism and defence-related activity during biotic stress. GO and KEGG analysis of DEGs revealed essential genes and their pathways responsible for the defence response to fungus. A resistant variety was found to withstand biotic stress due to the up-regulation of exclusively expressed defence-related genes (MLO-like protein, ERF, thaumatin, and F-box). On the other hand, the defence-related genes (lipoxygenase enzyme and pectin methyl-esterase inhibitor protein) were exclusively down-regulated in the susceptible variety during infection. Results of RT-qPCR analysis validated the observations obtained from RNA-Seq data, while EST-SSRs mining is useful for QTL mapping, and crop improvement through marker-assisted breeding. This investigation helped to identify the varietal differences and candidate genes responsible for the plant defence mechanism against P. arachidis infection.
Electronic supplementary material
Below is the link to the electronic supplementary material.
Supplementary Table 1 A detailed information of expression profile of DEGs between GPBD-4_infected and GPBD-4_control (XLSX 53 kb)
Supplementary Table 2 A detailed information of expression profile of DEGs between JL-24_infected and JL-control (XLSX 48 kb)
Supplementary Table 3 A detailed information of expression profile of DEGs between GPBD-4_infected and JL-24_infected (XLSX 41 kb)
Supplementary Table 4 A detailed information of expression profile of DEGs between GPBD-4_control and JL-24_control (XLSX 15 kb)
Supplementary Table 5 GO classification of expressed genes in RI/RC and SI/SC by WEGO (XLS 25 kb)
Supplementary Table 6 GO classification of expressed genes by REVIGO tool. (XLSX 20 kb)
Supplementary Table7 KEGG enrichment analysis of DEGs between resistant and susceptible genotypes of Arachis hypogaea. (XLSX 11 kb)
Supplementary Table 8 List of primers with details of sequence and expression profile used for RT-qPCR validation (XLSX 11 kb)
Supplementary Table 9 SSR analysis and primers list (XLS 33 kb)
Supplementary Fig. 1 GO classification of non-redundantly expressed genes among RI/RC and SI/SC. Bars show the percentages of genes matches to each GO term using a web-based tool, WEGO. Results are grouped by three main functional categories; biological process, cellular component, and molecular function (PDF 611 kb)
Supplementary Fig. 2 A. category-wise distribution of genes. B. Enrichment GO analysis of DEGs performed by REVIGO to identify genes associated with defence mechanism processes. Each bubble in the scatter plot indicates a different GO term. (PDF 1391 kb)
Supplementary Fig. 3 RT-qPCR analysis of DEGs compared with the RNA-Seq data. (PDF 66 kb)
Supplementary Fig. 4 SSR validation by using 15 SSR with both resistant and susceptible varieties of peanut through PCR Gel-Doc image. (PDF 141 kb)
Acknowledgments
Authors are very thankful to Dr. B. A. Golakiya at the Department of Agricultural Biotechnology and Biochemistry, Junagadh for extending their support and guidance in the execution of the experiment. The authors would like to acknowledge the contribution of Mr. Manoj Parakhia for support to carry out research work and the generation of electron microscope images.
Abbreviations
- GO
Gene Ontology
- DEG
Differentially Expressed Gene
- NGS
Next Generation Sequencing
- PR
Pathogenesis related
- GST
Glutathione S-Transferase
- JA
Jasmonic Acid
- ERF
Ethylene responsive factor
- RT-qPCR
Reverse Transcription quantitative PCR
Author contributions
VR executed laboratory and fieldwork of the project, analysed data as well as drafted the manuscript, RH assisted in data analysis as well as improving the manuscript, RST guided throughout the experiment, provided germ-plasm and laboratory facility to generate NGS data and validation using RT-qPCR, RP assisted in the improving the manuscript. SP and JK assisted in the laboratory and fieldwork of the project. PT guided throughout the experiment and helped in pathogen confirmation, NM conceptualized the project, supervised overall experiment and finalised the manuscript.
Funding
We are thankful to the Department of Agricultural Biotechnology and Biochemistry, Junagadh Agricultural University for providing peanut resistant and susceptible germplasm and laboratory facility during the experiment.
Data availability
The datasets generated during and/or analyzed during the current study are available in the GenBank repository. For rust infected samples, resources are BioProject ID: PRJNA489546: Arachis hypogaea (Resistant GPBD-4 Infected) SRA ID SRX4779274 and Arachis hypogaea (susceptible JL-24 Infected) SRA ID SRX4779275 while for control samples, they are BioProject ID: PRJNA490412: Arachis hypogaea (Resistant GPBD-4 control) SRA ID SRX4782027 and Arachis hypogaea (susceptible JL-24 control) SRA ID SRX4782028. https://www.ncbi.nlm.nih.gov/bioproject/PRJNA489546https://www.ncbi.nlm.nih.gov/bioproject/PRJNA490412.
Compliance with ethical standards
Conflict of interest
None of the authors have any financial or personal relationships that could inappropriately influence or bias the content of the research paper.
References
- Abad LR, D'Urzo MP, Liu D, Narasimhan ML, Reuveni M, Zhu JK, Niu X, Singh NK, Hasegawa PM, Bressan RA. Antifungal activity of tobacco osmotin has specificity and involves plasma membrane permeabilization. Plant Sci. 1996;118(1):11–23. [Google Scholar]
- Alves M, Dadalto S, Gonçalves A, de Souza G, Barros V, Fietto L. Transcription factor functional protein-protein interactions in plant defense responses. Proteomes. 2014;2(1):85–106. doi: 10.3390/proteomes2010085. [DOI] [PMC free article] [PubMed] [Google Scholar]
- Ayyappan V, Kalavacharla V, Thimmapuram J, Bhide KP, Sripathi VR, Smolinski TG, Manoharan M, Thurston Y, Todd A, Kingham B. Genome-wide profiling of histone modifications (H3K9me2 and H4K12ac) and gene expression in rust (Uromyces appendiculatus) inoculated common bean (Phaseolus vulgaris L.) PLoS ONE. 2015;10(7):e0132176. doi: 10.1371/journal.pone.0132176. [DOI] [PMC free article] [PubMed] [Google Scholar]
- Beier S, Thiel T, Münch T, Scholz U, Mascher M. MISA-web: a web server for microsatellite prediction. Bioinformatics. 2017;33(16):2583–2585. doi: 10.1093/bioinformatics/btx198. [DOI] [PMC free article] [PubMed] [Google Scholar]
- Bencke-Malato M, Cabreira C, Wiebke-Strohm B, Bücker-Neto L, Mancini E, Osorio MB, Homrich MS, Turchetto-Zolet AC, De Carvalho MC, Stolf R. Genome-wide annotation of the soybean WRKY family and functional characterization of genes involved in response to Phakopsora pachyrhizi infection. BMC Plant Biol. 2014;14(1):236. doi: 10.1186/s12870-014-0236-0. [DOI] [PMC free article] [PubMed] [Google Scholar]
- Bosamia TC, Mishra GP, Thankappan R, Dobaria JR. Novel and stress relevant EST derived SSR markers developed and validated in peanut. PLoS ONE. 2015;10(6):e0129127. doi: 10.1371/journal.pone.0129127. [DOI] [PMC free article] [PubMed] [Google Scholar]
- Brown J, Pirrung M, McCue LA. FQC Dashboard: integrates FastQC results into a web-based, interactive, and extensible FASTQ quality control tool. Bioinformatics. 2017;33(19):3137–3139. doi: 10.1093/bioinformatics/btx373. [DOI] [PMC free article] [PubMed] [Google Scholar]
- Canonne J, Froidure-Nicolas S, Rivas S. Phospholipases in action during plant defense signaling. Plant Signal Behav. 2011;6(1):13–18. doi: 10.4161/psb.6.1.14037. [DOI] [PMC free article] [PubMed] [Google Scholar]
- Cantu D, Segovia V, MacLean D, Bayles R, Chen X, Kamoun S, Dubcovsky J, Saunders DG, Uauy C. Genome analyses of the wheat yellow (stripe) rust pathogen Puccinia striiformis f. sp. tritici reveal polymorphic and haustorial expressed secreted proteins as candidate effectors. BMC Genom. 2013;14(1):270. doi: 10.1186/1471-2164-14-270. [DOI] [PMC free article] [PubMed] [Google Scholar]
- Chandra S, Singh D, Pathak J, Kumari S, Kumar M, Poddar R, Balyan HS, Gupta PK, Prabhu KV, Mukhopadhyay K. De novo assembled wheat transcriptomes delineate differentially expressed host genes in response to leaf rust infection. PLoS ONE. 2016;11(2):e0148453. doi: 10.1371/journal.pone.0148453. [DOI] [PMC free article] [PubMed] [Google Scholar]
- Chen L, Shi H, Heng J, Wang D, Bian K. Antimicrobial, plant growth-promoting and genomic properties of the peanut endophyte Bacillus velezensis LDO2. Microbiol Res. 2019;218:41–48. doi: 10.1016/j.micres.2018.10.002. [DOI] [PubMed] [Google Scholar]
- Chen X, Li H, Pandey MK, Yang Q, Wang X, Garg V, Li H, Chi X, Doddamani D, Hong Y. Draft genome of the peanut A-genome progenitor (Arachis duranensis) provides insights into geocarpy, oil biosynthesis, and allergens. Proc Natl Acad Sci. 2016;113(24):6785–6790. doi: 10.1073/pnas.1600899113. [DOI] [PMC free article] [PubMed] [Google Scholar]
- Chen Y, Ren X, Zhou X, Huang L, Yan L, Lei Y, Liao B, Huang J, Huang S, Wei W. Dynamics in the resistant and susceptible peanut (Arachis hypogaea L.) root transcriptome on infection with the Ralstonia solanacearum. BMC Genom. 2014;15(1):1078. doi: 10.1186/1471-2164-15-1078. [DOI] [PMC free article] [PubMed] [Google Scholar]
- Dobin A, Gingeras TR. Mapping RNA-seq reads with STAR. Curr Protoc Bioinformatics. 2015;51(1):11–14. doi: 10.1002/0471250953.bi1114s51. [DOI] [PMC free article] [PubMed] [Google Scholar]
- Garnica DP, Upadhyaya NM, Dodds PN, Rathjen JP. Strategies for wheat stripe rust pathogenicity identified by transcriptome sequencing. PLoS ONE. 2013;8(6):e67150. doi: 10.1371/journal.pone.0067150. [DOI] [PMC free article] [PubMed] [Google Scholar]
- Ghosh S, Chan CKK. Plant Bioinformatics. New York, NY: Humana Press; 2016. Analysis of RNA-Seq data using TopHat and Cufflinks; pp. 339–361. [DOI] [PubMed] [Google Scholar]
- Grabherr MG, Haas BJ, Yassour M, Levin JZ, Thompson DA, Amit I, Adiconis X, Fan L, Raychowdhury R, Zeng Q. Full-length transcriptome assembly from RNA-Seq data without a reference genome. Nat Biotechnol. 2011;29(7):644. doi: 10.1038/nbt.1883. [DOI] [PMC free article] [PubMed] [Google Scholar]
- Hamid R, Marashi H, Tomar RS, Malekzadeh Shafaroudi S, Sabara PH. Transcriptome analysis identified aberrant gene expression in pollen developmental pathways leading to CGMS in cotton (Gossypium hirsutum L.) PloS ONE. 2019;14(6):e0218381. doi: 10.1371/journal.pone.0218381. [DOI] [PMC free article] [PubMed] [Google Scholar]
- Hamid R, Tomar RS, Marashi H, Shafaroudi SM, Golakiya BA, Mohsenpour M. Transcriptome profiling and cataloging differential gene expression in floral buds of fertile and sterile lines of cotton (Gossypium hirsutum L.) Gene. 2018;660:80–91. doi: 10.1016/j.gene.2018.03.070. [DOI] [PubMed] [Google Scholar]
- Heyman J, Canher B, Bisht A, Christiaens F, De Veylder L. Emerging role of the plant ERF transcription factors in coordinating wound defense responses and repair. J Cell Sci. 2018;131(2):jcs208215. doi: 10.1242/jcs.208215. [DOI] [PubMed] [Google Scholar]
- Hossain MZ, Ishiga Y, Yamanaka N, Ogiso-Tanaka E, Yamaoka Y. Soybean leaves transcriptomic data dissects the phenylpropanoid pathway genes as a defence response against Phakopsora pachyrhizi. Plant Physiol Biochem. 2018;132:424–433. doi: 10.1016/j.plaphy.2018.09.020. [DOI] [PubMed] [Google Scholar]
- Jain S, Chittem K, Brueggeman R, Osorno JM, Richards J, Nelson BD., Jr Comparative transcriptome analysis of resistant and susceptible common bean genotypes in response to soybean cyst nematode infection. PLoS ONE. 2016;11(7):e0159338. doi: 10.1371/journal.pone.0159338. [DOI] [PMC free article] [PubMed] [Google Scholar]
- Jiang S, Sun Y, Wang S. Selection of reference genes in peanut seed by real-time quantitative polymerase chain reaction. Int J Food Sci Technol. 2011;46(10):2191–2196. [Google Scholar]
- Kanehisa M, Goto S. KEGG: kyoto encyclopedia of genes and genomes. Nucleic Acids Res. 2000;28(1):27–30. doi: 10.1093/nar/28.1.27. [DOI] [PMC free article] [PubMed] [Google Scholar]
- Kapadia CV, Mahatma MK, Parekh MJ, Patel N, Tomar RS. Identification of resistance gene analogs (rgas) from highly wilt resistant castor (Ricinus Communis L.) Genotype. Res J Biotechnol. 2015;10(5):16–26. [Google Scholar]
- Kawahara Y, Oono Y, Kanamori H, Matsumoto T, Itoh T, Minami E. Simultaneous RNA-seq analysis of a mixed transcriptome of rice and blast fungus interaction. PLoS ONE. 2012;7(11):e49423. doi: 10.1371/journal.pone.0049423. [DOI] [PMC free article] [PubMed] [Google Scholar]
- Kesten C, Menna A, Sanchez-Rodriguez C. Regulation of cellulose synthesis in response to stress. Curr Opin Plant Biol. 2017;40:106–113. doi: 10.1016/j.pbi.2017.08.010. [DOI] [PubMed] [Google Scholar]
- Koringa PG, Jakhesara SJ, Bhatt VD, Patel AB, Dash D, Joshi CG. Transcriptome analysis and SNP identification in SCC of horn in (Bos indicus) Indian cattle. Gene. 2013;530(1):119–126. doi: 10.1016/j.gene.2013.07.061. [DOI] [PubMed] [Google Scholar]
- Laura M, Borghi C, Bobbio V, Allavena A. The effect on the transcriptome of Anemone coronaria following infection with rust (Tranzschelia discolor) PLoS ONE. 2015;10(3):e0118565. doi: 10.1371/journal.pone.0118565. [DOI] [PMC free article] [PubMed] [Google Scholar]
- Lee H-A, Yeom S-I. Plant NB-LRR proteins: tightly regulated sensors in a complex manner. Brief Funct Genomics. 2015;14(4):233–242. doi: 10.1093/bfgp/elv012. [DOI] [PubMed] [Google Scholar]
- Li J, Han S, Ding X, He T, Dai J, Yang S, Gai J. Comparative transcriptome analysis between the cytoplasmic male sterile line NJCMS1A and its maintainer NJCMS1B in soybean (Glycine max (L.) Merr.) PLoS ONE. 2015;10(5):e0126771. doi: 10.1371/journal.pone.0126771. [DOI] [PMC free article] [PubMed] [Google Scholar]
- Liu J-J, Ekramoddoullah AK. The family 10 of plant pathogenesis-related proteins: their structure, regulation, and function in response to biotic and abiotic stresses. Physiol Mol Plant Pathol. 2006;68(1–3):3–13. [Google Scholar]
- Liu J-J, Sturrock RN, Benton R. Transcriptome analysis of Pinus monticola primary needles by RNA-seq provides novel insight into host resistance to Cronartium ribicola. BMC Genom. 2013;14(1):884. doi: 10.1186/1471-2164-14-884. [DOI] [PMC free article] [PubMed] [Google Scholar]
- Liu J, Wang X, Zhang T, Li X. Assessment of active bacteria metabolizing phenolic acids in the peanut (Arachis hypogaea L.) rhizosphere. Microbiol Res. 2017;205:118–124. doi: 10.1016/j.micres.2017.09.005. [DOI] [PubMed] [Google Scholar]
- Liu M-M, Xing Y-M, Zhang D-W, Guo S-X. Transcriptome analysis of genes involved in defence response in Polyporus umbellatus with Armillaria mellea infection. Sci Rep. 2015;5:16075. doi: 10.1038/srep16075. [DOI] [PMC free article] [PubMed] [Google Scholar]
- Liu N, Sun Y, Pei Y, Zhang X, Wang P, Li X, Li F, Hou Y. A pectin methylesterase inhibitor enhances resistance to Verticillium wilt. Plant physiol. 2018;176(3):2202–2220. doi: 10.1104/pp.17.01399. [DOI] [PMC free article] [PubMed] [Google Scholar]
- Liu Z, Chen T, Ma L, Zhao Z, Zhao PX, Nan Z, Wang Y. Global transcriptome sequencing using the Illumina platform and the development of EST-SSR markers in autotetraploid alfalfa. PLoS ONE. 2013;8(12):e83549. doi: 10.1371/journal.pone.0083549. [DOI] [PMC free article] [PubMed] [Google Scholar]
- Livak KJ, Schmittgen TD. Analysis of relative gene expression data using real-time quantitative PCR and the 2−ΔΔCT method. Methods. 2001;25(4):402–408. doi: 10.1006/meth.2001.1262. [DOI] [PubMed] [Google Scholar]
- Mao G, Meng X, Liu Y, Zheng Z, Chen Z, Zhang S. Phosphorylation of a WRKY transcription factor by two pathogen-responsive MAPKs drives phytoalexin biosynthesis in Arabidopsis. Plant Cell. 2011;23(4):1639–1653. doi: 10.1105/tpc.111.084996. [DOI] [PMC free article] [PubMed] [Google Scholar]
- Mhaske SD, Mahatma MK, Jha S, Singh P, Mahatma L, Parekh VB, Ahmad T. Castor (Ricinus communis L.) Rc-LOX5 plays important role in wilt resistance. Ind Crops Prod. 2013;45:20–24. [Google Scholar]
- Mondal S, Badigannavar AM. Mapping of a dominant rust resistance gene revealed two R genes around the major Rust_QTL in cultivated peanut (Arachis hypogaea L.) Theor Appl Genet. 2018;131:1–11. doi: 10.1007/s00122-018-3106-6. [DOI] [PubMed] [Google Scholar]
- Mondal S, Badigannavar AM, Murty G. RAPD markers linked to a rust resistance gene in cultivated groundnut (Arachis hypogaea L.) Euphytica. 2008;159(1–2):233–239. [Google Scholar]
- Oliveros JC (2007) VENNY. An interactive tool for comparing lists with Venn Diagrams. http://bioinfogp.cnb.csic.es/tools/venny/index.html
- Onaga G, Wydra K (2016) Chapter 10: Advances in plant tolerance to biotic stresses. In: Plant Genome, pp 229–272. 10.5772/64351
- Peng Z, Liu F, Wang L, Zhou H, Paudel D, Tan L, Maku J, Gallo M, Wang J. Transcriptome profiles reveal gene regulation of peanut (Arachis hypogaea L.) nodulation. Sci Rep. 2017;7(1):1–12. doi: 10.1038/srep40066. [DOI] [PMC free article] [PubMed] [Google Scholar]
- Qiu JL, Fiil BK, Petersen K, Nielsen HB, Botanga CJ, Thorgrimsen S, Palma K, Suarez-Rodriguez MC, Sandbech-Clausen S, Lichota J. Arabidopsis MAP kinase 4 regulates gene expression through transcription factor release in the nucleus. EMBO J. 2008;27(16):2214–2221. doi: 10.1038/emboj.2008.147. [DOI] [PMC free article] [PubMed] [Google Scholar]
- Rajkumar AP, Qvist P, Lazarus R, Lescai F, Ju J, Nyegaard M, Mors O, Børglum AD, Li Q, Christensen JH. Experimental validation of methods for differential gene expression analysis and sample pooling in RNA-seq. BMC Genom. 2015;16(1):548. doi: 10.1186/s12864-015-1767-y. [DOI] [PMC free article] [PubMed] [Google Scholar]
- Schmieder R, Edwards R. Quality control and preprocessing of metagenomic datasets. Bioinformatics. 2011;27(6):863–864. doi: 10.1093/bioinformatics/btr026. [DOI] [PMC free article] [PubMed] [Google Scholar]
- Shafiei R, Hang C, Kang JG, Loake GJ. Identification of loci controlling non-host disease resistance in Arabidopsis against the leaf rust pathogen Puccinia triticina. Mol Plant Pathol. 2007;8(6):773–784. doi: 10.1111/j.1364-3703.2007.00431.x. [DOI] [PubMed] [Google Scholar]
- Soria-Guerra RE, Rosales-Mendoza S, Chang S, Haudenshield JS, Padmanaban A, Rodriguez-Zas S, Hartman GL, Ghabrial SA, Korban SS. Transcriptome analysis of resistant and susceptible genotypes of Glycine tomentella during Phakopsora pachyrhizi infection reveals novel rust resistance genes. Theor Appl Genet. 2010;120(7):1315–1333. doi: 10.1007/s00122-009-1258-0. [DOI] [PubMed] [Google Scholar]
- Subrahmanyam P, McDonald D, Waliyar F, Reddy L, Nigam S, Gibbons R, Rao VR, Singh A, Pande S, Reddy P (1995) Screening methods and sources of resistance to rust and late leaf spot of groundnut. ICRISAT: Information Bulletin no. 47
- Subrahmanyam P, Williams J, McDonald D, Gibbons R. The influence of foliar diseases and their control by selective fungicides on a range of groundnut (Arachis hypogaea L.) genotypes. Ann Appl Biol. 1984;104(3):467–476. [Google Scholar]
- Sujay V, Gowda M, Pandey M, Bhat R, Khedikar Y, Nadaf H, Gautami B, Sarvamangala C, Lingaraju S, Radhakrishan T. Quantitative trait locus analysis and construction of consensus genetic map for foliar disease resistance based on two recombinant inbred line populations in cultivated groundnut (Arachis hypogaea L.) Mol Breed. 2012;30(2):773–788. doi: 10.1007/s11032-011-9661-z. [DOI] [PMC free article] [PubMed] [Google Scholar]
- Supek F, Bošnjak M, Škunca N, Šmuc T. REVIGO summarizes and visualizes long lists of gene ontology terms. PLoS ONE. 2011;6(7):e21800. doi: 10.1371/journal.pone.0021800. [DOI] [PMC free article] [PubMed] [Google Scholar]
- Trapnell C, Pachter L, Salzberg SL. TopHat: discovering splice junctions with RNA-Seq. Bioinformatics. 2009;25(9):1105–1111. doi: 10.1093/bioinformatics/btp120. [DOI] [PMC free article] [PubMed] [Google Scholar]
- Trapnell C, Williams BA, Pertea G, Mortazavi A, Kwan G, Van Baren MJ, Salzberg SL, Wold BJ, Pachter L. Transcript assembly and quantification by RNA-Seq reveals unannotated transcripts and isoform switching during cell differentiation. Nat Biotechnol. 2010;28(5):511. doi: 10.1038/nbt.1621. [DOI] [PMC free article] [PubMed] [Google Scholar]
- Tremblay A, Hosseini P, Alkharouf NW, Li S, Matthews BF. Transcriptome analysis of a compatible response by Glycine max to Phakopsora pachyrhizi infection. Plant Sci. 2010;179(3):183–193. [Google Scholar]
- Tulsani NJ, Hamid R, Jacob F, Umretiya NG, Nandha AK, Tomar RS, Golakiya BA. Transcriptome landscaping for gene mining and SSR marker development in Coriander (Coriandrum sativum L.) Genomics. 2020;112(2):1545–1553. doi: 10.1016/j.ygeno.2019.09.004. [DOI] [PubMed] [Google Scholar]
- Untergasser A, Nijveen H, Rao X, Bisseling T, Geurts R, Leunissen JA. Primer3Plus, an enhanced web interface to Primer3. Nucleic Acids Res. 2007;35(2):W71–W74. doi: 10.1093/nar/gkm306. [DOI] [PMC free article] [PubMed] [Google Scholar]
- van Loon LC, Rep M, Pieterse CM. Significance of inducible defense-related proteins in infected plants. Annu Rev Phytopathol. 2006;44:135–162. doi: 10.1146/annurev.phyto.44.070505.143425. [DOI] [PubMed] [Google Scholar]
- Varshney RK, Pandey MK, Janila P, Nigam SN, Sudini H, Gowda M, Sriswathi M, Radhakrishnan T, Manohar SS, Nagesh P. Marker-assisted introgression of a QTL region to improve rust resistance in three elite and popular varieties of peanut (Arachis hypogaea L.) Theor Appl Genet. 2014;127(8):1771–1781. doi: 10.1007/s00122-014-2338-3. [DOI] [PMC free article] [PubMed] [Google Scholar]
- Wan L, Li B, Lei Y, Yan L, Huai D, Kang Y, Jiang H, Tan J, Liao B. Transcriptomic profiling reveals pigment regulation during peanut testa development. Plant Physiol Biochem. 2018;125:116–125. doi: 10.1016/j.plaphy.2018.01.029. [DOI] [PubMed] [Google Scholar]
- Ye J, Fang L, Zheng H, Zhang Y, Chen J, Zhang Z, Wang J, Li S, Li R, Bolund L. WEGO: a web tool for plotting GO annotations. Nucleic Acids Res. 2006;34(2):W293–W297. doi: 10.1093/nar/gkl031. [DOI] [PMC free article] [PubMed] [Google Scholar]
- Yu H, Wu J, Xu N, Peng M. Roles of F-box proteins in plant hormone responses. Acta Biochim Biophys Sin. 2007;39(12):915–922. doi: 10.1111/j.1745-7270.2007.00358.x. [DOI] [PubMed] [Google Scholar]
- Zhang C, Chen H, Cai T, Deng Y, Zhuang R, Zhang N, Zeng Y, Zheng Y, Tang R, Pan R. Overexpression of a novel peanut NBS-LRR gene A h RRS 5 enhances disease resistance to R alstonia solanacearum in tobacco. Plant Biotechnol J. 2017;15(1):39–55. doi: 10.1111/pbi.12589. [DOI] [PMC free article] [PubMed] [Google Scholar]
- Zhang J, Liang S, Duan J, Wang J, Chen S, Cheng Z, Zhang Q, Liang X, Li Y. De novo assembly and characterisation of the transcriptome during seed development, and generation of genic-SSR markers in peanut (Arachis hypogaea L.) BMC Genom. 2012;13(1):90. doi: 10.1186/1471-2164-13-90. [DOI] [PMC free article] [PubMed] [Google Scholar]
Associated Data
This section collects any data citations, data availability statements, or supplementary materials included in this article.
Supplementary Materials
Supplementary Table 1 A detailed information of expression profile of DEGs between GPBD-4_infected and GPBD-4_control (XLSX 53 kb)
Supplementary Table 2 A detailed information of expression profile of DEGs between JL-24_infected and JL-control (XLSX 48 kb)
Supplementary Table 3 A detailed information of expression profile of DEGs between GPBD-4_infected and JL-24_infected (XLSX 41 kb)
Supplementary Table 4 A detailed information of expression profile of DEGs between GPBD-4_control and JL-24_control (XLSX 15 kb)
Supplementary Table 5 GO classification of expressed genes in RI/RC and SI/SC by WEGO (XLS 25 kb)
Supplementary Table 6 GO classification of expressed genes by REVIGO tool. (XLSX 20 kb)
Supplementary Table7 KEGG enrichment analysis of DEGs between resistant and susceptible genotypes of Arachis hypogaea. (XLSX 11 kb)
Supplementary Table 8 List of primers with details of sequence and expression profile used for RT-qPCR validation (XLSX 11 kb)
Supplementary Table 9 SSR analysis and primers list (XLS 33 kb)
Supplementary Fig. 1 GO classification of non-redundantly expressed genes among RI/RC and SI/SC. Bars show the percentages of genes matches to each GO term using a web-based tool, WEGO. Results are grouped by three main functional categories; biological process, cellular component, and molecular function (PDF 611 kb)
Supplementary Fig. 2 A. category-wise distribution of genes. B. Enrichment GO analysis of DEGs performed by REVIGO to identify genes associated with defence mechanism processes. Each bubble in the scatter plot indicates a different GO term. (PDF 1391 kb)
Supplementary Fig. 3 RT-qPCR analysis of DEGs compared with the RNA-Seq data. (PDF 66 kb)
Supplementary Fig. 4 SSR validation by using 15 SSR with both resistant and susceptible varieties of peanut through PCR Gel-Doc image. (PDF 141 kb)
Data Availability Statement
The datasets generated during and/or analyzed during the current study are available in the GenBank repository. For rust infected samples, resources are BioProject ID: PRJNA489546: Arachis hypogaea (Resistant GPBD-4 Infected) SRA ID SRX4779274 and Arachis hypogaea (susceptible JL-24 Infected) SRA ID SRX4779275 while for control samples, they are BioProject ID: PRJNA490412: Arachis hypogaea (Resistant GPBD-4 control) SRA ID SRX4782027 and Arachis hypogaea (susceptible JL-24 control) SRA ID SRX4782028. https://www.ncbi.nlm.nih.gov/bioproject/PRJNA489546https://www.ncbi.nlm.nih.gov/bioproject/PRJNA490412.