

ABSTRACT
Background
Diet quality is an important risk factor for type 2 diabetes (T2D) and cardiovascular disease (CVD). Little is known about the diet quality of South Asians in the United States, a group with higher rates of T2D and CVD compared with other racial/ethnic groups.
Objective
This study determined whether diet quality differs between South Asian adults in the Mediators of Atherosclerosis in South Asians Living in America (MASALA) Study and whites, Chinese Americans, African Americans, and Hispanics in the Multi-Ethnic Study of Atherosclerosis (MESA).
Methods
Cross-sectional data from 3926 participants free of CVD from MESA visit 5 (2010–2011) and 889 South Asian participants from MASALA visit 1 (2010–2013) were pooled. Diet quality was assessed using the Alternative Healthy Eating Index (AHEI-2010) derived using FFQs. Multivariable linear regression models adjusted for age, sex, and total energy intake were used to compare mean differences in diet quality between the racial/ethnic groups.
Results
MESA participants were, on average, 14 y older than MASALA participants. The adjusted mean (95% CI) scores for the AHEI-2010 were 70.2 (69.5, 70.9) among South Asians, 66.2 (66.3, 68.2) among Chinese Americans, 61.1 (60.7, 61.6) among whites, 59.0 (58.4, 59.7) among Hispanics, and 57.5 (56.9, 58.1) among African Americans. The mean AHEI scores among South Asians were 3.1 (1.8, 4.3), 9.2 (8.3, 10.1), 11.2 (10.2, 12.3), and 12.8 (11.8, 13.7) points higher compared with Chinese Americans, whites, Hispanics, and African Americans, respectively.
Conclusions
South Asian adults in the United States have a higher diet quality compared with other racial/ethnic groups. This paradoxical finding is not consistent with the observed higher rates of T2D and CVD compared with other groups. This is further evidence of the importance of studying the South Asian population to better understand the causes of chronic disease not explained by diet quality.
Keywords: diet quality, Alternative Healthy Eating Index 2010, South Asians, race, ethnicity
Introduction
Diet quality plays an important role in the risk of chronic diseases, such as type 2 diabetes (T2D) and cardiovascular disease (CVD) (1–10). Measuring diet quality involves assessing both the quality and variety of the entire diet, rather than just individual nutrients (9). A high-quality diet is made up primarily of healthy foods (e.g., fruits, vegetables, whole grains) and is limited in unhealthy foods and nutrients (e.g., trans fat, sugar, salt) (11). A meta-analysis of cohort studies found that adults who consume high-quality diets have a 22% lower risk of T2D and CVD compared with those who consume low-quality diets (8). Diet quality for the US population, and changes over time, have been evaluated for whites, African Americans, and Hispanics (4, 12–15), and most recently, also among some East Asian and Pacific Islander subgroups (4, 16–18). However, little is known about diet quality among South Asians in the United States and how it compares with other racial/ethnic groups. The few studies that have examined diet quality among South Asians have been small in size and used self-reported perceived diet quality (19) or only included a low-income population (20), which is not representative of the South Asian population in the United States (21).
The objective was to assess the diet quality of South Asian adults participating in the Mediators of Atherosclerosis in South Asians Living in America (MASALA) Study, as measured by the Alternative Healthy Eating Index (AHEI-2010), and examine if it differs compared with that of whites, Chinese Americans, African Americans, and Hispanics participating in the Multi-Ethnic Study of Atherosclerosis (MESA). The secondary objective was to evaluate the association of diet quality with number of years in the United States among immigrants. Given that South Asians have a higher risk of T2D compared with other racial/ethnic groups (22), understanding if and how diet quality may vary from other groups may have important clinical and public health implications.
Methods
Study population
Data were pooled from the MESA and MASALA cohorts. MESA objectives have been published (23). Briefly, MESA enrolled 6814 participants free of known CVD, aged 45–85 y, recruited from Columbia University, New York; Johns Hopkins University, Baltimore; Northwestern University, Chicago; University of California, Los Angeles; University of Minnesota, Twin Cities; and Wake Forest University, Winston Salem. Approximately 38% of the cohort was white, 28% African American, 22% Hispanic, and 12% Chinese American. At the baseline examination (2000–2002), self-reported data were collected on sex, race/ethnicity, years in the United States, country of birth, family income, education, smoking history, diet, and anthropometric measures. Subsequent exam visits were conducted approximately every 2–4 y.
MASALA recruitment methods, eligibility criteria, questionnaire, and clinical measures were based on the MESA study to allow for efficient cross-ethnic comparisons (23, 24). Briefly, 906 South Asian–origin adults aged 40–83 y from the San Francisco Bay and the greater Chicago area were recruited between 2010 and 2013. In both cohorts, sampling was done to obtain balanced recruitment by gender and age strata, and in MESA also by ethnicity. The studies do not represent the demographic distribution of the source communities.
To account for temporal trends in diet quality, our analyses compared diet quality of MASALA exam 1, between 2010 and 2013, with MESA exam 5 from 2010 to 2011. In addition, to account for possible diet changes that may follow after CVD events, we excluded MESA participants who developed CVD by exam 5 (n = 785), as well as MASALA participants with prevalent coronary artery disease (n = 3) at baseline. Last, because of differences in the age distribution between MASALA participants at exam 1 and MESA participants at exam 5, in sensitivity analysis we first restricted our analyses to participants who were in the same age range (53–83 y) and then conducted age-stratified analysis by age category to investigate if diet quality variability was due to age differences. Our final analytic sample included 889 participants from MASALA and 3926 between the ages of 40 and 94 y (n = 4815).
The MESA protocol was approved by the Institutional Review Board (IRB) of the 6 field centers and the National Heart, Lung, and Blood Institute. The IRBs of the University of California, San Francisco, and Northwestern University approved the MASALA study protocol.
Measures
Diet quality
We operationalized diet quality using the AHEI-2010. Details on the development and rationale for the AHEI-2010 are described in detail elsewhere (1–3). Briefly, the AHEI-2010 awards more points for greater intakes of vegetables, whole fruit, whole grains, nuts and legumes, long-chain omega-3 and PUFAs, a modest intake of alcohol, and lower intakes of sugar-sweetened beverages and juice, red and processed meat, trans fats, and sodium. Each food component is scored from 0 (worst) to 10 (best), for a maximum score of 110 (perfect adherence) (Supplemental Table 1) (1).
Food-frequency questionnaires
In MASALA, usual diet intakes over the past year were queried using a previously evaluated FFQ adapted from the Study of Health and Risk in Ethnic Groups Study (SHARE) that included 163 food items of which 48 were South Asian–specific foods (25–27). The FFQ was developed to characterize the diets of South Asian immigrants in Canada and was evaluated against 7- to 14-d diet records. Most energy-adjusted deattenuated r values were between 0.5 and 0.7 for all groups (27). In MESA, usual diet intake over the past year was calculated using an FFQ modified from the Insulin Resistance Atherosclerosis Study (IRAS) evaluated for white, African American, and Hispanic populations, and modified to include traditional Chinese foods. It included 120 food items, of which 10 were Chinese items and 14 were Hispanic items (28, 29). Evaluation in the IRAS FFQ was assessed by comparing dietary values with the average intake estimated from eight 24-h diet recalls administered over the phone in the same period captured by the FFQ (29). Correlation coefficients for the evaluation were significant for most nutrients, with mean r = 0.62 for whites, 0.5 for African Americans, and 0.41 for Hispanics (29). Criterion validity of the MESA FFQ was evaluated against fasting plasma HDL cholesterol and triglycerides within the MESA cohort (30). Participants with unreliable diet assessment (e.g., incomplete FFQ, or those with energy intakes <600 or >6000 kcal/d) were excluded (MESA, n = 257; MASALA, n = 14). To be consistent with a previous diet quality study using MESA data (4), sex- and age-specific (40–69 or ≥70 y) serving sizes for both cohorts were derived from NHANES to reflect current serving sizes in the US population.
Since MESA and MASALA used different FFQs, we examined similarities and differences between them. A total of 73 food items were included in both FFQs. Within items included in the AHEI-2010, MESA also included 24 food items that were not in MASALA, primarily ethnic-specific foods such as tortillas, salsa, refried beans, burritos, Chinese dumplings, chow mein, as well as hot cocoa, ham hocks, pea soup, sunflower seeds, avocado, and brown rice. These foods are not typically consumed in high quantities by South Asians (27). Conversely, MASALA included 17 food items not ascertained in MESA. These were also primarily ethnic foods such as stir-fried and curry dishes, paratha, naan, and other items like fruit drinks, vegetable juice, lunch meat, and bran/granola cereals. Similarly, South Asian ethnic foods are not frequently consumed among non–South Asians (28, 29).
Covariates
Information on covariates were from exam 5 in MESA and exam 1 in MASALA and included age, sex, total energy intake estimated from FFQs, family income, highest level of education attained, smoking history, BMI, and years lived in the United States.
Statistical analyses
All statistical analyses were conducted using Stata 15.0 (StataCorp). Analyses were conducted using pooled data from both cohorts. Diet quality was normally distributed in aggregate and by race/ethnicity and modeled as a continuous variable. We examined the association between race/ethnicity and diet quality using multivariate linear regressions, adjusting for age, sex, and total energy intake. In the fully adjusted model, we included family income, education, BMI category, and smoking history. Since adjustment for these factors did not materially modify the estimates, we did not include them in our final models. Interactions between race/ethnicity and categorical covariates were tested using nested likelihood ratio tests and considered significant if P < 0.05.
In race/ethnicity-stratified models, we adjusted for the same variables as for the aggregate model and applied the Bonferroni correction given that multiple pairwise differences were explored between ethnic groups by region of origin. Last, we examined the association between number of years in the United States among immigrant participants and mean AHEI-2010 and developed a plot based on the model across the entire range of years living in the United States (2–85 y). We examined nonlinearity of time and mean AHEI-2010 using a 3-knot restricted cubic spline for number of years in the United States and performed a significance test using a nested likelihood ratio test.
Results
Characteristics of the participants by racial/ethnic group are shown in Table 1. MESA participants were older than MASALA participants. Approximately half of the combined sample were women. South Asians had higher family incomes and education compared with all other participants. Chinese Americans and South Asians had lower mean BMIs compared with the non-Asian groups, and Chinese Americans had a lower reported total energy intake.
TABLE 1.
Sociodemographic characteristics of adults without cardiovascular disease by racial/ethnic background: MASALA exam 1 (2010–2013) and MESA exam 5 (2010–2011)1
| MESA (n = 3926) | ||||||
|---|---|---|---|---|---|---|
| Characteristic | Combined (n = 4815) | MASALA (South Asian) (n = 889) | Chinese American (n = 430) | White (n = 1647) | Hispanic (n = 831) | African American (n = 1018) |
| Age, y | 67 ± 11 | 55 ± 9 | 69 ± 9 | 69 ± 9 | 69 ± 9 | 69 ± 9 |
| Female, % | 52 | 47 | 50 | 51 | 53 | 59 |
| Family income ≥$75,000, % | 37 | 74 | 23 | 43 | 11 | 24 |
| Education (Bachelor's degree or higher), % | 50 | 88 | 46 | 55 | 12 | 39 |
| BMI, kg/m2 | 28.1 ± 5.5 | 26 ± 4.1 | 24.1 ± 3.3 | 28 ± 5.4 | 29.8 ± 5.7 | 30.2 ± 5.8 |
| Current smoker, % | 7 | 3 | 3 | 7 | 7 | 11 |
| Energy, kcal/d | 1729 ± 789 | 1682 ± 502 | 1341 ± 676 | 1789 ± 758 | 1815 ± 907 | 1774 ± 925 |
| Foreign-born, % | 43 | 98 | 96 | 6 | 66 | 9 |
Values are means ± SDs or %. MASALA, Mediators of Atherosclerosis in South Asians Living in America; MESA, Multi-Ethnic Study of Atherosclerosis.
Participant characteristics and AHEI-2010 scores by race/ethnicity are shown in Table 2. The adjusted mean AHEI-2010 scores were 70.2 (95% CI: 69.5, 70.9) among South Asians, 67.2 (66.3, 68.2) among Chinese Americans, 61.1 (60.7, 61.6) among whites, 59.0 (58.4, 59.7) among Hispanics, and 57.5 (56.9, 58.1) among African Americans. The mean AHEI scores among South Asians were 3.1 (1.8, 4.3), 9.2 (8.3, 10.1), 11.2 (10.2, 12.3), and 12.8 (11.8, 13.7) points higher compared with Chinese Americans, whites, Hispanics, and African Americans, respectively. These differences varied by sex, family income, education, BMI, and smoking history. Women had ∼1–4 points higher AHEI-2010 scores than men across all racial/ethnic groups. Across all groups, the magnitude of the difference in mean AHEI-2010 and family income and educational attainment was heterogeneous (P < 0.01 for interactions).
TABLE 2.
Adjusted mean (95% CI) AHEI-2010 of adults without cardiovascular disease by racial/ethnic background and sociodemographic characteristics: MASALA exam 1 (2010–2013) and MESA exam 5 (2010–2011)1
| Combined (n = 4815) | MESA | ||||||
|---|---|---|---|---|---|---|---|
| Characteristic | n (%) | Combined, mean (95% CI) | MASALA (South Asian) (n = 889) | Chinese American (n = 430) | White (n = 1647) | Hispanic (n = 831) | African American (n = 1018) |
| Adjusted AHEI | 4815 (100) | 62.2 (62.0, 62.5) | 70.22 (69.5, 70.9) | 67.2 (66.3, 68.2) | 61.1 (60.7, 61.6) | 59.0 (58.4, 59.7) | 57.5 (56.9, 58.1) |
| Sex, 0.033 | |||||||
| Female | 2518 (52) | 63.3 (62.9, 63.7) | 70.6 (69.6, 71.6) | 68.7 (67.4, 70.1) | 62.6 (61.9, 63.3) | 60.3 (59.4, 61.2) | 58.4 (57.6, 59.1) |
| Male | 2297 (48) | 61.0 (60.6, 61.4) | 69.8 (68.9, 70.8) | 65.6 (64.3, 66.9) | 59.5 (58.8, 60.2) | 57.7 (56.7, 58.6) | 56.5 (55.6, 57.5) |
| P | — | <0.01 | 0.25 | <0.01 | <0.01 | <0.01 | <0.01 |
| Family income,4 0.013 | |||||||
| <$25,000 | 1032 (22) | 59.9 (59.1, 60.6) | 67.7 (65.4, 70.1) | 66.1 (64.7, 67.4) | 57.1 (55.6, 58.4) | 58.3 (57.3, 59.4) | 56.1 (54.8, 57.3) |
| $25,000–49,999 | 1118 (24) | 61.4 (60.8, 62.0) | 69.4 (67.4, 71.5) | 68.1 (65.9, 70.2) | 59.2 (58.2, 60.2) | 59.2 (58.0, 60.4) | 56.9 (55.9, 58.0) |
| $50,000–74,999 | 773 (17) | 61.5 (60.8, 62.2) | 69.8 (67.7, 72.0) | 65.8 (63.4, 68.3) | 59.6 (58.6, 60.6) | 58.3 (56.6, 60.1) | 58.1 (56.7, 59.4) |
| ≥$75,000 | 1748 (37) | 64.2 (63.6, 64.7) | 71.4 (70.6, 72.3) | 69.0 (67.1, 70.9) | 63.8 (63.1, 64.6) | 61.6 (59.6, 63.6) | 58.3 (57.0, 59.5) |
| P-trend5 | — | <0.01 | <0.01 | 0.1 | <0.01 | 0.01 | <0.01 |
| Education,4 <0.013 | |||||||
| Less than high school | 533 (11) | 58.2 (56.9, 59.4) | 66.2 (62.6, 69.9) | 65.9 (63.7, 68.0) | 55.1 (52.4, 57.7) | 58.7 (57.6, 59.7) | 52.4 (50.3, 54.6) |
| Completed high school | 703 (14) | 59.5 (58.7, 60.4) | 69.1 (65.9, 72.2) | 66.4 (64.0, 68.7) | 56.4 (55.2, 57.6) | 57.8 (56.4, 59.1) | 54.9 (53.5, 56.3) |
| Some college | 1189 (25) | 61.1 (60.5, 61.8) | 69.6 (66.9, 72.3) | 67.0 (65.1, 68.8) | 58.1 (57.2, 59.0) | 59.5 (58.3, 60.6) | 57.6 (56.6, 58.5) |
| Bachelor's or higher | 2383 (50) | 64.1 (63.6, 64.6) | 71.0 (70.3, 71.8) | 67.8 (66.4, 69.1) | 64.1 (63.4, 64.7) | 61.0 (59.1, 62.9) | 59.1 (58.1, 60.0) |
| P-trend5 | — | <0.01 | 0.01 | 0.13 | <0.01 | 0.01 | <0.01 |
| BMI,4,6 0.023 | |||||||
| Normal | 1242 (26) | 63.3 (62.7, 63.9) | 70.2 (68.8, 71.5) | 67.2 (65.7, 68.7) | 62.5 (61.7, 63.3) | 61.1 (59.6, 62.6) | 58.9 (57.5, 60.3) |
| Overweight | 1921 (40) | 62.8 (62.4, 63.3) | 70.0 (69.0, 71.0) | 67.4 (66.0, 68.7) | 62.1 (61.4, 62.9) | 59.5 (58.5, 60.6) | 58.5 (57.4, 59.5) |
| Obese, grade 1 | 1005 (21) | 61.3 (60.6, 61.9) | 70.6 (69.0, 72.2) | 67.2 (64.5, 70.0) | 58.8 (57.8, 59.9) | 58.5 (57.1, 59.8) | 56.8 (55.7, 58.0) |
| Obese, grade 2 | 641 (13) | 60.2 (59.4, 61.0) | 69.7 (67.9, 71.5) | 66.6 (62.2, 71.1) | 58.2 (56.8, 59.7) | 56.5 (54.9, 58.2) | 55.4 (54.1, 56.8) |
| P-trend5 | — | <0.01 | 0.82 | 0.80 | <0.01 | <0.01 | <0.01 |
| Smoking history,4 0.063 | |||||||
| Never | 2507 (52) | 62.3 (61.9, 62.7) | 69.9 (69.1, 70.7) | 67.8 (66.7, 68.8) | 61.2 (60.5, 61.9) | 59.4 (58.5, 60.4) | 57.3 (56.4, 58.2) |
| Former | 1962 (41) | 62.9 (62.4, 63.4) | 71.8 (70.0, 73.6) | 66.4 (64.6, 68.3) | 61.9 (61.3, 62.6) | 59.3 (58.3, 60.2) | 58.3 (57.4, 59.2) |
| Current | 331 (7) | 58.2 (57.0, 59.4) | 68.3 (64.7, 71.9) | 60.9 (55.6, 66.1) | 55.4 (53.6, 57.1) | 55.7 (53.3, 58.2) | 54.8 (53.0, 56.6) |
| P-trend5 | — | <0.01 | 0.39 | 0.01 | <0.01 | <0.01 | 0.01 |
Values are adjusted means (95% CIs) for the overall AHEI score adjusted for age, sex (male, female), and energy (quintiles, kcal/d) and with an interaction term between race/ethnicity and sex. AHEI, Alternative Healthy Eating Index; MASALA, Mediators of Atherosclerosis in South Asians Living in America; MESA, Multi-Ethnic Study of Atherosclerosis.
Different from Chinese American, white, African American, and Hispanic (P < 0.01).
P value for likelihood ratio test of interaction between race/ethnicity and each characteristic.
This variable was only included in this model and was included with an interaction term with race/ethnicity.
P value for chi-square test for linear trend within each ordinal categorical characteristic.
Normal, overweight, obese grade 1, and obese grade 2 cutoffs are (in kg/m2) <25, 25–29.9, 30–34.9, and ≥35 for non-Asian groups and <23, 23–27.4, 27.5–29.9, and ≥30 for Asian groups.
Whites with family incomes >$75,000 had a mean AHEI-2010 that was nearly 7 points greater than whites with incomes <$25,000. In contrast, the mean AHEI-2010 difference between these same income groups among all other racial/ethnic groups was only 2–4 points. The AHEI-2010 score difference between those with a Bachelor's degree or higher compared with those with less than a high school education was only 1.9, 2.3, and 4.7 points higher among Chinese, Hispanics, and South Asians, but the difference was 6.6 and 9 points higher for African Americans and whites, respectively. Additionally, the observed AHEI-2010 gap between those in the obese, grade 2 BMI category compared with those in the normal BMI category differed by racial/ethnic group (P = 0.02 for interaction). Whereas the AHEI-2010 was 3.5, 4.3, and 4.6 points lower among African Americans, whites, and Hispanics with obesity, respectively, the difference among Chinese Americans and South Asians was <1 point. Last, mean AHEI-2010 scores were lower among current smokers compared with never or former smokers across all racial/ethnic groups by ∼3–7 points, except among South Asians in whom the difference was not significant (Table 2).
When we evaluated individual AHEI-2010 food components to identify which groups contributed to observed differences, we found that South Asians consumed greater amounts of vegetables, fruit, whole grains, nuts, and legumes and fewer amounts of sugary beverages, red meat, and trans fatty acids compared with all other groups. However, South Asians also had a lower consumption of sources of omega-3 fatty acids and PUFAs (Figure 1).
FIGURE 1.
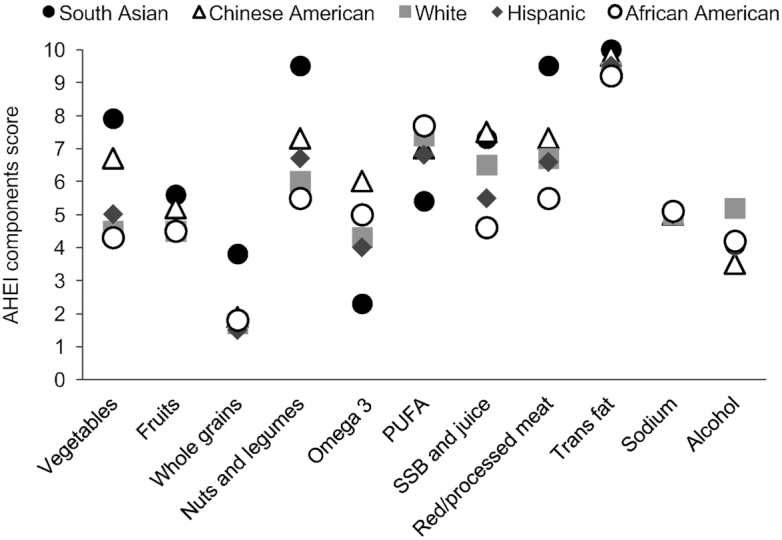
Means for each of the 11 AHEI-2010 components by racial/ethnic background in MASALA (exam 1 in 2010–2013) and MESA (exam 5 in 2010–2011) adults without cardiovascular disease. Values are means for each of the 11 individual AHEI components adjusted for age, sex (male, female), and energy (quintiles; kcal/d). Each individual score ranges from 0 to 10 points for a maximum combined score of 110 points. Sample size included 889 South Asian participants from MASALA and 430 Chinese Americans, 1647 whites, 831 Hispanics, and 1018 African Americans from MESA. AHEI, Alternative Healthy Eating Index; MASALA, Mediators of Atherosclerosis in South Asians Living in America; MESA, Multi-Ethnic Study of Atherosclerosis; SSB, sugar-sweetened beverages.
In an age-stratified sensitivity analysis we restricted the study participants to those in an overlapping age range (53–83 y) (South Asians, n = 498; whites, n = 1517; Chinese Americans, n = 400; African Americans, n = 937; Hispanics, n = 761). The AHEI-2010 score for South Asians increased minimally from 70.2 (95% CI: 69.5, 70.9) to 70.7 (69.8, 71.6) and did not change for any of the MESA groups. Additionally, we conducted age-stratified analysis by race/ethnicity and found that the diet quality differences between groups were not explained by differences in age distributions (Supplemental Table 2).
Differences in diet quality according to immigrant status and years in the United States for immigrants
There were notable birthplace differences between groups. Only 6% and 9% of whites and African Americans, respectively, were born outside of the United States. This was in contrast to 66%, 96%, and 98% of Hispanics, Chinese Americans, and South Asians, respectively. However, we consistently found that within each racial/ethnic group, immigrants had a 3–7 points higher mean AHEI-2010 compared with US-born individuals (results not shown).
Immigrants had been in the United States a mean ± SD of 32 ± 13 y. The association of AHEI-2010 and years living in the United States by group and in aggregate was consistently inverse J-shaped, with a peak around 61 points among those who had been in the United States ∼30 y, and a lower score of 56 points among those who had been in the United States ∼80 y (Figure 2).
FIGURE 2.
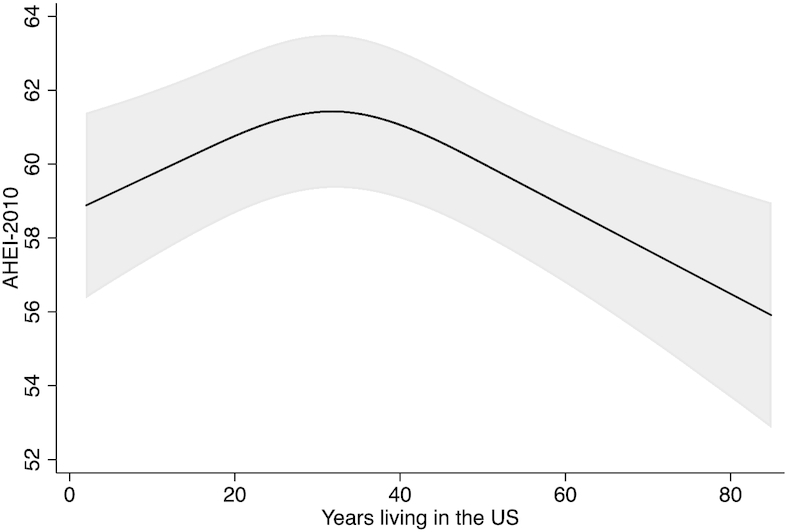
Adjusted mean AHEI-2010 score and years living in the United States among all immigrant adults without cardiovascular disease: MASALA exam 1 (2010–2013) and MESA exam 5 (2010–2011). The plot is based on the model across the entire range of years living in the United States (2–85 y). Values are means ± SEs for the overall AHEI score adjusted for age, sex (male, female), and energy (quintiles; kcal/d). Sample size included 871 South Asian participants from MASALA and 413 Chinese Americans, 99 whites, 548 Hispanics, and 92 African Americans from MESA. AHEI, Alternative Healthy Eating Index; MASALA, Mediators of Atherosclerosis in South Asians Living in America; MESA, Multi-Ethnic Study of Atherosclerosis.
Disaggregating ethnic groups into regions of origin
South Asians were from India, Pakistan, Sri Lanka, Nepal, Bangladesh, or from other diaspora regions (United States, sub-Saharan Africa, Fiji Islands, Burma, Bhutan, Europe). The mean AHEI-2010 ranged from 69.9 to 70.3, with no significant differences (Supplemental Table 3).
Hispanics were from Mexico, Puerto Rico, Dominican Republic, South America, Central America, and Cuba. Notably, Puerto Ricans and Cubans had lower mean AHEI-2010 scores [55.2 (95% CI: 53.5, 57.0) and 54.7 (51.2, 58.2), respectively] compared with South Americans, Dominicans, and Mexicans, who had higher scores [60.9 (58.5, 63.3), 60.9 (59.1, 62.7), and 59.6 (58.7, 60.5), respectively] (Supplemental Table 4).
Chinese Americans were from mainland China, Taiwan, Southeast Asia, or the United States. Notably, those from the United States had the lowest mean AHEI-2010 of 60.2 (56.3, 64.1), followed by Southeast Asia (63.2; 61.0, 65.4). In contrast, those from mainland China or Taiwan had higher scores of 67.7 (66.7, 68.8) and 67.9 (66.0, 69.8), respectively (Supplemental Table 5).
Discussion
Based on data from middle- to older-aged adults collected between 2010 and 2013, we found South Asians to have a higher diet quality compared with Chinese Americans, whites, Hispanics, and African Americans. In particular, South Asians had a greater consumption of food groups that increase overall diet quality, including vegetables, fruits, whole grains, nuts, and legumes, and a lower intake of foods that decrease diet quality, including sugary beverages, red meat, and trans fatty acid intake compared with all other racial/ethnic groups.
Diet quality was higher among women and was associated with higher levels of education, particularly among whites and African Americans, and with family income, especially among whites. Conversely, lower diet quality was associated with higher BMI categories, but only among whites, African Americans, and Hispanics. Immigrants had a higher diet quality and it was generally inversely associated with years lived in the United States.
The present study adds to the currently limited body of literature by describing diet quality of South Asians compared with 4 US racial/ethnic groups. The paradoxical finding that South Asians have a higher diet quality is not consistent with the observed higher rates of T2D and CVD compared with other racial/ethnic groups (22, 31–36). This underscores the importance of studying the high-risk US South Asian population to better understand the causes of noncommunicable chronic disease not explained by traditional risk factors, including diet quality.
Our primary finding is consistent with 1 prior study in the United States that evaluated diet quality in low-income South Asian adults in 2012–2013. Using the Healthy Eating Index (HEI-2010), Khan et al. (20) found South Asians to have a diet quality score of 68 points. Even though their study was conducted in a convenience sample, the mean HEI-2010 score was higher than in the general US population, who, in the year 2008, had a mean HEI-2010 of 53 points (37).
Some of our findings are also consistent with prior NHANES studies. Using multiple diet quality indices, these studies reported that women had a higher diet quality compared with men (12, 37–39), education and family income were positively associated (12, 37–39), and BMI was inversely associated (12). However, none of these early NHANES studies included Asian-American populations. Within the US Hispanic population, Mattei et al. (40) found that mean AHEI-2010 was higher among Mexican Americans, Dominicans, and Central and South Americans compared with Cubans and Puerto Ricans. These results were consistent with the trends observed among Hispanics in MESA.
We found that number of years lived in the United States was associated with differences in diet quality. Immigrant participants had a higher diet quality compared with their US-born counterparts. Among immigrants, the number of years lived in the United States was associated with a higher diet quality for ∼3 decades, followed by a lower diet quality thereafter. It is possible that the diet quality of migrant populations in the United States may initially improve, perhaps by increasing healthier foods less available or affordable in the countries of origin, or taking what is healthier from each culture, but the diet generally worsens over longer periods of time. Prior studies in the United States that have measured acculturation and diet have been variable across different groups, in part due to inconsistency of acculturation measures across studies. For instance, low-income South Asian adults who were more acculturated had a slightly higher diet quality compared with less acculturated South Asians (20). In a study of Haitian immigrants, Huffman et al. (41) found a weak but positive association between AHEI-2010 and years lived in the United States. In another study of Puerto Ricans, van Rompay et al. (42) found that acculturation was associated with higher diet quality, but only among those above the poverty threshold. In contrast, among Mexican-American adolescents using NHANES data, Liu et al. (43) found generational status and higher language acculturation to be associated with poorer diet quality. Last, in a study of Chinese immigrant women, Tseng et al. (18) found that increasing length of US residence was associated with a small decrease in diet quality.
Strengths and limitations
This is the first study to evaluate diet quality differences of 5 major racial/ethnic groups in the United States, which include a South Asian population. The study protocol for MASALA was based on MESA, which allows for efficient cross-ethnic comparisons. Diet quality data were measured using the AHEI-2010, which allows for the examination of the overall diet, a limitation of prior studies. Further, our diet quality calculations included culturally specific foods and recipes, which allowed for an appropriate diet evaluation of dishes from South Asia, which was lacking in prior studies (20).
However, some of the observed AHEI-2010 differences by race/ethnicity may be explained by differences in food items, as well as the validity and reliability of each FFQ to capture diet quality in the respective populations. The consistency of our findings with 1 prior study of South Asians that used a different diet measurement tool and also found higher diet quality compared with other groups in the United States is supportive of our results (20) and makes measurement error less likely to explain our findings. Moreover, it is also possible that some of the observed differences in diet quality by race/ethnicity may be due, in part, to the variability in how respondents perceive and respond to serving sizes of the FFQs. Future studies should consider utilizing other methods such as multiple 24-h diet recalls to assess diet quality between racial/ethnic groups. In addition, we used only the AHEI-2010, which is built on evidence from primarily white cohorts indicating that the 11 food components capture the most relevant foods associated with chronic disease. It is possible that other foods that are not included may play important roles in defining overall diet quality and its association with chronic diseases among South Asians. Future diet quality indices should evaluate the association between traditional foods not included in AHEI-2010 and chronic diseases in racial/ethnic minority populations. Further, this analysis using group averages to make comparisons makes the assumption that error in each of the ethnic groups occurred at random, but we cannot rule out any systematic bias that may have affected one group more than another. Last, our results are limited to the MESA and MASALA cohorts and are not generalizable to the general US population.
Conclusions
South Asians in MASALA had a higher diet quality compared with whites, African Americans, Chinese Americans, and Hispanics in MESA. Immigrants had a higher diet quality, which was inversely associated with years lived in the United States. Future studies should evaluate long-term follow-up of MASALA participants and determine the association between diet quality and incident T2D and CVD risk over time.
Supplementary Material
Acknowledgments
The authors’ responsibilities were as follows—LAR: derived the diet quality score, analyzed data, and wrote the first and final draft of the manuscript; AMK: designed the research and had primary responsibility for final content; AMK and NRK: are principal investigators of the MASALA cohort and were responsible for the data collection procedures for the MASALA cohort; DMH: is a principal investigator of the MESA cohort and was responsible for the data collection procedures for the MESA cohort; YJ: reviewed statistical code for the derivation of the diet quality; MCdOO and SAT: provided technical expertise in the development of the diet quality score; and all authors: read and approved the final manuscript.
Notes
The Multi-Ethnic Study of Atherosclerosis (MESA) was supported by contracts 75N92020D00001, HHSN268201500003I, N01-HC-95159, 75N92020D00005, N01-HC-95160, 75N92020D00002, N01-HC-95161, 75N92020D00003, N01-HC-95162, 75N92020D00006, N01-HC-95163, 75N92020D00004, N01-HC-95164, 75N92020D00007, N01-HC-95165, N01-HC-95166, N01-HC-95167, N01-HC-95168, and N01-HC-95169 from the National Heart, Lung, and Blood Institute, and by grants UL1-TR-000040, UL1-TR-001079, and UL1-TR-001420 from the National Center for Advancing Translational Sciences (NCATS). A full list of participating MESA investigators and institutions can be found at http://www.mesa-nhlbi.org. The Mediators of Atherosclerosis in South Asians Living in America (MASALA) Study was supported by the NIH (grant number R01HL093009). Data collection at the University of California, San Francisco (UCSF), was also supported by NIH/National Center for Research Resources UCSF-Clinical & Translational Science Institute (grant number UL1 RR024131 and UL1 TR000004). LAR was supported in part by NIH/National Institute of Diabetes and Digestive and Kidney Diseases award number F31DK115029.
Author disclosures: The authors report no conflicts of interest.
The content is solely the responsibility of the authors and does not necessarily represent the official views of the NIH or the National Center for Advancing Translational Sciences.
Supplemental Tables 1–5 are available from the “Supplementary data” link in the online posting of the article and from the same link in the online table of contents at https://academic.oup.com/jn/.
Abbreviations used: AHEI/AHEI-2010, Alternative Healthy Eating Index; CVD, cardiovascular disease; HEI-2010, Healthy Eating Index; IRAS, Insulin Resistance Atherosclerosis Study; IRB, Institutional Review Board; MASALA, Mediators of Atherosclerosis in South Asians Living in America; MESA, Multi-Ethnic Study of Atherosclerosis; T2D, type 2 diabetes.
References
- 1. Chiuve SE, Fung TT, Rimm EB, Hu FB, McCullough ML, Wang M, Stampfer MJ, Willett WC. Alternative dietary indices both strongly predict risk of chronic disease. J Nutr. 2012;142:1009–18. [DOI] [PMC free article] [PubMed] [Google Scholar]
- 2. de Koning L, Chiuve SE, Fung TT, Willett WC, Rimm EB, Hu FB. Diet-quality scores and the risk of type 2 diabetes in men. Diabetes Care. 2011;34:1150–6. [DOI] [PMC free article] [PubMed] [Google Scholar]
- 3. McCullough ML, Feskanich D, Stampfer MJ, Giovannucci EL, Rimm EB, Hu FB, Spiegelman D, Hunter DJ, Colditz GA, Willett WC. Diet quality and major chronic disease risk in men and women: moving toward improved dietary guidance. Am J Clin Nutr. 2002;76:1261–71. [DOI] [PubMed] [Google Scholar]
- 4. de Oliveira Otto MC, Padhye NS, Bertoni AG, Jacobs DR, Mozaffarian D. Everything in moderation—dietary diversity and quality, central obesity and risk of diabetes. PLoS One. 2015;10:e0141341. [DOI] [PMC free article] [PubMed] [Google Scholar]
- 5. Fung TT, Rexrode KM, Mantzoros CS, Manson JE, Willett WC, Hu FB. Mediterranean diet and incidence of and mortality from coronary heart disease and stroke in women. Circulation. 2009;119:1093–100. [DOI] [PMC free article] [PubMed] [Google Scholar]
- 6. Fung TT, Chiuve SE, McCullough ML, Rexrode KM, Logroscino G, Hu FB. Adherence to a DASH-style diet and risk of coronary heart disease and stroke in women. Arch Intern Med. 2008;168:713–20. [DOI] [PubMed] [Google Scholar]
- 7. Rhee JJ, Mattei J, Hughes MD, Hu FB, Willett WC. Dietary diabetes risk reduction score, race and ethnicity, and risk of type 2 diabetes in women. Diabetes Care. 2015;38:596–603. [DOI] [PMC free article] [PubMed] [Google Scholar]
- 8. Schwingshackl L, Hoffmann G. Diet quality as assessed by the Healthy Eating Index, the Alternate Healthy Eating Index, the Dietary Approaches to Stop Hypertension score, and health outcomes: a systematic review and meta-analysis of cohort studies. J Acad Nutr Diet. 2015;115:780–800. e5. [DOI] [PubMed] [Google Scholar]
- 9. Wirt A, Collins CE. Diet quality—what is it and does it matter?. Public Health Nutr. 2009;12:2473. [DOI] [PubMed] [Google Scholar]
- 10. Schwingshackl L, Bogensberger B, Hoffmann G. Diet quality as assessed by the Healthy Eating Index, Alternate Healthy Eating Index, Dietary Approaches to Stop Hypertension Score, and health outcomes: an updated systematic review and meta-analysis of cohort studies. J Acad Nutr Diet. 2018;118:74–100., e11. [DOI] [PubMed] [Google Scholar]
- 11. World Health Organization. Healthy diet. Newsroom 2018; [cited 2019 June 25] [Internet]. Available from: https://www.who.int/news-room/fact-sheets/detail/healthy-diet. [Google Scholar]
- 12. Wang DD, Leung CW, Li Y, Ding EL, Chiuve SE, Hu FB, Willett WC. Trends in dietary quality among adults in the United States, 1999 through 2010. JAMA Intern Med. 2014;174:1587. [DOI] [PMC free article] [PubMed] [Google Scholar]
- 13. Rhodes D, Clemens J, Moshfegh A. Nutrient intakes and eating patterns of U.S. adults by race/ethnicity. FASEB J. 2015;29:272–5. [Google Scholar]
- 14. Guenther PM, Casavale KO, Kirkpatrick SI, Reedy J, Hiza HAB, Kuczynski KJ, Kahle LL, Krebs-Smith SM. Diet quality of Americans in 2001–02 and 2007–08 as measured by the Healthy Eating Index-2010. [cited 2019 November 28] [Internet]. Available from: https://fns-prod.azureedge.net/sites/default/files/resource-files/Insight51.pdf.
- 15. Kirkpatrick SI, Dodd KW, Reedy J, Krebs-Smith SM. Income and race/ethnicity are associated with adherence to food-based dietary guidance among US adults and children. J Acad Nutr Diet. 2012;112:624–35., e6. [DOI] [PMC free article] [PubMed] [Google Scholar]
- 16. Qiao Y, Tinker L, Olendzki BC, Hébert JR, Balasubramanian R, Rosal MC, Hingle M, Song Y, Schneider KL, Liu S et al.. Racial/ethnic disparities in association between dietary quality and incident diabetes in postmenopausal women in the United States: the Women's Health Initiative 1993–2005. Ethn Health. 2014;19:328–47. [DOI] [PMC free article] [PubMed] [Google Scholar]
- 17. Serafica RC, Lane SH, Ceria-Ulep CD. Dietary acculturation and predictors of anthropometric indicators among Filipino Americans. Sage Open. 2013;3:215824401349554. [Google Scholar]
- 18. Tseng M, Wright DJ, Fang CY. Acculturation and dietary change among Chinese immigrant women in the United States. J Immigr Minor Health. 2015;17:400–7. [DOI] [PMC free article] [PubMed] [Google Scholar]
- 19. Yi SS, Thorpe LE, Zanowiak JM, Trinh-Shevrin C, Islam NS. Clinical characteristics and lifestyle behaviors in a population-based sample of Chinese and South Asian immigrants with hypertension. Am J Hypertens. 2016;29:941–7. [DOI] [PMC free article] [PubMed] [Google Scholar]
- 20. Khan SA, Jackson RT, Momen B. The relationship between diet quality and acculturation of immigrated South Asian American adults and their association with metabolic syndrome. PLoS One. 2016;11:e0156851. [DOI] [PMC free article] [PubMed] [Google Scholar]
- 21. US Census Bureau. US Census Bureau, American Community Survey: 2009–2011. 2011. [cited 2019 April 16] [Internet]. Available from: https://factfinder.census.gov/faces/tableservices/jsf/pages/productview.xhtml?pid = ACS_11_3YR_S0201&prodType = table. [Google Scholar]
- 22. Flowers E, Lin F, Kandula NR, Allison M, Carr JJ, Ding J, Shah R, Liu K, Herrington D, Kanaya AM. Body composition and diabetes risk in South Asians: findings from the MASALA and MESA studies. Diabetes Care. 2019;42(5):946–53., doi: 10.2337/dc18-1510. [DOI] [PMC free article] [PubMed] [Google Scholar]
- 23. Bild DE, Bluemke DA, Burke GL, Detrano R, Roux AVD, Folsom AR, Greenland P, Jacobs, Jr DR, Kronmal R, Liu K et al.. Multi-Ethnic Study of Atherosclerosis: objectives and design. Am J Epidemiol. 2002;156:871–81. [DOI] [PubMed] [Google Scholar]
- 24. Kanaya AM, Kandula N, Herrington D, Budoff MJ, Hulley S, Vittinghoff E, Liu K. Mediators of Atherosclerosis in South Asians Living in America (MASALA) Study: objectives, methods, and cohort description. Clin Cardiol. 2013;36:713–20. [DOI] [PMC free article] [PubMed] [Google Scholar]
- 25. de Souza RJ, Zulyniak MA, Desai D, Shaikh MR, Campbell NC, Lefebvre DL, Gupta M, Wilson J, Wahi G, Atkinson SA et al.. Harmonization of food-frequency questionnaires and dietary pattern analysis in 4 ethnically diverse birth cohorts. J Nutr. 2016;146:2343–50. [DOI] [PubMed] [Google Scholar]
- 26. Anand SS, Yusuf S, Vuksan V, Devanesen S, Teo KK, Montague PA, Kelemen L, Yi C, Lonn E, Gerstein H et al.. Differences in risk factors, atherosclerosis, and cardiovascular disease between ethnic groups in Canada: the Study of Health Assessment and Risk in Ethnic groups (SHARE). Lancet North Am Ed. 2000;356:279–84. [DOI] [PubMed] [Google Scholar]
- 27. Kelemen LE, Anand SS, Vuksan V, Yi Q, Teo KK, Devanesen S, Yusuf S. Development and evaluation of cultural food frequency questionnaires for South Asians, Chinese, and Europeans in North America. J Am Diet Assoc. 2003;103:1178–84. [DOI] [PubMed] [Google Scholar]
- 28. Bild DE, Bluemke DA, Burke GL, Detrano R, Roux AVD, Folsom AR, Greenland P, Jacobs DR Jr, Kronmal R, Liu K et al.. Multi-Ethnic Study of Atherosclerosis: objectives and design. Am J Epidemiol. 2002;156:871–81. [DOI] [PubMed] [Google Scholar]
- 29. Mayer-Davis EJ, Vitolins MZ, Carmichael SL, Hemphill S, Tsaroucha G, Rushing J, Levin S. Validity and reproducibility of a food frequency interview in a multi-cultural epidemiologic study. Ann Epidemiol. 1999;9:314–24. [DOI] [PubMed] [Google Scholar]
- 30. Nettleton JA, Rock CL, Wang Y, Jenny NS, Jacobs DR. Associations between dietary macronutrient intake and plasma lipids demonstrate criterion performance of the Multi-Ethnic Study of Atherosclerosis (MESA) food-frequency questionnaire. Br J Nutr. 2009;102:1220–7. [DOI] [PMC free article] [PubMed] [Google Scholar]
- 31. Kanaya AM, Herrington D, Vittinghoff E, Ewing SK, Liu K, Blaha MJ, Dave SS, Qureshi F, Kandula NR. Understanding the high prevalence of diabetes in U.S. South Asians compared with four racial/ethnic groups: the MASALA and MESA studies. Diabetes Care. 2014;37:1621–8. [DOI] [PMC free article] [PubMed] [Google Scholar]
- 32. Karter AJ, Schillinger D, Adams AS, Moffet HH, Liu J, Adler NE, Kanaya AM. Elevated rates of diabetes in Pacific Islanders and Asian subgroups: the Diabetes Study of Northern California (DISTANCE). Diabetes Care. 2013;36:574–9. [DOI] [PMC free article] [PubMed] [Google Scholar]
- 33. Bhopal RS. A four-stage model explaining the higher risk of type 2 diabetes mellitus in South Asians compared with European populations. Diabet Med. 2013;30:35–42. [DOI] [PubMed] [Google Scholar]
- 34. Joshi P, Islam S, Pais P, Reddy S, Dorairaj P, Kazmi K, Pandey MR, Haque S, Mendis S, Rangarajan S et al.. Risk factors for early myocardial infarction in South Asians compared with individuals in other countries. JAMA. 2007;297:286. [DOI] [PubMed] [Google Scholar]
- 35. Kanaya AM, Kandula NR, Ewing SK, Herrington D, Liu K, Blaha MJ, Srivastava S, Dave SS, Budoff MJ. Comparing coronary artery calcium among U.S. South Asians with four racial/ethnic groups: the MASALA and MESA studies. Atherosclerosis. 2014;234:102–7. [DOI] [PMC free article] [PubMed] [Google Scholar]
- 36. Whincup PH. Early evidence of ethnic differences in cardiovascular risk: cross sectional comparison of British South Asian and white children. BMJ. 2002;324:635. [DOI] [PMC free article] [PubMed] [Google Scholar]
- 37. Guenther PM, Casavale KO, Kirkpatrick SI, Reedy J, Hiza HAB, Kuczynski KJ, Kahle LL, Krebs-Smith SM. Diet quality of Americans in 2001–02 and 2007–08 as measured by the Healthy Eating Index-2010. [cited 2015 August 31] [Internet]. Available from: https://edit.staging.cnpp.usda.gov/sites/default/files/nutrition_insights_uploads/Insight51.pdf.
- 38. Monsivais P, Rehm CD, Drewnowski A. The DASH diet and diet costs among ethnic and racial groups in the United States. JAMA Intern Med. 2013;173:1922. [DOI] [PMC free article] [PubMed] [Google Scholar]
- 39. Rehm CD, Peñalvo JL, Afshin A, Mozaffarian D. Dietary intake among US adults, 1999–2012. JAMA. 2016;315:2542. [DOI] [PMC free article] [PubMed] [Google Scholar]
- 40. Mattei J, Sotres-Alvarez D, Daviglus ML, Gallo LC, Gellman M, Hu FB, Tucker KL, Willett WC, Siega-Riz AM, Van Horn L et al.. Diet quality and its association with cardiometabolic risk factors vary by Hispanic and Latino ethnic background in the Hispanic Community Health Study/Study of Latinos. J Nutr. 2016;146:2035–44. [DOI] [PMC free article] [PubMed] [Google Scholar]
- 41. Huffman FG, Vaccaro JA, Zarini GG, Dixon Z. Comparison of two indices of diet quality with acculturation factors and demographics in Haitian Americans. Ecol Food Nutr. 2014;53:42–57. [DOI] [PubMed] [Google Scholar]
- 42. van Rompay MI, McKeown NM, Castaneda-Sceppa C, Falcón LM, Ordovás JM, Tucker KL. Acculturation and sociocultural influences on dietary intake and health status among Puerto Rican adults in Massachusetts. J Acad Nutr Diet. 2012;112:64–74. [DOI] [PMC free article] [PubMed] [Google Scholar]
- 43. Liu J-H, Chu YH, Frongillo EA, Probst JC. Generation and acculturation status are associated with dietary intake and body weight in Mexican American adolescents. J Nutr. 2012;142:298–305. [DOI] [PubMed] [Google Scholar]
Associated Data
This section collects any data citations, data availability statements, or supplementary materials included in this article.