

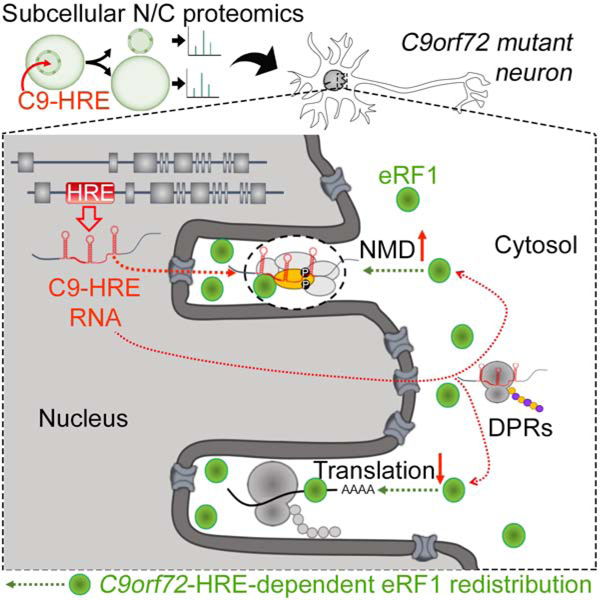
SUMMARY
The most common genetic cause of amyotrophic lateral sclerosis (ALS) and frontotemporal dementia (FTD) is a hexanucleotide repeat expansion in C9orf72 (C9-HRE). While RNA and dipeptide repeats produced by the C9-HRE disrupt nucleocytoplasmic transport, the proteins that become redistributed remain unknown. Here, we utilized subcellular fractionation coupled with tandem mass spectrometry and identified 126 proteins, enriched for protein translation and RNA metabolism pathways, which collectively drive a shift towards a more cytosolic proteome in C9-HRE cells. Amongst these was eRF1, which regulates translation termination and nonsense-mediated decay (NMD). eRF1 accumulates within elaborate nuclear envelope invaginations in patient iPSC-neurons and postmortem tissue and mediates a protective shift from protein translation to NMD-dependent mRNA degradation. Overexpression of eRF1 and the NMD-driver UPF1 ameliorate C9-HRE toxicity in vivo. Our findings provide a resource for proteome-wide nucleocytoplasmic alterations across neurodegeneration-associated repeat expansion mutations and highlight eRF1 and NMD as therapeutic targets in C9orf72-associated ALS/FTD.
Keywords: Amyotrophic lateral sclerosis (ALS), frontotemporal dementia (FTD), C9orf72, ETF1/eRF1, nonsense mediated decay (NMD), UPF1, nucleocytoplasmic proteome, iPSCs, motor neurons
Graphical Abstract
eTOC Blurb
Ortega, Daley et al., use proteome-wide nucleocytoplasmic analysis to identify localization alterations caused by repeat expansion mutations associated with neurodegeneration. The C9orf72-ALS/FTD mutation affects proteins involved in RNA/protein metabolism and disrupts the balance between NMD and translation mediated by eRF1.
INTRODUCTION
A hexanucleotide repeat expansion (HRE) in the first intron of C9orf72 is the most common genetic cause of ALS and FTD (Taylor et al., 2016; Vucic et al., 2014). It accounts for as much as 25% and 40% of familial ALS and FTD respectively, and 5–7% of all sporadic ALS cases. Healthy individuals typically carry less than 30 GGGGCC (G4C2) repeats, while ALS and FTD patients carry hundreds or thousands (DeJesus-Hernandez et al., 2011; Renton et al., 2011). The C9orf72 HRE (C9-HRE) is proposed to drive neurodegeneration through three non-exclusive mechanisms (Balendra and Isaacs, 2018; Gendron et al., 2014; Gitler and Tsuiji, 2016; Haeusler et al., 2016). C9orf72 expression is lower in patients suggesting that haploinsufficiency contributes to pathogenesis (Shi et al., 2018; van Blitterswijk et al., 2015). Gain-of-function neurotoxic effects occur through production of aberrant C9-HRE RNA (Donnelly et al., 2013), and through dipeptide repeat proteins (DPRs) translated by a non-ATG dependent mechanism from the HRE (Mori et al., 2013a; Zu et al., 2013). The G4C2 repeat is bidirectionally transcribed and corresponding sense and antisense RNA accumulates in predominantly nuclear RNA foci in patient cells and tissue (Cooper-Knock et al., 2015; Donnelly et al., 2013; Zu et al., 2013). Moreover, five C9-HRE DPRs (GA, GP, GR, PR, PA) are found in patient cortex and spinal cord tissue (Gomez-Deza et al., 2015; Mackenzie et al., 2015).
While the relative contribution of loss-of-function effects and each gain-of-function effect (RNA or DPRs) remains unresolved, converging evidence suggests that the C9-HRE disrupts the balance of proteins transported between the nucleus and cytoplasm. The expanded C9-RNA binds and sequesters RNA-binding proteins in the nucleus (Donnelly et al., 2013). The arginine-rich DPRs bind and sequester many proteins with low complexity domains that assemble into membrane-less organelles through liquid-liquid phase separation (Lee et al., 2016; Lin et al., 2016). These include RNA granules, nucleoli and various components of the nuclear pore complex (NPC). Moreover, a series of genetic studies in C9-HRE Drosophila and yeast model systems identified nucleocytoplasmic (N/C) trafficking as a critical mediator of C9-HRE toxicity (Freibaum et al., 2015; Jovicic et al., 2015; Zhang et al., 2015). Specifically, NPCs and proteins involved in nuclear import and export are strong modifiers of C9-HRE toxicity. Importantly, the nature of the proteins that become redistributed or mislocalized due to these mechanisms remains unknown.
Abnormal N/C localization of proteins could also have broader relevance for sporadic disease as cytoplasmic accumulation of TDP-43, a protein typically found in the nucleus, is a neuropathological hallmark in most ALS patients (Neumann et al., 2006). Recent studies suggest that cytoplasmic aggregation of TDP-43 interferes with N/C transport, and TDP-43 protein that aggregates in the cytoplasm, specifically outside RNA-rich structures (Mann et al., 2019), is more toxic than TDP-43 that aggregates in the nucleus (Barmada et al., 2014; Woerner et al., 2016). At the same time, NPCs exhibit an age-dependent deterioration in postmitotic neurons, highlighting a potential interaction between mutations, such as the C9-HRE, and age-dependent neurodegenerative NPC dysfunction (D’Angelo et al., 2009; Savas et al., 2012; Toyama et al., 2013).
In this study, we sought to identify proteins with altered N/C distribution in C9-HRE carrier cells. We reasoned that proteins can become mislocalized due to defects in N/C transport, pathogenic sequestration within C9-RNA foci and C9-DPR aggregates, or redistribution to counteract the cellular defects driven by the mutation. We hypothesized that these alterations would highlight disease-relevant mechanisms. To test this hypothesis, we developed an unbiased approach to interrogate proteome-wide N/C protein distribution, and determined how it was affected by the C9-HRE. We identified a number of proteins that are redistributed in C9-HRE cells, primarily implicated in RNA metabolism and protein synthesis. Amongst the proteins that become more nuclear was eRF1, which regulates the balance between protein translation termination and nonsense mediated decay (NMD)-based mRNA degradation. In response to the C9-HRE, eRF1 triggers a protective shift from protein translation to UPF1-dependent NMD, and targets the expanded C9-HRE transcript for degradation. Our work strengthens the hypothesis that a major component of mutant C9orf72 toxicity is related to mRNA processing defects, provides a link between the C9-HRE and the NMD pathway, and highlights eRF1 and UPF1 as novel therapeutic targets in C9orf72-associated ALS/FTD.
RESULTS
The C9orf72 Expansion Leads to Proteome-Wide Nucleocytoplasmic Redistribution
To determine if the C9-HRE affects the N/C distribution of proteins, we expressed a control or disease-associated number of G4C2 repeat sequences (8 or 58 respectively) in HEK-293 cells (Figure 1A) (Freibaum et al., 2015). The constructs included a canonical start site (AUG) in frame with poly-GP DPR and GFP (Figures 1 and S1A). Poly-GP (AUG-driven) and poly-GR (non-AUG-driven) were both produced in transfected cells (Figure S1B–D), and the size of the G4C2-GFP fusion protein corresponded to the respective number of repeats by Western blot (WB) analysis (Figure S1E). We used fluorescent activated cell sorting (FACS) to purify transfected HEK-293 cells (Figures 1A and S1F–H), performed subcellular fractionation to isolate nuclear (N) and cytosolic (C) proteins, and analyzed the proteome by semi-quantitative mass spectrometry (MS) (Figure 1A). We corroborated the precision of the subcellular fractionation by: a) WB analysis that showed the nuclear marker TAFII and cytoplasmic marker VINCULIN confined to the correct fraction (Figure 1B); and b) localization analysis of well-characterized nuclear (n=37) and cytosolic (n=68) resident proteins by MS (Figure 1C and Table S1). C9×58 expression was not toxic at 48h, so we used this time point for MS analyses (Figures S1I–K).
Figure 1. The C9-HRE Leads to Proteome-Wide N/C Redistribution.
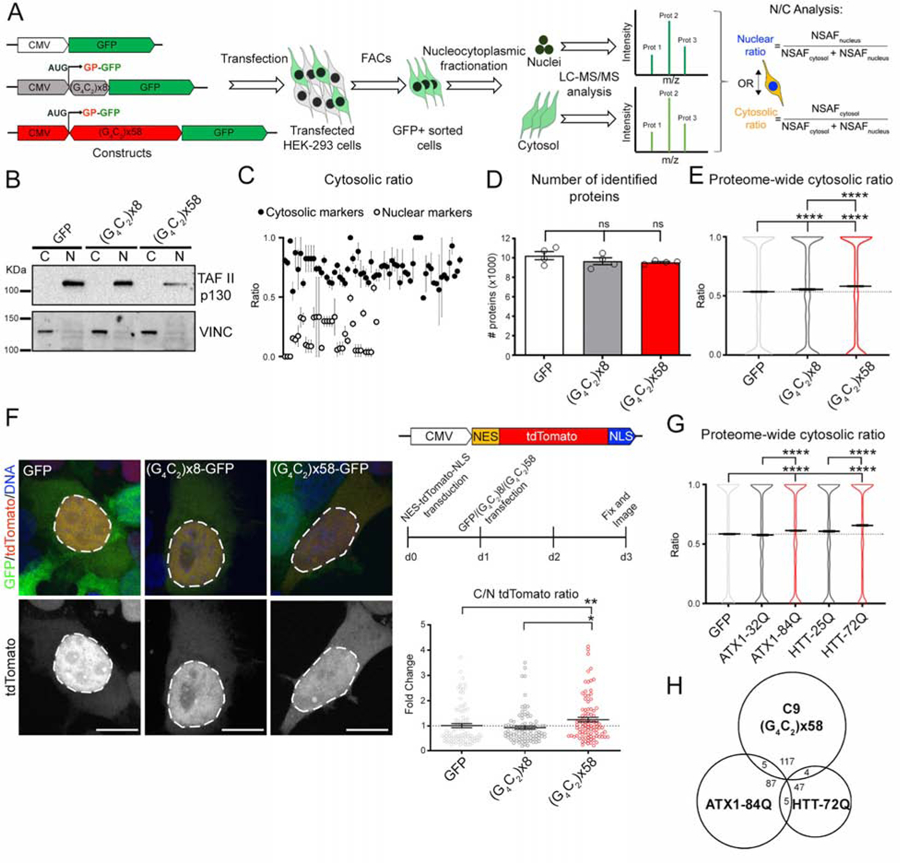
(A) Experimental schematic used to identify the effects of the C9-HRE on the subcellular proteome.
(B) WB for TAFII p130 and VINCULIN in the cytosolic (C) and nuclear (N) fractions of GFP-, C9×8- and C9×58-expressing cells.
(C) Dot plots representing the cytosolic ratio obtained from LC-MS/MS analysis in GFP-expressing cells of bona fide cytosolic (black) and nuclear (gray) markers (n=3 independent biological replicates).
(D) Bar plots representing the average number of redundant proteins identified in cells expressing GFP, C9×8 and C9×58 by LC-MS/MS. ANOVA; ns=not significant.
(E) Violin plots showing the proteome-wide cytosolic ratio of the ~10,000 proteins identified in cells expressing GFP (0.528±0.003; mean ± SEM), C9×8 (0.548±0.003), and C9×58 (0.575±0.003). Kruskal-Wallis test.
(F) Left: Representative confocal images of cells expressing N/C shuttling tdTomato reporter and GFP, C9×8-GFP or C9×58-GFP. Dashed lines mark the nuclear boundary. Right-top: N/C shuttling tdTomato reporter and workflow schematics. Right-bottom: Dot plot showing the fold change in the cytosolic/nuclear (C/N) ratio of the tdTomato signal in C9×58-expressing cells compared to controls. Individual cells are displayed as dots. Kruskal-Wallis test.
(G) Violin plots showing the proteome-wide cytosolic ratio of the ~8,000 proteins identified in cells expressing GFP (0.58±0.004; mean ± SEM), ATX1–32Q (0.57±0.004), ATX1–84Q (0.61±0.004), HTT-25Q (0.60±0.004) and HTT-72Q (0.65±0.004). Kruskal-Wallis test.
(H) Venn diagram showing the level of overlap of redistributed proteins in cells expressing C9×58, ATX1–84Q and HTT-72Q.
In graphs, bars and horizontal lines represent mean ± SEM, and dotted lines mark the GFP-transfected cells mean value. Scale bars: 15 μm.
We identified approximately 10,000 redundant proteins in each sample (GFP, C9×8, C9×58), with no statistically significant differences in the average protein number (n=4 independent biological replicates, m=8 of N and C fractions per sample, p=0.116) (Figure 1D). To assess subcellular protein distribution, we calculated the average N/C ratio for all proteins identified across experiments in the three samples. We then asked if expression of the C9-HRE affected the proteome-wide N/C distribution. We found the average cytosolic ratio of the proteome was significantly shifted to a higher level in the presence of 58 repeats, compared to 8 repeats or control GFP (n=4 independent biological replicates; GFP vs. C9×58: p<0.0001 and C9×8 vs. C9×58: p<0.0001) (Figures 1E and S1L). To investigate the effects on protein distribution by an alternative method, we used a tdTomato reporter containing a nuclear localization signal (NLS) and a nuclear export signal (NES) (Figure 1F, top right). We first validated that the reporter became even more nuclear (2-fold higher) after treatment with nuclear export inhibitor KPT-330 (Figure S1M). We then found that upon C9×58 expression the tdTomato signal became significantly more cytosolic relative to both controls (n=3 independent biological replicates; GFP vs. C9×58: p<0.01, 23% increase ±8; and C9×8 vs. C9×58: p=0.03, 36% increase ±7) (Figure 1F, left and bottom right). These results suggest that C9×58-expressing cells undergo global protein redistribution, with more proteins accumulating in the cytoplasm.
Repeat Expansion Mutations Lead to Proteome-Wide Nucleocytoplasmic Redistribution of Distinct Proteins
We next asked if other neurodegeneration-associated repeat expansion mutations also affect the N/C distribution of proteins. To address this question, we used constructs expressing a polyglutamine (CAG, polyQ) expansion in the Ataxin 1 gene (ATX1-84Q), or in the first exon of the Huntingtin gene (HTT-72Q), that cause spinocerebellar ataxia type 1 (SCA1) and Huntington’s disease (HD), respectively. As controls, we used corresponding constructs with a poly-Q expansion below the threshold of disease (32Q and 25Q, respectively), and a GFP control vector (Figure S1N). Following FACS purification, subcellular fractionation and MS analysis (Figures S1N–Q), we found that expression of poly-Q repeats also caused a significant shift towards a more cytosolic proteome relative to controls (n=3 independent biological replicates, m=6 of N and C fractions per sample, p < 0.0001) (Figure 1G).
We next examined the nature of the proteins that become significantly redistributed and found very little overlap amongst all three repeat expansions, where only 4% and 3.2% of the proteins that shifted in C9×58-expressing cells were also affected by polyQ-ATX1 or HTT, respectively (Figure 1H and Table S1). Moreover, although both ATX1 and HTT repeats represent polyQ sequences, the degree of overlap in redistributed proteins was similarly small (5.2% and 8.9%) (Figures 1H and Table S1). The reason for the differential effects could be associated with the biophysical or functional properties of each mutation, the subcellular localization of the mutant protein, or the size of the repeat itself. These results suggest that impaired N/C trafficking could be broadly implicated in other neurodegenerative diseases, corroborating recent studies for HD and Alzheimer disease models (Eftekharzadeh et al., 2018; Gasset-Rosa et al., 2017; Grima et al., 2017; Woerner et al., 2016).
The C9orf72 Repeat Expansion Causes a Redistribution of Proteins Involved in RNA Metabolism and Protein Translation
Comprehensive statistical analysis identified 126 unique proteins with a significantly altered N/C ratio in C9×58-expressing cells (n=4 independent biological replicates; Kruskal–Wallis rank test; C9×58 vs. GFP and C9×8: p<0.05) (Figure 2A and Table S1). These 126 proteins represented 1.2% of the total number of proteins identified and all showed a bidirectional change, with 56% shifting from the nucleus to cytosol and 44% shifting in the opposite direction (Figure 2B). Approximately 60% of proteins that relocated to the cytosol are normally nuclear, whereas 46% of proteins that relocated to the nucleus, are normally cytosolic (Figure S2A) (Binder et al., 2014), suggesting these changes may have critical functional ramifications.
Figure 2. The C9-HRE Causes a Redistribution of Proteins Involved in RNA Metabolism and Protein Translation.
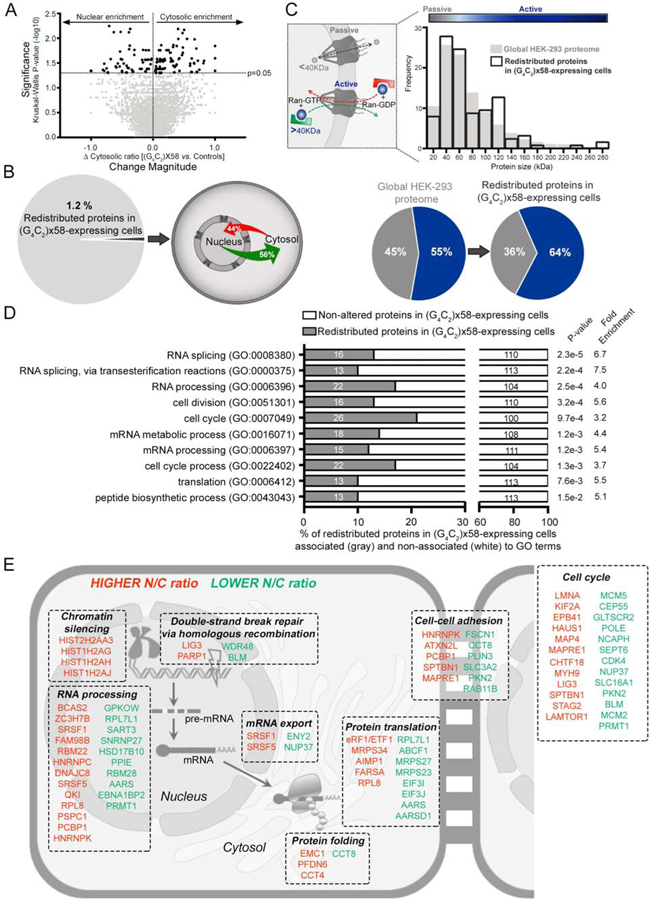
(A) Volcano plot representing the magnitude of change of the cytosolic ratio (x-axis) in C9×58-expressing cells compared to both controls (GFP- and C9×8-expressing cells). Y-axis represents the significance of the change (-log10 of the p-value). Proteins that exhibited a significant change were labeled in dark gray.
(B) Left: pie chart displaying the percentage of redundant proteins identified by LC-MS/MS that demonstrated statistically significant subcellular redistribution in C9×58-expressing cells compared to controls. Right: Schematic showing the percentage of redistributed proteins that become more nuclear (red) or more cytosolic (green) in C9×58-expressing cells.
(C) Top left: graphical representation of size-dependent N/C transport of proteins by passive diffusion or active transport. Top right: histogram showing the size distribution of proteins significantly redistributed in C9×58-expressing cells (black lined bars) compared to the global HEK-293 detected proteome (gray filled bars). Bottom: Pie charts exhibiting the percentage of proteins out of the global HEK-293 cell proteome detected (left) or out of the group of proteins redistributed in C9×58-expressing cells (right), that likely cross the nuclear envelope by passive (gray) or active (blue) transport.
(D) Gene ontology (GO) analysis assessed for significant enrichment in biological processes of the 126 unique proteins redistributed in C9×58-expressing cells. Gray bars represent the number of proteins enriched for each pathway relative to the total number of redistributed proteins. P values and fold enrichment values for each cellular process are displayed on the right.
(E) Graphical representation of the most significant (p<0.05) GO terms associated with redistributed proteins in C9×58-expressing cells. Proteins with higher (red) or lower (green) N/C ratios are depicted with their corresponding GO term and subcellular localization.
Nucleocytoplasmic exchange of proteins can occur by active transport or passive diffusion through the NPC based on protein mass (Figure 2C, left) (Ma et al., 2012). Interrogating the 126 proteins for size distribution relative to all the proteins identified by MS, revealed a significant enrichment for proteins larger than 40 kDa (p<0.040, 55% to 64%), which likely require active transport through the NPC (Figure 2C, right and bottom). Moreover, while bulk sequence comparisons (Bernhofer et al., 2018) showed no significant enrichment for a NES and/or a NLS (p<0.561, 1.18% to 2.38%), protein-by-protein analysis showed that the majority (79%) of redistributed proteins contained a putative NLS or NES or both (Figure S2B and Table S2). Next, we compared our dataset with previously published proteomic datasets describing distinct transporter cargoes (Kimura et al., 2013a; Kimura et al., 2013b; Kimura et al., 2017; Thakar et al., 2013). We specifically examined cargoes associated with CRM1, which is the major nuclear export receptor, as well as ones allocated to various nuclear import receptors (Importins α/β, −4, −5, −7, −8, −9, −11, and transportins Trn-1, −2, -SR). We found very little overlap between the redistributed proteins and these datasets, likely due to differences in methodology and model systems (Figure S2C and Table S2).
To determine whether our protein targets were translocated as a result of sequestration, we compared them with proteins previously reported to interact with the C9-HRE DPRs and C9-HRE RNA (Boeynaems et al., 2017; Cooper-Knock et al., 2014; Donnelly et al., 2013; Haeusler et al., 2014; Hartmann et al., 2018; Lee et al., 2016; Lin et al., 2016; Lopez-Gonzalez et al., 2016; May et al., 2014; Mori et al., 2013b; Tao et al., 2015; Xu et al., 2013; Yin et al., 2017). We found a strong enrichment of C9-HRE interactors within redistributed proteins relative to all proteins detected (31.29% to 48.41%, p<0.0001) (Figure S2D and Table S2), suggesting sequestration by toxic C9-HRE products contributes in part to the protein redistribution events identified.
We next asked if there was a unifying functional component within the 126 redistributed proteins. Gene ontology (GO) analysis revealed a striking enrichment for proteins involved in RNA metabolism, protein translation and cell cycle dynamics (Figures 2D–E and Table S2). Collectively, our findings indicate that the C9-HRE elicits a significant and highly specific redistribution of proteins that comprise major cellular functions including RNA and protein metabolism.
Redistributed Proteins are Genetic Modifiers of C9orf72 Repeat Expansion Toxicity in Drosophila Models of Disease
Altered N/C localization of proteins in the context of the C9-HRE could reflect aberrant protein translocation due to sequestration or impaired trafficking, but could also represent a defensive cellular response. To assess the functional significance of redistributed proteins in the context of an intact nervous system, we used transgenic flies expressing 30 or 36 G4C2 repeats under a GMR-GAL4 driver, which show prominent eye degeneration (Hautbergue et al., 2017; Mizielinska et al., 2014; Xu et al., 2013). We rationally selected six proteins that exhibited a significant magnitude of change in localization (>1.2-fold shift in C9×58-expressing cells relative to both controls), and were representative of the enriched cellular pathways identified in the GO analysis. These included: the mRNA transport protein ENY2, the arginine methyltransferase PRMT1, the RNA-binding protein SRSF1, which was recently linked to C9orf72 mRNA trafficking (Hautbergue et al., 2017), the nuclear import receptor TNPO3, the chaperone CCT8, and the translation termination factor eRF1 (Figure 3A). We obtained RNAi lines for the fly homologues of these proteins and crossed them with the C9×30 and x36 fly models individually (Figures 3B and S3A). Reducing these proteins in control backgrounds did not elicit eye degeneration (Figure S3B). We found that all six selected proteins were significant genetic modifiers of C9-HRE toxicity in vivo (n=12–18 flies/genotype, p<0.01) (Figures 3A–C and S3B–C). Specifically, eRF1, TNPO3, PRMT1 and ENY2 were enhancers in both models as evident from necrotic patches, external eye surface collapse, and depigmentation. CCT8 was an enhancer only in the C9×36 model, and SRSF1 was a strong suppressor of toxicity in both models. This analysis was limited to only six proteins, but there was no indication that the direction of protein redistribution correlated with suppression or enhancement of toxicity in the fly (Figures 3A–C and S3B–C). Collectively, these results suggest that the protein localization analysis we performed highlighted proteins that act as genetic interactors of mutant C9orf72 toxicity in vivo.
Figure 3. Representative Redistributed Proteins are Genetic Modifiers of C9-HRE Toxicity in Drosophila Disease Models.
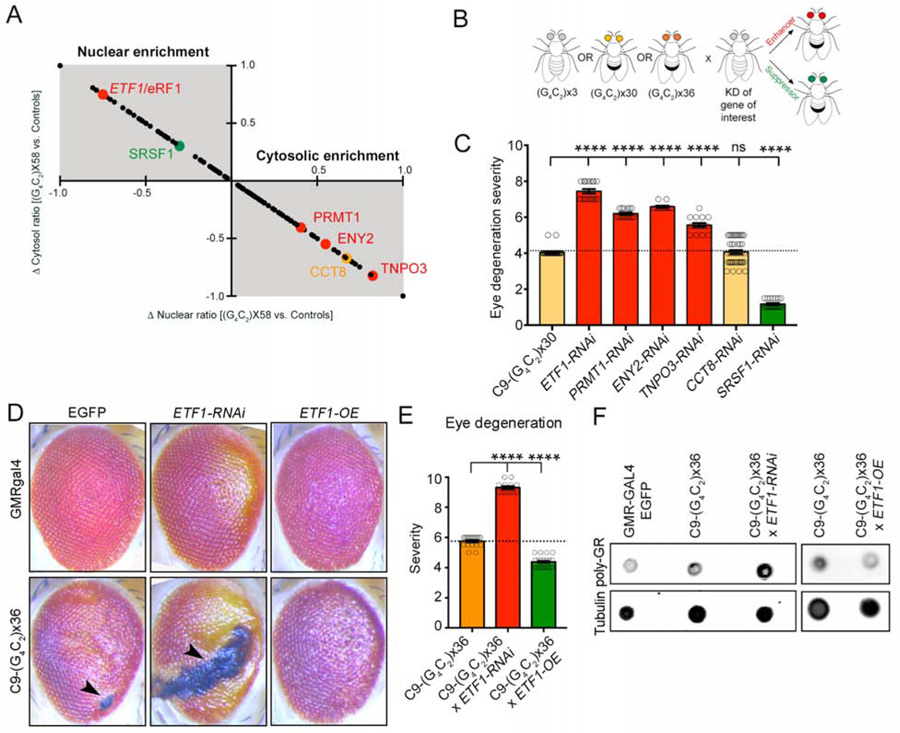
(A) Graph displaying the significantly redistributed proteins, as well as the direction and magnitude of the change observed in C9×58-expressing cells compared to controls. The y-axis represents the change in cytosolic ratio and the x-axis represents the change in nuclear ratio of proteins identified. The upper left gray quadrant includes proteins with a higher N/C ratio, while the lower right quadrant proteins with a lower N/C ratio. Target proteins selected for genetic interaction studies in Drosophila are highlighted in green (suppressors), red (enhancers) or orange (no effect) fonts.
(B) Schematic illustrating the genetic interaction approach in Drosophila models of C9-HRE toxicity. Flies expressing RNAi for selected proteins were crossed with flies expressing 3, 30 or 36 G4C2 repeats, and the resultant level of toxicity was assessed by the level of suppression (green eye) or enhancement (red eye) of eye degeneration.
(C) Bar plots displaying the level of eye degeneration in flies carrying C9×30 repeats with RNAi for ETF1, PRMT1, ENY2, TNPO3, CCT8, or SRSF1. Enhancers and suppressors of toxicity are represented by red and green bars, respectively. The basal level of eye degeneration in C9×30 flies is shown in yellow. Mann-Whitney U test.
(D) Representative images of fly eyes from wild-type (GMR-GAL4 x EGFP) or C9-HRE (C9×30 or x36) mutant flies, with endogenous levels (EGFP), knockdown (ETF1-RNAi) or overexpression (ETF1-OE) of eRF1. Arrow heads indicate the presence of necrotic patches.
(E) Bar plots displaying the level of eye degeneration in flies carrying C9-HRE (C9×36 repeats) with endogenous levels, knockdown (ETF1-RNAi) or overexpression (ETF1-OE) of eRF1. The basal level of eye degeneration in C9×36 flies is shown in orange; suppression and enhancement of C9-HRE toxicity is shown in green and red, respectively. Mann-Whitney U test.
(F) Dot blot of poly-GR in control (GMR-GAL4), C9×36, and C9×36 flies with decreased (ETF1 RNAi) or increased (ETF1-OE) eRF1. Tubulin was used as a loading control.
In graphs, bars represent mean ± SEM and the dotted lines mark the mean level of eye degeneration in C9-HRE flies.
The eukaryotic translation termination factor 1 (ETF1/eRF1), which plays an essential role in RNA metabolism and protein translation (Ivanov et al., 2008; Kashima et al., 2006; Kisselev et al., 2003; Song et al., 2000), was the strongest enhancer of G4C2 toxicity in both fly models (Figures 3C and S3C). Given the enrichment of these two pathways within the proteins affected by the C9-HRE (Figures 2D–E), we closely examined the effects of eRF1 in C9 Drosophila models. Reduction in eRF1 expression enhanced motor dysfunction caused by the HRE compared to controls (n=43–83 flies, p<0.01) (Figure S3D). Conversely, overexpression (Figure S3E) significantly suppressed external eye degeneration, necrotic patches and depigmentation caused by the G4C2 repeat (n=18–20 flies, p<0.0001) (Figures 3D–E and S3F). Intriguingly, poly-GR levels were relatively higher in the fly eye after knockdown, or lower after overexpression of eRF1 respectively (Figure 3F). These results suggest that eRF1 modulates C9-HRE toxicity in vivo by directly or indirectly controlling C9-DPR levels.
eRF1 is Redistributed in C9orf72 iPSC-Derived Motor Neurons and Postmortem C9orf72 ALS Tissue
To validate the shift in eRF1 localization by an alternative approach, we used subcellular fractionation coupled to WB (Figure S4A). We next asked if expressing C9-DPRs alone elicited eRF1 redistribution. Expression of C9×58 (which makes both RNA and DPRs) increased the N/C ratio of eRF1, but expression of codon-optimized constructs (which make each respective DPR but not HRE RNA) did not have a robust effect (Figure S4B–D). These results suggest that eRF1 redistribution is driven by production of G4C2 repeat RNA and not DPRs.
To determine if our findings on eRF1 redistribution hold significance in a more physiologically relevant disease model system, we differentiated human MNs (Ziller et al., 2018) from iPSCs derived from three individual ALS patients with a C9orf72 repeat expansion and three healthy controls (Figure S4E–F and Table S3). Subcellular N/C fractionation and WB analysis from differentiated, day 50 MNs, revealed nuclear enrichment of eRF1 in C9 cases (Figure 4A). To validate the redistribution of eRF1 protein at single cell resolution, we used immunocytochemistry (ICC) coupled to confocal microscopy. We found a significantly higher eRF1 N/C ratio in C9-ALS patient MNs relative to controls (day 50, n=3 patients per group, n=3 independent biological replicates; controls vs C9: p<0.003, 114% increase ± 34) (Figures 4B–C). Consistent with the role of eRF1 in NMD and translation, the majority of eRF1 protein was cytosolic and in close proximity to the nuclear membrane, but mutant C9 MNs exhibited a higher proportion of nuclear eRF1 signal (Figures 4A–C).
Figure 4. eRF1 is Redistributed in C9-ALS iPSC-Derived MNs.
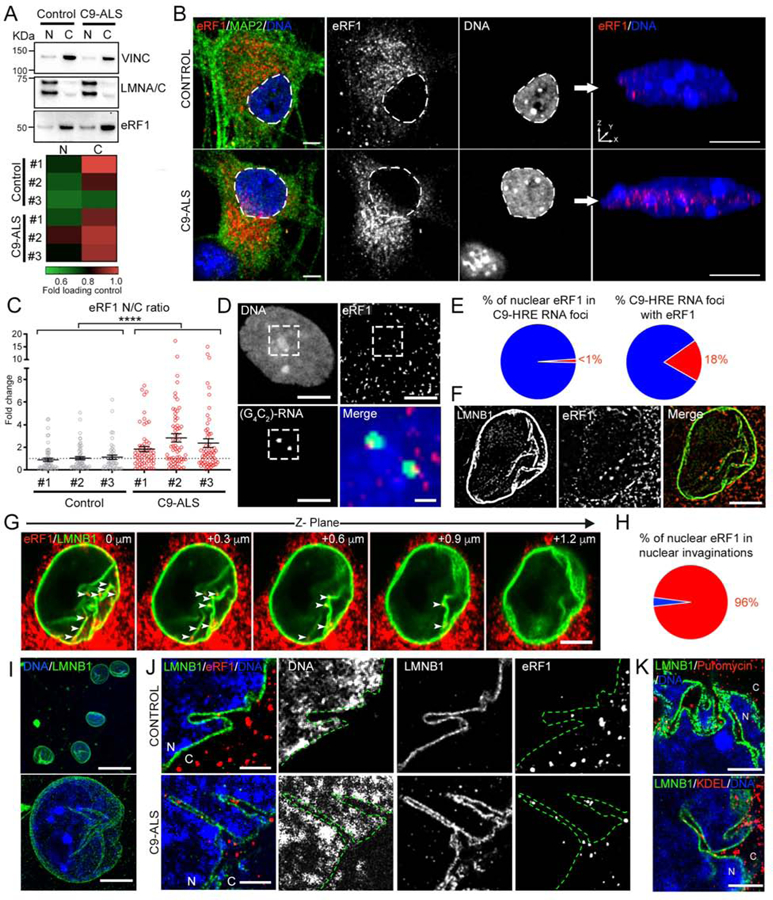
(A) Representative WB bands for eRF1 in nuclear and cytosolic fractions of MN cultures derived from a control and a C9-ALS iPSC line. Bottom: Heat map showing the average eRF1 protein level normalized to subcellular fraction-loading controls (VINCULIN and LMNA/C, for cytosolic and nuclear fractions, respectively) in MNs derived from 3 healthy control and 3 C9-ALS patient iPSC lines (n=5–7 independent differentiations).
(B) Left: Representative confocal images of healthy control and C9-ALS patient MNs immunolabeled for eRF1 (red), MAP2 (green) and DNA (blue). Dashed lines mark the nuclear boundary. Right: 3-D reconstruction of control (top) and C9-ALS patient (bottom) MN nuclei shown on the left.
(C) Dot plot displaying the fold change in the N/C ratio of eRF1 signal quantified in MNs derived from 3 controls and 3 C9-ALS patient iPSC lines. Individual cells are represented as empty-filled circles, bars represent mean ± SEM, and the dotted line marks the mean N/C ratio in control samples. Mann-Whitney U test.
(D) Representative FISH+ICC confocal image of a C9-ALS patient MN nucleus immunolabeled for G4C2 RNA foci (green), eRF1 (red) and DNA (blue). Dashed lines mark the inset region magnified in the right bottom merged image.
(E) Pie charts displaying the percentage of nuclear eRF1 signal that colocalizes with C9-HRE RNA foci (left) and the percentage of C9-HRE RNA foci that colocalize with eRF1 signal (right).
(F) Representative structured-illumination microscopy (SIM) image of a C9-ALS patient MN nucleus immunolabeled for eRF1 (red) and LMNB1 (green).
(G) Representative serial confocal images of a C9-ALS patient MN nucleus immunolabeled for eRF1 (red) and LMNB1 (green). Arrow heads indicate ERF1+ puncta localized within LMNB1+ nuclear envelope invaginations.
(H) Pie chart displaying the percentage of nuclear eRF1 signal that colocalizes with LMNB1+ nuclear envelope invaginations in C9-ALS patient MNs.
(I) Regular (top) or expansion (bottom) confocal microscopy images of human iPSC-derived MN nuclei immunolabeled for LMNB1 (green) and DNA (blue).
(J) Representative expansion microscopy images of healthy control (top) and C9-ALS patient (bottom) MN nuclei immunolabeled for eRF1 (red), LMNB1 (green), and DNA (blue).
(K) Top: Representative expansion microscopy image of a C9-ALS patient MN nucleus immunolabeled for puromycin incorporation (red), LMNB1 (green), and DNA (blue). Bottom: Representative expansion microscopy image of C9-ALS patient MN nucleus immunolabeled for KDEL (red), LMNB1 (green), and DNA (blue).
Scale bars: 25 (I), 10 (B left, K), 5 (B right, D, F, G, J), 1 (D inset) μm. N: Nucleus; C: Cytosol.
Using 3D reconstructed confocal images of MN nuclei, we found that eRF1 protein amassed within discrete puncta (Figure 4B, right). We tested whether nuclear accumulation was due to aberrant sequestration by nuclear C9-HRE products (RNA and/or DPRs). Using fluorescence in situ hybridization (FISH) coupled to ICC, we found that 18% of nuclear C9-HRE RNA foci colocalized with eRF1 puncta, but less than 1% of nuclear eRF1 puncta colocalized with C9-HRE RNA foci (Figure 4D–E). There was also a negative correlation between nuclear eRF1 and poly-GR/PR signal (Figure S4G). These results suggest C9-HRE RNA/DPRs do not drive the nuclear accumulation of eRF1 by sequestration.
Since neither DPRs nor RNA foci co-localized with nuclear eRF1 puncta, we examined if eRF1 was closely associated with the nuclear membrane, which would result in it being fractionated within the nuclear extract in our MS analysis. Superresolution imaging by structured illumination microscopy (SIM) (Figure 4F) and serial confocal imaging (Figure 4G) revealed a stunning architecture of the nuclear envelope in MNs, with LMNB1+ protrusions within the nucleus, and eRF1 puncta within these structures. Intriguingly, we found that the majority of eRF1 puncta (>96%) colocalized with highly complex LMNB1+ nuclear envelope invaginations (n=3 patients, m=48 neurons per patient) (Figure 4H).
To elucidate whether eRF1 accumulated on the nucleoplasmic or the cytosolic side within nuclear envelope invaginations, we performed expansion microscopy (Asano et al., 2018) coupled to confocal-based imaging (Figure 4I). This approach increased resolution and illustrated that eRF1 resided within the cytosolic side of the nuclear membrane (Figure 4J). These invaginations also demonstrated endoplasmic reticulum (ER) markers, sites of active protein translation (Figure 4K), and almost all had eRF1 protein within them (Figure S4H). Using a knock-in LMNB1-mEGFP reporter iPSC line, we found that all MNs progressively accumulated nuclear envelope invaginations (Figure S4I), suggesting they represent functional structural elements. Critically, C9-ALS patient and control MNs did not show different invagination abundance (Figure S4J–K), but patient MNs contained significantly more eRF1 within these structures (Figure 4B).
To validate these findings in the context of ALS patient neurons in vivo, we performed immunohistochemistry (IHC) in postmortem cortical tissue from three C9orf72 ALS patients and three age-matched controls (Table S3). We found a significantly higher eRF1 N/C ratio in C9-ALS patient MNs (n=3 patients per group, m=28–68 neurons per patient; controls vs C9: p<0.0001) (Figures 5A–B and S5). In contrast to patient iPSC-derived MNs, we found a significantly higher abundance of LMNB1+ nuclear envelope invaginations in C9 cases relative to controls (n=3 patients per group, m=31–76 neurons per patient; controls vs C9: p<0.0001) (Figure 5C–D). Collectively, these studies show that a proportion of eRF1 becomes redistributed in mutant C9orf72 patient neurons in vitro and in vivo.
Figure 5. eRF1 is Redistributed in Postmortem C9-ALS Tissue.
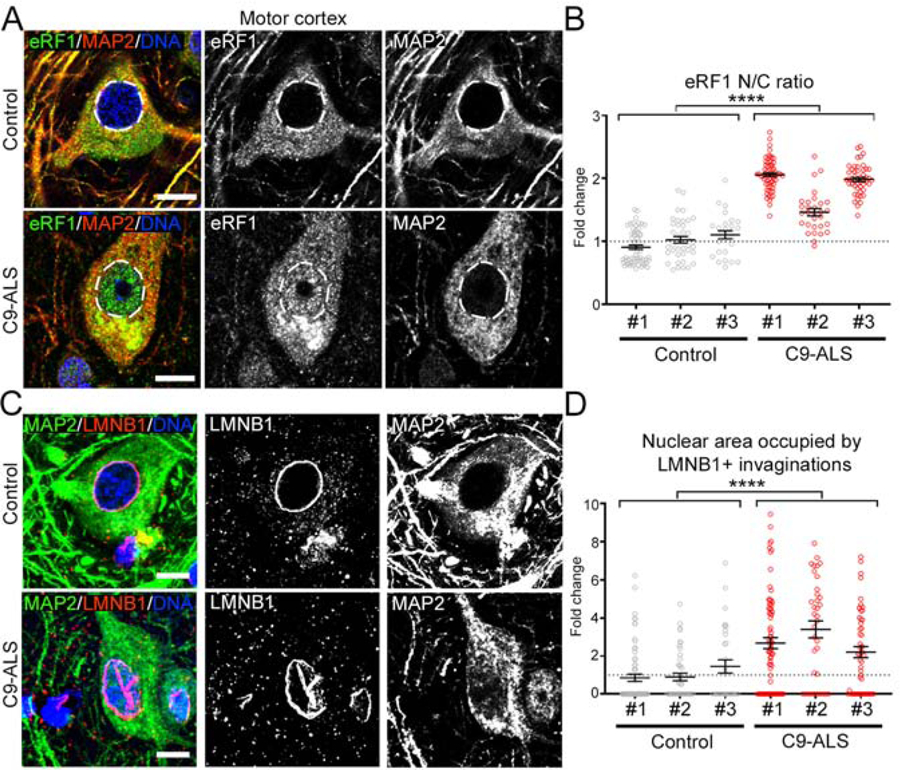
(A) Representative IHC confocal images of layer V neurons immunolabeled for eRF1 (green), MAP2 (red) and DNA (blue) in motor cortex tissue from non-neurological controls and C9-ALS patients. Dashed lines mark the nuclear boundary.
(B) Dot plot displaying the fold change in the N/C ratio of eRF1 signal observed in cortical neurons of 3 non-neurological age-matched controls and 3 C9-ALS patients. Mann-Whitney U test.
(C) Representative IHC confocal images of layer V neurons immunolabeled for LMNB1(red), MAP2 (green), and DNA (blue) in motor cortex tissue from non-neurological controls and C9-ALS patients.
(D) Dot plot displaying the fold change in the nuclear area occupied by LMNB1+ invaginations in cortical neurons of 3 non-neurological age-matched controls and 3 C9-ALS patients. Mann-Whitney U test.
In graphs, bars represent mean ± SEM and the dotted lines mark the mean in control samples. Scale bars: 10 μm.
eRF1 Mediates a Shift From Protein Translation to mRNA Degradation Through Nonsense Mediated Decay in C9-HRE Expressing Cells
eRF1 plays an essential role in two closely related cellular mechanisms: termination of protein translation and nonsense mediated decay (NMD) of mRNA molecules. During regular termination of protein synthesis, eRF1 recognizes stop codons, binds to the translating ribosome, and triggers cleavage of the nascent peptide (Brown et al., 2015; Kryuchkova et al., 2013; Lind et al., 2017). In cases where eRF1 detects a premature stop or an irregularly spliced mRNA, it triggers its degradation by recruiting the master regulator of NMD, upframeshift protein 1 (UPF1), which becomes phosphorylated (pUPF1), and enlists endonuclease activities (Huang and Wilkinson, 2012; Kashima et al., 2006; Kurosaki et al., 2014; Kurosaki and Maquat, 2016; Wolin and Maquat, 2019).
Given the importance of eRF1 in adjusting the balance of these two cellular pathways, we next asked if its redistribution affected the state of protein translation and NMD. We first used ICC to measure the amount of the amino acid analog homopropargylglycine (HPG) incorporated into newly translated proteins at single-cell resolution (Figure S6A). We found a significant reduction in the rate of de novo protein synthesis in C9–58-expressing cells relative to controls (n=3 independent biological replicates; GFP vs. C9×58: p<0.001, 42% decrease ± 3; and C9×8 vs. C9×58: p=0.004, 41% decrease ± 4) (Figure S6B). We next measured the basal rate of protein synthesis in C9 patient and control iPSC-derived MNs (Figure 6A). In accordance with previous reports (Hartmann et al., 2018; Kanekura et al., 2016; Kwon et al., 2014; Lee et al., 2016), C9-ALS patient MNs exhibited significantly reduced protein synthesis relative to controls (day 50, n=3 patients vs 3 control, n=6–10 independent biological replicates; p<0.01, 18% decrease ± 3) (Figure 6B). Critically, eRF1 knockdown led to a significant reduction but not complete ablation of translation in healthy MNs (siScr vs siETF1 in n=1 control, n=3 independent biological replicates, p<0.0001, 60% decrease ± 5), confirming that eRF1 is responsible for translation under control conditions (Figures 6C and S6C). However, eRF1 knockdown had a more moderate effect in C9 MNs, likely because translation is already significantly impaired (siScr vs siETF1 in n=2 patients, n=3 independent biological replicates, p=0.336, 22% decrease ± 4) (Figure 6C). Since activation of the integrated stress response (ISR) can inhibit protein synthesis (Harding et al., 2003) and trigger DPR translation (Westergard et al., 2019), we addressed whether it was contributing to this translational defect. We did not find any strong evidence for ISR activation in patient MNs based on the level of three ISR markers (Figure S6D). Additionally, treatment with ISRIB, which reverses the effects of eIF2α phosphorylation, did not restore protein translation levels in C9 MNs (Figure S6E).
Figure 6. Protein Translation and mRNA Degradation Through NMD in C9-HRE Expressing Cells.
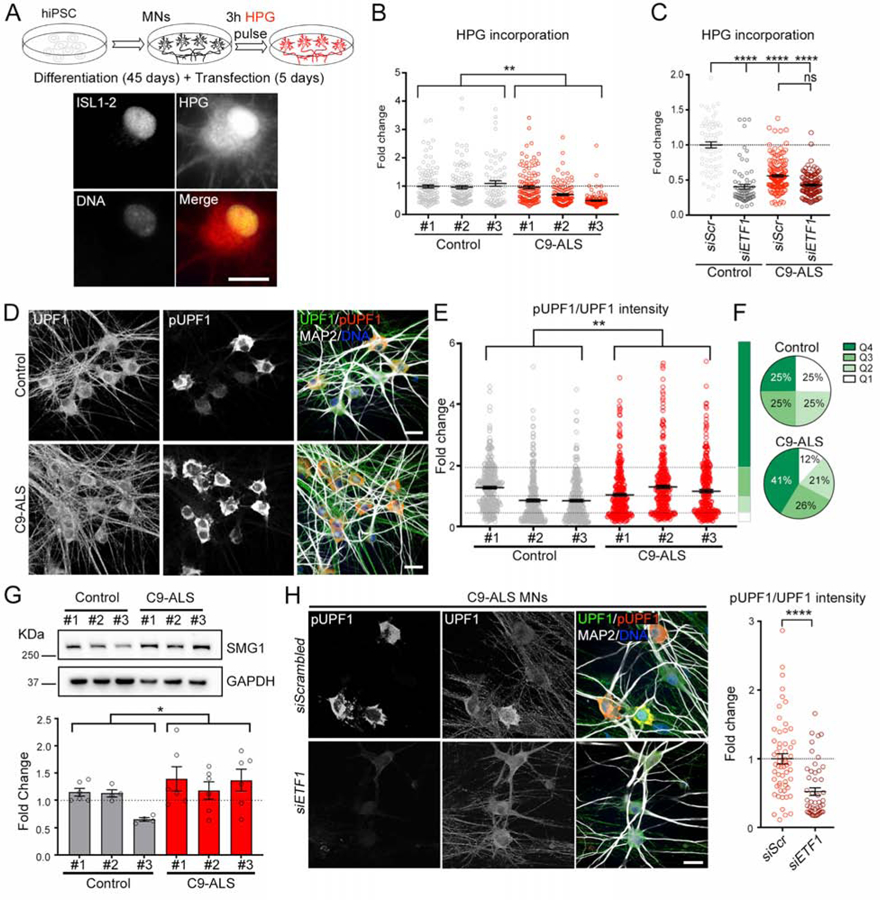
(A) Top: schematic of de novo protein translation assay performed in iPSC-derived MNs. Bottom: representative image of HPG fluorescent labeling of de novo protein synthesis in an ISL1–2+ MN.
(B) Dot plot displaying the level of HPG incorporation in MNs derived from 3 control and 3 C9-ALS iPSC lines. Kruskal-Wallis test.
(C) Dot plot displaying the level of HPG incorporation in MNs transfected with scrambled (siScr) or ETF1 siRNAs. MNs derived from 1 control and 2 C9-ALS iPSC lines. Kruskal-Wallis test; ns=not significant.
(D) Representative confocal images of healthy control and C9-ALS patient MNs immunolabeled for total UPF1 (green), pUPF1 (red), and DNA (blue).
(E) Dot plot displaying the fold change in pUPF1/UPF1 signal in control and C9-ALS MNs. (Mann-Whitney U test.
(F) Pie charts displaying NMD activation levels defined by pUPF1/UPF1 quartiles (Q1–4) observed in control (top) and C9 (bottom) MNs.
(G) Top: Representative WB for SMG1 in MN cultures derived from 3 control and 3 C9-ALS iPSC lines. GAPDH was used as a loading control. Bottom: bar plots showing the fold change in the SMG1/GAPDH ratio in control and C9-ALS MN cultures. T test.
(H) Left: Representative confocal images of C9-ALS patient MNs transfected with scrambled or ETF1 siRNAs and immunolabeled for total UPF1 (green), pUPF1 (red), and DNA (blue). Right: dot plot displaying the fold change in pUPF1/UPF1 signal in C9-ALS MNs transfected with scrambled or ETF1 siRNAs. n=3 independent differentiations; Mann-Whitney U test.
In graphs, empty-filled circles represent individual cells (B, C, E, H) or biological replicates (G). Bars represent the mean ± SEM and dotted lines mark the mean level in control samples (B, C, G, H) or Q1–4 quartile limits (E). Scale bars: 25 (D, H), 20 (A) μm.
In contrast to reduced protein synthesis, C9-ALS patient MNs exhibited an induction of NMD as measured by the levels of pUPF1 protein (day 50, n=3 patients per group, n=4 independent biological replicates; controls vs C9: p<0.007, 38% increase ± 13) (Figure 6D–F). Critically, C9-ALS cultures showed a striking increase in the proportion of MNs with high pUPF1 levels relative to controls, indicating hyperactivated NMD (from 25% in controls to 41% in patients, n>217 MNs per individual) (Figure 6F). We also examined the level of SMG1, which is the canonical kinase that phosphorylates UPF1, and found a significant increase in C9-ALS MN cultures (n=6 independent biological replicates; controls vs C9: p<0.05, 31% increase ± 11) (Figure 6G). Importantly, NMD activation was eRF1-dependent as its knockdown in HEK-293 cells (Figure S6F) or patient-derived MNs (Figure 6H), significantly diminished pUPF1 levels (p<0.0001). We then used a reporter system (Nickless et al., 2014) that monitors NMD efficiency based on the ratio of a transcript with a premature termination codon (PTC) to one without (Figure S6G–I). We found that C9–58 expression triggered NMD as the ratio of PTC to control transcript showed a small but significant increase relative to C9–8-expressing cells (n=3 independent biological replicates; C9×8 vs. C9×58: p=0.044) (Figure S6J). Critically, the degradation of the PTC transcript was eRF1-dependent, as this ratio significantly increased after eRF1 knockdown (n=2 independent biological replicates; C9×58: siScr vs. siETF1 p<0.0001) (Figure S6K–L).
C9orf72 mRNA is Targeted for Degradation by Nonsense Mediated Decay
Collectively, our data suggest that the C9-HRE elicits an eRF1-mediated shift from protein translation to NMD-dependent mRNA degradation (Figure 6). This shift likely confers a protective effect as eRF1 reduction enhances poly-GR production and C9-HRE toxicity, while eRF1 overexpression suppresses C9-HRE toxicity and poly-GR production in Drosophila C9 models (Figure 3). The C9-HRE also triggers eRF1 accumulation in nuclear envelope invaginations (Figure 4). Importantly, we found evidence for protein synthesis within these invaginations based on detection of puromycin, ER markers, as well as colocalization of eRF1 and pUPF1 (Figures 4K and S7A–B), suggesting that a proportion of mRNA surveillance coupled to protein translation occurs within these structures.
It is likely that the reported C9-HRE-dependent retention of the first intron of C9orf72 in combination with the high GC content of the HRE, earmarks the expanded transcript as a target for NMD-dependent degradation (Sznajder et al., 2018; Colombo et al., 2017; Imamachi et al., 2017; Zhang et al., 2009). To test this hypothesis, we employed several approaches. Given that NMD degrades mRNAs as they exit the nuclear pore complex (Kurosaki and Maquat, 2016), we analyzed the association between eRF1 localization and C9-HRE RNA foci, a prototypical pathological marker of C9orf72-associated ALS. We found that C9-ALS patient MNs with RNA foci had a significantly higher eRF1 N/C ratio than MNs without foci (Figure 7A), suggesting that accumulation of eRF1 within invaginations may degrade or inhibit export of the expanded transcript. We next asked whether the absence of eRF1 would affect the number or localization of RNA foci. We found that eRF1 knockdown led to a dramatic reduction of nuclear foci and a concomitant increase in cytosolic foci in C9-ALS MNs (day 50, n=3 patients, n=3 independent biological replicates; siScr vs. siETF1 nuclear foci: p<0.0001; cytosolic foci: p<0.0001) (Figure 7B–C). eRF1 knockdown, which abolishes NMD surveillance, also resulted in a lower N/C ratio for all poly(A) RNA, to levels equal to the ones seen in control MNs (Figure 7D–E). These data suggest that the reported nuclear retention of RNA in C9-ALS MNs (Freibaum et al., 2015), is partly mediated by an eRF1-dependent induction of the NMD pathway.
Figure 7. C9orf72 mRNA is Targeted for Degradation by NMD.
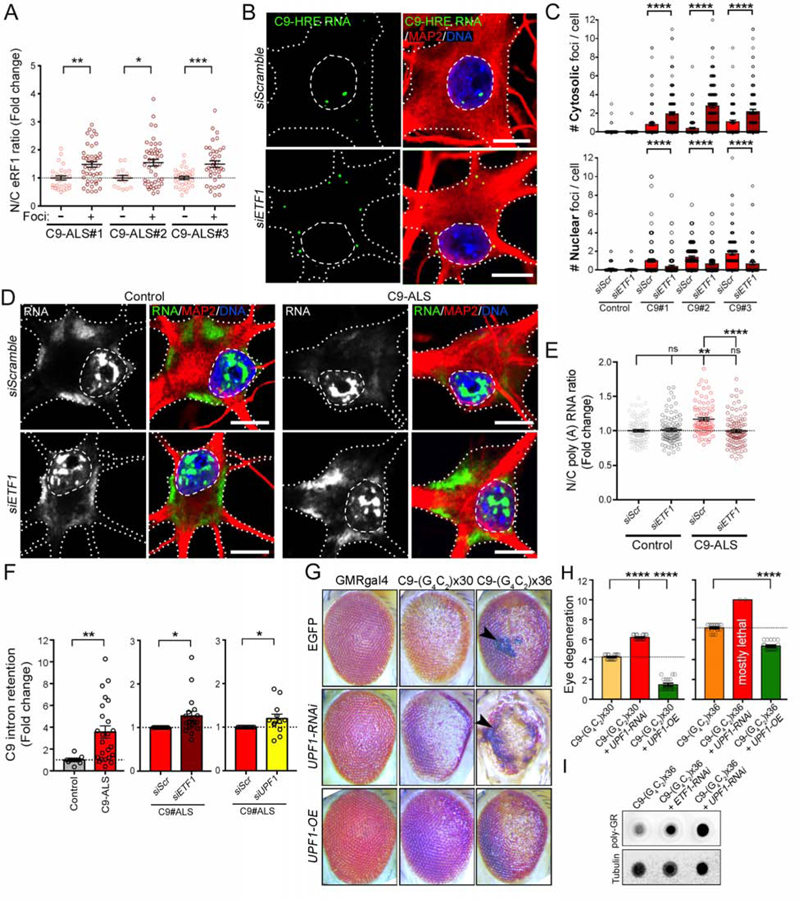
(A) Dot plot displaying the fold change in the N/C ratio of eRF1 signal quantified in C9-ALS MNs with (+) or without (−) C9-HRE RNA foci. n=2 independent differentiations; Mann-Whitney U test; p*<0.05; **<0.01; ***<0.001.
(B) Representative FISH+ICC confocal images of C9-ALS patient MNs transfected with scrambled or ETF1 siRNA and immunolabeled for G4C2 RNA foci (green), MAP2 (red) and DNA (blue). Dashed lines mark the nuclear boundary and dotted lines mark the neuronal soma.
(C) Bar plots showing the number of nuclear (bottom) and cytosolic (top) C9-HRE RNA foci per cell in MNs derived from 1 control and 3 C9-ALS iPSC lines, transfected with scrambled or ETF1 siRNAs. Wilcoxon signed rank.
(D) Representative FISH+ICC confocal images of healthy control and C9-ALS patient MNs transfected with scrambled or ETF1 siRNAs, and immunolabeled for poly(A) RNA (green), MAP2 (red) and DNA (blue). Dashed lines mark the nuclear boundary and dotted lines mark the neuronal soma.
(E) Dot plot showing the N/C ratio of poly(A) RNA in control and C9-ALS MNs transfected with scrambled or ETF1 siRNAs. n=2 independent differentiations; Kruskal-Wallis test, p=ns: not significant; **<0.01, ****<0.0001;.
(F) Left graph: Bar plots showing fold change in the level of C9orf72-intron retention in MN cultures derived from 3 control and 3 C9-ALS iPSC lines as measured by semi-quantitative RT-PCR. Bar plots comparing intron retention in C9-ALS MNs transfected with scrambled (Scr) vs. ETF1 (middle graph) or vs. UPF1 (right graph) siRNAs. Mann-Whitney (left and right graphs), and t test (middle graph).
(G) Representative images of fly eyes from wild-type (GMR-GAL4 x EGFP) or C9-HRE (C9×30 or x36) mutant flies, with endogenous levels (EGFP), knockdown (UPF1-RNAi) or overexpression (UPF1-OE) of UPF1. Arrow heads indicate the presence of necrotic patches.
(H) Bar plots displaying the level of eye degeneration in flies carrying C9-HRE (C9×30 or x36 repeats) with endogenous levels, knockdown (UPF1-RNAi) or overexpression (UPF1-OE) of UPF1. The basal level of eye degeneration in C9×30 or x36 flies is shown in yellow and orange respectively; suppression and enhancement of C9-HRE toxicity is shown in green and red, respectively. Mann-Whitney U test.
(I) Dot blot of poly-GR in C9×36, and C9×36 flies with decreased eRF1 (ETF1-RNAi) or UPF1 (UPF1-RNAi). Tubulin was used as a loading control.
In graphs, empty-filled circles represent individual cells (A, C, E), biological replicates (F) or analyzed flies (H). Bars represent the mean ± SEM, and dotted lines mark the mean levels in control/reference samples. Scale bars: 10 μm.
To directly address the effects of eRF1 on the stability of G4C2 repeat RNA (including the soluble fraction that may not end up in discreet foci), we measured the ratio of mutant to wild type C9 transcript based on intron retention (Figure S7C). We first established that C9-ALS patient MNs exhibited significantly higher intron retention than control MNs (day 50, n=3 patients per group, n=1–8 independent biological replicates; controls vs C9: p=0.0046) (Figures 7F and S7D, F), which was exacerbated upon eRF1 knockdown (n=3 patients, n=6 independent biological replicates; siScr vs. siETF1: p=0.014) (Figures 7F and S7D–F). These results accord with the higher levels of poly-GR upon eRF1 knockdown found in vivo (Figure 3F), as higher cytosolic C9-HRE levels may allow for more DPR translation. Critically, UPF1 reduction, which abolishes NMD also exacerbated intron retention, suggesting that the expanded transcript may be an NMD target (n=3 patients, n=3 independent biological replicates; siScr vs. siUPF1: p=0.011) (Figures 7F and S7D–F).
Finally, to directly assess the significance of NMD and UPF1 in mutant C9orf72 toxicity in vivo, we crossed UPF1 overexpressing and RNAi lines with C9-HRE fly models. In control flies these crosses had minimal effects on eye degeneration (Figures 7G and S7G). UPF1 reduction significantly enhanced eye degeneration in the C9×30 fly model (n=18 flies/genotype, p<0.01), and was overly toxic in the C9×36 fly model, with the majority of flies dying at the pupal stage (Figures 7G–H and S7H). Conversely, UPF1 overexpression significantly ameliorated eye degeneration in both C9-HRE fly models (n=18 flies/genotype, p<0.0001) (Figures 7G–H). In accordance with these effects and a putative UPF1 role in targeting the expanded C9 RNA for NMD degradation, we found that UPF1 reduction led to higher poly-GR levels in vivo, similar to results upon ETF1 knockdown (Figure 7I). In summary, these results indicate that eRF1 mediates an UPF1-dependent degradation of the expanded C9orf72 transcript.
DISCUSSION
The transport of mRNA and proteins between the nucleus and cytoplasm has emerged as a critical pathway in neurodegenerative diseases (Eftekharzadeh et al., 2018; Gasset-Rosa et al., 2017; Grima et al., 2017; Woerner et al., 2016; Zhang et al., 2016). We developed an approach to assess how the C9-HRE affects the subcellular N/C distribution of proteins. We found a small but highly specific redistribution of proteins in C9×58-expressing cells, the majority of which were associated with RNA metabolism and translation. While the proteomic analysis of the N/C distribution of proteins provided new insight, the cellular platform we used was selected to interrogate acute effects of the mutation. It is possible that steady state protein localization changes in neurons chronically exposed to the expansion may be different. Experiments with distinct repeat expansion mutations revealed that they all caused a global shift towards a more cytosolic proteome, yet the identities of the redistributed proteins were different in each case. Future examination of the N/C proteome in distinct neuronal subtypes may elucidate neuron-specific protein localization effects that repeat expansion mutations associated with different neurodegenerative diseases may have.
Our findings strengthen the hypothesis that a major component of mutant C9orf72 toxicity is related to mRNA processing defects. Although the repeat expansion in C9orf72 is by far the largest genetic cause of ALS and FTD (DeJesus-Hernandez et al., 2011; Renton et al., 2011), the extent to which C9 pathophysiological mechanisms are implicated in other ALS cases remains unclear. ALS genetics highlight RNA metabolism as a principle disease mechanism with causal mutations identified in a number of RNA-binding proteins such as TDP-43, FUS, MATR3 and HNRNPA1 (Taylor et al., 2016). Moreover, a number of studies have extensively characterized RNA metabolism defects in ALS (Weskamp and Barmada, 2018). These include RNA instability (Tank et al., 2018) and defective RNA splicing in mutant TDP-43 and FUS models (Lagier-Tourenne et al., 2012; Polymenidou et al., 2011; Reber et al., 2016), as well as within postmortem patient brain samples from C9orf72 and sporadic ALS cases (Prudencio et al., 2015).
We found that C9-ALS patient MNs exhibit NMD hyperactivity in accordance with a recent study, which showed that ALS-causing FUS mutations also lead to NMD hyperactivity (Kamelgarn et al., 2018). The activation may be triggered by the expression of the expanded C9orf72 transcript directly or by broader mRNA processing defects that occur downstream of the mutation (Prudencio et al., 2015). Specifically, sequestration of mRNA metabolism proteins within C9-HRE foci and C9-HRE DPR aggregates (Boeynaems et al., 2017; Hautbergue et al., 2017; Kwon et al., 2014; Lee et al., 2016; Mori et al., 2013b; Xu et al., 2013; Yin et al., 2017), may result in extensive splicing errors that trigger mRNA surveillance pathways including NMD (Zhang et al., 2009).
Our work highlights eRF1 and UPF1 as strong modulators of C9orf72-associated pathophysiology and provides a functional link between the C9-HRE and the NMD pathway. UPF1 has previously been implicated in ALS disease mechanisms related to FUS and TDP-43 toxicity (Armakola et al., 2012; Barmada et al., 2015; Jackson et al., 2015; Ju et al., 2011). It was reported to mediate the suppressive effects of DBR1 on TDP-43 toxicity in yeast (Armakola et al., 2012), while its overexpression was beneficial for mutant TDP-43 and FUS rodent neurons in vitro (Barmada et al., 2015; Ju et al., 2011), as well as in a rat model of TDP-43 toxicity in vivo (Jackson et al., 2015). More recently, Xu et al., reported that poly-GR/PR inhibit NMD, and in accordance with our findings, that UPF1 overexpression or pharmacological NMD activation suppressed DPR toxicity (Xu et al., 2019).
The canonical site of NMD has been a subject of debate (Kurosaki and Maquat, 2016), with most models suggesting that it occurs in the cytoplasm near the nuclear membrane and immediately upon mRNA export (Belgrader et al., 1994; Trcek et al., 2013). Our findings suggest that, at least in MNs, NMD can occur within nuclear envelope invaginations, which contain ER proteins, eRF1, pUPF1, and are sites of active translation. Tubular invaginations of the nuclear envelope have been reported in a wide range of cell types, and are prominent in dividing cells and cancer tissue (Malhas et al., 2011). While the mechanistic relevance of these protrusions remains unclear, they have been associated with DNA repair (Legartova et al., 2014) and mRNA transport (Schoen et al., 2017). These invaginations are not exclusive to C9-ALS patient MNs, nor do they represent an in vitro artifact. We propose that they serve to extend cytosolic function related to RNA metabolism and translation in closer proximity to the nucleus, perhaps to increase the efficiency of these critical cellular processes by shortening the distance between the nucleus and cytosol, or by increasing the N/C interaction area. This functional role would be particularly relevant to postmitotic neurons, which may heavily rely on the ability to rapidly and dynamically regulate RNA metabolism and compartmentalized protein translation. Future investigations will need to address what these invaginations contain, their functional relevance, and if they truly represent a beneficial neuronal response or a pathological consequence of aging and disease.
The accumulation of eRF1 and pUPF1 within nuclear envelope invaginations suggest a model where NMD safeguards neurons from toxic RNA molecules, such as the expanded C9orf72, by inhibiting transcript export from the nucleus and the ensuing cytosolic translation into toxic C9-DPRs, through an as yet undefined mechanism. The potential therapeutic relevance of this model could be explored either through small molecules that would activate NMD, or directly through gene therapy approaches. The cytosolic accumulation of TDP-43 as well as erroneous mRNA metabolism is a unifying pathological feature amongst ALS patients (Tank et al., 2018; Taylor et al., 2016), suggesting that the NMD pathway and its regulatory elements may represent a therapeutic approach that could be broadly relevant for ALS and FTD.
STAR METHODS
LEAD CONTACT AND MATERIALS AVAILABILITY
Further information and requests should be directed to and will be fulfilled by the Lead Contact, Evangelos Kiskinis (evangelos.kiskinis@northwestern.edu).
All unique/stable reagents generated in this study are available from the Lead Contact with a completed Materials Transfer Agreement.
EXPERIMENTAL MODEL AND SUBJECT DETAILS
Cell culture conditions
HEK-293FT cells were grown in DMEM (Corning) supplemented with Glutamax (Gibco) and 10% fetal bovine serum (FBS, Gibco). HEK-293FT cells were dissociated by incubating for 5 min with Trypsin-EDTA (Gibco) at 37°C. Stem cells were maintained on Matrigel (BD Biosciences) with mTeSR1 media (Stem Cell Technologies) and passaged on a weekly basis using 1mM EDTA or Accutase (Sigma). All cell cultures were maintained at 37°C, 5% CO 2 without antibiotics and tested on a monthly basis for mycoplasma. All cell lines utilized in the study were mycoplasma-free.
Stem cell cultures and motor neuron differentiation
iPSCs were dissociated with Accutase and plated with mTESR1 and 10μM ROCK inhibitor (Y-27632, DNSK International) at a density of 100,000 cells/cm2. The next day, media was replaced with N2B27 medium (50% DMEM:F12, 50% Neurobasal, supplemented with NEAA, Glutamax, N2 and B27; Gibco) supplemented with a cocktail of small molecules that induces the generation of spinal neural progenitors: 10μM SB431542 (DNSK International), 100nM LDN-193189 (DNSK International), 1μM Retinoic Acid (RA, Sigma) and 1μM of Smoothened-Agonist (SAG, DNSK International). Culture medium was changed daily for 6 days and then was switched to N2B27 medium supplemented with 1μM RA, 1μM SAG, 5μM DAPT (DNSK International) and 4μM SU5402 (DNSK International) to generate postmitotic spinal MNs. Cultures were fed daily with this media for seven days and then dissociated using TrypLE Express (Gibco) supplemented with DNase I (Worthington). Neurons were plated onto culture dishes precoated with Matrigel (BD Biosciences) and fed every 2 days with Neurobasal medium supplemented with NEAA, Glutamax, N2, B27, Ascorbic acid (0.2μg/ml) and BDNF, CNTF and GDNF (10ng/mL, R&D systems). For imaging analysis, MNs were seeded on preplated mouse glia monolayers.
METHOD DETAILS
Overexpression and knockdown experiments in vitro
For overexpression experiments, 40% confluent HEK-293 cells were transfected with HilyMax transfection reagent (Dojindo Molecular Technologies) according to manufacturer guidelines. Briefly, DNA was mixed with HilyMax (1μg DNA:3μL HilyMax ratio) in Opti-MEM medium (Gibco) and incubated for 15 min at room temperature (RT) before being added to cells. Cells were incubated with transfection mixture for 4hrs at 37°C and then media was replaced. Analyses made on transfected cells were performed 48 to 72hrs after transfection. For transient knockdown experiments, pre-designed siRNAs (Ambion Silencer Select) were transfected using Lipofectamine RNAiMAX (Invitrogen) according to manufacturer guidelines. Briefly, for 2 wells of a 24-well plate with 0.5–2 × 10⁵ cells/well, 10pmol of siRNA was mixed with 3μL of Lipofectamine RNAiMAX reagent in 100μL Opti-MEM medium and incubated for 15 min at RT. 400μL of cell culture medium was added and 250μL was distributed per well. Analyses of siRNA transfection experiments were performed 3–4 days after transfection. For lentiviral transductions, iPSC-derived MNs were infected with a previously tittered viral burden for 48hrs, changing the media and adding fresh virus 24hrs after the initial infection. Transduced cells were analyzed 10–14 days after infection.
Plasmids
For Mass Spectrometry experiments, HEK-293 cells were transfected with the following DNA constructs: pcDNA3.1 plasmids containing GFP or (G4C2)x58-GFP provided by J. Paul Taylor’s lab; pEGFP plasmids containing HTT exon1 with (CAA CAGCAGCAACAGCAA)n repeats amounting to either 25Q or 72Q repeats provided by Dimitri Krainc’s lab; pLEX plasmids containing Atx1–32Q or Atx1–84Q provided by Puneet Opal’s lab. The pcDNA3.1 plasmids containing GFP, (GA)x50-, (GR)x50-, (PA)x50-, or (PR)x50-GFP, in which alternative codons were used to generate dipeptide repeat proteins without generating the (GGGGCC)n transcript were originally made by Davide Trotti (Wen et al., 2014) and modified by Christopher Donnelly. We also used this plasmid to subclone the GFP and (GR)x50-GFP sequences into a lentiviral vector (CD510B) for MN transductions. The pLenti-c-Myc-DDK plasmid containing NLS-tdTomato-NES was provided by Jeffrey Rothstein (Zhang et al., 2015). The pBS-TCR(PTC)-TCR(WT) NMD reporter plasmid was provided by Zhongsheng You (Nickless et al., 2014).
Flow cytometry and nucleocytoplasmic fractionation
Cell cultures were dissociated with trypsin and resuspended in media containing DMEM without phenol red (Gibco) and 2% FBS before flow cytometry cell sorting on a BD FacsAria SORP 6-Laser instrument. Cells were collected in PBS supplemented with protease inhibitors (Millipore). Cell suspensions were immediately spun down and subcellular fractionation was performed using NE-PER nuclear and cytoplasmic extraction reagents (Thermo Scientific). Briefly, cells were harvested using a hypertonic detergent solution that disrupted plasma membranes, leaving nuclear membranes intact. This lysate was spun down and supernatant was collected as the cytosolic protein fraction. Nuclear proteins were isolated from the remaining pellet using high salt extraction buffer. The obtained nuclear and cytosolic fractions were used for Western blot and mass spectrometry analysis.
Liquid Chromatography Mass Spectrometry (LC-MS/MS)
Nuclear and cytosolic extracts were subjected to methanol and chloroform precipitation. The precipitated protein pellets were solubilized first in 100μl of 8M urea for 30min, and next in 100μl of 0.2% ProteaseMAX (Promega) for 2hrs. The protein extracts were reduced and alkylated as described previously (Chen et al., 2008), followed by the addition of 300μl of 50mM ammonium bicarbonate, 5μl of 1% ProteaseMAX, and 20μg of sequence-grade trypsin (Promega). Samples were digested overnight in a 37°C thermomixer (Eppendorf). We used 3μg of peptides in each Orbitrap Fusion MS analysis.
For Orbitrap Fusion Tribrid MS analysis, the tryptic peptides were purified with Pierce C18 spin columns and fractionated with two ACN concentrations (30% and 70%). Three micrograms of each fraction were auto-sampler loaded with a Thermo Fisher EASY nLC 1000 UPLC pump onto a vented Acclaim Pepmap 100, 75μm x 2 cm, nanoViper trap column coupled to a nanoViper analytical column (Thermo Fisher 164570, 3μm, 100Å, C18, 0.075mm, 500mm) with stainless steel emitter tip assembled on the Nanospray Flex Ion Source with a spray voltage of 2000 V. Buffer A contained 94.785% H2O with 5% ACN and 0.125% FA, and buffer B contained 99.875% ACN with 0.125% FA. The chromatographic run was for 4hrs in total with the following profile: 0–7% for 7min, 10% for 6min, 25% for 160min, 33% for 40min, 50% for 7, 95% for 5min, and 95% again for 15min, respectively. Additional MS parameters include: ion transfer tube temp 300°C, easy-IC internal mass calibration, default charge state = 2 and cycle time = 3s. Detector type set to Orbitrap, with 60K resolution, with wide quad isolation, mass range normal, scan range = 300–1500m/z, max injection time = 50ms, AGC target = 200,000, microscans = 1, S-lens RF level = 60, without source fragmentation, and datatype = positive and centroid. MIPS was set as on, included charge states = 2–6 (reject unassigned). Dynamic exclusion enabled with n =1 for 30 and 45s exclusion duration at 10ppm for high and low. Precursor selection decision = most intense, top 20, isolation window = 1.6, scan range = auto normal, first mass = 110, collision energy 30%, CID, Detector type = ion trap, Orbitrap resolution = 30K, IT scan rate = rapid, max injection time = 75ms, AGC target = 10,000, Q = 0.25, inject ions for all available parallelizable time.
Tandem mass spectra analysis
Samples of 4 independent biological replicates, which included both nuclear and cytosolic fractions of each of the 3 transfected conditions (GFP, 8 and 58 x G4C2), were analyzed independently by LC-MS/MS. The spectral files from all replicates were pooled for a single database search. Spectrum raw files were extracted into MS1 and MS2 files using in-house program RawXtractor or RawConverter (http://fields.scripps.edu/downloads.php) (He et al., 2015). The tandem mass spectra were searched against UniProt human protein database (downloaded on 12–19-2015; UniProt Consortium, 2015) and matched to sequences using the ProLuCID/SEQUEST algorithm (ProLuCID version 3.1;(Eng et al., 1994; Xu et al., 2006)) with 50ppm peptide mass tolerance for precursor ions and 600ppm for fragment ions. The search space included all fully and half-tryptic peptide candidates that fell within the mass tolerance window with no miscleavage constraint, assembled, and filtered with DTASelect2 (version 2.1.3) (Cociorva et al., 2007; Tabb et al., 2002) through Integrated Proteomics Pipeline IP2 version 3, Integrated Proteomics Applications (http://www.integratedproteomics.com). In order to estimate peptide probabilities and false-discovery rates (FDR) accurately, we used a target/decoy database containing the reversed sequences of all the proteins appended to the target database (Peng et al., 2003). Each protein identified was required to have a minimum of one peptide of minimal length of six amino acid residues; however, this peptide had to be an excellent match with an FDR = 0.001 and at least one excellent peptide match. After the peptide/spectrum matches were filtered, we estimated that the protein FDRs were = 1% for each sample analysis. Resulting protein lists include subset proteins to allow for consideration of all possible protein forms implicated by a given peptide identified from the complex IE protein mixtures. Each protein identified with the IP2 pipeline was associated with several different measures of abundance used in our analyses, including: peptide counts, spectral counts, and normalized spectral abundance factor (NSAF) (Zybailov et al., 2006), which considers protein length and number of proteins identified in the experiment. When comparing ratios and abundances of a given protein across samples, we used NSAF rank rather than abundance to minimize the effects of differences in sample sizes and stochastic differences between MS analyses.
To estimate the number of proteins detected in every experimental condition, we assessed the number of protein entries that displayed detectable NSAF values in the cytosolic, the nuclear or in both subcellular fractions.
To calculate the cytosolic or nuclear ratio of the detected proteins in the different samples, we applied the following equation:
Or
To assess the purity of the subcellular fractionation method utilized in this study, we calculated the cytosolic and nuclear ratio values of bona fide nuclear and cytosolic markers in GFP control cells, that were plotted as displayed in Figure 1C. To assess proteomic changes among the multiple transfected conditions tested in this study, we calculated the average ratio (± SD) of both nuclear and cytosolic fractions of every detected protein obtained from 3–4 independent experimental replicates (see Table S1). Obtained results were plotted in violin plots to graphically show the subcellular proteome distribution among the different experimental conditions (Figures 1E, G). We alternatively calculated subcellular ratios utilizing emPAI (exponentially modified protein abundance index) values, which represents the number of observed peptides divided by the number of observable peptides per protein (Figure S1L). Similar results were obtained with both relative abundance factors (NSAF and emPAI).
The comparison between the changes elicited by the expression of C9×58-GFP relative to the ones elicited by the expression of the two control conditions (GFP and C9×8-GFP) was carried out in consultation with the statistics core facility at Northwestern University. We first calculated the average (± SD) of the cytosolic ratio for every detected protein obtained from 4 independent experimental replicates (see Table S1). As shown above, and in Figure 1A, the cytosolic ratio is calculated as the abundance (NSAF) in the cytosolic fraction over the total abundance in both the cytosolic and nuclear fractions. Thus, all values fall between 0–1 and exhibit a non-normal distribution. We compared the cytosolic ratio value for each protein in the (G4C2)x58-expressing cells versus the corresponding value in both control conditions to calculate the magnitude of the shift in the localization for each protein (∆, delta). In order to ascertain biological significance to these changes and in accordance with other proteome-wide MS-based experiments (Albaum et al., 2011; Fukuda et al., 2017; Poliakov et al., 2011; Tarasova et al., 2017; Zhang et al., 2019), we performed comprehensive non-parametric statistical testing (Kruskal -Wallis rank test, p value < 0.05), commonly used for datasets that do not exhibit a normal distribution. The volcano plot presented in Figure 2A represents two metrics, i.e. -log10 p-value on the y-axis and magnitude of the shift (∆, delta) on the x-axis, of the changes observed in (G4C2)x58-expressing cells relative to controls.
Additionally, we considered both of these metrics, as well as broader biological context, to select candidate proteins for further investigation as illustrated in Figure 3A, where we represented the cytosolic (x-axis) and nuclear (y-axis) ratio differences of the proteins that show significant N/C ratio changes (Kruskal -Wallis rank test, p value < 0.05), between (G4C2)x58-expressing cells and the two control conditions,.
Gene Ontology (GO) analysis was performed using the online tools STRING, PANTHER and DAVID. The COMPARTMENTS (https://compartments.jensenlab.org/) tool was utilized to characterize the normal protein localization patterns of the N/C perturbed proteins and assess the physiological relevance of the observed changes. Bioinformatics & Evolutionary Genomics (http://ioVe//bioinformatics.psb.ugent.be/webtools/Venn/) and BioVenn, are web applications utilized for the comparison and visualization of biological lists using area-proportional Venn diagrams (Hulsen et al., 2008). NLS sequences detection in the proteins of interest was performed with cNLS Mapper (http://nls-mapper.iab.keio.ac.jp/cgi-bin/NLS_Mapper_form.cgi) and NES sequences with NetNES 1.1 Server (http://www.cbs.dtu.dk/services/NetNES/). To identify NLS and NES sequence motifs in large proteomic datasets, we utilized the NLSdb database (https://rostlab.org/services/nlsdb/).
Cell viability analysis
Three different approaches were utilized to assess cell viability in HEK-293 cells transfected with GFP, C9×8-GFP and C9×58-GFP. Firstly, Propidium Iodide (PI) incorporation by apoptotic cells was measured in cells 48hrs after transfection. Cells were dissociated with trypsin, resuspended in DMEM without phenol red (Gibco) + 2% FBS. PI (5μg/ml) was added to the cell suspension right before flow cytometry analysis on BD LSR Fortessa. Secondly, GFP, C9×8-GFP and C9×58-GFP-transfected cells were pulsed with PI for 30min and imaged in a Leica DMi8 microscope to detect double GFP+PI+ cells. Double labeled cells were counted with Fiji software. Thirdly, a colorimetric MTT assay with cells exposed to 3-(4,5-dimethylthiazol-2-yl)-2,5-diphenyltetrazolium bromide (MTT, 0.5mg/ml), which is reduced to formazan (purple) depending on cellular NAPDH activity. Formazan levels were measured by a Synergy HTX Multi-Mode Reader (BioTek) at 500–600nm.
Western blot and dot blot analysis
Cells were harvested in RIPA buffer (10mM Tris-HCl pH 8.0, 140mM NaCl, 1mM EDTA, 0.1% SDS), supplemented with 1% Triton X-100 (Triton, Sigma Aldrich), 1mM phenylmethylsulphonyl fluoride (DOT Scientific), and protease inhibitors (Millipore). For western blot analysis lysates were sonicated and protein extracts were separated by SDS-PAGE followed by electrotransfer to a nitrocellulose membrane (Bio-Rad). For dot-blot analysis, 5–10μg of protein was loaded through a 96-well Acrylic Dot-Blot System (Whatman, GE Healthcare Life Sciences) directly onto a nitrocellulose membrane. The membranes were blocked in Tris-buffered saline (TBS, 50mM Tris, 150mM NaCl, HCl to pH 7.6)) + 0.1% Tween 20 (Bio-Rad) + 5% non-fat dry milk (Labscientific) and then incubated overnight at 4°C with primary antibodies: ATF4 (rabbit, 1:500, Cell Signaling Technology), α-tubulin (mouse, 1:5000, Santa Cruz Biotechnology), eRF1 (mouse, 1:500, Santa Cruz), GAPDH (rabbit, 1:1000, Cell Signaling), GFP (goat, 1:1000, Abcam), poly-GP (mouse, 1:1000, generous gift from Tania Gendron), poly-GR (rat, 1:2000, Millipore), GRP78/BiP (mouse, 1:500, Santa Cruz Biotechnology), eIF2α (rabbit, 1:1000, Cell Signaling Technology), Phospho-eIF2α (Ser51; rabbit, 1:1000, Cell Signaling Technology), LAMIN A/C (mouse, 1:10000, generously provided by Robert Goldman’s lab), LMNB1 (rabbit, 1:1000, Proteintech), SMG1 (mouse, 1:500, Santa Cruz Biotechnology), TAFII p130 (mouse, 1:1000, Santa Cruz Biotechnology), VINCULIN (mouse, 1:500, Sigma-Aldrich). Primary antibodies were diluted in TBS + 0.1% Tween + 5% BSA (Calbiochem). After several washes in TBS + 0.1% Tween, membranes were incubated with their corresponding secondary HRP-conjugated antibodies (1:5000, LI-COR Biotechnology). Protein signals were detected by a ChemiDoc™ XRS+ (Bio-Rad), using the SuperSignal West Pico chemiluminescent system (Thermo Scientific). Densitometry analysis for the bands was performed using Fiji software (ImageJ, NIH Image).
Drosophila stocks, maintenance and phenotyping
To identify genetic modifiers of C9-HRE toxicity, Drosophila melanogaster lines expressing RNAi for homologues of specific targets were obtained from the Vienna Drosophila Resource Center (eRF1, stock no # 33569, SF2 # 27775, Art1 # 110391; e(y)2 # 108212, Tnpo-SR #40991, CCT8 # 103905) or Bloomington Drosophila Stock Center (Upf1 # 64519) and crossed with a C9ORF72–UAS-(G4C2)x3 and C9ORF72–UAS-(G4C2)x30 lines, which were a kind gift from Dr Peng Jin, or a C9ORF72-UAS-(G4C2)x36 line (Bloomington Drosophila Stock Center). Human eRF1 (hETF1) cDNA was cloned in the pUAST-attb vector by using the VectorBuilder platform. The injection and the generation of transgenic flies was done by Best gene Drosophila Embryo Injection Services by using the site-specific integration of transgene with purified pUAST-attb-hETF1 vector. The UPF1 OE (stock number#33539) and RNAi lines (stock number#64519) were obtained from Bloomington stock center. Drosophila stocks utilized in this study were maintained on standard cornmeal medium at 25°C or 18°C in light/dark-controlled incubators. External eye degeneration was used as a screening endpoint as described previously (Lanson et al., 2011; Pandey et al., 2007). Briefly, the following parameters were scored as 0 if normal or 1 if abnormal: level of discoloration, ommatidial disorganization, absence of hairs, presence of necrotic tissue, level of development, shape, and contour. The sum of the scores defined the level of eye degeneration. All data was collected and scored in a blinded manner.
The Rapid Iterative Negative Geotaxis (RING) was performed as described in (Nichols et al., 2012). Briefly, RNAi flies with or without C9-HRE expression in neurons (ELAV-gene switch) were placed into polystyrene vials within the RING apparatus, wherein flies can be pulled to the bottom of vials and climbing movement recorded. Movement was recorded using an iPhone 8 camera, climbing velocity per fly was calculated.
Eye sectioning and imaging protocol
Heads of adult female flies (4-day old) were fixed in the Davidson’s fixative, paraffin embedded and sectioned for internal retinal morphology (Goodman et al., 2019). The retinal sectioning and H&E staining were done by Excalibur pathology inc. Images were taken in bright field at 20x in a Leica microscope.
Drosophila dot blot, Western blot and RT-qPCR analysis
Dot blot was performed as described previously (Mizielinska et al., 2014) with some modifications. Briefly, 4-day old flies were heat-shocked for 1.5 hours at 37°C, snap-frozen and homogenized in RIPA buffer (3μl per fly head) with complete protease inhibitors cocktail (Roche). After adding 6x Laemmli sample buffer (0.5μl per head), the lysate was heated to 95°C for 5min and 2 μl of the samples was blotted onto a dry nitrocellulose membrane. The blot was left to dry for 15 minutes at room temperature and blocked for 1h in 5% BLOT-QuickBlocker reagent in TBS + 0.05% Tween-20 (TBS-T). The membrane was probed with rabbit anti-poly-GR antibody (1:2000 in TBS-T), or mouse anti-tubulin antibody (1:10,000) overnight at 4°C. The following day, the membrane was washed twice with TBS-T and incubated in secondary antibody (anti-rabbit IRDye 800 and anti-mouse IRDye 680D, LICOR, 1: 10,000) for 1h and imaged on Licor imager (Odyssey CLx).
For the eRF1 WB, three adult fly heads were collected from each cross and crushed on dry ice. The granulated heads were incubated in lysis buffer containing 150mM NaCl, 0.1% SDS, 1% NP40, 50mM NaF, 2mM EDTA, 1% sodium deoxycholate, 1mM DTT, 0.2mM sodium orthovandate and protease inhibitor (Roche) for 10min. The lysate was sonicated, centrifuged at 10000xg for 10min and boiled at 95°C for 5min in laemmli buffer. Proteins were separated in a 4–12% NuPAGE gel (Novex/Life technologies) and transferred to a nitrocellulose membrane (Invitrogen). The blot was blocked in 2.5% milk in TBS-T and probed with anti-eRF1 (Santa Cruz Biotechnology) and β-actin (Cell signaling) antibodies overnight at 4°C. The blot was washed in 0.1% TBS-T and incubated with Alexa Flour-tagged secondary for 1h. The blot was imaged in an Odyssey CLx (Li-COR Biosciences).
For RT-qPCR analysis RNA was extracted from fly heads in triplicate (3 heads per replicate) using Trizol (Ambion) and 1-Bromo-3-chloropropane (SIGMA) extraction (Jensen et al., 2013). RNA samples were cleaned using DNA-free kit (Invitrogen) and quantified using a NanoDrop ND-1000 spectrophotometer. cDNA was synthesized from 0.4μg of DNase-free RNA by using the iScript Select cDNA Synthesis Kit (BioRad). qPCR was performed on an Applied Biosystems, 7300 Real Time PCR System by using the iQ Supermix (BioRad) and α-tubulin was used as a normalizing control. The comparative Ct method was used for analyzing the results, as previously described (Schmittgen and Livak, 2008), using GraphPad Prism 6 software for statistical analyses.
Primers used for qPCR:
| Gene (Drosophila) | Direction | Sequence (5’ to 3’) |
|---|---|---|
| TUBULIN | Forward | TTTGAGACCTTCAACACCCCAGCC CCTCGAAATCGTAGCTCTACAC |
| Reverse | AATGTCACGCACGATTTCCCGC ACCAAGCCTGACCAACATG |
|
| ETF1 (eRF1) | Forward | CTCTACCTCTGCGACAACAAG |
| Reverse | AATAGCGCTCCGTTACCATC | |
| SRSF1 (SF2) | Forward | CGGACACTTACAAGGATGGTTC |
| Reverse | ATCGGAAGCGAGAGTCGT | |
| PRMT1 (Art1) | Forward | CTCGTCCAAGTTCAGCCTATG |
| Reverse | AAGACGCTTGTGGCACTT | |
| ENY2 (e(y)2) | Forward | GCGACCGTTCCAAGATCAA |
| Reverse | CTCTACGGTGAAGCTGTTGTT | |
| CCT8 | Forward | CAGGTGTCAAGGTGGTTGT |
| Reverse | CGGCCATCAGACCGTATTT | |
| TNPO3 (Tnpo-SR) | Forward | GCACACGCACGAATCTCT |
| Reverse | ACTGAGCTGCGTCACAATC | |
| UPF1 (Upf1) | Forward | AACATGCCAGTTCCGGTT |
| Reverse | CTGCTGGTGCTGGTTGTA |
ELISA
Protein was isolated in the same manner as above. Polyclonal anti-GP capture and detection antibodies in conjunction with Meso Scale Discovery (MSD) electrochemiluminescence detection were used as previously described (Su et al., 2014).
RNA preparation and RT-qPCR analysis
RNA was isolated using RNeasy Mini Kit (Qiagen). Briefly, cells were harvested in lysis buffer and gDNA was removed by passing the lysate through a gDNA eliminator column. RNA was then isolated according to manufacturer guidelines and 0.5 to 1μg of RNA was used to generate cDNA using iSCRIPT Reverse Transcription Supermix (Bio-Rad). Real-time qPCR reactions were prepared according to manufacturer guidelines for iTaq Universal SYBR Green Supermix (Bio-Rad) on the CFX system (Bio-Rad). All qPCR assays were performed in triplicate. The average cycle of threshold (Ct) value of two housekeeping genes (ACTIN/GAPDH) was subtracted from the Ct value of the gene of interest to obtain the ∆Ct. Relative gene expression was determined as 2−∆Ct (∆∆Ct) and expressed relative to the control sample or the highest expressed sample in the experiment.
Primers used for qPCR:
| Gene | Direction | Sequence (5’ to 3’) |
|---|---|---|
| ACTIN | Forward | TTTGAGACCTTCAACACCCCAGCC |
| Reverse | AATGTCACGCACGATTTCCCGC | |
| GAPDH | Forward | AGGTCGGTGTGAACGGATTTG |
| Reverse | TGTAGACCATGTAGTTGAGGTCA | |
| ETF1 | Forward | GGAAATCTACTCGGTACCGCA |
| Reverse | AGCTTATCGAGAGCATGCCC | |
| UPF1 | Forward | CCCTCCAGAATGGTGTCACT |
| Reverse | CTTCAGCAACTTCGTGGTGA | |
| CBG (Normal) | Forward | ATGCTCTCGATCCACGCGTG |
| Reverse | TCCATGCTTTCGGCTTTCAT | |
| CBR (PTC) | Forward | TCCATGCTTTCGGCTTTCAT |
| Reverse | CGAGAGTCTGGATAATCGCA | |
| C9orf72 (intron retention) | Forward | GGTGCGTCAAACAGCGACAAGTTC (exon 1a) |
| Reverse | GTCCATATGTGCTGCGATCC (exon 2) | |
| Reverse | GCTACAGGCTGCGGTTGTTTCC (intron 1–5’ss) |
Immunocytochemistry
Cells were fixed with 4% paraformaldehyde for 20min, washed with PBS and permeabilized/blocked for 1h in PBS containing 10% normal donkey serum (Jackson ImmunoResearch) and 0.2% Triton. Samples were then incubated overnight at 4°C with primary antibodies: eRF1 (mouse, 1:100, Santa Cruz Biotechnology), GFP (goat, 1:500, Abcam), LAMIN-B1 (rabbit, 1:500, Proteintech), MAP2 (chicken, 1:5000, Abcam), pUPF1-Ser1127 (rabbit, 1:500, Millipore), UPF1 (RENT1, mouse, 1:200, Santa Cruz Biotechnology), ISLET1/2 (mouse, 1:200, DHSB), Puromycin (mouse, 1:10000, Millipore). Next day, PBS + 0.1% Triton was applied for several washes. Samples were then incubated with the appropriate secondary antibodies conjugated to Alexa488, Alexa555 or Alexa647 fluorophores (1:500 to 1:1000 Molecular Probes) for 1h at RT. Cell nuclei were labeled by DNA staining using Hoechst (Life Technologies). Immunolabeled samples were blinded upon mounting for subsequent imaging.
Expansion microscopy
Expansion microscopy was performed as previously described (Asano et al., 2018) with minor modifications. In brief, cells were cultured on 12mm coverslips, fixed in 4% PFA, and permeabilized/blocked for 1h in PBS containing 10% NDS and 0.2% Triton. Samples were then incubated overnight at 4°C with primary antibodies: eRF1 (mouse, 1:50, Santa Cruz Biotechnology), LAMIN-B1 (rabbit, 1:100, Proteintech), KDEL (mouse, 1:50, Enzo Life Sciences), KDEL (rabbit, 1:100, Abcam), pUPF1-Ser1127 (rabbit, 1:100, Millipore), Puromycin (mouse, 1:100, Millipore). Next, coverslips were washed with PBS + 0.1% Triton 3 times for 5 min, and then incubated with the appropriate secondary antibodies conjugated to Alexa488, Alexa555 or Alexa647 fluorophores (1:250 Molecular Probes) for 1h at RT. Secondary antibody was removed and PBS + 0.1% Triton was applied 3 times for 5min. Samples were incubated with Hoechst (1:100, Life Technologies) for 10min. Samples were washed with PBS + 10% NDS 3 times for 5min.
Next, samples were incubated in 0.1mg/mL Acryloyl-X, SE (Life Technologies) overnight at RT. Samples were washed with PBS 2 times for 15min. For gelation, perfusion chamber gasket (Invitrogen) was applied to glass slide, and one 12mm coverslip sample was placed on slide inside gasket; 8μL TEMED (Thermo Scientific) and 8μL Ammonium persulfate (Thermo Scientific) were added to 376μL monomer solution (consisting of 9.1% sodium acrylate (Sigma), 2.66% acrylamide (Sigma), 0.16% N,N’-Methylenebis(acrylamide) (Sigma Aldrich), 2.13M NaCl (Ambion), and PBS 1x (Ambion)) and immediately applied to cells. Parafilm-coated glass slide was pressed firmly on gasket. This was repeated for each sample and each gelation assembly was incubated at 37°C for 1h. For digestion, parafilm-coated slide was gently removed, ExM digestion buffer (consisting of 50mM Tris pH 8 (Ambion), 1mM EDTA (Ambion), 0.5% Triton, 800mM Guanidine HCl (Sigma Aldrich), 1% Proteinase K (Qiagen), and PBS 1x) was applied to each sample, and cells incubated for 6hrs at RT. Next, a gel knife was used to transfer each gel into a 100mm petri dish. Water was added to each dish and fresh water was added every hour for 5hrs. Using a gel knife, each gel was divided into 35mm glass-bottom dishes (MatTek). Low-melt agarose (2%, Sigma Aldrich) was applied to immobilize gel on a dish. Images were acquired using a Nikon Plan Apo IR 60x NA 1.27 water immersion objective at matched laser settings and images generated for comparison were processed using identical settings.
Immunohistochemistry
Postmortem tissue samples from three ALS patients and three non-neurological controls were obtained through the Northwestern University ALS Clinic and examined by immunohistochemistry. Immunohistochemistry was performed using previously described methods (Deng et al., 2011). Briefly, 6μm sections were cut from formalin- fixed, paraffin-embedded brain regions containing motor cortex. Sections were deparaffinized and rehydrated by passing slides in serial solutions: 3 times for 10min each in xylene, 3 times for 5min each in 100% ethanol, 3 times for 3min each in 95% ethanol, once for 5min each in 75% ethanol, 50% ethanol, deionized water, and PBS. Antigen retrieval was performed using a decloaking chamber with a 1X Antigen Decloaker solution (Biocare Medical) at 125°C for 1 0min. Sections were cooled to room temperature for 30min and rinsed with deionized water. Nonspecific background was blocked with 1% BSA in PBS for 20min at RT. Slides were incubated overnight at 4°C with primary antibodies, rinsed 3 times for 5min with PBS, and then appropriate secondary antibodies conjugated to Alexa488, Alexa555 or Alexa647 fluorophores (1:250, Molecular Probes) diluted in PBS, were applied to slides and incubated at room temperature for 45min. Slides were rinsed 3 times for 5min. To diminish autofluorescence, 0.3% sudan black in 70% ethanol was applied to each section for 45sec, and rinsed in deionized water for 5min. Slides were mounted in ProLong Diamond Antifade Mountant with DAPI (Thermo Scientific) and labels were blinded for subsequent image analysis.
| Genotype | Gender | Age |
|---|---|---|
| Non-neurological control | Female | 70 |
| Non-neurological control | Female | 76 |
| Non-neurological control | Male | 69 |
| C9-HRE | Female | 69 |
| C9-HRE | Female | 66 |
| C9-HRE | Male | 58 |
De novo protein translation analysis
For single-cell protein translation analysis, we utilized the Click-iT HPG protein synthesis kit (Invitrogen). HPG (L-homopropargylglycine, 25μM) is a methionine analog with an alkyne moiety that is incorporated into newly synthesized proteins. Cells were pulsed for 3h with 25μM HPG in Methionine free DMEM (Gibco) and incorporated HPG was detected by Click chemistry following manufacturer guidelines. In short, cells were fixed in 4% PFA for 15min, washed twice with PBS + 0.25% Triton and blocked with PBS + 3% BSA for 1h at RT. Cells were incubated with primary antibodies (ISL1/2, MAP2) overnight at 4°C, then washed with PBS three times, and incubated with the appropriate secondary antibodies. Cells were washed with PBS + 0.25% triton twice and blocked with PBS + 3% BSA for 30min. Next, the click reaction for detection of HPG incorporation was performed, based on a reaction between an azide and alkyne, wherein the alkyne-modified protein is detected with Alexa Fluor® 594 azide. ISRIB (Sigma Aldrich) treatment (2μM) was applied for 5 days in iPSC-derived MNs to assess the potential effect of the ISR in protein translation.
Alternatively, a puromycin-based method termed SUnSET (Schmidt et al., 2009), was used to label newly synthesized proteins. Cell cultures were pulsed for 5–10min with Puromycin (20μM) at 37°C. Cells were then fixed and ICC was carri ed out as described above utilizing anti-puromycin primary antibody (Millipore).
Fluorescent in situ hybridization (FISH)
FISH analysis was performed as previously described (Donnelly et al., 2013). Briefly, cells were cultured on 12mm coverslips in 24 well plates, fixed in 4% PFA, and permeabilized in 0.3% Triton for 15min. Before hybridization, cells equilibrated in 2X SSC + 50% formamide for 10min at 60°C and probe mix ture was preheated for 10min at 95°C. For hybridization, 200 μL of hybridization buffer and 27μL of probe mixture were added to each coverslip and cells were incubated for 1h at 60°C. Following hybridization, cells were incubated with 2X SSC + 50% formamide for 20min at 65°C, then again with fresh 2X SSC/50% formamide for 15min at 65°C, and finally with 1X SSC + 40% formamide for 10min at 60°C. Cells then u nderwent a series of washes at RT: 3x quick washes with 1X SSC, 2× 5min washes with 1X SSC, a 5min wash with Tris-buffered saline, and a 5min wash with Tris-glycine buffer. Cells were post-fixed in 3% PFA and then incubated with blocking buffer for 1h at RT. Cells incubated with primary antibodies diluted in immunofluorescence buffer overnight at 4°C and secondary antibodies diluted in immunofluorescence buffer for 20min at RT. After secondary antibody incubation, cells were sequentially washed with immunofluorescence buffer, Tris-buffered saline, Tris-glycine buffer, 2mM MgCl2 in PBS, and PBS. Coverslips were mounted with ProLong Gold Antifade mounting media with DAPI (Invitrogen) and blinded.
Hybridization buffer consisted of 40% formamide, BSA (2mg/ml, Roche), 1mM ribonucleoside vanadyl complex (Sigma-Aldrich), 10mM NaPO4, and 1X SSC. Probe mixture for detection of C9 RNA foci, consisted of 1μL salmon sperm (10μg/ μL, Thermo Fisher Scientific), 0.5μL E. coli tRNA (20 μg μL, Thermo Fisher Scientific), 25μL 80% formamide, and 0.4μL 25μM 5’ digoxigenin (DIG)-labeled CCCCGGCCCCGGCCCC locked nucleic acid probe (Exiqon, batch 620574). Probe mixture for detection of poly (A) RNA, consisted of 1μL salmon sperm (10μg/μL, Thermo Fisher Scientific), 0.5μL E. coli tRNA (20 μg μL, Thermo Fisher Scientific), 25μL 80% formamide, and 0.8μL 25μM 3’ digoxigenin (DIG)-labeled polyT(25) locked nucleic acid probe (Exiqon, lot 237566815). Tris-buffered saline comprised of 50mM Tris and 15mM NaCl solution, pH 7.4. Tris-glycine buffer comprised of 0.75% glycine and 200mM Tris solution, pH 7.4. Blocking buffer consisted of 1% normal donkey serum (Jackson Immunoresearch) and 5% heat-shocked BSA in Tris-buffered saline. Immunofluorescence buffer consisted of 2% heat-shocked BSA in Tris-buffered saline. DIG-labeled probe was detected with a fluorescein-conjugated sheep anti-DIG antibody (1:250, Roche). All buffers were made with RNase-free water or PBS.
Quantitative image acquisition and analysis
Images used for quantification were acquired at matched exposure times or laser settings and processed using identical settings. Quantifications were normalized within each respective experiment with n ≥ 3 independent experiments unless otherwise specified in figure legends. Image acquisition was performed on a Leica DMI4000B laser scanning confocal microscope (Leica, Buffalo Grove, IL) or a Nikon W1 dual camera spinning disk confocal microscope and a Nikon A1R+ laser scanning confocal microscope (Northwestern University Center for Advanced Microscopy).
Unless otherwise specified, image acquisition was performed through the z-dimension at 0.3 – 0.5 μm intervals and individual planes were projected into maximum intensity images. Super-resolution images were acquired using the Nikon Structured Illumination Super-Resolution Microscope (Northwestern University Center for Advanced Microscopy, NIH Grant 1S10OD016342–01) through the z dimension at 0.3μm intervals to achieve ~115nm resolution in the X-Y plane in multiple colors.
The mean signal intensity of eRF1, pUPF1, and UPF1 for a region of interest was the mean pixel intensity per μm2 as calculated by the NIS-Elements Advanced Research v5 software (Nikon software, Northwestern University Center for Advanced Microscopy).
Calculation of tdTomato cytosolic ratio was performed on images acquired using a Leica DMI4000B laser scanning confocal microscope with a 63X oil immersion objective. The mean pixel intensity per μm2 of tdTomato for the cytoplasm and the nucleus was quantified by FIJI (NIH) for the calculation of the cytoplasmic to nuclear (C/N) ratio. Treatment with the nuclear export inhibitor KPT-330 (1μM for 30min) was used to validate the efficacy of this N/C transport reporter system.
For the calculation of eRF1 N/C ratio, analysis was performed on single slices since the use of projected maximum intensity images caused false nuclear eRF1 detection originating from a high cytosolic eRF1 signal. For iPSC-derived MNs, images were acquired using a Plan Apo λ 100× 1.45 NA oil immersion objective. For HEK-293 cells, images were acquired using a Plan Apo λ 60× 1.45 NA oil immersion objective. For post-mortem tissue, images of layer V regions of motor cortex tissue were acquired using a Plan Apo λ 60× 1.45 NA oil immersion objective. Corticospinal MNs were identified based on size and morphology. For MNs, we carried out blinded computational analysis based on an algorithm written in NIS-Elements that identifies the nuclear region based on DNA staining, and the cytoplasmic region based on MAP2 labeling, and generated values for mean pixel intensity per μm2 of eRF1 for each region. For HEK 293 cells, we analyzed cells expressing similar GFP levels and carried out a blinded analysis identifying the nuclear region based on DNA staining, and the cytoplasmic region based on GFP labeling, and generated values for mean pixel intensity per μm2 of eRF1 for each region. The N/C ratio was calculated as the mean eRF1-nuclear signal divided by the mean eRF1-cytosolic signal. Nuclear 3-dimensional reconstructions were performed in Imaris (Bitplane software, Northwestern University Center for Advanced Microscopy).
eRF1-DPR colocalization analysis was performed based on the Pearson Correlation Coefficient (PCC) between eRF1 (red) and GFP, (GR)x50-GFP, or (PR)x50-GFP (green) signal within the nucleus of each transfected cell. PCC was calculated by NIS-Elements software.
Calculation of nuclear area occupied by LMNB1+ invaginations: images were acquired using a Plan Apo λ 60× 1.45 NA oil immersion objective. LMNB1+ invagination area was normalized to the area of the nucleus for each MN. For iPSC-derived MNs, blinded computational analysis was used to calculate the area occupied by LMNB1 invaginations. An algorithm identified the nucleus (based on DAPI+ signal) and then analyzed LMNB1+ signal that was established above a set threshold, and >0.3 μm inside the perimeter of the nucleus. We then calculated the area of LMNB1 invagination normalized to the area of the nucleus for each MN. For post-mortem tissue, the nucleus and LMNB1+ protrusions into the nucleus were outlined manually in a blinded manner on layer V corticospinal neurons.
Calculation of % eRF1 within LMNB1+ nuclear invaginations: images were acquired using a Plan Apo λ 60× 1.45 NA oil immersion objective. Blinded computational analysis was performed using an algorithm written in NIS-Elements, which identified LMNB1+ nuclear invaginations as described above (nucleus identification was based on DAPI+ signal, and LMNB1+ signal identification above a set threshold, and >0.3 μm inside the perimeter of the nucleus). Finally, the algorithm identified nuclear eRF1 signal in the identified invaginations, and generated values for the number of eRF1 puncta within invaginations and the total number of nuclear eRF1 puncta.
Cell survival, de novo translation, and pUPF1 analyses: For cell survival, and de novo protein translation analysis, images were acquired at 20x and 100x respectively using a Leica DMi8 microscope (Leica, Buffalo Grove, IL), photographed using a C10600-ORCA-R2 digital CCD camera (Hamamatsu Photonics, Japan) and processed with Fiji.
NMD activation analysis was based on phosphorylated UPF1 (pUPF1) levels (pUPF1/UPF1 signal). For MNs, confocal images were acquired using a Plan Apo λ 60x oil immersion objective and the pUPF1/UPF1 value of each MN was calculated. For HEK-293 cells, 20x fluorescent microscopy images were acquired and pUPF1/UPF1 value of each optical field was calculated.
Quantification of G4C2 RNA foci: Images were acquired using a Plan Apo λ 60× 1.45 NA oil immersion objective through the z dimension at 0.3μm intervals and 3-dimensional images were analyzed by individual plane for nuclear and cytosolic foci in a blinded manner.
Quantification of N/C poly(A) RNA: analysis was performed on single slices since the use of projected maximum intensity images caused false nuclear poly(A) RNA detection originating from cytosolic poly(A) RNA signal. Images were acquired and analyzed in a blinded manner using a Plan Apo λ 60× 1.45 NA oil immersion objective and the poly(A) RNA N/C value of each MN was calculated.
Intron retention assay
RNA was isolated and cDNA generated as previously described. PCR reaction was performed using 50ng cDNA template, 0.5μM C9ORF72-exon1a forward primer, 0.15μM C9ORF72-intron1 reverse primer, 0.5μM C9ORF72-exon2 reverse primer, and Phusion Hot Start II DNA Polymerase (Thermo Scientific) with an annealing temperature of 55°C and 33 cycles. Products were ru n in 1% ethidium bromide gel and imaged with ChemiDoc™ XRS+ (Bio-Rad). Intensity analysis for the bands was performed using Fiji software (ImageJ, NIH Image).
NMD reporter assay
The pBS-TCR(PTC)-TCR(WT) NMD reporter plasmid (Nickless et al., 2014) contains 2 minigenes of a T Cell Receptor (TCR), the first one includes a premature stop codon (PTC) and the second unit contains a wild-type (normal) TCR minigene with >99% sequence homology to the first one. The two genes are controlled by separate cytomegalovirus (CMV) promoters. Cells were transfected with UPF1 siRNA and RNA was extracted 3 days later, as a control of NMD inhibition. RT-qPCR analysis was performed to determine the relative abundance of the two TCR transcripts.
QUANTIFICATION AND STATISTICAL ANALYSIS
All statistical analyses were done with Prism 7 software (GraphPad Software) and in collaboration with Alfred Rademaker, PhD (Professor, Division of Statistics, Northwestern University). We classified an independent biological replicate as either an independent experimental replicate or an independent iPSC differentiation, performed on different days. Individual values were usually displayed by dots in the graphs, and represent all values measured in the study. The sample size (n) of each specific experiment are provided in the results section and the statistical test performed for each specific experiment is defined in the corresponding figure legend. For each statistical analysis, we first tested whether sample data fit into Gaussian distribution using the D’Agostino-Pearson omnibus normality test. To compare two experimental conditions, either a student’s t test (parametric) or a Mann-Whitney U test (non-parametric) was performed. To compare ≥ 3 experimental conditions, either a one-way ANOVA followed by a Bonferroni post-hoc test (parametric) or a Kruskal-Wallis rank test followed by a two-stage linear step-up procedure of Benjamini, Krieger and Yekutieli (non-parametric) was performed. Analysis of MS/MS datasets was done by one-way ANOVA (Figures 1D), Kruskal-Wallis and Dunn’s multiple comparisons test (Figures 1E, G and S1L), and Kruskal-Wallis rank test (Figure 2A). To compare data distribution between the group of proteins that became significantly translocated in C9×58-transfected cells and all the proteins identified in HEK-293 cells by MS/MS, we used a Chi-square/Fisher’s exact test (Figures 2C and S2B–D). For imaging experiments where we tested for differences in a continuous variable at single-cell resolution, we accounted for variability between independent biological replicates by normalizing all measurements to the average of the corresponding controls. We then tested each biological replicate for differences in variance by the Brown-Forsythe test. In cases where biological replicates tested negative (Figures 1F; 4C; 7A), data from independent biological replicates were pooled per genotype or corresponding condition and tested for significance. In cases where biological replicates tested positive (Figures S4B,D,K; 6B,C,E; 7E), each independent biological replicate was tested for significant differences separately. In such cases, we deemed a biological change as significant only if all independent biological replicates tested were significant, and we display in the corresponding figure the least significant, i.e. the highest p value from all comparisons.
The exact number of biological and/or technical replicates, the specific statistical test applied, and p values from main figures are:
(C) n=3 independent biological replicates.
(D) n=4 independent biological replicates; ANOVA, p=ns, not significant.
(E) n=4 independent biological replicates; Kruskal-Wallis test, p****<0.0001.
(F) n=3 independent biological replicates; Kruskal-Wallis test, p*<0.05, **<0.01.
(G) n=3 independent biological replicates; Kruskal-Wallis test, p****<0.0001.
(A) n=4 independent biological replicates; proteins displaying Kruskal-Wallis test p values<0.05 when comparing (G4C2)x58-expressing cells to both controls (GFP- and (G4C2)x8-expressing cells) were labeled in dark gray.
(A) n=4 independent biological replicates; displayed dots represent proteins with Kruskal-Wallis test p values<0.05 when comparing (G4C2)x58-expressing cells to both controls (GFP- and (G4C2)x8-expressing cells.
(C) n ≥12 flies; Mann-Whitney U test, p=ns, not significant; ****<0.0001.
(E) n ≥13 flies; Mann-Whitney U test, p****<0.0001.
(C) n=3 independent differentiations; Mann-Whitney U test, p****<0.0001.
(B) Statistical differences between 3 non-neurological age-matched controls and 3 C9-ALS patients determined by Mann-Whitney U test, p****<0.0001.
(D) Statistical differences between 3 non-neurological age-matched controls and 3 C9-ALS patients determined by Mann-Whitney U test, p****<0.0001.
(B) n=3 independent differentiations; Kruskal-Wallis test, p**<0.01.
(C) n=3 independent differentiations of one control and two C9-ALS iPSC lines; Kruskal-Wallis test, p=ns, not significant; ****<0.0001.
(E) n=3 independent differentiations; Mann-Whitney U test, p**<0.01.
(G) n=6 independent differentiations; T test, p*<0.05.
(H) n=3 independent differentiations; Mann-Whitney U test, p****<0.0001.
(A) n=2 independent differentiations; Mann-Whitney U test, p*<0.05; **<0.01; ***<0.001.
(C) n=3 independent differentiations; bars represent the mean ± SEM; Wilcoxon signed rank, p****<0.0001.
(E) n=2 independent differentiations; Kruskal-Wallis test, p=ns, not significant; **<0.01,
****<0.0001.
(F) Left: Statistical differences between 3 control and 3 C9-ALS iPSC lines in n=8 independent differentiations; Mann-Whitney test, p**<0.01. Middle: Statistical differences in C9-ALS MNs transfected with scrambled (Scr) vs. ETF1 siRNAs. n=6 independent differentiations; T test, p*<0.05. Right: Statistical differences in C9-ALS MNs transfected with scrambled (Scr) vs. UPF1 siRNAs. n=3 independent differentiations; T test, p*<0.05.
(H) Left: n=18 flies; Mann-Whitney U test, p=ns, not significant; ****<0.0001. Right: n
=18 flies except for C9-(G4C2)x36 + UPF1-RNAi genotypes, which are mostly lethal (n=2); Mann-Whitney U test, p****<0.0001.
DATA AND CODE AVAILABILITY
Original/source data for Figures 1, 2, 3, S1, and S2 generated in this study are available in Table S1.
Supplementary Material
Table S2, related to Figure 2. Comprehensive analysis of the subcellular proteomic differences detected in C9×58-expressing cells. The table includes seven sheets with information related to figure 2 panels:
Figure 2A: Mean ± SD N/C ratio changes of proteins that are redistributed in cells expressing C9×58.
Figure 2C: Molecular weights of redistributed proteins in C9×58-expressing cells, compared to all the proteins detected HEK-293 cells in this study.
Figures 2D–E: Gene Ontology analysis of the group of redistributed proteins in C9×58-expressing cells.
Figure S2A: Comparative subcellular localization analysis of proteins redistributed in cells expressing C9×58.
Figure S2B: NES and NLS domain analysis in proteins redistributed in C9×58-expressing cells compared to the detected HEK-293 cell proteome.
Figure S2C: List of proteins previously identified as nuclear import, export and bidirectional cargoes.
Figure S2D: List of proteins previously identified as C9-HRE RNA and C9-HRE DPR interactors.
Table S1, related to Figure 1. LC-MS/MS data acquired in HEK-293 cells expressing GFP, C9×8, C9×58, ATX1–32Q, ATX1–84Q, HTT-25Q, or HTT-72Q. The table includes six sheets with information related to figure 1 panels:
Figure 1C: Cytosolic and nuclear ratios of bona fide cytosolic and nuclear markers.
Figures D–E: LC-MS/MS raw data obtained from GFP, C9×8-, and C9×58-expressing cells.
Figure 1G: LC-MS/MS raw data obtained from GFP, ATX1–32Q-, ATX1–84Q-, HTT-25Q-, or HTT-72Q-expressing cells.
Figure 1H: Kruskal-Wallis significance rank test for all the redundant proteins identified in cells transfected with plasmids expressing GFP, C9×8, C9×58, ATX1–32Q, ATX1–84Q, HTT-25Q, or HTT-72Q. List of all proteins that were significantly altered in each one of the three repeat expansion mutations (C9-ATX-HTT comparison).
Supplementary Table 3, Information related to iPSC lines utilized in the present study and the human tissue utilized for IHC analysis.
KEY RESOURCES TABLE.
| REAGENT or RESOURCE | SOURCE | IDENTIFIER |
|---|---|---|
| Antibodies | ||
| α-tubulin | Santa Cruz Biotechnology | Cat# sc-8035, RRID:AB_628408 |
| α-tubulin | Sigma | Cat#T5168 RRID:AB_477579 |
| Alexa Fluor Secondary antibodies | Thermo Fisher Scientific | https://www.thermofisher.com/us/en/home/life-science/antibodies/secondary-antibodies/fluorescent-secondary-antibodies/alexa-fluor-secondary-antibodies.html |
| ATF4 | Cell Signaling Technology | Cat# 11815 RRID:AB_2616025 |
| DIG-Fluorescein | Roche | Cat# 11207741910; RRID:AB_514498 |
| Hoechst 33342 | Thermo Fisher Scientific | Cat# H21492 |
| EIF2α | Thermo Fisher Scientific | Cat# AHO0802; RRID:AB_1500037 |
| ETF1 | Santa Cruz Biotechnology | Cat# sc-365686; RRID:AB_10843214 |
| GAPDH | Cell Signaling Technology | Cat# 2118; RRID:AB_561053 |
| GFP | Abcam | Cat# ab6673; RRID:AB_305643 |
| GRP78 | Santa Cruz Biotechnology | Cat# sc-376768; Temporary RRID: AB_2819145 |
| HA-tag | BioLegend | Cat# 901513; RRID:AB_2565335 |
| HRP Donkey Anti-goat | Santa Cruz Biotechnology | Cat# sc-2020; RRID:AB_631728 |
| HRP Goat Anti-mouse | LI-COR | Cat#:926–80010; RRID:AB_2721263 |
| HRP Goat Anti-rabbit | LI-COR | Cat#:926–80011; RRID:AB_2721264 |
| ISL1/2 | DHSB | Cat# 39.4D5; RRID: AB_2721271 |
| KDEL | Abcam | Cat# ab176333; Temporary RRID: AB_2819147 |
| KDEL | Enzo Life Sciences | Cat# ADI-SPA-827-D; RRID:AB_2039327 |
| Lamin A/C | (Wood et al, 2014) | N/A |
| LMNB1 | ProteinTech | Cat# 12987–1-AP; RRID:AB_2136290 |
| MAP2 | Abcam | Cat# ab11267 RRID:AB_297885 |
| pEIF2α | Cell Signaling Technology | Cat# 9721, RRID:AB_330951 |
| pUPF1 (Ser1127) | Millipore | Cat# 07–1016; RRID:AB_10805931 |
| TAF II p130 (4A6) | Santa Cruz Biotechnology | Cat# sc-736, RRID:AB_671207 |
| TUJ1 | Sigma-Aldrich | Cat# T2200; RRID:AB_262133 |
| UPF1 or RENT1 | Santa Cruz Biotechnology | sc-393594; Temporary RRID: AB_2819146 |
| Poly-GP | (Su et al, 2014) | N/A |
| Poly-GR | Millipore | Cat# MABN778; RRID:AB_2728664 |
| Puromycin | Millipore | Cat# MABE343; RRID:AB_2566826 |
| SMG1 | Santa Cruz Biotechnology | Cat# sc-374557; RRID: AB_11008478 |
| Vinculin | Sigma-Aldrich | Cat# V9131; RRID:AB_477629 |
| Bacterial and Virus Strains | ||
| One Shot Stbl3 Chemically Competent E. coli | Thermo Fisher Scientific | Cat# C737303 |
| One Shot TOP10 Chemically Competent E. coli | Thermo Fisher Scientific | Cat# C404010 |
| NEB Stable Competent E. coli | New England BioLabs | Cat# C3040I |
| HIV-1-based lentivirus | Northwestern University DNA RNA Delivery Core | Zufferey et al., 1998 |
| psPAX2 | Addgene | Cat#12260 |
| pMD2.G | Addgene | Cat#12259 |
| pCDH-CMV-MCS-EF1-Puro (CD510B) | System Biosciences | Cat# CD510B-1 |
| Biological Samples | ||
| Adult human motor cortex tissue | Northwestern University ALS Clinic | http://als.northwestern.edu/als-clinic/ |
| Chemicals, Peptides, and Recombinant Proteins | ||
| Antigen Decloaker (10X) | Biocare Medical | Cat# CB910 M |
| Ascorbic Acid | Sigma-Aldrich | Cat# A4403 |
| BDNF | R&D Systems | Cat# 248-BD |
| BSA (Fraction V) | Roche | Cat# 9048–46-8 |
| CNTF | R&D Systems | Cat# 257NT/CF |
| DAPT | DNSK International | Cat# 208255–80-5 |
| Doxycycline | Sigma-Aldrich | Cat# D9891 |
| E. coli tRNA | Sigma-Aldrich | Cat# 10109541001 |
| GDNF | R&D Systems | Cat# 212-GD |
| Laminin | Life Technologies | Cat# 23017–015 |
| LDN-193189 | DNSK International | Cat# 1062368–24-4 |
| Matrigel | CORNING | Cat# BD354277 |
| mTeSR1 media | STEMCELL | Cat# 85850 |
| Normal Donkey Serum | Jackson Immuno Research | Cat# 017–000-001 |
| Poly-D-Lysine | Sigma-Aldrich | Cat# P6407 |
| ProLong Diamond Antifade Mountant with DAPI | Thermo Fisher Scientific | Cat# P36962 |
| ProLong Gold Antifade Mountant with DAPI | Life Technologies | Cat# P36931 |
| Propidium Iodide | Invitrogen | Cat# P3566 |
| Puromycin | Gibco | Cat# A1113803 |
| Retinoic Acid | Sigma-Aldrich | Cat# R2625 |
| Ribonucleoside vanadyl complex | Sigma-Aldrich | Cat# R3380 |
| ROCK inhibitor (Y-27632) | DNSK International | Cat# 129830–38-2 |
| Salmon Sperm | Life Technologies | Cat# 15632011 |
| SB431542 | DNSK International | Cat# 301836–41-9 |
| Smoothened-Agonist (SAG) | DNSK International | Cat# 364590–63-6 |
| SSC (20X) | Ambion | Cat# AM9763 |
| SU5402 | DNSK International | Cat# 215542–92-3 |
| Critical Commercial Assays | ||
| Click-iT HPG Alexa Fluor 594 Protein Synthesis Assay | Thermo Fisher Scientific | Cat# C10429 |
| CytoTox 96 Non-Radioactive Cytotoxicity Assay | Promega | Cat# G1780 |
| HilyMax | Dojindo Molecular Technologies | Cat# H357–10 |
| iScript™ Reverse Transcription Supermix | BIO-RAD | Cat# 1708840 |
| iTaq Universal SYBR Green Supermix | BIO-RAD | Cat# 172–5124 |
| Lipofectamine RNAiMAX | Invitrogen | Cat# 13778030 |
| Micro BCA Protein Assay Kit | Thermo Fisher Scientific | Cat# 23235 |
| NE-PER Nuclear and Cytoplasmic Extraction Reagents | Thermo Fisher Scientific | Cat# 78833 |
| Phusion HS II DNA polymerase | Thermo Fisher Scientific | Cat# F549L |
| RNeasy Mini Kit | Qiagen | Cat# 74104 |
| TRIzol Reagent | Thermo Fisher Scientific | Cat# 15596026 |
| Experimental Models: Cell Lines | ||
| Human: HEK293FT | ATCC | RRID:CVCL_6911 |
| Human: eGFP-LMNB1 | Coriell | Cat# AICS0013; RRID:CVCL_IR32 |
| Human: “Control #1”,18A | (Boulting et al, 2011) Harvard University | RRID:CVCL_8993 |
| Human: “Control #2”, 11A | (Boulting et al, 2011) Harvard University | RRID:CVCL_8987 |
| Human: “Control #3”, TALSCTRL15.12 | Target ALS | Cat# ND50004, RRID:CVCL_FA00 |
| Human: “C9-ALS #1”, TALS9–9.3 | Target ALS | Cat# ND50000, RRID:CVCL_EZ95 |
| Human: “C9-ALS #1”, TALS9–9.5 | Target ALS | Cat# ND50001, RRID:CVCL_EZ96 |
| Human: “C9-ALS #2”, TALS9–11.2 | Target ALS | Cat# ND50008, RRID:CVCL_FA04 |
| Human: “C9-ALS #3”, ND10689 | Coriell | Cat# ND10689, RRID:CVCL_BE81 |
| Experimental Models: Organisms/Strains | ||
| D. melanogaster: GMR-GAL4 and W1118 | Casci et al., 2019 | N/A |
| D. melanogaster: C9-(G4C2)3 | (Xu et al, 2013) | N/A |
| D. melanogaster: C9-(G4C2)30 | (Xu et al, 2013) | N/A |
| D. melanogaster: C9-(G4C2)36 | (Mizielinska et al, 2014) | N/A |
| D. melanogaster: ETF1 RNAi | Vienna Drosophila Resource Center | Cat# 45027GD; RRID:FlyBase_FBst0465883 |
| D. melanogaster: ETF1 OE | This paper | N/A |
| D. melanogaster: UPF1 RNAi | Bloomington Drosophila Stock Center | Cat# 33539, RRID:BDSC_33539 |
| D. melanogaster: UPF1 OE | Bloomington Drosophila Stock Center | Cat# 24623; RRID:BDSC_24623 |
| D. melanogaster: CCT8 RNAi | Vienna Drosophila Resource Center | Cat# 103905KK; RRID: FlyBase_FBst0473457 |
| D. melanogaster: ENY2 RNAi | Vienna Drosophila Resource Center | Cat# 108212KK; RRID:FlyBase_FBst0481460 |
| D. melanogaster: PRMT1 RNAi | Vienna Drosophila Resource Center | Cat# 110391KK, RRID:FlyBase_FBst0473894 |
| D. melanogaster: SRSF1 RNAi | Vienna Drosophila Resource Center | Cat# 27775GD, RRID:FlyBase_FBst0457117 |
| D. melanogaster: TNPO3 RNAi | Vienna Drosophila Resource Center | Cat# 40991GD, RRID:FlyBase_FBst0473894 |
| Oligonucleotides | ||
| siETF1 (siRNA ID: s4840) | Thermo Fisher Scientific | Cat# 4392420 |
| siUPF1 (siRNA ID: s11927) | Thermo Fisher Scientific | Cat# 4392420 |
| siSMG1 (siRNA ID: s223562) | Thermo Fisher Scientific | Cat# 4392420 |
| 5’DigN-CCCCGGCCCCGGCCCC | Qiagen (Formerly Exiqon) | Cat# 300500 |
| polyT(25)Vn custom LNA detection probe | Qiagen (Formerly Exiqon) | Cat# LCD0000003-BDF; Lot# 237566815 |
| Recombinant DNA | ||
| pEGFP-N2 | Addgene | Cat# 6081–1 |
| pcDNA3.1-(GGGGCC)8-GFP | (Freibaum et al, 2015) | N/A |
| pcDNA3.1-(GGGGCC)58-GFP | (Freibaum et al, 2015) | N/A |
| pEGFP-Htt25Q | (Trajkovic et al, 2017) | N/A |
| pEGFP-Htt72Q | (Trajkovic et al, 2017) | N/A |
| pLEX-Atx1–32Q | (Venkatraman et al, 2014) | N/A |
| pLEX-Atx1–84Q | (Venkatraman et al, 2014) | N/A |
| pLenti-NLS-tdTomato-NES | (Zhang et al, 2015) | N/A |
| pBS-TCR(PTC)-TCR(WT) | (Nickless et al, 2014) | N/A |
| pcDNA3.1-GFP | (Wen et al, 2014) | N/A |
| pcDNA3.1-GA50-GFP | (Wen et al, 2014) | N/A |
| pcDNA3.1-GR50-GFP | (Wen et al, 2014) | N/A |
| pcDNA3.1-PA50-GFP | (Wen et al, 2014) | N/A |
| pcDNA3.1-PR50-GFP | (Wen et al, 2014) | N/A |
| Software and Algorithms | ||
| NIS-Elements Advanced Research version 5 | Northwestern University Center for Advanced Microscopy | N/A |
| Prism7 | GraphPad Software | https://www.graphpad.com |
| Imaris | Northwestern University Center for Advanced Microscopy | N/A |
| ImageJ / FIJI | NIH | https://imagej.net/Fiji/Downloads |
| Adobe Photoshop 7.0 | Adobe Systems Incorporated | https://www.adobe.com/products/photoshop.html |
| FlowJo | FlowJo, LLC | https://www.flowjo.com |
| Other | ||
Highlights.
C9-HRE alters subcellular localization of proteins involved in RNA/protein metabolism
eRF1 accumulates in complex nuclear invaginations in C9-ALS neurons
C9-ALS neurons display hyperactive NMD and reduced translation
eRF1 and UPF1 are modulators of C9-HRE toxicity in vivo
ACKNOWLEDGEMENTS
We are grateful to the following funding sources: US National Institutes of Health (NIH) / National Institute on Neurological Disorders and Stroke (NINDS) and National Institute on Aging (NIA) R01NS104219 (EK), NIH/NINDS grants R21NS111248 (EK), R21NS107761 (EK/JNS), Les Turner ALS Foundation (EK), Muscular Dystrophy Association (EK and UBP), ALS Association (UBP), Robert Packard Center for ALS at Johns Hopkins (UBP), NIH R01NS081303 (UBP), R21 NS098379, NS101661, NS100055 (UBP) and NIH/NINDS R01AG061787 (JNS). We thank Alfred W Rademaker for advice on statistical analysis. JAO is a postdoctoral fellow of The French Muscular Dystrophy Association (AFM-Téléthon). EK is a member of the Simpson Querrey Institute for BioNanotechnology, a Les Turner ALS Research Center Investigator and a New York Stem Cell Foundation – Robertson Investigator.
Footnotes
Publisher's Disclaimer: This is a PDF file of an unedited manuscript that has been accepted for publication. As a service to our customers we are providing this early version of the manuscript. The manuscript will undergo copyediting, typesetting, and review of the resulting proof before it is published in its final form. Please note that during the production process errors may be discovered which could affect the content, and all legal disclaimers that apply to the journal pertain.
DECLARATION OF INTERESTS
The authors have no conflict to report.
REFERENCES
- Albaum SP, Hahne H, Otto A, Haußmann U, Becher D, Poetsch A, Goesmann A, and Nattkemper TW (2011). A guide through the computational analysis of isotope-labeled mass spectrometry-based quantitative proteomics data: an application study. Proteome Science 9, 30. [DOI] [PMC free article] [PubMed] [Google Scholar]
- Armakola M, Higgins MJ, Figley MD, Barmada SJ, Scarborough EA, Diaz Z, Fang X, Shorter J, Krogan NJ, Finkbeiner S, et al. (2012). Inhibition of RNA lariat debranching enzyme suppresses TDP-43 toxicity in ALS disease models. Nat Genet 44, 1302–1309. [DOI] [PMC free article] [PubMed] [Google Scholar]
- Asano SM, Gao R, Wassie AT, Tillberg PW, Chen F, and Boyden ES (2018). Expansion Microscopy: Protocols for Imaging Proteins and RNA in Cells and Tissues. Curr Protoc Cell Biol 80, e56. [DOI] [PMC free article] [PubMed] [Google Scholar]
- Balendra R, and Isaacs AM (2018). C9orf72-mediated ALS and FTD: multiple pathways to disease. Nature reviews Neurology 14, 544–558. [DOI] [PMC free article] [PubMed] [Google Scholar]
- Barmada SJ, Ju S, Arjun A, Batarse A, Archbold HC, Peisach D, Li X, Zhang Y, Tank EM, Qiu H, et al. (2015). Amelioration of toxicity in neuronal models of amyotrophic lateral sclerosis by hUPF1. Proceedings of the National Academy of Sciences of the United States of America 112, 7821–7826. [DOI] [PMC free article] [PubMed] [Google Scholar]
- Barmada SJ, Serio A, Arjun A, Bilican B, Daub A, Ando DM, Tsvetkov A, Pleiss M, Li X, Peisach D, et al. (2014). Autophagy induction enhances TDP43 turnover and survival in neuronal ALS models. Nat Chem Biol 10, 677–685. [DOI] [PMC free article] [PubMed] [Google Scholar]
- Belgrader P, Cheng J, Zhou X, Stephenson LS, and Maquat LE (1994). Mammalian nonsense codons can be cis effectors of nuclear mRNA half-life. Molecular and cellular biology 14, 8219–8228. [DOI] [PMC free article] [PubMed] [Google Scholar]
- Bernhofer M, Goldberg T, Wolf S, Ahmed M, Zaugg J, Boden M, and Rost B (2018). NLSdb-major update for database of nuclear localization signals and nuclear export signals. Nucleic Acids Res 46, D503–D508. [DOI] [PMC free article] [PubMed] [Google Scholar]
- Binder JX, Pletscher-Frankild S, Tsafou K, Stolte C, O’Donoghue SI, Schneider R, and Jensen LJ (2014). COMPARTMENTS: unification and visualization of protein subcellular localization evidence. Database : the journal of biological databases and curation 2014, bau012. [DOI] [PMC free article] [PubMed] [Google Scholar]
- Boeynaems S, Bogaert E, Kovacs D, Konijnenberg A, Timmerman E, Volkov A, Guharoy M, De Decker M, Jaspers T, Ryan VH, et al. (2017). Phase Separation of C9orf72 Dipeptide Repeats Perturbs Stress Granule Dynamics. Mol Cell 65, 1044–1055 e1045. [DOI] [PMC free article] [PubMed] [Google Scholar]
- Boulting GL, Kiskinis E, Croft GF, Amoroso MW, Oakley DH, Wainger BJ, Williams DJ, Kahler DJ, Yamaki M, Davidow L, et al. (2011). A functionally characterized test set of human induced pluripotent stem cells. Nat Biotechnol 29, 279–286. [DOI] [PMC free article] [PubMed] [Google Scholar]
- Brown A, Shao S, Murray J, Hegde RS, and Ramakrishnan V (2015). Structural basis for stop codon recognition in eukaryotes. Nature 524, 493–496. [DOI] [PMC free article] [PubMed] [Google Scholar]
- Casci I, Krishnamurthy K, Kour S, Tripathy V, Ramesh N, Anderson EN, Marrone L, Grant RA, Oliver S, Gochenaur L, et al. (2019). Muscleblind acts as a modifier of FUS toxicity by modulating stress granule dynamics and SMN localization. Nature Communications 10, 5583. [DOI] [PMC free article] [PubMed] [Google Scholar]
- Chen EI, McClatchy D, Park SK, and Yates JR 3rd (2008). Comparisons of mass spectrometry compatible surfactants for global analysis of the mammalian brain proteome. Anal Chem 80, 8694–8701. [DOI] [PMC free article] [PubMed] [Google Scholar]
- Cociorva D, D, L.T., and Yates JR (2007). Validation of tandem mass spectrometry database search results using DTASelect. Curr Protoc Bioinformatics Chapter 13, Unit 13 14. [DOI] [PubMed]
- Colombo M, Karousis ED, Bourquin J, Bruggmann R, and Muhlemann O (2017). Transcriptome-wide identification of NMD-targeted human mRNAs reveals extensive redundancy between SMG6- and SMG7-mediated degradation pathways. RNA 23, 189–201. [DOI] [PMC free article] [PubMed] [Google Scholar]
- Cooper-Knock J, Higginbottom A, Stopford MJ, Highley JR, Ince PG, Wharton SB, Pickering-Brown S, Kirby J, Hautbergue GM, and Shaw PJ (2015). Antisense RNA foci in the motor neurons of C9ORF72-ALS patients are associated with TDP-43 proteinopathy. Acta neuropathologica 130, 63–75. [DOI] [PMC free article] [PubMed] [Google Scholar]
- Cooper-Knock J, Walsh MJ, Higginbottom A, Robin Highley J, Dickman MJ, Edbauer D, Ince PG, Wharton SB, Wilson SA, Kirby J, et al. (2014). Sequestration of multiple RNA recognition motif-containing proteins by C9orf72 repeat expansions. Brain 137, 2040–2051. [DOI] [PMC free article] [PubMed] [Google Scholar]
- D’Angelo MA, Raices M, Panowski SH, and Hetzer MW (2009). Age-dependent deterioration of nuclear pore complexes causes a loss of nuclear integrity in postmitotic cells. Cell 136, 284–295. [DOI] [PMC free article] [PubMed] [Google Scholar]
- DeJesus-Hernandez M, Mackenzie IR, Boeve BF, Boxer AL, Baker M, Rutherford NJ, Nicholson AM, Finch NA, Flynn H, Adamson J, et al. (2011). Expanded GGGGCC hexanucleotide repeat in noncoding region of C9ORF72 causes chromosome 9p-linked FTD and ALS. Neuron 72, 245–256. [DOI] [PMC free article] [PubMed] [Google Scholar]
- Deng HX, Chen W, Hong ST, Boycott KM, Gorrie GH, Siddique N, Yang Y, Fecto F, Shi Y, Zhai H, et al. (2011). Mutations in UBQLN2 cause dominant X-linked juvenile and adult-onset ALS and ALS/dementia. Nature 477, 211–215. [DOI] [PMC free article] [PubMed] [Google Scholar]
- Donnelly CJ, Zhang PW, Pham JT, Haeusler AR, Mistry NA, Vidensky S, Daley EL, Poth EM, Hoover B, Fines DM, et al. (2013). RNA toxicity from the ALS/FTD C9ORF72 expansion is mitigated by antisense intervention. Neuron 80, 415–428. [DOI] [PMC free article] [PubMed] [Google Scholar]
- Eftekharzadeh B, Daigle JG, Kapinos LE, Coyne A, Schiantarelli J, Carlomagno Y, Cook C, Miller SJ, Dujardin S, Amaral AS, et al. (2018). Tau Protein Disrupts Nucleocytoplasmic Transport in Alzheimer’s Disease. Neuron 99, 925–940.e927. [DOI] [PMC free article] [PubMed] [Google Scholar]
- Eng JK, McCormack AL, and Yates JR (1994). An approach to correlate tandem mass spectral data of peptides with amino acid sequences in a protein database. J Am Soc Mass Spectrom 5, 976–989. [DOI] [PubMed] [Google Scholar]
- Freibaum BD, Lu Y, Lopez-Gonzalez R, Kim NC, Almeida S, Lee KH, Badders N, Valentine M, Miller BL, Wong PC, et al. (2015). GGGGCC repeat expansion in C9orf72 compromises nucleocytoplasmic transport. Nature 525, 129–133. [DOI] [PMC free article] [PubMed] [Google Scholar]
- Fukuda T, Nomura M, Kato Y, Tojo H, Fujii K, Nagao T, Bando Y, Fehniger TE, Marko-Varga G, Nakamura H, et al. (2017). A selected reaction monitoring mass spectrometric assessment of biomarker candidates diagnosing large-cell neuroendocrine lung carcinoma by the scaling method using endogenous references. PLoS One 12, e0176219. [DOI] [PMC free article] [PubMed] [Google Scholar]
- Gasset-Rosa F, Chillon-Marinas C, Goginashvili A, Atwal RS, Artates JW, Tabet R, Wheeler VC, Bang AG, Cleveland DW, and Lagier-Tourenne C (2017). Polyglutamine-Expanded Huntingtin Exacerbates Age-Related Disruption of Nuclear Integrity and Nucleocytoplasmic Transport. Neuron 94, 48–57.e44. [DOI] [PMC free article] [PubMed] [Google Scholar]
- Gendron TF, Belzil VV, Zhang YJ, and Petrucelli L (2014). Mechanisms of toxicity in C9FTLD/ALS. Acta Neuropathol 127, 359–376. [DOI] [PMC free article] [PubMed] [Google Scholar]
- Gitler AD, and Tsuiji H (2016). There has been an awakening: Emerging mechanisms of C9orf72 mutations in FTD/ALS. Brain research 1647, 19–29. [DOI] [PMC free article] [PubMed] [Google Scholar]
- Gomez-Deza J, Lee YB, Troakes C, Nolan M, Al-Sarraj S, Gallo JM, and Shaw CE (2015). Dipeptide repeat protein inclusions are rare in the spinal cord and almost absent from motor neurons in C9ORF72 mutant amyotrophic lateral sclerosis and are unlikely to cause their degeneration. Acta neuropathologica communications 3, 38. [DOI] [PMC free article] [PubMed] [Google Scholar]
- Goodman LD, Prudencio M, Kramer NJ, Martinez-Ramirez LF, Srinivasan AR, Lan M, Parisi MJ, Zhu Y, Chew J, Cook CN, et al. (2019). Toxic expanded GGGGCC repeat transcription is mediated by the PAF1 complex in C9orf72-associated FTD. Nat Neurosci 22, 863–874. [DOI] [PMC free article] [PubMed] [Google Scholar]
- Grima JC, Daigle JG, Arbez N, Cunningham KC, Zhang K, Ochaba J, Geater C, Morozko E, Stocksdale J, Glatzer JC, et al. (2017). Mutant Huntingtin Disrupts the Nuclear Pore Complex. Neuron 94, 93–107.e106. [DOI] [PMC free article] [PubMed] [Google Scholar]
- Haeusler AR, Donnelly CJ, Periz G, Simko EA, Shaw PG, Kim MS, Maragakis NJ, Troncoso JC, Pandey A, Sattler R, et al. (2014). C9orf72 nucleotide repeat structures initiate molecular cascades of disease. Nature 507, 195–200. [DOI] [PMC free article] [PubMed] [Google Scholar]
- Haeusler AR, Donnelly CJ, and Rothstein JD (2016). The expanding biology of the C9orf72 nucleotide repeat expansion in neurodegenerative disease. Nature reviews Neuroscience 17, 383–395. [DOI] [PMC free article] [PubMed] [Google Scholar]
- Harding HP, Zhang Y, Zeng H, Novoa I, Lu PD, Calfon M, Sadri N, Yun C, Popko B, Paules R, et al. (2003). An integrated stress response regulates amino acid metabolism and resistance to oxidative stress. Mol Cell 11, 619–633. [DOI] [PubMed] [Google Scholar]
- Hartmann H, Hornburg D, Czuppa M, Bader J, Michaelsen M, Farny D, Arzberger T, Mann M, Meissner F, and Edbauer D (2018). Proteomics and C9orf72 neuropathology identify ribosomes as poly-GR/PR interactors driving toxicity. Life Sci Alliance 1, e201800070. [DOI] [PMC free article] [PubMed] [Google Scholar]
- Hautbergue GM, Castelli LM, Ferraiuolo L, Sanchez-Martinez A, Cooper-Knock J, Higginbottom A, Lin Y-H, Bauer CS, Dodd JE, Myszczynska MA, et al. (2017). SRSF1-dependent nuclear export inhibition of C9ORF72 repeat transcripts prevents neurodegeneration and associated motor deficits. Nature Communications 8, 16063. [DOI] [PMC free article] [PubMed] [Google Scholar]
- He L, Diedrich J, Chu YY, and Yates JR 3rd (2015). Extracting Accurate Precursor Information for Tandem Mass Spectra by RawConverter. Anal Chem 87, 11361–11367. [DOI] [PMC free article] [PubMed] [Google Scholar]
- Huang L, and Wilkinson MF (2012). Regulation of nonsense-mediated mRNA decay. Wiley interdisciplinary reviews RNA 3, 807–828. [DOI] [PubMed] [Google Scholar]
- Hulsen T, de Vlieg J, and Alkema W (2008). BioVenn – a web application for the comparison and visualization of biological lists using area-proportional Venn diagrams. BMC Genomics 9, 488. [DOI] [PMC free article] [PubMed] [Google Scholar]
- Imamachi N, Salam KA, Suzuki Y, and Akimitsu N (2017). A GC-rich sequence feature in the 3’ UTR directs UPF1-dependent mRNA decay in mammalian cells. Genome Res 27, 407–418. [DOI] [PMC free article] [PubMed] [Google Scholar]
- Ivanov PV, Gehring NH, Kunz JB, Hentze MW, and Kulozik AE (2008). Interactions between UPF1, eRFs, PABP and the exon junction complex suggest an integrated model for mammalian NMD pathways. EMBO J 27, 736–747. [DOI] [PMC free article] [PubMed] [Google Scholar]
- Jackson KL, Dayton RD, Orchard EA, Ju S, Ringe D, Petsko GA, Maquat LE, and Klein RL (2015). Preservation of forelimb function by UPF1 gene therapy in a rat model of TDP-43-induced motor paralysis. Gene therapy 22, 20–28. [DOI] [PMC free article] [PubMed] [Google Scholar]
- Jensen K, Sanchez-Garcia J, Williams C, Khare S, Mathur K, Graze RM, Hahn DA, McIntyre LM, Rincon-Limas DE, and Fernandez-Funez P (2013). Purification of transcripts and metabolites from Drosophila heads. J Vis Exp, e50245. [DOI] [PMC free article] [PubMed]
- Jovicic A, Mertens J, Boeynaems S, Bogaert E, Chai N, Yamada SB, Paul JW 3rd, Sun S, Herdy JR, Bieri G, et al. (2015). Modifiers of C9orf72 dipeptide repeat toxicity connect nucleocytoplasmic transport defects to FTD/ALS. Nat Neurosci 18, 1226–1229. [DOI] [PMC free article] [PubMed] [Google Scholar]
- Ju S, Tardiff DF, Han H, Divya K, Zhong Q, Maquat LE, Bosco DA, Hayward LJ, Brown RH Jr., Lindquist S, et al. (2011). A yeast model of FUS/TLS-dependent cytotoxicity. PLoS biology 9, e1001052. [DOI] [PMC free article] [PubMed] [Google Scholar]
- Kamelgarn M, Chen J, Kuang L, Jin H, Kasarskis EJ, and Zhu H (2018). ALS mutations of FUS suppress protein translation and disrupt the regulation of nonsense-mediated decay. Proc Natl Acad Sci U S A 115, E11904–E11913. [DOI] [PMC free article] [PubMed] [Google Scholar]
- Kanekura K, Yagi T, Cammack AJ, Mahadevan J, Kuroda M, Harms MB, Miller TM, and Urano F (2016). Poly-dipeptides encoded by the C9ORF72 repeats block global protein translation. Hum Mol Genet 25, 1803–1813. [DOI] [PMC free article] [PubMed] [Google Scholar]
- Kashima I, Yamashita A, Izumi N, Kataoka N, Morishita R, Hoshino S, Ohno M, Dreyfuss G, and Ohno S (2006). Binding of a novel SMG-1-Upf1-eRF1-eRF3 complex (SURF) to the exon junction complex triggers Upf1 phosphorylation and nonsense-mediated mRNA decay. Genes & development 20, 355–367. [DOI] [PMC free article] [PubMed] [Google Scholar]
- Kimura M, Kose S, Okumura N, Imai K, Furuta M, Sakiyama N, Tomii K, Horton P, Takao T, and Imamoto N (2013a). Identification of cargo proteins specific for the nucleocytoplasmic transport carrier transportin by combination of an in vitro transport system and stable isotope labeling by amino acids in cell culture (SILAC)-based quantitative proteomics. Molecular & cellular proteomics : MCP 12, 145–157. [DOI] [PMC free article] [PubMed] [Google Scholar]
- Kimura M, Okumura N, Kose S, Takao T, and Imamoto N (2013b). Identification of cargo proteins specific for importin-beta with importin-alpha applying a stable isotope labeling by amino acids in cell culture (SILAC)-based in vitro transport system. The Journal of biological chemistry 288, 24540–24549. [DOI] [PMC free article] [PubMed] [Google Scholar]
- Kimura M, Morinaka Y, Imai K, Kose S, Horton P, and Imamoto N (2017). Extensive cargo identification reveals distinct biological roles of the 12 importin pathways. Elife 6. [DOI] [PMC free article] [PubMed] [Google Scholar]
- Kisselev L, Ehrenberg M, and Frolova L (2003). Termination of translation: interplay of mRNA, rRNAs and release factors? The EMBO journal 22, 175–182. [DOI] [PMC free article] [PubMed] [Google Scholar]
- Kryuchkova P, Grishin A, Eliseev B, Karyagina A, Frolova L, and Alkalaeva E (2013). Two-step model of stop codon recognition by eukaryotic release factor eRF1. Nucleic Acids Res 41, 4573–4586. [DOI] [PMC free article] [PubMed] [Google Scholar]
- Kurosaki T, Li W, Hoque M, Popp MW, Ermolenko DN, Tian B, and Maquat LE (2014). A post-translational regulatory switch on UPF1 controls targeted mRNA degradation. Genes Dev 28, 1900–1916. [DOI] [PMC free article] [PubMed] [Google Scholar]
- Kurosaki T, and Maquat LE (2016). Nonsense-mediated mRNA decay in humans at a glance. J Cell Sci 129, 461–467. [DOI] [PMC free article] [PubMed] [Google Scholar]
- Kwon I, Xiang S, Kato M, Wu L, Theodoropoulos P, Wang T, Kim J, Yun J, Xie Y, and McKnight SL (2014). Poly-dipeptides encoded by the C9orf72 repeats bind nucleoli, impede RNA biogenesis, and kill cells. Science 345, 1139–1145. [DOI] [PMC free article] [PubMed] [Google Scholar]
- Lagier-Tourenne C, Polymenidou M, Hutt KR, Vu AQ, Baughn M, Huelga SC, Clutario KM, Ling SC, Liang TY, Mazur C, et al. (2012). Divergent roles of ALS-linked proteins FUS/TLS and TDP-43 intersect in processing long pre-mRNAs. Nature neuroscience 15, 1488–1497. [DOI] [PMC free article] [PubMed] [Google Scholar]
- Lanson NA Jr., Maltare A, King H, Smith R, Kim JH, Taylor JP, Lloyd TE, and Pandey UB (2011). A Drosophila model of FUS-related neurodegeneration reveals genetic interaction between FUS and TDP-43. Human molecular genetics 20, 2510–2523. [DOI] [PMC free article] [PubMed] [Google Scholar]
- Lee K-H, Zhang P, Kim HJ, Mitrea DM, Sarkar M, Freibaum BD, Cika J, Coughlin M, Messing J, Molliex A, et al. (2016). C9orf72 Dipeptide Repeats Impair the Assembly, Dynamics, and Function of Membrane-Less Organelles. Cell 167, 774–788.e717. [DOI] [PMC free article] [PubMed] [Google Scholar]
- Legartova S, Stixova L, Laur O, Kozubek S, Sehnalova P, and Bartova E (2014). Nuclear structures surrounding internal lamin invaginations. J Cell Biochem 115, 476–487. [DOI] [PubMed] [Google Scholar]
- Lin Y, Mori E, Kato M, Xiang S, Wu L, Kwon I, and McKnight SL (2016). Toxic PR Poly-Dipeptides Encoded by the C9orf72 Repeat Expansion Target LC Domain Polymers. Cell 167, 789–802 e712. [DOI] [PMC free article] [PubMed] [Google Scholar]
- Lind C, Oliveira A, and Aqvist J (2017). Origin of the omnipotence of eukaryotic release factor 1. Nat Commun 8, 1425. [DOI] [PMC free article] [PubMed] [Google Scholar]
- Lopez-Gonzalez R, Lu Y, Gendron TF, Karydas A, Tran H, Yang D, Petrucelli L, Miller BL, Almeida S, and Gao FB (2016). Poly(GR) in C9ORF72-Related ALS/FTD Compromises Mitochondrial Function and Increases Oxidative Stress and DNA Damage in iPSC-Derived Motor Neurons. Neuron 92, 383–391. [DOI] [PMC free article] [PubMed] [Google Scholar]
- Ma J, Goryaynov A, Sarma A, and Yang W (2012). Self-regulated viscous channel in the nuclear pore complex. Proceedings of the National Academy of Sciences of the United States of America 109, 7326–7331. [DOI] [PMC free article] [PubMed] [Google Scholar]
- Mackenzie IR, Frick P, Grasser FA, Gendron TF, Petrucelli L, Cashman NR, Edbauer D, Kremmer E, Prudlo J, Troost D, and Neumann M (2015). Quantitative analysis and clinico-pathological correlations of different dipeptide repeat protein pathologies in C9ORF72 mutation carriers. Acta neuropathologica 130, 845–861. [DOI] [PubMed] [Google Scholar]
- Malhas A, Goulbourne C, and Vaux DJ (2011). The nucleoplasmic reticulum: form and function. Trends in cell biology 21, 362–373. [DOI] [PubMed] [Google Scholar]
- Mann JR, Gleixner AM, Mauna JC, Gomes E, DeChellis-Marks MR, Needham PG, Copley KE, Hurtle B, Portz B, Pyles NJ, et al. (2019). RNA Binding Antagonizes Neurotoxic Phase Transitions of TDP-43. Neuron 102, 321–338 e328. [DOI] [PMC free article] [PubMed] [Google Scholar]
- May S, Hornburg D, Schludi MH, Arzberger T, Rentzsch K, Schwenk BM, Grasser FA, Mori K, Kremmer E, Banzhaf-Strathmann J, et al. (2014). C9orf72 FTLD/ALS-associated Gly-Ala dipeptide repeat proteins cause neuronal toxicity and Unc119 sequestration. Acta Neuropathol 128, 485–503. [DOI] [PMC free article] [PubMed] [Google Scholar]
- Mizielinska S, Gronke S, Niccoli T, Ridler CE, Clayton EL, Devoy A, Moens T, Norona FE, Woollacott IOC, Pietrzyk J, et al. (2014). C9orf72 repeat expansions cause neurodegeneration in Drosophila through arginine-rich proteins. Science (New York, NY) 345, 1192–1194. [DOI] [PMC free article] [PubMed] [Google Scholar]
- Mori K, Weng SM, Arzberger T, May S, Rentzsch K, Kremmer E, Schmid B, Kretzschmar HA, Cruts M, Van Broeckhoven C, et al. (2013a). The C9orf72 GGGGCC Repeat Is Translated into Aggregating Dipeptide-Repeat Proteins in FTLD/ALS. Science (New York, NY). [DOI] [PubMed]
- Mori K, Lammich S, Mackenzie IR, Forne I, Zilow S, Kretzschmar H, Edbauer D, Janssens J, Kleinberger G, Cruts M, et al. (2013b). hnRNP A3 binds to GGGGCC repeats and is a constituent of p62-positive/TDP43-negative inclusions in the hippocampus of patients with C9orf72 mutations. Acta Neuropathol 125, 413–423. [DOI] [PubMed] [Google Scholar]
- Neumann M, Sampathu DM, Kwong LK, Truax AC, Micsenyi MC, Chou TT, Bruce J, Schuck T, Grossman M, Clark CM, et al. (2006). Ubiquitinated TDP-43 in frontotemporal lobar degeneration and amyotrophic lateral sclerosis. Science (New York, NY) 314, 130–133. [DOI] [PubMed] [Google Scholar]
- Nichols CD, Becnel J, and Pandey UB (2012). Methods to assay Drosophila behavior. Journal of visualized experiments : JoVE. [DOI] [PMC free article] [PubMed]
- Nickless A, Jackson E, Marasa J, Nugent P, Mercer RW, Piwnica-Worms D, and You Z (2014). Intracellular calcium regulates nonsense-mediated mRNA decay. Nature medicine 20, 961–966. [DOI] [PMC free article] [PubMed] [Google Scholar]
- Pandey UB, Nie Z, Batlevi Y, McCray BA, Ritson GP, Nedelsky NB, Schwartz SL, DiProspero NA, Knight MA, Schuldiner O, et al. (2007). HDAC6 rescues neurodegeneration and provides an essential link between autophagy and the UPS. Nature 447, 859–863. [DOI] [PubMed] [Google Scholar]
- Peng J, Elias JE, Thoreen CC, Licklider LJ, and Gygi SP (2003). Evaluation of multidimensional chromatography coupled with tandem mass spectrometry (LC/LC-MS/MS) for large-scale protein analysis: the yeast proteome. J Proteome Res 2, 43–50. [DOI] [PubMed] [Google Scholar]
- Poliakov A, Russell CW, Ponnala L, Hoops HJ, Sun Q, Douglas AE, and van Wijk KJ (2011). Large-Scale Label-Free Quantitative Proteomics of the Pea aphid-Buchnera Symbiosis. Molecular & Cellular Proteomics 10, M110.007039. [DOI] [PMC free article] [PubMed] [Google Scholar]
- Polymenidou M, Lagier-Tourenne C, Hutt KR, Huelga SC, Moran J, Liang TY, Ling SC, Sun E, Wancewicz E, Mazur C, et al. (2011). Long pre-mRNA depletion and RNA missplicing contribute to neuronal vulnerability from loss of TDP-43. Nature neuroscience 14, 459–468. [DOI] [PMC free article] [PubMed] [Google Scholar]
- Prudencio M, Belzil VV, Batra R, Ross CA, Gendron TF, Pregent LJ, Murray ME, Overstreet KK, Piazza-Johnston AE, Desaro P, et al. (2015). Distinct brain transcriptome profiles in C9orf72-associated and sporadic ALS. Nat Neurosci 18, 1175–1182. [DOI] [PMC free article] [PubMed] [Google Scholar]
- Reber S, Stettler J, Filosa G, Colombo M, Jutzi D, Lenzken SC, Schweingruber C, Bruggmann R, Bachi A, Barabino SM, et al. (2016). Minor intron splicing is regulated by FUS and affected by ALS-associated FUS mutants. The EMBO journal 35, 1504–1521. [DOI] [PMC free article] [PubMed] [Google Scholar]
- Renton AE, Majounie E, Waite A, Simon-Sanchez J, Rollinson S, Gibbs JR, Schymick JC, Laaksovirta H, van Swieten JC, Myllykangas L, et al. (2011). A hexanucleotide repeat expansion in C9ORF72 is the cause of chromosome 9p21-linked ALS-FTD. Neuron 72, 257–268. [DOI] [PMC free article] [PubMed] [Google Scholar]
- Savas JN, Toyama BH, Xu T, Yates JR 3rd, and Hetzer MW (2012). Extremely long-lived nuclear pore proteins in the rat brain. Science (New York, NY) 335, 942. [DOI] [PMC free article] [PubMed] [Google Scholar]
- Schmidt EK, Clavarino G, Ceppi M, and Pierre P (2009). SUnSET, a nonradioactive method to monitor protein synthesis. Nat Methods 6, 275–277. [DOI] [PubMed] [Google Scholar]
- Schmittgen TD, and Livak KJ (2008). Analyzing real-time PCR data by the comparative C(T) method. Nature protocols 3, 1101–1108. [DOI] [PubMed] [Google Scholar]
- Schoen I, Aires L, Ries J, and Vogel V (2017). Nanoscale invaginations of the nuclear envelope: Shedding new light on wormholes with elusive function. Nucleus 8, 506–514. [DOI] [PMC free article] [PubMed] [Google Scholar]
- Shi Y, Lin S, Staats KA, Li Y, Chang WH, Hung ST, Hendricks E, Linares GR, Wang Y, Son EY, et al. (2018). Haploinsufficiency leads to neurodegeneration in C9ORF72 ALS/FTD human induced motor neurons. Nat Med 24, 313–325. [DOI] [PMC free article] [PubMed] [Google Scholar]
- Song H, Mugnier P, Das AK, Webb HM, Evans DR, Tuite MF, Hemmings BA, and Barford D (2000). The crystal structure of human eukaryotic release factor eRF1--mechanism of stop codon recognition and peptidyl-tRNA hydrolysis. Cell 100, 311–321. [DOI] [PubMed] [Google Scholar]
- Su Z, Zhang Y, Gendron TF, Bauer PO, Chew J, Yang WY, Fostvedt E, Jansen-West K, Belzil VV, Desaro P, et al. (2014). Discovery of a Biomarker and Lead Small Molecules to Target r(GGGGCC)-Associated Defects in c9FTD/ALS. Neuron 84, 239. [DOI] [PubMed] [Google Scholar]
- Sznajder LJ, Thomas JD, Carrell EM, Reid T, McFarland KN, Cleary JD, Oliveira R, Nutter CA, Bhatt K, Sobczak K, et al. (2018). Intron retention induced by microsatellite expansions as a disease biomarker. Proc Natl Acad Sci U S A 115, 4234–4239. [DOI] [PMC free article] [PubMed] [Google Scholar]
- Tabb DL, McDonald WH, and Yates JR 3rd (2002). DTASelect and Contrast: tools for assembling and comparing protein identifications from shotgun proteomics. J Proteome Res 1, 21–26. [DOI] [PMC free article] [PubMed] [Google Scholar]
- Tank EM, Figueroa-Romero C, Hinder LM, Bedi K, Archbold HC, Li X, Weskamp K, Safren N, Paez-Colasante X, Pacut C, et al. (2018). Abnormal RNA stability in amyotrophic lateral sclerosis. Nature communications 9, 2845. [DOI] [PMC free article] [PubMed] [Google Scholar]
- Tao Z, Wang H, Xia Q, Li K, Li K, Jiang X, Xu G, Wang G, and Ying Z (2015). Nucleolar stress and impaired stress granule formation contribute to C9orf72 RAN translation-induced cytotoxicity. Hum Mol Genet 24, 2426–2441. [DOI] [PubMed] [Google Scholar]
- Tarasova IA, Tereshkova AV, Lobas AA, Solovyeva EM, Sidorenko AS, Gorshkov V, Kjeldsen F, Bubis JA, Ivanov MV, Ilina IY, et al. (2017). Comparative proteomics as a tool for identifying specific alterations within interferon response pathways in human glioblastoma multiforme cells. Oncotarget 9. [DOI] [PMC free article] [PubMed] [Google Scholar]
- Taylor JP, Brown RH Jr., and Cleveland DW (2016). Decoding ALS: from genes to mechanism. Nature 539, 197–206. [DOI] [PMC free article] [PubMed] [Google Scholar]
- Thakar K, Karaca S, Port SA, Urlaub H, and Kehlenbach RH (2013). Identification of CRM1-dependent Nuclear Export Cargos Using Quantitative Mass Spectrometry. Molecular & cellular proteomics : MCP 12, 664–678. [DOI] [PMC free article] [PubMed] [Google Scholar]
- Toyama BH, Savas JN, Park SK, Harris MS, Ingolia NT, Yates JR 3rd, and Hetzer MW (2013). Identification of long-lived proteins reveals exceptional stability of essential cellular structures. Cell 154, 971–982. [DOI] [PMC free article] [PubMed] [Google Scholar]
- Trcek T, Sato H, Singer RH, and Maquat LE (2013). Temporal and spatial characterization of nonsense-mediated mRNA decay. Genes Dev 27, 541–551. [DOI] [PMC free article] [PubMed] [Google Scholar]
- van Blitterswijk M, Gendron TF, Baker MC, DeJesus-Hernandez M, Finch NA, Brown PH, Daughrity LM, Murray ME, Heckman MG, Jiang J, et al. (2015). Novel clinical associations with specific C9ORF72 transcripts in patients with repeat expansions in C9ORF72. Acta neuropathologica 130, 863–876. [DOI] [PMC free article] [PubMed] [Google Scholar]
- Vucic S, Rothstein JD, and Kiernan MC (2014). Advances in treating amyotrophic lateral sclerosis: insights from pathophysiological studies. Trends in neurosciences 37, 433–442. [DOI] [PubMed] [Google Scholar]
- Wen X, Tan W, Westergard T, Krishnamurthy K, Markandaiah SS, Shi Y, Lin S, Shneider NA, Monaghan J, Pandey UB, et al. (2014). Antisense proline-arginine RAN dipeptides linked to C9ORF72-ALS/FTD form toxic nuclear aggregates that initiate in vitro and in vivo neuronal death. Neuron 84, 1213–1225. [DOI] [PMC free article] [PubMed] [Google Scholar]
- Weskamp K, and Barmada SJ (2018). RNA Degradation in Neurodegenerative Disease. Advances in neurobiology 20, 103–142. [DOI] [PMC free article] [PubMed] [Google Scholar]
- Westergard T, McAvoy K, Russell K, Wen X, Pang Y, Morris B, Pasinelli P, Trotti D, and Haeusler A (2019). Repeat-associated non-AUG translation in C9orf72-ALS/FTD is driven by neuronal excitation and stress. EMBO Mol Med 11. [DOI] [PMC free article] [PubMed] [Google Scholar]
- Woerner AC, Frottin F, Hornburg D, Feng LR, Meissner F, Patra M, Tatzelt J, Mann M, Winklhofer KF, Hartl FU, and Hipp MS (2016). Cytoplasmic protein aggregates interfere with nucleocytoplasmic transport of protein and RNA. Science 351, 173–176. [DOI] [PubMed] [Google Scholar]
- Wolin SL, and Maquat LE (2019). Cellular RNA surveillance in health and disease. Science 366, 822–827. [DOI] [PMC free article] [PubMed] [Google Scholar]
- Wood AM, Rendtlew Danielsen JM, Lucas CA, Rice EL, Scalzo D, Shimi T, Goldman RD, Smith ED, Le Beau MM, and Kosak ST (2014). TRF2 and lamin A/C interact to facilitate the functional organization of chromosome ends. Nat Commun 5, 5467. [DOI] [PMC free article] [PubMed] [Google Scholar]
- Xu T, Venable JD, Park SK, Cociorva D, Lu B, Liao L, Wohlschlegel J, Hewel J, and Yates J (2006). ProLuCID, a fast and sensitive tandem mass spectra-based protein identification program, Vol 5. [Google Scholar]
- Xu W, Bao P, Jiang X, Wang H, Qin M, Wang R, Wang T, Yang Y, Lorenzini I, Liao L, et al. (2019). Reactivation of nonsense-mediated mRNA decay protects against C9orf72 dipeptide-repeat neurotoxicity. Brain 142, 1349–1364. [DOI] [PMC free article] [PubMed] [Google Scholar]
- Xu Z, Poidevin M, Li X, Li Y, Shu L, Nelson DL, Li H, Hales CM, Gearing M, Wingo TS, and Jin P (2013). Expanded GGGGCC repeat RNA associated with amyotrophic lateral sclerosis and frontotemporal dementia causes neurodegeneration. Proc Natl Acad Sci U S A 110, 7778–7783. [DOI] [PMC free article] [PubMed] [Google Scholar]
- Yin S, Lopez-Gonzalez R, Kunz RC, Gangopadhyay J, Borufka C, Gygi SP, Gao FB, and Reed R (2017). Evidence that C9ORF72 Dipeptide Repeat Proteins Associate with U2 snRNP to Cause Mis-splicing in ALS/FTD Patients. Cell Rep 19, 2244–2256. [DOI] [PMC free article] [PubMed] [Google Scholar]
- Zhang K, Donnelly CJ, Haeusler AR, Grima JC, Machamer JB, Steinwald P, Daley EL, Miller SJ, Cunningham KM, Vidensky S, et al. (2015). The C9orf72 repeat expansion disrupts nucleocytoplasmic transport. Nature 525, 56–61. [DOI] [PMC free article] [PubMed] [Google Scholar]
- Zhang K, Grima JC, Rothstein JD, and Lloyd TE (2016). Nucleocytoplasmic transport in C9orf72-mediated ALS/FTD. Nucleus (Austin, Tex) 7, 132–137. [DOI] [PMC free article] [PubMed] [Google Scholar]
- Zhang Z, Xin D, Wang P, Zhou L, Hu L, Kong X, and Hurst LD (2009). Noisy splicing, more than expression regulation, explains why some exons are subject to nonsense-mediated mRNA decay. BMC Biol 7, 23. [DOI] [PMC free article] [PubMed] [Google Scholar]
- Zhang Q, Wang S, Pan Y, Su D, Lu Q, Zuo Y, and Yang L (2019). Characterization of proteins in different subcellular localizations for Escherichia coli K12. Genomics 111, 1134–1141. [DOI] [PubMed] [Google Scholar]
- Ziller MJ, Ortega JA, Quinlan KA, Santos DP, Gu H, Martin EJ, Galonska C, Pop R, Maidl S, Di Pardo A, et al. (2018). Dissecting the Functional Consequences of De Novo DNA Methylation Dynamics in Human Motor Neuron Differentiation and Physiology. Cell Stem Cell 22, 559–574 e559. [DOI] [PMC free article] [PubMed] [Google Scholar]
- Zu T, Liu Y, Banez-Coronel M, Reid T, Pletnikova O, Lewis J, Miller TM, Harms MB, Falchook AE, Subramony SH, et al. (2013). RAN proteins and RNA foci from antisense transcripts in C9ORF72 ALS and frontotemporal dementia. Proc Natl Acad Sci U S A 110, E4968–4977. [DOI] [PMC free article] [PubMed] [Google Scholar]
- Zufferey R, Dull T, Mandel RJ, Bukovsky A, Quiroz D, Naldini L, and Trono D (1998). Self-inactivating lentivirus vector for safe and efficient in vivo gene delivery. J Virol 72, 9873–9880. [DOI] [PMC free article] [PubMed] [Google Scholar]
- Zybailov B, Mosley AL, Sardiu ME, Coleman MK, Florens L, and Washburn MP (2006). Statistical analysis of membrane proteome expression changes in Saccharomyces cerevisiae. J Proteome Res 5, 2339–2347. [DOI] [PubMed] [Google Scholar]
Associated Data
This section collects any data citations, data availability statements, or supplementary materials included in this article.
Supplementary Materials
Table S2, related to Figure 2. Comprehensive analysis of the subcellular proteomic differences detected in C9×58-expressing cells. The table includes seven sheets with information related to figure 2 panels:
Figure 2A: Mean ± SD N/C ratio changes of proteins that are redistributed in cells expressing C9×58.
Figure 2C: Molecular weights of redistributed proteins in C9×58-expressing cells, compared to all the proteins detected HEK-293 cells in this study.
Figures 2D–E: Gene Ontology analysis of the group of redistributed proteins in C9×58-expressing cells.
Figure S2A: Comparative subcellular localization analysis of proteins redistributed in cells expressing C9×58.
Figure S2B: NES and NLS domain analysis in proteins redistributed in C9×58-expressing cells compared to the detected HEK-293 cell proteome.
Figure S2C: List of proteins previously identified as nuclear import, export and bidirectional cargoes.
Figure S2D: List of proteins previously identified as C9-HRE RNA and C9-HRE DPR interactors.
Table S1, related to Figure 1. LC-MS/MS data acquired in HEK-293 cells expressing GFP, C9×8, C9×58, ATX1–32Q, ATX1–84Q, HTT-25Q, or HTT-72Q. The table includes six sheets with information related to figure 1 panels:
Figure 1C: Cytosolic and nuclear ratios of bona fide cytosolic and nuclear markers.
Figures D–E: LC-MS/MS raw data obtained from GFP, C9×8-, and C9×58-expressing cells.
Figure 1G: LC-MS/MS raw data obtained from GFP, ATX1–32Q-, ATX1–84Q-, HTT-25Q-, or HTT-72Q-expressing cells.
Figure 1H: Kruskal-Wallis significance rank test for all the redundant proteins identified in cells transfected with plasmids expressing GFP, C9×8, C9×58, ATX1–32Q, ATX1–84Q, HTT-25Q, or HTT-72Q. List of all proteins that were significantly altered in each one of the three repeat expansion mutations (C9-ATX-HTT comparison).
Supplementary Table 3, Information related to iPSC lines utilized in the present study and the human tissue utilized for IHC analysis.
Data Availability Statement
Original/source data for Figures 1, 2, 3, S1, and S2 generated in this study are available in Table S1.