

Summary:
Cellular metabolism plays important functions in dictating stem cell behaviors, although its role in stomach epithelial homeostasis has not been evaluated in depth. Here we show that the energy sensor AMP Kinase (AMPK) governs gastric epithelial progenitor differentiation. Administering the AMPK activator Metformin decreased epithelial progenitor proliferation and increased acid-secreting parietal cells (PCs) in mice and organoids. AMPK activation targets KLF4, known to govern progenitor proliferation and PC fate choice, and PGC1α, which we show controls PC maturation after their specification. PC-specific deletion of AMPKα or PGC1α caused defective PC maturation which could not be rescued by metformin. However, metformin treatment still increased KLF4 levels and suppressed progenitor proliferation. Thus, AMPK activates KLF4 in progenitors to reduce self-renewal and promote PC fate while AMPK-PGC1α activation within the PC lineage promotes maturation, providing a potential suggestion for why metformin increases acid secretion and reduces gastric cancer risk in humans.
Keywords: Paligenosis, ribosomes, mTORC1, mitochondria
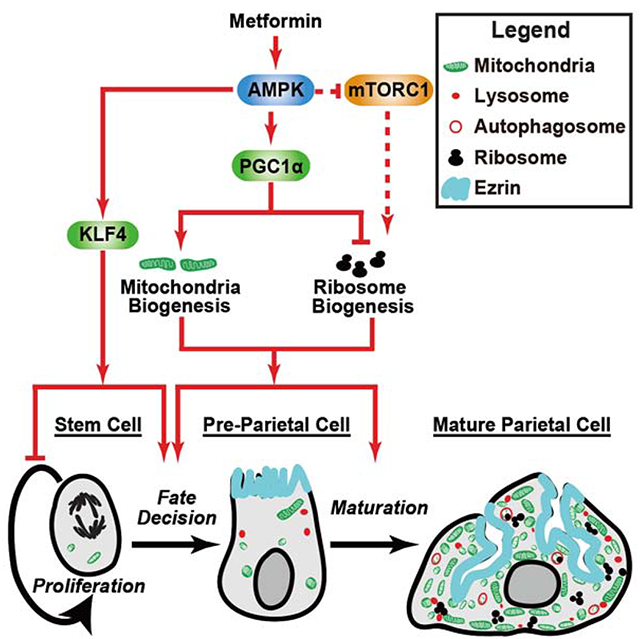
Graphical Abstract
Blurb
Mills and colleagues show the common diabetes drug metformin activates the cellular energy hub AMP Kinase. AMPK slows mouse gastric stem cell proliferation, coaxing them to become acid-pumping parietal cells; it also promotes parietal cell mitochondria accumulation to power acid secretion. The results may explain gastric side effects of metformin.
INTRODUCTION
The concept that flux through metabolic pathways may govern stem cell self-renewal and differentiation dates back at least a century but has been particularly bolstered by recent evidence (Adami, 1900; Adami and Nicholls, 1910; Krock et al., 2011; Ryall et al., 2015; Cliff et al., 2017; Rodriguez-Colman et al., 2017; Mattila et al., 2018). The enzyme AMP-dependent protein kinase (AMPK) is one of the central sensors and regulators of cellular metabolic activity that has recently been implicated in fate decisions and differentiation in various systems. In tissue culture, mesenchymal stem cell differentiation into osteoblasts versus adipocytes depends on an AMPK-mediated metabolic switch (Kim et al., 2012; Gautam et al., 2017). The drug metformin, which is commonly used to treat diabetes, activates AMPK and causes mesenchymal stem cells to differentiate into osteoblasts (Chava et al., 2018; Marofi et al., 2019). Likewise, AMPK governs embryonic stem cells choice of ectodermal vs. endodermal fate (Young et al., 2016) and promotes endothelial cell differentiation (Ohashi et al., 2010).
AMPK suppresses glycolysis and promotes oxidative phosphorylation in part by activating the critical mitochondrial scaling factor PGC1α (Jager et al., 2007; Decensi et al., 2010; Theret et al., 2017). However, AMPK also activates the transcription factor Kruppel-like factor 4 (KLF4) to arrest proliferation of vascular smooth muscle progenitors (Sunaga et al., 2016). The role of KLF4 in most tissues is to promote cell cycle exit and differentiation of progenitors. The effect of metformin→MPK→PGC1α/KLF4 on stem cell proliferation and lineage choice has not been addressed in adult epithelial cells in vivo.
The constitutive stem cells of the body (corpus) of the gastric epithelium are thought to inhabit the isthmus of the gastric unit, below the surface (pit) cells and above the acid-secreting parietal cells (PCs). Isthmal stem cells constitutively refuel PCs, pit cells (which migrate up the gland to the lumen), and mucous neck cells (which migrate down into the gland) (Matsuo et al., 2017; Burclaff et al., 2019; Li et al., 2019a). Little is known about how these stem cells decide to self-renew or differentiate (Saenz and Mills, 2018). KLF4 clearly plays a role, as gastric deletion of Klf4 increases stem cell proliferation with increased census of mucous neck cells and decreased PC census (Katz et al., 2005; Li et al., 2012; Yu et al., 2016). HNF4a also is known to suppress stem cell proliferation (Moore et al., 2016), whereas STAT3, induced by ERK and CD44, increases proliferation after tissue damage (Khurana et al., 2013).
Here, we show that metformin activated AMPK in mouse stomachs, increasing generation of PCs and decreasing isthmal progenitor cell proliferation. In gastric organoids, metformin also decreased proliferation and increased relative census of PC lineage cells, showing that the change in cell fate allocation was epithelial-specific. Metformin activated KLF4 and PGC1α. However, in mice with PC-lineage-specific deletion of AMPK, only KLF4 was activated; hence, KLF4 likely works in progenitor cells, not in cells of the PC lineage. Stem cell proliferation was not affected in Ppargc1−/− mice, indicating PGC1α is not important for stem cell fate choice. In contrast, PC-specific deletion of PGC1α phenocopied PC-specific deletion of AMPK and blocked metformin effects on PCs; hence, PGC1α is critical for effects of AMPK on PC maturation (eg on generating abundant, large mitochondria). Thus, AMPK acts on stem cells, largely via KLF4, to slow proliferation and promote differentiation to PCs. It acts on PGC1α to promote full numbers of functionally mature PCs.
RESULTS
PCs are enriched for mitochondrial and AMPK-pathway-related transcripts
We analyzed mRNA expression profiles of flow-cytometry-sorted PCs from Atp4b-cre;Rosa;mT/mG mice in which cells committed to the PC lineage fluoresce due to induction of lox-STOP-lox GFP (Lo et al., 2017) (SFig.1A). Gene set enrichment analysis (GSEA) showed PCs preferentially expressed mRNAs associated with mitochondria, fatty acid oxidation and cellular respiration (Fig. 1A; SFig. 1B–J), consistent with PCs favoring genes that regulate their abundant mitochondria and fuel their enormous complement of acid-pumping H+-K+-ATPase (Mills et al., 2001; Lo et al., 2017; Abe et al., 2018). Genes related to the master metabolic regulator AMPK were also PC-enriched (Fig. 1B; SFig.1K,L).
Figure 1. Parietal cells express AMPK-pathway-related transcripts; metformin decreases isthmal progenitor proliferation and increases parietal cell census.
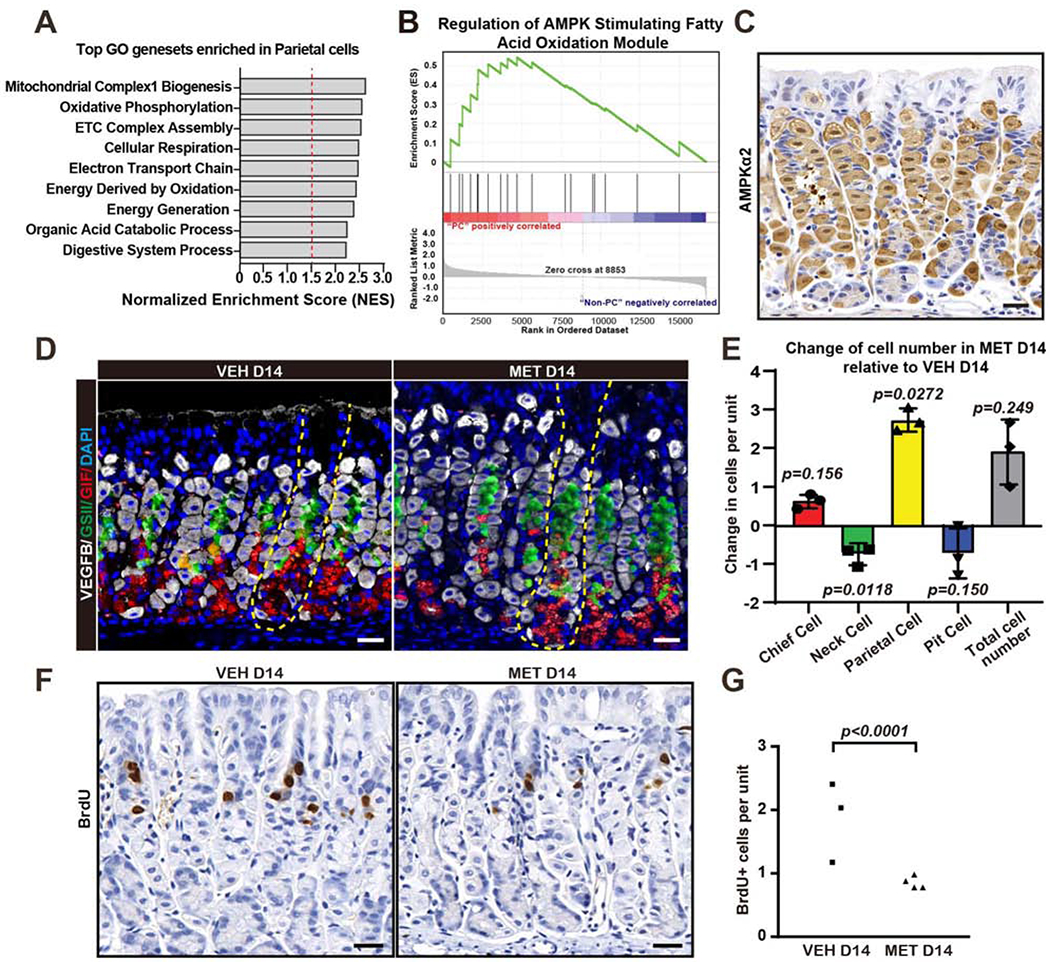
A. Gene set enrichment analysis (GSEA) of Affymetrix GeneChip expression profiles of flow-sorted parietal cell (PCs) from Atp4b-cre;Rosa;mT/mG mice. Broad Gene Ontology (GO) genesets with highest normalized enrichment and FDR are depicted.
B. GSEA plot for the Reactome Regulation of AMPK Stimulating Fatty Acid Oxidation geneset.
C. Immunohistochemistry for AMPKα2. Scale bar, 30 μm.
D. Immunofluorescence for PCs (VEGFB, white), mucous neck cells (lectin GSII, green), digestive-enzyme-secreting chief cells (Gastric Intrinsic Factor, GIF, red,) and nuclei (DAPI, blue) in wildtype mouse stomach after 14 days metformin treatment. Scale bar, 30 μm.
E. Quantification of principle, corpus epithelial cell lineages of wildtype mouse stomach after 14 days ±metformin. Data represented as mean change ±SEM in cell number from ≥35 gastric units in a metformin-treated mouse vs. its vehicle-treated control.
F. Immunohistochemistry for BrdU, a marker of cell cycle S-phase. Scale bar, 30 μm.
G. Quantification of results as in panel (F). Each datapoint represents the mean BrdU+ cells per gastric unit from ≥20 gastric units per mouse.
Statistical information: Significance calculated using two-tailed Student’s t-test.
The two isoforms of the catalytic subunit of AMPK are AMPKα1 and AMPKα2, encoded by Prkaa1 and Prkaa2. AMPKα2 protein is largely PC-specific in humans according to the Human Protein Atlas expression (Uhlen et al., 2017), consistent with what we observed in mice (Fig.1C). Prkaa2 mRNA was accordingly enriched 3.5x in sorted PCs vs. other gastric epithelial cells (Supplementary Table 1). AMPKα1 antibodies appeared non-specific in Protein Atlas, and we have likewise been unable to confirm protein localization in mice; Prkaa1 expression was slightly enriched in sorted PCs (Supplementary Table 1). RNAScope™ analysis of tissue mRNA expression corroborated antibody and transcriptomic studies (SFig.1K,L) with preferential expression of Prkaa2 in PCs and scattered labeling in other cells, in particular isthmal progenitor and pit cells. Prkaa1 labeling was sparser with slightly more in PCs and less in isthmal/pit cells. Thus, the AMPK signaling pathway (especially the AMPKa2 isoform) (Supplementary Table 1) was preferentially expressed in PCs with isthmal progenitors and many pit cells also positive.
Metformin decreased isthmal progenitor proliferation and increased PC census
We next administered the AMPK-inducing drug metformin (Lopez et al., 2016; Wang et al., 2017; Steinberg and Carling, 2019) to determine the functional consequence of AMPK expression. Within two weeks, the census of PCs increased nearly 3 per unit, mucous neck decreased nearly 1 per unit; pit cells trended also towards loss of 1 (Fig.1D,E; SFig.2A; Supplementary Table 2). Metformin decreased proliferation of the isthmal progenitor/stem cells (Fig.1F,G).
To determine metformin effects in a disease model, we administered high-dose tamoxifen (“TAM”), which causes PC-targeted, estrogen-independent toxicity that kills nearly all PCs within 3 days (Huh et al., 2012; Saenz et al., 2016; Burclaff et al., 2017; Demitrack et al., 2017) with subsequent de novo regeneration of the full PC complement by two weeks (SFig.2B; SFig.2F–I). The TAM model recapitulates – in a rapid, synchronous, reversible way – key aspects of the chronic PC atrophy that occurs during precancerous metaplasia and autoimmune gastritis (Bockerstett et al., 2019; Burclaff et al., 2019). As expected, over 95% of PCs died within 3 days after the first tamoxifen injection (Huh et al., 2012) (SFig.2F,G). Metformin affected neither PC ablation nor the regenerative response (known as paligenosis) of the digestive enzyme-secreting chief cells (GIF+, SOX9+ cells, SFig.2H,I).
We followed TAM ±metformin mice for up to 2 weeks, the timepoint when the stomach has largely recovered from the insult (SFig.2D). As expected, metformin during injury and regeneration significantly increased the expression of AMPK pathway proteins (AMPKa, KLF4 and PGC1α; Fig.2A) and mRNAs (Prkaal and Prkaa2 Fig.2B). Moreover, the activated, phosphorylated form of AMPKα (p-AMPKα) was markedly increased (Fig.2A). The overall PC census was increased as was expression of genes enriched in PCs (Ezrin, Atp4b and Vegfb; Fig.2C–E; SFig.2E). Finally, metformin significantly decreased isthmal progenitor cell proliferation (Fig.2F,G). Thus, both in homeostasis and disease, metformin increased PC number while suppressing proliferation of progenitors.
Figure 2. Metformin decreases isthmal progenitor proliferation and increases parietal cell census during regeneration from parietal cell ablation.
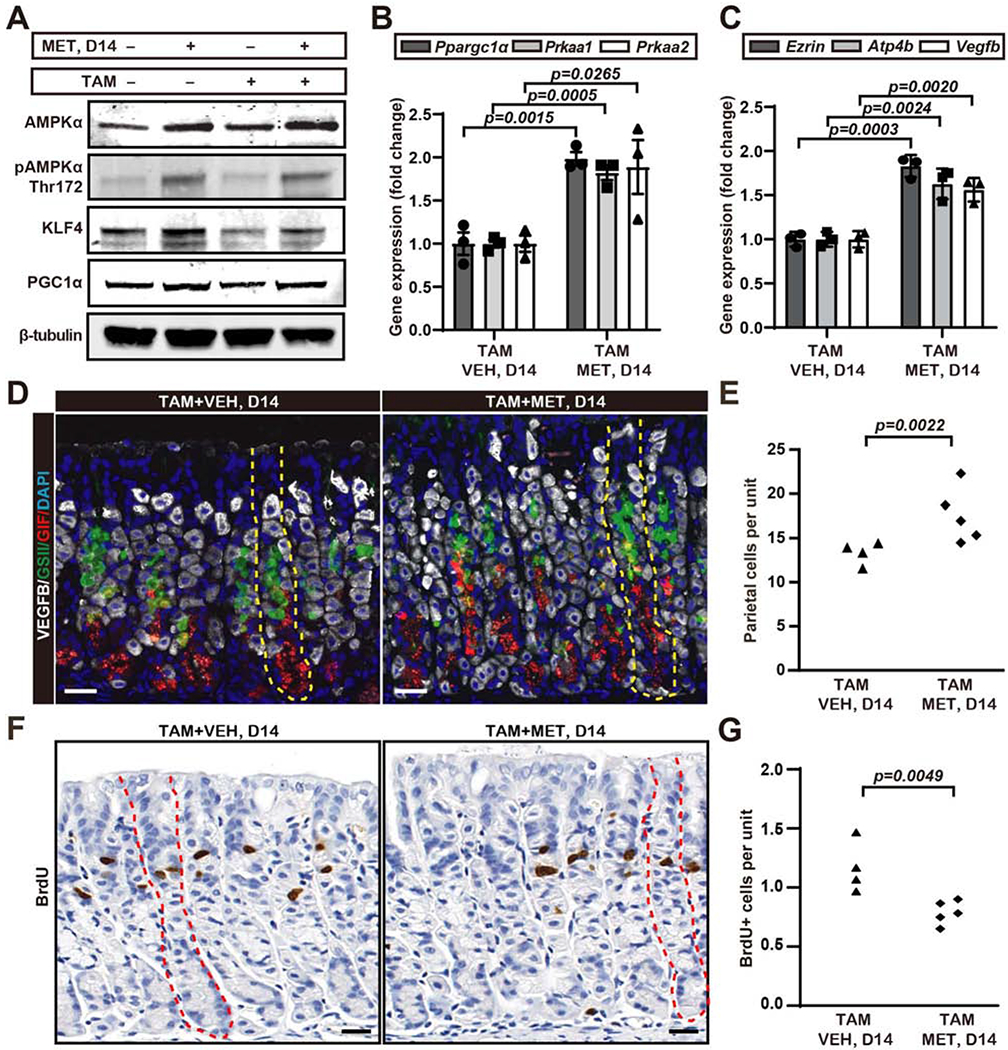
A. Representative western blot of AMPKα pathway proteins (total AMPKα, p-AMPKα Thr172, KLF4, PGC1α; β-tubulin as loading control) from wildtype mice whole stomach body ±3 days high-dose tamoxifen (TAM) ±metformin (MET), euthanized at 14 days (see SFig.2B–D for mouse treatment scheme).
B. qRT-PCR of AMPKα pathway genes (Prkaa1, Prkaa2, Ppargc1a, Tbp used to normalize) from wildtype mice whole stomach body after 3 days high-dose tamoxifen ± metformin, euthanized at 14 days as for panel (A). Data represented as mean ±SEM from each mouse normalized to average ΔCt of vehicle-treated mice, n=3 independent experiments.
C. qRT-PCR for mRNAs expressed preferentially in PCs (Ezrin, Atp4b, Vegfb, Tbp as loading control) as for panel (B).
D. Immunofluorescence for PCs (VEGFB, white), mucous neck cells (lectin GSII, green), chief cells (Gastric Intrinsic Factor, red) and nuclei (DAPI, blue) in wildtype mouse stomach + high-dose tamoxifen ± metformin, euthanized at d14. Yellow dotted line depicts a single gastric unit. Scale bar, 30 μm.
E. Quantification of PC number as in panel (D). Each datapoint represents the mean number of PCs per gastric unit from ≥40 gastric units per mouse.
F. Immunohistochemistry for BrdU. Red dotted line depicts a single gastric unit. Scale bar, 30 μm.
G. Quantification of BrdU+ cells as in panel (F). Each datapoint represents the mean number of BrdU+ cells per gastric unit from ≥20 gastric units per mouse.
Statistical information: Significance calculated using one-tailed Student’s t-test.
Nearly all PCs are generated de novo after TAM, and PC lifespan is at least 2 months (Burclaff et al., 2019). Thus, we reasoned that increased PC census after metformin was not via altered PC lifespan but, rather, was because AMPK activation in progenitor cells increased differentiation towards the PC lineage. Using both canonical (Karam and Leblond, 1993) and recent (Burclaff et al., 2019) estimates of lifespan of PCs, pit cells, and mucous neck cells, we calculated at homeostasis ~85% of proliferation in the isthmus normally fuels pit cell turnover (SFig.2J), with 11% needed for neck cells and only 4% to maintain PCs. To have achieved the increase in PC census, metformin-activated AMPK must have nearly doubled (3.9→7.6%) the fraction of stem and progenitor proliferation devoted to generating PCs. However, if metformin affected isthmal progenitors only by increasing commitment to PCs, then well over 90% of proliferation would still be available for pit and neck cells. That interpretation was supported by the modest decreases metformin induced in pit and neck lineages. What was unclear was how metformin could maintain the overall census of each lineage in the face of significantly decreased proliferation of isthmal progenitors: the bulk of isthmal proliferation replenishes pit cells, so a twofold proliferation decrease should have decreased pit cell census more substantially.
We hypothesized that if AMPK activation also increased pit cell lifespan, overall pit cell census would be maintained even with less progenitor proliferation. Determining pit cell lifespan is straightforward, as pit cells are born from isthmal progenitors and migrate stepwise upwards towards the gastric lumen over 3-4 days (Karam and Leblond, 1993; Burclaff et al., 2019). Accordingly, we performed pulse-chase experiments, injecting HD-TAM ±metformin mice with EdU and chasing for 36h (~1 pit cell half-life). As hypothesized, metformin caused dramatically increased retention of EdU-labeled cells in the pit, indicating activating AMPK increased pit cell lifespan and slowed migration out of the progenitor zone (SFig.2K).
Metformin increased PC lineage and decreased growth ex vivo in gastric organoids
To determine metformin directly affected PCs and stem/progenitor cells, we generated gastric organoids from Atp4b-cre;ROSA mT/mG mice to follow the PC lineage via membrane GFP. Previous work with these mice (Syder et al., 2004; Zhao et al., 2010; Huh et al., 2012; Burclaff et al., 2017; Lo et al., 2017) has shown that in vivo: 1) only PCs are GFP+ under homeostasis; 2) tdTomato+ cells are not of the PC lineage; 3) TAM PC ablation causes subsequent regeneration of the homeostatic state with all PCs GFP+ and without any lineage tracing of GFP+ PC-lineage progeny into other cell lineages, confirming PC lineage specificity, even following injury.
When the initial (1st generation) gastroids grown directly ex vivo from gastric body glands were treated with metformin, gastroid size decreased, phenocopying the decreased progenitor proliferation in vivo (Fig.3A,B; SFig.3A,E). Furthermore, metformin caused a fractional increase in cells of PC lineage as the ratio of GFP+/Tomato+ cell area was elevated (Fig.3C). GFP-marked cells were confirmed as PC lineage-derived by co-label with the PC marker VEGFB (Fig.3F); cells with PC or PC precursor morphology (large cells with abundant eosinophilic and vesicular cytoplasm and large, ovoid nuclei with homogeneous chromatin) in H&E stains were also clearly identifiable (SFig.3A).
Figure 3. Metformin decreases proliferation and increases relative representation of parietal cell lineage ex vivo in gastric organoids.
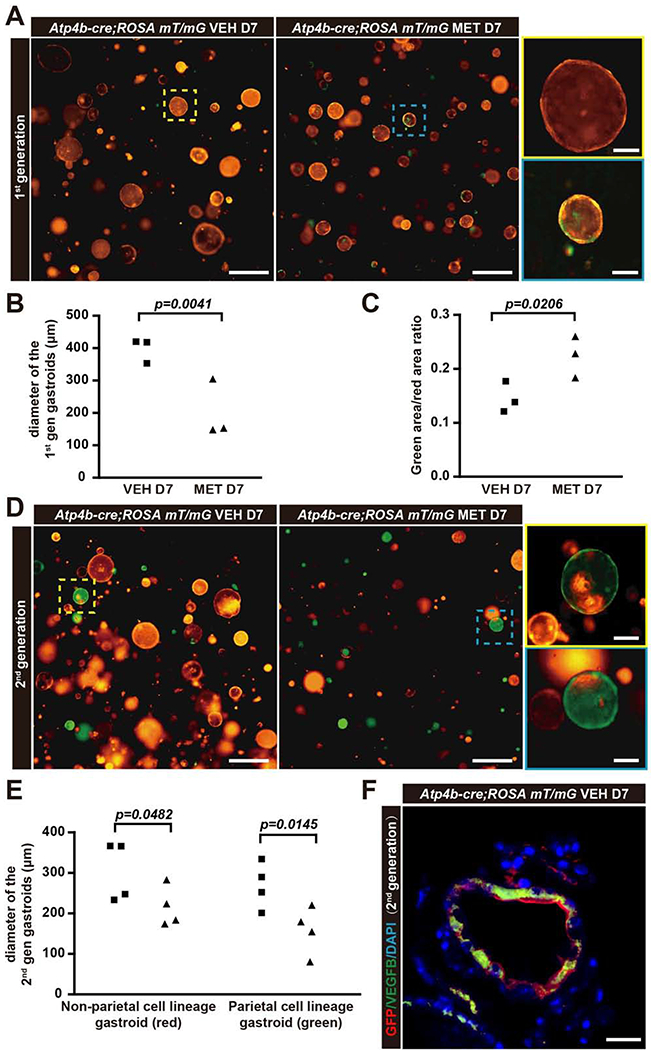
A. Gastric organoids derived directly from Atp4b-cre;ROSA mT/mG mice (“1st generation” gastroids). Red (tdTomato): non-parietal lineage cells; Green (GFP): PC lineage. Scale bar, 500 μm; insets show magnified organoids at left, 200 μm.
B. Quantification of diameter of 1st generation gastroids as in panel (A). Statistical information: Each datapoint represents the mean value of all measurable organoids in all wells from an individual mouse.
C. Quantification of the relative representation (area) of PC lineage (green cells) vs. non-parietal lineage cells (red) ±metformin. Each datapoint represents the mean value of all measureable organoids in all wells from an individual mouse.
D. 2nd generation gastroids were generated as clones from single cells dissociated from 1st generation gastroids. Metformin or vehicle was introduced as single cell suspensions were replated. Scale bar, 500 μm; box area, 200 μm.
E. Quantification of diameter of 2nd generation gastroids as in panel (D). Each datapoint represents the mean value of all measurable organoids in all wells from an individual mouse.
F. Immunofluorescence for GFP (anti-GFP here is pseudocolored red) co-labeled with PC marker VEGFB (green), and nuclei (blue, DAPI) in 2nd generation gastroid. Scale bar, 50 μm.
Statistical information: Significance calculated using one-tailed Student’s t-test.
To further dissect the types of progenitors responsive to metformin, we first grew gastroids without metformin for 1 week then dissociated 1st generation gastroids to single cells. Some such 2nd generation gastroid clones were derived from progenitors that were PC-committed and thus were all GFP+. Others derived either from multipotent stem cells or progenitors of non-PC lineages (Tomato+). SFig.3B and 3F show in H&E sections and immunofluorescence how 2nd generation cultures comprise either larger gastroids lacking PCs or smaller, less frequent gastroids composed of GFP-expressing cells with PC-lineage morphology, confirming that Atp4b-cre-expressing PC-lineage progenitors can be identified and propagated in gastroid cultures. Metformin, introduced to the single cell suspensions upon replating, inhibited growth of both PC- and non-PC-specific progenitor-derived 2nd generation gastroids (Fig.3D,E; SFig.3B,F). Overall, the gastroid experiments indicate metformin promotes multipotent progenitors to choose the PC fate and slows growth of both PC-committed progenitor cells and other stem/progenitor cells. Finally, we performed metformin dose-response experiments ±the AMPK inhibitor Compound C on 1st generation organoids. Growth of gastroids decreased with increasing dose of metformin, and specific inhibition of AMPK resulted in near complete rescue of metformin effects (SFig.3C), confirming that metformin acts via AMPK to slow epithelial cell progenitor proliferations. Gastroids treated with Compound C alone trended towards increased size compared to untreated controls, but the change was not significant (SFig.3D).
KLF4 and PGC1α, downstream targets of AMPK, influenced PC fate choice and maturation
To our knowledge, the only gene suspected to regulate both gastric epithelial progenitor proliferation and allocation to pit/neck/PC lineages is the transcription factor KLF4 (Krüppel-like factor 4), which causes cell cycle exit of progenitor cells in multiple tissues (Hall et al., 2009; Bao et al., 2013; Wei et al., 2013; Hao et al., 2017). Induced loss of KLF4 in adult gastric epithelium increases mucous neck cells and isthmal progenitor proliferation (Yu et al., 2016). Both embryonic and adult Klf4 deletion also decreases PC census (Katz et al., 2005; Yu et al., 2016). Thus, loss of KLF4 causes essentially the inverse of our metformin results.
As expected for a protein that dictates progenitor differentiation, we observed KLF4 was expressed in the isthmal progenitor zone, though it was also expressed in pit cells, most strongly near the isthmus (Fig.4A). In other tissues, AMPK activates KLF4 (Sunaga et al., 2016). Accordingly, we had observed that metformin increased KLF4 both at homeostasis and during recovery from TAM (Fig.2A). We reasoned KLF4 could affect when stem and progenitor cells exit the cell cycle to differentiate towards either the pit or PC lineage. Indeed, we commonly observed isthmal BrdU+ and/or KLF4+ cells with complex apical ezrin folding, consistent with nascent expansion of Ezrin+ microvilli that develop into the PC-specific canalicular network (Karam et al., 1997; Karam, 2010)(Fig.4A). Thus, PC progenitors still capable of proliferation also expressed KLF4. Metformin significantly increased the numbers of cells positive for both KLF4 and Ezrin at homeostasis, consistent with AMPK activation recruiting additional progenitor cells to commit to the PC lineage (Fig.4B). We did not detect specific, nuclear KLF4 labeling in mature PCs, indicating KLF4 expression is lost as PC precursors mature. It takes ~14 days after the last TAM injection for the gastric unit to regenerate the homeostatic census of the principal gastric cell lineages. The first regenerated PCs with mature morphology arise at 4–5d. By 7d, mature PCs rapidly emerge at which time, we noted a significant increase in KLF4+ cells (Fig.4A,C–D; SFig.2C).
Figure 4. KLF4 and PGC1α are downstream targets of AMPK that influence progenitor cell behavior and parietal cell maturation.
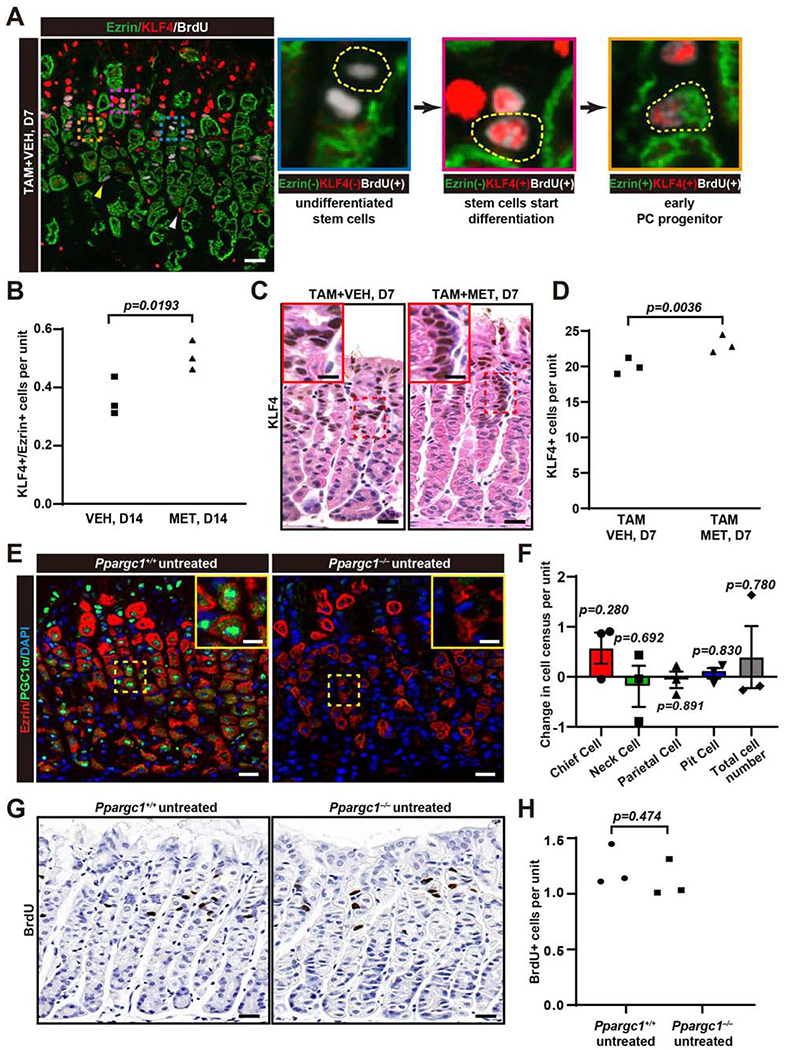
A. Immunofluorescence for KLF4 (red) expression with proliferation (BrdU, white), and PCs (thick Ezrin, green) in wildtype mice stomachs after 3 days high-dose tamoxifen ±metformin, euthanized at d7. Insets show apparent stages in progenitor cell fate choice towards PC lineage. Progenitor cells were BrdU+ with scant apical ezrin (blue inset, cell outlined). BrdU+/KLF4+ cells with slightly thicker apical ezrin were consistent with early differentiation, likely towards PC fate (pink inset, cell outlined). The gold inset shows a BrdU+ and KLF4+ cell with thick, apical ezrin, specific to the PC lineage. Scattered mucous neck cells (yellow arrowhead) were BrdU+, yet lacked detectable ezrin and were never KLF4+. White arrowhead marks non-epithelial and/or non-specific labeling. Scale bar, 30 μm.
B. Quantification of KLF4+/Ezrin+ cells in wildtype mice with 14 days ±metformin at homeostasis. Each datapoint represents the mean value of KLF4+/Ezrin+ cells per gastric from ≥80 gastric units per mouse.
C. Immunohistochemistry images of KLF4 staining of wildtype mice stomachs after 3 days high-dose tamoxifen ±metformin, euthanized at d7. Scale bar, 30 μm.
D. Quantification of KLF4+ cells as in panel (C). Each datapoint represents the mean value of KLF4+ cells per gastric from ≥40 gastric units per mouse.
E. Immunofluorescence for homeostatic PGC1α (green) expression with PCs (Ezrin, red) and nuclei marker (DAPI, blue) in stomachs from wildtype and Ppargc1−/− mice. Inset highlights intracellular staining pattern. Scale bar, 30 μm, 15 for inset.
F. Quantification of principal, corpus epithelial cell lineages in wildtype and Ppargc1−/− mouse stomach in homeostasis. Data represented as mean difference in mutant vs. control cell count ±SEM (≥20 gastric units counted mouse). Significance calculated using two-tailed Student’s t-test; error bars are ±SEM.
G. Immunohistochemistry for BrdU in wildtype and Ppargc1−/− mouse stomach in homeostasis. Scale bar, 30 μm
H. Quantification of BrdU+ cells as in panel (F). Each datapoint represents the mean value of BrdU+ cells per gastric unit from ≥80 gastric units per mouse. Significance calculated using two-tailed Student’s t-test.
Statistical information: Significance calculated using one-tailed Student’s t-test unless otherwise stated.
Because KLF4 expression is confined to pit cells and early PC progenitors (but not in mature or developing PCs) it seemed unlikely that it was the sole factor governing AMPK effects on PCs. Moreover, metformin increased PC number ~20% but increased expression of PC-specific genes by ~100% (Fig.2B–E), suggesting metformin might affect gene expression or function in existing PCs as well as increase generation of new ones.
One of the most important transcriptional effectors of AMPK that governs generation and maintenance of key PC phenotypic features like mitochondria is the co-transcriptional activator PGC1α (Mills and Taghert, 2012; Yan et al., 2016; Koh et al., 2017). PGC1α was expressed in mature PCs with nuclear and/or punctate (likely mitochondrial) cytoplasmic distribution. Nuclei of isthmal and lower pit cells in the proliferative zone were also frequently positive (Fig.4E). As mentioned, metformin also increased gastric PGC1α expression (Fig.2A). PGC1α is encoded by Ppargc1α. Ppargc1−/--stomachs showed no significant change in isthmal progenitor proliferation nor lineage allocation (Fig.4E–H; SFig.4A–E). However, PC morphology was aberrant, with stunted or abnormal ezrin networks, implicating PGC1α in PC maturation and function (Fig.4E; SFig.4A,B). We will later explore this function of PGC1α in more detail using a PC-specific deletion of PGC1α.
During homeostasis, PC-lineage deletion of AMPK decreased PC census and increased stem/progenitor cell proliferation
To determine how AMPK affected maturation and maintenance specifically in PCs, we generated mice with PC-lineage-specific ablation of AMPK. As our analyses showed possible expression of both isoforms of AMPK, we bred mice with PCs null for AMPKα subunits by crossing Prkaa1flox/flox and Prkaa2flox/flox mice harboring the PC-specific, constitutively expressed Atp4b-Cre transgene described above (Burclaff et al., 2017; Lo et al., 2017). From our work and others’ we know that Atp4b-cre is first expressed in PC progenitors capable of proliferating (Syder et al., 2004; Kim and Shivdasani, 2011; McCracken et al., 2017).
Loss of all 4 alleles encoding AMPKα caused a more severe phenotype than loss of either isoform alone (single isoform null data not shown). Atp4b-cre;Prkaa1Δ/Δ;Prkaa2Δ/Δ mice showed a block in differentiation of progenitors into PCs or increased PC turnover, as the number of PCs per unit was halved (Fig.5A,C,D; SFig.4F,G). Correlating with decreased PC number, the pH of gastric contents was significantly increased (Fig.5B). AMPK-deficient PCs showed marked morphological stunting as their nuclei frequently remained eccentric (Fig.5A,C; SFig.4H), indicating that many of the PCs were immature (PC maturation is characterized by increase in size, centripetal nuclear movement, and mitochondrial abundance) (Karam et al., 1997; Syder et al., 2004; Lo et al., 2017). AMPK-deficiency in PCs also increased overall proliferation of undifferentiated cells (Fig.5E,F).
Figure 5. Parietal cell-lineage deletion of AMPK decreases parietal cell census and increases progenitor cell proliferation in homeostasis.
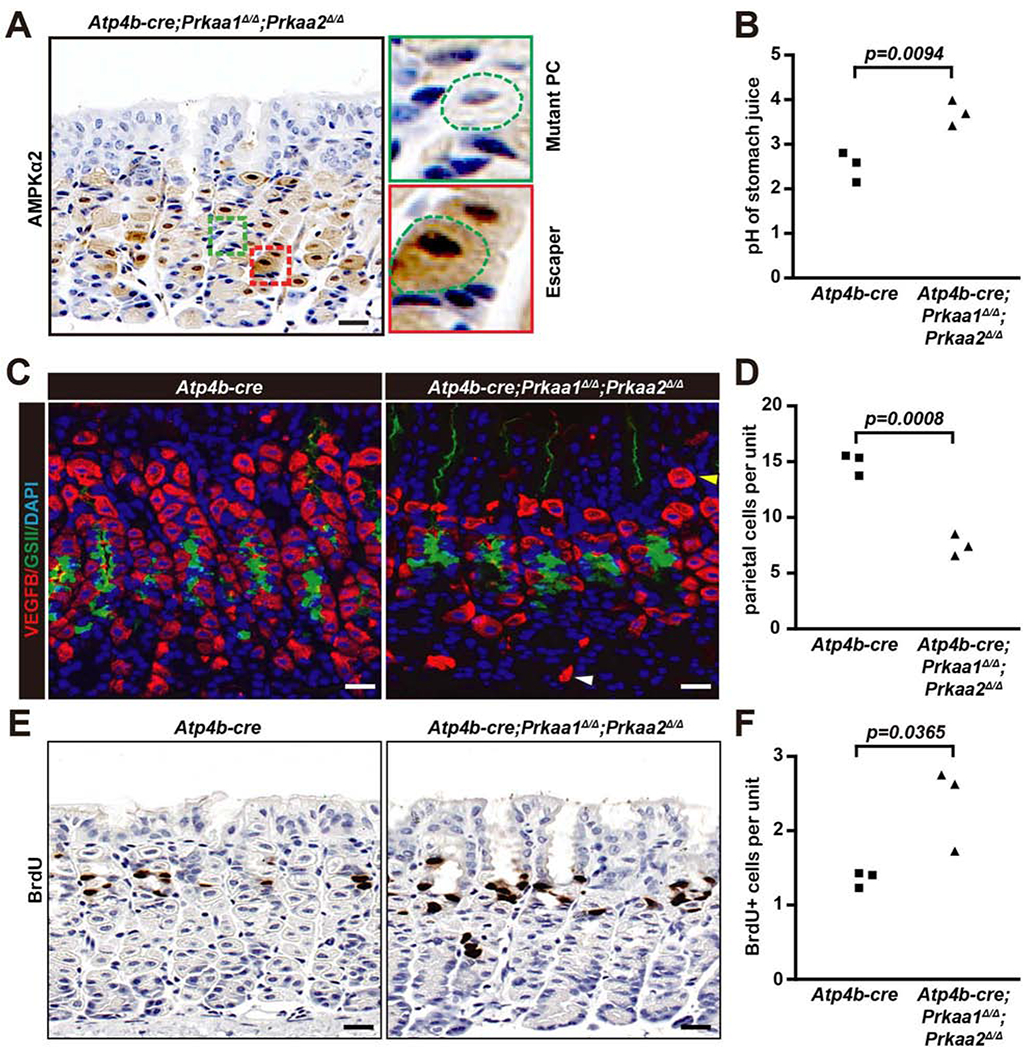
A. Immunohistochemistry of AMPKα2 expression in Atp4b-cre;Prkaa1Δ/Δ;Prkaa2Δ/Δ mice in homeostasis. Boxed area highlights a mutant PC, with characteristic eccentric nucleus and reduced size and an escaper PC that looks essentially normal. Scale bar, 30 μm.
B. Quantification of gastric juice pH value of Atp4b-cre;Prkaa1Δ/Δ;Prkaa2Δ/Δ and Atp4b-cre control mice Each datapoint represents the pH value from an individual mouse.
C. Immunofluorescence for PCs (VEGFB, red), mucous neck cells (lectin GSII, green), and nuclei (DAPI, blue) from Atp4b-cre;Prkaa1Δ/Δ;Prkaa2Δ/Δ and Atp4b-cre mice. Scale bar, 30 μm.
D. Quantification of VEGFB+ PCs as in panel (C). Each datapoint represents the mean number of PCs per gastric unit from ≥35 gastric units per mouse.
E. Immunohistochemistry images of BrdU staining of Atp4b-cre;Prkaa1Δ/Δ;Prkaa2Δ/Δ and Atp4b-cre control mice in homeostasis. Scale bar, 30 μm.
F. Quantification of VEGFB+ cells as in panel (E). Each datapoint represents the mean value of BrdU+ cells per gastric unit from ≥40 gastric units counted per mouse.
Statistical information: Significance calculated using two-tailed Student’s t-test.
We next used Atp4b-cre;Prkaa1Δ/Δ;Prkaa2Δ/Δ mice to further distinguish effects of AMPK on cell lineage fate choice of multipotent isthmal progenitors from effects on PC-committed progenitors and PC maturation. GSEA analysis with the Broad compendium of Gene Ontology (GO) genesets on expression profiles from Atp4b-cre;Prkaa1Δ/Δ;Prkaa2Δ/Δ and control mice ±metformin showed that, in control mice, metformin significantly increased expression of genes involved in energetics and mitochondria (Fig.6A, SFig.5A–E). That was expected because most AMPK in wildtype stomachs is expressed in mature PCs, which are abundant. In contrast, in mice lacking AMPK in PCs, metformin enriched a previously masked cohort of gene sets associated with differentiation, development, and cell fate choice, consistent with effects on stem and progenitor cells (Fig.6B; SFig.5F–J). We predicted that stimulating AMPK in Atp4b-cre;Prkaa1Δ/Δ;Prkaa2Δ/Δ mice would lead to increased KLF4. Indeed, Klf4 was one of the most metformin-enriched mRNAs in this analysis (Fig.6C, shows metformin effects on transcriptional regulators regulated by AMPK), and western blot confirmed a substantial increase in KLF4 upon metformin treatment even when AMPK had been deleted from PCs (Fig.6H).
Figure 6. Metformin still decreases progenitor proliferation and fate choice but not parietal cell maturation in mice with PC-specific AMPK deletion.
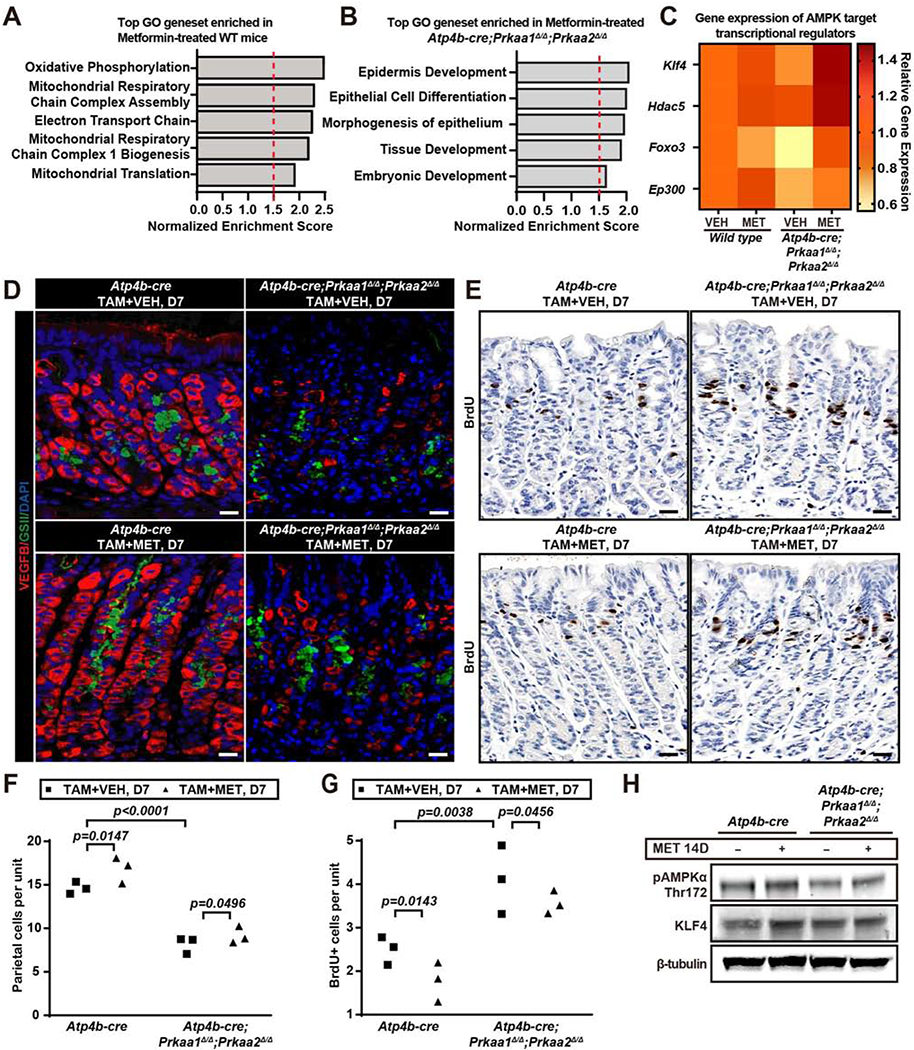
A. GSEA analysis of top hits from the Broad Gene Ontology (GO) genesets in 14d-metformintreated wildtype (WT) vs. vehicle-treated wildtype mice are depicted.
B. GSEA analysis of top hits from GO genesets as for panel (A) for Atp4b-cre; Prkaa1Δ/Δ;Prkaa2Δ/Δ mice treated with 14 days of metformin vs vehicle treatment are depicted.
C. Heat map depicting data from panels (A-B) of AMPK targets that are known transcriptional regulators (Klf4, Hdac5, Foxo3, Ep300) across the 4 conditions/genotypes. Gene expression is expressed as fold change relative to vehicle-treated control genotype mice.
D. Immunofluorescence for PCs (red, VEGFB); mucous neck cells (green, GSII), and nuclei (blue, DAPI) from Atp4b-cre;Prkaa1Δ/Δ;Prkaa2Δ/Δ and Atp4b-cre control mice after 3 days high-dose tamoxifen ±metformin during mid-regeneration timepoint (euthanized at d7). Scale bar, 30 μm.
E. Immunohistochemistry of BrdU staining in mice treated as for panel (D). Scale bar, 30 μm.
F. Quantification of VEGFB+ PC number as in panel (D). Each datapoint represents mean value of PCs per gastric unit from ≥35 gastric units per mouse.
G. Quantification of BrdU+ cells per gastric unit as in panel (E). Each datapoint represents the mean value of BrdU+ cells per gastric unit from ≥40 gastric units per mouse.
H. Western blot of whole stomach body at homeostasis, showing AMPKα pathway proteins (pAMPKα Thr172, KLF4; β-tubulin as loading control) from Atp4b-cre;Prkaa1Δ/Δ;Prkaa2Δ/Δ and Atp4b-cre control mice ±metformin, euthanasia at d14.
Statistical information: Significance calculated using one-tailed Student’s t-test.
In homeostasis, mice have time to adjust to lack of AMPK in PCs, and changes in PC census could have been due to chronic changes in PC turnover. To isolate AMPK effects specifically to generation of PCs from progenitors, we also examined Atp4b-cre;Prkaa1Δ/Δ;Prkaa2Δ/Δ mice during the height of regeneration 7 days after TAM. As expected, there were profound defects in PC maturation at this timepoint, and generation of new PCs from progenitors was halved. Metformin caused less dramatic but still significant increase in PC number and decrease in proliferation, even in the absence of AMPK in PCs, confirming that AMPK acts specifically in progenitor cells prior to commitment to the PC lineage (Fig.6D–H). Moreover, Atp4b-cre;Prkaa1Δ/Δ;Prkaa2Δ/Δ gastroids grew ±metformin similarly to those from control mice, indicating that AMPK dictates growth of progenitor cells upstream of the PC lineage in a direct, epithelial-autonomous manner (SFig.6A,B).
Loss of PGC1α in PCs largely phenocopied PC-specific AMPK deletion
We next explored the relationship between AMPK and its target PGC1α, because global loss of PGC1α had effects on PC maturation similar to loss of AMPK from PCs. We generated Atp4b-cre;Ppargc1flox/flox mice and confirmed loss of PGC1α in the vast majority of PCs (though ~20-30% escaped floxing of the allele; Fig.7B). PC-specific loss of PGC1α essentially recapitulated PC-specific loss of AMPK. Atp4b-cre;Ppargc1Δ/Δ PCs were smaller (Fig.7A,C,D) and had nuclei that remained in the eccentric, precursor position (SFig.6C–E). As expected, PGC1α depended on AMPK, as AMPK-deleted PCs showed PGC1α loss (Fig.7B). When either AMPK or PGC1α were deleted from PCs, PGC1α in isthmal and lower pit cells became more prominent. The loss of mature PCs, as expected, increased gastric luminal pH (SFig.6F). Loss of either AMPK or PGC1α decreased the mitochondrial census markedly, with mutant PC mitochondria smaller and more heterogeneous in contours (vs. uniformly ovoid in control) (Fig.7E–F, SFig.6H). Finally, in mutant PCs, phosphorylated ribosomal protein S6 staining – which we have shown is a faithful indicator of mTORC1 activity – increased, numerous free ribosomes were observed, and lysosomes showed aberrant morphology. All those features correlate with loss of AMPK leading to mTORC1 activation (SFig.6G–H).
Figure 7. AMPKα and its target PGC1α dictate maturation of the parietal cell lineage.
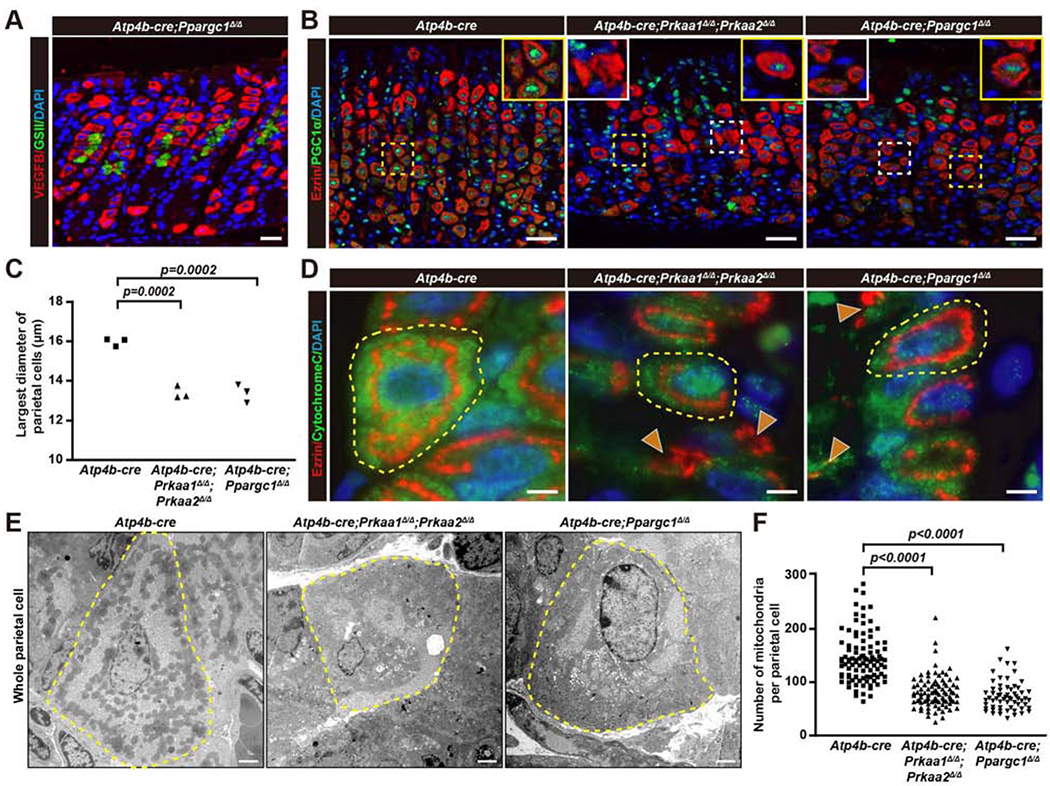
A. Immunofluorescence for PCs (red, VEGFB); mucous neck cells (green, GSII) and nuclei (blue, DAPI) from Atp4b-cre;Ppargc1Δ/Δ mice. Scale bar, 30 μm.
B. Immunofluorescence for PGC1α (green), Ezrin (red), and nuclei (blue, DAPI) in Atp4b-cre; Prkaa1Δ/Δ;Prkaa2Δ/Δ, Atp4b-cre;Ppargc1Δ/Δ and Atp4b-cre control mice. Yellow boxes highlight PCs with PGC1α, white boxes highlight those without PGC1α. Scale bar, 30 μm.
C. Quantification of PC size as in panel (A) and Fig.5C. Each datapoint represents the mean PC size from ≥200 PCs per mouse. Significance calculated using an ANOVA with multiple comparisons to the Atp4b-cre control (Dunnett post-hoc test).
D. Immunofluorescence for anti-Cytochrome C (green, mitochondria), Ezrin (red, PC), and nuclei (blue, DAPI) in Atp4b-cre;Prkaa1Δ/Δ;Prkaa2Δ/Δ, Atp4b-cre;Ppargc1Δ/Δ and Atp4b-cre control mice. PCs in mutant mice were small and had markedly aberrant ezrin and cytochrome C distribution (arrowheads). Scale bar, 30 μm.
E. Transmission EM of control and mutant mice. Electron dense regions at periphery of mutant cells contained scattered mitochondria and abundant free ribosomes (higher magnification to visualize mitochondrial and ribosomal morphology of the same cells are shown in SFig.6H). Scale bar, 2 μm.
F. Quantification of mitochondria per PC from tEM images as for panel (E). Each datapoints represents a single PC scored from tEM of ≥60 PCs. Significance calculated using ANOVA with Dunnett multiple comparisons to the Atp4b-cre control.
We next examined whether metformin rescued the maturation defects in AMPK/PGC1α-deficient PCs. Metformin treatment increased PC diameter and decreased gastric pH only in Atp4b-cre control mice not in mice with AMPK- or PGC1α-deficient PCs (SFig.7A,B,D–G). Metformin also failed to normalize the eccentric PC nuclear localization in the mutant mice (SFig.7C, H). Thus, metformin effects on PC maturation depended on PC expression of AMPK and PGC1α.
DISCUSSION
Here we show that the key sensor of the cellular energetic state, AMPK, plays a critical role in epithelial tissue differentiation in vivo. AMPK activation slowed gastric epithelial progenitor cell proliferation, increased stem cell commitment to the PC lineage, and promoted maturation of PCs from progenitors (Graphical Abstract). The slowing of epithelial stem cell proliferation was coordinated with increased pit cell lifespan, which is why metformin did not significantly affect the overall census of pit cells, even though nearly 90% of stem cell proliferation is normally dedicated to regenerating pit cells alone (Karam and Leblond, 1993).
It has previously been shown that KLF4 is an AMPK target that causes progenitor cell exit from the cell cycle and promotes differentiation in diverse tissues with the net effect of KLF4 being to decrease turnover and increase lifespan (Bao et al., 2013; Ocampo et al., 2016; Riera et al., 2016; Hao et al., 2017; Weir et al., 2017; White et al., 2018; Savini et al., 2019). Previously, it had been shown that KLF4 was expressed in pit cells (Katz et al., 2005) and that Klf4 deletion from the adult gastric epithelium increased isthmal progenitor proliferation, decreased PCs, and increased neck cells (Yu et al., 2016). We show here that KLF4 is upregulated by the AMPK activator metformin in the stomach and that it is expressed in isthmal cells and early PC precursors as well as pit cells (Sunaga et al., 2016). AMPK activation caused a lineage allocation phenotype that was essentially the inverse of that seen with loss of KLF4, indicating a key mechanism of metformin and AMPK is on epithelial stem/progenitor cell fate choice via KLF4.
AMPK appears to increase maturation of the PC lineage largely via PGC1α activation. Deletion of PGC1α specifically in PCs phenocopied PC-specific deletion of AMPK and blocked metformin effects on PC maturation without changing metformin effects on isthmal progenitor cell proliferation. Accordingly, loss of PGC1α globally (ie in Ppargc1a−/− mice) recapitulated the PC-specific PGC1α phenotype. However, Ppargc1a−/− stomachs, despite lacking PGC1α in isthmal progenitor cells, did not show proliferation or lineage allocation aberrations.
Together, our results show how a central cellular energy-sensing pathway can be critical not just for transient intracellular adaptation to environmental conditions but can also influence which cell lineages stem cells choose to replace. The most fundamental way to activate AMPK is via decreased cellular energy charge, specifically via decreased ATP relative to its deenergized metabolites (AMP and ADP). Thus, it follows that isthmal stem and progenitor cells, the most proliferative cells in the stomach, would slow proliferation in the face of an energetic downturn. Why, however, increased AMPK would stimulate the energy-intensive production of PCs, which are among the most energetically demanding cells in the body, seems at first paradoxical. However, AMPK is also a critical inducer of mitochondrial biogenesis via its effects on PGC1α. PCs clearly depend on AMPK→PGC1α for this function. PCs also have constitutively high levels of lysosomes and of macroautophagic puncta (Lo et al., 2017). We observe aberrant lysosome morphology in PCs lacking AMPK and PGC1α (SFig.6H), consistent with AMPK’s known role in suppressing mTORC1 and activating autophagy (Saxton and Sabatini, 2017). Autophagy activation has also been shown to be a means by which AMPK influences progenitor fate choice in other tissues (Li et al., 2019b; Vidoni et al., 2019).
It seems likely that PC precursors also use a non-energetic route to activate AMPK during their differentiation. A top candidate for that role would be LKB1 (STK11). Accordingly, we note: 1) LKB1 is strongly positive in human PCs (Udd et al., 2010), which we observe also in mice (not shown); 2) mutant LKB1 in humans with Peutz-Jeghers Syndrome and mice causes polyps characterized by hyperproliferative stem cells with increased pit and mucous neck cells and decreased PCs (similar to Klf4−/− and opposite to metformin phenotype) (Udd et al., 2010); 3) another LKB1 target, the kinase MST4, is known to have a critical role in regulating the massive apical ezrin network and the mature PC cytoskeleton (Jiang et al., 2015; Yuan et al., 2017).
To our knowledge, this is the first demonstration that metabolic pathways regulate fate choice and maturation in vivo in epithelial cells, though there is a recently emerging consensus that mesenchymal cells (eg those of fat and bone) can change cell fate based on AMPK activation state (Lee and Long, 2018; Kwak et al., 2019; Li et al., 2019b). To date, differentiation of epithelial cells has largely been studied within the context of changes in transcription factors. For example, in the stomach, roles have been shown for SPDEF and FOXQ1 (Verzi et al., 2008) in pit cell differentiation (Horst et al., 2010), MIST1 (BHLHA15) in chief cell differentiation (Ramsey et al., 2007; Bredemeyer et al., 2009), and HNF4a in regulating proliferation (Moore et al., 2016). But recent work has shown that key metabolic byproducts like lactate and metabolism-modulating treatment like calorie restriction can also affect proliferation and differentiation of intestinal stem cells (Yilmaz et al., 2012; Rodriguez-Colman et al., 2017; Roper and Yilmaz, 2017; Shyh-Chang and Ng, 2017). And it has been shown that the key, energy-sensing complex that more or less opposes AMPK function, mTORC1, is critical for mediating the return of mature cells to a progenitor cells state via paligenosis (Willet et al., 2018).
As mentioned, our overall understanding of how the gastric corpus epithelial stem cell works has been limited relative to other organs. BMP signaling has been shown to regulate proliferation (Todisco, 2017) and initial specification of PCs during embryonic development (Maloum et al., 2011; McCracken et al., 2017). Sonic hedgehog contributes to longterm homeostasis of stem cells and PCs (van den Brink, 2007; Zavros, 2008) though effects directly on stem cells or fate choice during differentiation have not been elucidated. Finally, a series of genes necessary for PC function (eg Hiplr, Atp4b, Clcn2), when lost, lead to slow decrease in the PC population over the lifetime of a mouse, often with compensatory increase in stem cell proliferation (Spicer et al., 2000; Franic et al., 2001; Jain et al., 2008; Nighot et al., 2015).
Metformin is one of the most commonly prescribed drugs, and patients tend to take it chronically. Our current results explain why patients on metformin may have increased acid production (Molloy et al., 1980). The results might also explain several known effects of metformin outside of its therapeutic function in lessening symptoms of type II diabetes; eg: decreased Vitamin B12, altered Ca2+ absorption, and decreased risk for cancer (including gastric cancer). A key player in Ca2+ absorption from the diet is acid secreted by PCs (El-Zaatari et al., 2010; Ye et al., 2015), potentially explaining this metformin effect. Vitamin B12 deficiency is most commonly caused by lack of the protein that binds it for uptake in the intestines: Gastric Intrinsic Factor (GIF). GIF is produced by PCs in humans via a regulated secretory pathway, and regulated secretion depends on mTORC1-mediated ribosome production and translation. AMPK suppresses those actions of mTORC1. Accordingly, we observed that AMPK-deficient PCs have increased ribosome biogenesis (SFig.6H), though we could not see effects of metformin on GIF, as mouse GIF is produced by chief cells. Finally, loss of PCs is the first known step in the progression to gastric cancer (as well as a key aspect of polyposis in Peutz-Jeghers Syndrome), and metformin has been shown to decrease risk for gastric cancer (Lee et al., 2016; Cheung et al., 2019). One might also propose that metformin might be beneficial in decreasing odds of polyp formation in Peutz-Jeghers Syndrome and might delay onset of metaplasia or progression of metaplasia to gastric cancer.
STAR METHODS
LEAD CONTACT AND MATERIAL AVAILABILITY
Further information and requests for resources and reagents should directed to, and will be fulfilled by the Lead Contact, Jason Mills (imills@wustl.edu). This study did not generate new unique reagents.
EXPERIMENTAL MODEL AND SUBJECT DETAILS
Mice
All experiments involving animals were performed according to protocols approved by the Washington University School of Medicine Animal Studies Committee. Mice were kept in grouped housing and maintained in a specified-pathogen-free barrier facility under a 12 hour light cycle and fed regular chow. Wild type C57BL/6 mice, B6.129(Cg)-Gt(ROSA)26Sortm4(ACTB-tdTomato,-EGFP)Luo/J(Muzumdar et al., 2007) (Stock No: 007676, referred as Rosa mT/mG) mice, Prkaa1tm1.1Sjm/J (Stock No: 014141, referred as Prkaa1flox/flox) mice, Prkaa2tm1.1Sjm/J (Stock No: 014142, referred as Prkaa2flox/flox) mice and B6N.129(FVB)-Ppargc1αtm2.1Brsp/J (Stock No: 9666, referred as PGC1α flox/flox) mice and B6.129S4(FVB)-Ppargc1αtm1Brsp/J (Stock No: 008597, referred as Ppargc1−/−) were all purchased from Jackson Laboratories (Bar Harbor, ME). Atp4b-cre (Syder et al., 2004) is a transgenic line expressing Cre recombinase driven by elements of the parietal cell-specific promoter for the gene Atp4b. Atp4b-cre mice were crossed with Rosa mT/mG, Prkaa1 flox/flox, Prkaa2 flox/flox and PGC1αflox/flox respectively to generate Atp4b-cre;Rosa mT/mG, Atp4b-cre;Prkaa1 Δ/Δ, Atp4b-cre;Prkaa2 Δ/Δ and Atp4b-cre; PGC1α Δ/Δ. Atp4b-cre;Prkaa1Δ/Δ were crossed with Atp4b-cre;Prkaa2 Δ/Δ to generate Atp4b-cre;Prkaa1 Δ/Δ;Prkaa2 Δ/Δ mice. Each mouse used was genotyped by PCR amplification. For full list of genotyping primers, see Supplementary Table 3. Experimental and control groups each contained at least three mice, with representatives from both genders. There were no differences in results observed between male and female mice. All mice used were between 8-12 weeks old. When possible, mice of equivalent age and gender (littermate controls) were used for experimental and control groups otherwise, mice were randomly chosen and sorted into experimental groups.
Gastroid culture
Gastric organoids (gastroids) collected from the gastric glands in the corpus of the stomach were isolated from Atp4b-cre;Rosa mT/mG, Atp4b-cre, and Atp4b-cre;Prkaa1 Δ/Δ;Prkaa2 Δ/Δ mice. Gastric glands were mechanically dissociated and incubated in EDTA (Barker et al., 2010). Approximately 100 gastric glands were mixed with 50 μL of Matrigel (Corning), plated in 24-well plates and cultured in Advanced DMEM/F12 medium (Invitrogen), 50% Wnt3a conditioned medium, 10% R-Spondin1 and Noggin conditioned medium (Wen et al., 2017) supplemented with 10mM HEPES, 1X N-2, 1X B27, 1X glutamax (Invitrogen), 1.25 mM N-Acetylcysteine (Sigma-Aldrich), 50 ng/mL EGF, 100 ng/mL FGF10 (Peprotech), 10 nM gastrin (Sigma-Aldrich) and 0.1% Primocin (Invivogen). 10 μM ROCK inhibitor (Y-27632, Sigma-Aldrich) was provided for the first generation gastroids to prevent anoikis. 1 mM Metformin (Cayman Chemical Company) was added with conditioned medium for gastroids treatment. Conditioned medium was changed every 3 days. Gastroids were cultured at 37°C and 5% CO2. For the metformin dosages curve, 1st generation gastroids were treated with conditioned media and metformin at the following concentrations: 40μM, 200μM, 1000μM metformin, and 1000μM metformin+5mM Compound C (expressed logarithmically on graph) for 7 days before analysis. For gastroid passage, gastroids were collected by mechanically dissociating the matrigel and centrifuged at low speed, incubated with pre-warmed trypLE express (Gibco) for 5 min, pipette and passed through a 40 μm cell strainer. All gastroids were trypsinized to single cells under microscope then transferred into new matrigel, and plated in 24 well-plates. Gastroids were passaged every 7 days. In experiments where gastroids were passaged for multiple generations, the first generation was not treated with Metformin. All subsequent passages were introduced to metformin upon replating with fresh media. To embed gastroids, culturing media was removed, gastroids were washed in DPBS, spun at 500xg for 5 minutes, and fixed in 10% formalin on ice for 1 hour while shaking. Gastroids were washed in PBS, moved to 70% ethanol, mounted in 3% agar and embedded in paraffin.
METHODS DETAILS
Drug Treatments
To induce parietal cell death, Tamoxifen (250mg/kg, Toronto Research Chemicals Inc.) was injected intraperitoneally for three days. To prepare Tamoxifen solution, 25 mg of dry tamoxifen was dissolved in 100 μL of 100 % ethanol. Sonication was used to get Tamoxifen into solution and immediately transferred to 900 μL of sunflower oil (Saenz et al., 2016). For metformin treatment, mice were gavaged daily with metformin (300mg/kg dissolved in saline) (Babcook et al., 2014) or 3mg/ml in drinking water (Cuyas et al., 2018) to ensure direct exposure to the stomach. All mice were pretreated with metformin daily alone for 7 days before Tamoxifen treatment. Mice were given an intraperitoneal injection containing 5-bromo-2’-deoxyuridine (BrdU; 120 mg/kg) and 5-fluoro-2’-deoxyuridine (12 mg/kg) in sterile water 90 min before sacrifice for all BrdU labeling experiments. Mice were anesthetized with isothesia (Henry Schein Animal Health) and sacrificed via cervical dislocation. Mouse stomachs were immediately excised and flushed with PBS after sacrifice, and fixed in freshly prepared 10% formalin overnight and moved to 70% ethanol before preparation for embedding. Stomach were cut into rings or strips, embedded in 3% agar in a tissue cassette, and underwent routine paraffin processing. Tissue was sectioned 5μm thick and mounted on glass slides.
For 5-ethynyl-2’-deoxyuridine (EdU) pulse, all mice were pretreated with metformin daily for 7 days followed by 3 days of Tamoxifen and metformin treatment. Mice were given an intraperitoneal injection containing EdU (50mg/kg) in sterile water 36 hours before sacrifice. Tissue was processed as above.
Immunofluorescence/Immunohistochemistry/In situ hybridization
For immunofluorescence, tissue microtome sections underwent a standard deparaffinization with xylene and rehydration protocol and were antigen retrieved in sodium citrate buffer (2.94 g sodium citrate, 500 uL Tween 20, pH 6.0) using a pressure cooker. Sections were blocked in 1% BSA, 0.3% Triton-X100 in PBS for one hour, left overnight with primary antibodies, washed in PBS and incubated for one hour with secondary antibodies. Slides were washed in PBS and mounted using ProLong Gold antifade mountant with DAPI (Molecular Probes) and stored at 4°. EdU was detected using BaseClick Edu-488 Cell Proliferation kit as per the manufacturer’s protocol. For immunohistochemistry, the following adjustments were made to the immunofluorescence procedure, otherwise all steps were identical. An extra quenching step was performed for 15 minutes in a methanol solution containing 1.5% H2O2 before antigen retrieval. After secondary antibody, color reaction was performed using Vectastain Elite ABC HRP Kit (Peroxidase, Standard) (Vector Laboratories) as detailed per the manufacturer’s protocol. Slides were exposed using DAB Substrate Kit (Thermo Scientific) and mounted in Permount Mounting Medium (Fisher Chemical). Antibody sources and dilutions are listed in Supplementary Table 4; Protein markers of various stomach cell type were listed in Supplementary Table 7. Hematoxylin and eosin (H&E) staining was performed by the Washington University in St. Louis DDRCC-AITAC Morphology Core. In Situ hybridization was used to detect RNA expression of Prkaa1 and Prkaa2 using RNAscope 2.5 HD-Brown kit according to manufacturer’s instructions (Advanced Cell Diagnostics). To reduce background staining in parietal cell, slides were pretreated with 0.3M hydrochloric acid for 30 minutes. Negative controls were used according to manufacturer’s instructions.
Gene Set Enrichment Analysis (GSEA)
For parietal cell isolation, stomachs from Atp4b-cre;Rosa mT/mG mice were harvested and washed well with PBS as described previously (Lo et al., 2017). The forestomach and antrum were removed. The remaining corpus tissue was minced with a razor blade then mechanically dissociated using a 50 μm Medicon (BD Biosciences) for two 30-second pulses. Tissue chunks were incubated in 10 ml HBSS with 5 mM EDTA and 1 mM DTT with vigorous shaking for 1 h at 37°C, then run through a 100 μm filter. Any remaining chunks of tissue were incubated in 10 ml RPMI 1640 with 5% BSA (Sigma) and 1.5 mg/ml Dispase II (Stem Cell Technologies) with vigorous shaking for 1.5 h at 37°C, then filtered a gain. Dissociated cells were washed three times with cold HBSS. Cells were resuspended in PBS with 1% BSA and 5 mM EDTA, then sorted into a GFP+ population (parietal cells) and a tdTomato+ population (non-parietal cells) in 500 μl RNA protect reagent (Qiagen) using a MoFlo FACS machine (Dako/Cytomation). Parietal cell enrichment was verified via cyto-spinning a sample from the enriched population onto glass slides and staining with hematoxylin and eosin. RNA was isolated from both populations using an RNeasy Micro Kit (Qiagen), following the manufacturers protocol. For microarray, samples were processed and hybridized to Affymetrix Mouse Gene 2.0 ST by the Washington University Genome Technology Access Core (GTAC). GeneChips were analyzed with Partek Genomic Suite 6.6 (Partek, Inc.) analysis software using default settings (Subramanian et al., 2005).
Broad Institute GSEA software used to map gene symbols, then GSEA were run using C5.BP (Gene Ontology Biological Process) v3.0 and v6.2, using publicly available GMX files (Broad Institute).
Quantitative PCR
Total RNA was extracted from the corpus of the stomach and isolated using RNeasy Mini Kit (Qiagen) per the manufacturer’s protocol. Quality of mRNA was verified with a BioTek Take3 spectrophotometer. RNA was treated with DNase I (Invitrogen), and 1 μg RNA was reverse-transcribed to make cDNA with SuperScript III (Invitrogen) following the manufacturer’s protocol. qRT-PCR was performed using PowerUp SYBR Green Master Mix (ThermoFisher) and gene specific primers on a QuantStudio 3 PCR System (ThermoFisher) and data analyzed using QuantStudio Design & Analysis Software. Every run was standardized to TATA Box Binding Protein (TBP) primers and all samples were run in triplicate. All primers were exon-spanning when possible, (i.e. for genes having multiple exons of sufficient length). For full list of qPCR primers, see Supplementary Table 5.
Western Blots
Approximately 100 mg of mouse stomach corpus tissue was lysed in T-PER Tissue Protein Extraction Reagent (Thermo) with 1× protease/phosphatase inhibitor cocktail (Thermo). Protein concentrations were measured using the DC protein assay (BioRad). 20-50 μg protein was separated using a 10% NuPAGE SDS-polyacrylamide gel electrophoresis (SDS-PAGE) gel (Thermo), then transferred to PVDF membranes (Millipore). Membranes were incubated with primary antibody overnight at 4C then with infrare d fluorescent dye-conjugated secondary antibodies (LI-COR Biosciences) for one hour. Protein signal intensities were normalized against a tubulin loading control for each sample. Antibody sources and dilutions are listed in Supplementary Table 4.
Basal Gastric Juice pH Measurement
Mice were fasted 12 hours prior to pH measurements but given free access to water. Mice were anesthetized with isothesia (Henry Schein Animal Health) and the gastrointestinal tract was exposed. With the gastroduodenal junction clamped 0.2 cc of nonbuffered DNase-/RNase-free water (Sigma-Aldrich) was injected into the stomach and aspirated after 4 min. The aspirate was centrifuged at 800g for 3 min, and the pH was measured in triplicate with a recalibrated UB-10 (Denver Instruments) using a combination PY-P22 probe with a 5-mm tip (Lo et al., 2017).
Electron Microscopy
Stomach corpus tissue was collected as described above, fixed overnight at 4°C in modified Karnovsky’s fixative, and sectioned into rings. Tissue rings were processed for EM by the Washington University in St. Louis Department of Pathology and Immunology Electron Microscopy Facility.
QUANTIFICATION AND STATISTICAL ANALYSIS
Imaging and Quantifications
Fluorescence microscopy was performed using a Zeiss Axiovert 200 microscope with an Axiocam MRM camera and Apotome II instrument for grid-based optical sectioning. Immunofluorescence images were taken on a Zeiss Apotome (Zeiss). Bright field images were taken on a 2.0 HT Nanozoomer (Hamamatsu) whole slide scanner or Olympus BX43 light microscope. For imaging of RNAscope samples, individual images were taken at 40x and stitched together digitally. Images were analyzed and post-imaging adjustments were performed with Adobe Photoshop CS6. All time points and treatments were quantified with at least three mice, with representatives from both genders. Quantification of BrdU+ proliferative cells was conducted by counting at least 40 fully integrated glands from multiple, randomly selected regions of the stomach. Antral regions were omitted from selection due to difference in cell population present in antral gastric units. Parietal cell nucleus eccentricity was measured from the center of the nearest cell membrane border to the nuclear membrane. Parietal cell number, nucleus eccentricity and largest diameter were quantified using AxioVision 4.9.1 software (Zeiss). Quantifications of PC number, PC size, proliferation, and nucleus eccentricity were conducted blindly to prevent experimental bias. Mitochondria abundance was quantified using ImageJ (NIH). Green/red area ratio analysis from gastroids was conducted using the Cytation 3 (Biotek) Imaging and multi-mode microscope by exporting images into separate red or green channels, green or red cells area of gastroids was measured automatically by Cytation 3.
Graphs and Statistics
All graphs and statistics were performed in Prism (GraphPad). Sample sizes were determined based on power analysis to optimize statistical significance mitigated by practical concerns to minimize wasting mice. For quantifications of BrdU+ cells, KLF4+ cells, PC number, PC size, nucleus eccentricity, and other cell lineages, each data point graphed represents the mean value collected from a single mouse from which at least 40 glands were counted unless otherwise stated in figure legends. Statistics for cell counts and area measurements were done by Student’s f-test (in the case of pair-wise analysis of significance). For comparisons between multiple groups, one-way ANOVA with Dunnett’s multiple comparison post-hoc test was used to determine significance. Data were generally expressed as mean ± standard error of mean (SEM), as single datapoints plotted were almost always means of 40+ counts, so means on plots were means of means. P < 0.05 was considered statistically significant for interpretation in the text. For the metformin dose-response analysis, a paired t-test was performed on the area under curve calculated for metformin-dosed and metformin plus AMPK inhibitor organoids from the same mouse with the y-axis intercept at the vehicle treatment used as the left most point in the curve for both inhibitor and non-inhibitor-treated curves. Line art was generated in Adobe Illustrator, Statistical analysis breakdown of all data is list in Supplementary Table 6.
DATA AND CODE AVAILABILITY
The accession number for the microarray data files reported in this paper is NCBI GEO: GSE103570 and GSE141673
https://www.ncbi.nlm.nih.gov/geo/query/acc.cgi?acc=GSE103570
https://www.ncbi.nlm.nih.gov/geo/query/acc.cgi?acc=GSE141673
Supplementary Material
KEY RESOURCES TABLE
| REAGENT or RESOURCE | SOURCE | IDENTIFIER |
|---|---|---|
| Antibodies | ||
| goat anti-VEGFB | Santa Cruz | Cat#sc-1876; RRID:AB_2213301 |
| rabbit anti-human gastric intrinsic factor | gift of Dr. David Alpers, Washington University | N/A |
| mouse anti-LKB1 | Cell Signaling | Cat#sc-32245; RRID:AB_627890 |
| rabbit anti-AMPKα | Cell Signaling | Cat#2532; RRID:AB_330331 |
| rabbit anti-AMPKα2 | Sigma-Aldrich | Cat#HPA044540; RRID:AB_2678977 |
| rabbit anti-Sox9 | Millipore | Cat#AB5535; RRID:AB_2239761 |
| rabbit anti-PGC1α | Abcam | Cat#ab54481; RRID:AB_881987 |
| rabbit anti-gastrin | Abcam | Cat#ab53085; RRID:AB_2108243 |
| rabbit anti-GFP | Santa Cruz | Cat#sc-8334; RRID:AB_641123 |
| rabbit anti-Ki67 | ABCAM | Cat#ab15580; RRID:AB_443209 |
| rabbit anti-phospho-S6 Ribosomal Protein (Ser240/244) | Cell Signaling | Cat# 2215S; RRID:AB_331682 |
| Mouse anti-Ezrin | Santa Cruz | Cat#sc-58758; RRID:AB_783303 |
| mouse anti-cytochromeC | Abcam | Cat#ab13575; RRID:AB_300470 |
| mouse anti-GFP | Santa Cruz | Cat#sc-9996; RRID:AB_627695 |
| mouse anti-BrdU | DSHB | Cat#G3G4; RRID:AB_2618097 |
| mouse anti-Mucin5AC | Abcam | Cat# ab3649 RRID: AB_2146844 |
| fluorescently conjugated GSII lectin; Alexa Fluor 647 | Invitrogen | Cat#L32451 |
| Prkaa1 Probe-RNAscope 2.5 HD- Brown | ACD | Cat#430831 |
| Prkaa2 Probe-RNAscope 2.5 HD-Brown | ACD | Cat#430841 |
| Bacterial and Virus Strains | ||
| Biological Samples | ||
| Chemicals, Peptides, and Recombinant Proteins | ||
| Tamoxifen | Toronto Research Chemicals Inc | Cat#T00600 |
| Metformin | Cayman Chemical Company | Cat#1115-70-4 |
| 5-Bromo-2-deoxyuridine (BrdU) | Sigma-Aldrich | Cat#B5002 |
| EDTA | Thermo-fisher | Cat#AM2691 |
| DTT | Gold Biotechnology | Cat#DTT10 |
| BSA | Sigma-Aldrich | Cat#A7906 |
| Matrigel | Corning | Cat#354234 |
| Triton X-100 | Lab Chem | Cat#LC262801 |
| Dispase II | Stem Cell Technologies | Cat#D4693-1G |
| Advanced DMEM/F12 | Invitrogen | Cat#12634-010 |
| HEPES | Gibco | Cat#15630-080 |
| Glutamax | Gibco | Cat#35050-061 |
| N- Acetylcysteine | Sigma-Aldrich | Cat#A9165 |
| EGF | Peprotech | Cat#315-09 |
| FGF10 | Peprotech | Cat#100-26 |
| Gastrin | Sigma-Aldrich | Cat#G9020 |
| ROCK Inhibitor (y-27632) | Sigma-Aldrich | Cat#Y0503 |
| N-2 | Gibco | Cat#17502-048 |
| B27 | Gibco | Cat#17504-044 |
| Primocin | Invivogen | Cat#ant-pm-1,2 |
| trypLE Express | Gibco | Cat#12605-028 |
| R-Spondin | Peprotech | Cat#120-38 |
| Noggin | Peprotech | Cat#120-10C |
| Wnt3a | Peprotech | Cat#315-20 |
| DPBS | Gibco | Cat#14190-136 |
| Dorsomorphin 2 HCl (Compound C) | SelleckChem | Cat#S7306 |
| Isothesia | Henry Schein Animal Health | Cat#NDC11695-6776-2 |
| Tween20 | Sigma-Aldrich | Cat#P5927 |
| ProLong Gold antifade mountant with | Molecular Probes | Cat#P36930 |
| DAPI | ||
| Permount Mounting Medium | Fisher Chemical | Cat#SP150 |
| DNase I | Invitrogen | Cat# 18047019 |
| SuperScript III | Invitrogen | Cat# 11752050 |
| PowerUp SYBR Green Master Mix | ThermoFisher | Cat# A25742 |
| RNA Protect Reagent | Qiagen | Cat# 76526 |
| T-PER Tissue Protein Extraction Reagent | ThermoFisher | Cat#78510 |
| 5-fluoro-2’-deoxyuridine | Sigma-Aldrich | Cat# F0503 |
| Critical Commercial Assays | ||
| RNeasy Micro Kit | Qiagen | Cat#74004 |
| Vectastain Elite ABC HRP Kit | Vector Laboratories | Cat#PK6100 |
| DAB Substrate Kit | Thermo Scientific | Cat#36000 |
| RNeasy Mini Kit | Qiagen | Cat#74104 |
| EdU Cell Proliferation Kit | BaseClick | Cat# BCK-EdU488 |
| GeneChip™ Mouse Gene 2.0 ST Array | Affymetrix | Cat#902119 |
| Deposited Data | ||
| Microarray data files | NBCI Gene Expression | GSE103570; GSE141673 |
| Experimental Models: Cell Lines | ||
| Experimental Models: Organisms/Strains | ||
| Mouse: Atp4b-cre: B6.FVB-Tg(Atp4b-cre)1Jig/JcmiJ | Jackson Laboratories | RRID:IMSR_ JAX: 030656 |
| Mouse: Rosa mT/mG: B6.129(Cg)-Gt(ROSA)26Sor tm4(ACTB-tdTomato,-EGFP)Luo/J(mT/mG) | Jackson laboratories | RRID:IMSR_JAX:007676 |
| Mouse: Wild type C57BL/6 | Jackson laboratories | RRID:IMSR_JAX:000664 |
| Mouse: Prkaa1 flox/flox : Prkaa1tm1.1Sjm/J | Jackson laboratories | RRID:IMSR_JAX:014141 |
| Mouse: Prkaa2 flox/flox : Prkaa2tm1.1Sjm/J | Jackson laboratories | RRID:IMSR_JAX:014142 |
| Mouse: PGC1α flox/flox : B6N.129(FVB)-Ppargc1αtm2.1Brsp/J | Jackson laboratories | RRID:IMSR_JAX:009666 |
| Mouse: PGC1α −/− : B6.129S4(FVB)-Ppargc1αtm1Brsp/J | Jackson laboratories | RRID:IMSR_JAX:008597 |
| Oligonucleotides | ||
| Primers for qPCR, see Table S5 | This paper | N/A |
| Primers for mouse genotyping, see Table S3 | This paper | N/A |
| Recombinant DNA | ||
| Software and Algorithms | ||
| QuantStudio3 Design and Analysis Software | ThermoFisher | https://www.thermofisher.com/us/en/home/technical-resources/software-downloads/ab-quantstudio-3-and-5-real-time-pcr-system.html |
| Photoshop CS6 | Adobe | RRID:SCR_014199; https://www.adobe.com/downloads.html |
| Partek Genomic Suite 6.6 | Partex Incorporated | http://www.partek.com/partek-genomics-suite/ |
| GSEA-P Software | Broad Institute | RRID:SCR_003199; http://software.broadinstitute.org/gsea/index.jsp |
| NDP.View2 | Hamamatsu Photonics | Cat#U12388-01 |
| Prism 3 | GraphPad | RRID:SCR_002798; https://www.graphpad.com/scientific-software/prism/ |
| Cytation 3 cell imaging multi-mode reader | BioTek | Cat# BTCYT3MV |
| Image J | NIH | https://imagej.nih.gov/ij/ |
| AxioVision 4.9.1 | Zeiss | https://www.zeiss.com/microscopy/us/downloads/axiovision-downloads.html |
| Other | ||
| REACTOME_ACTIVATED_AMPK_STIMULATES_FATTY_ACID_OXIDATION_IN_MUSCLE | N/A | RRID:SCR_003199; REACT_11163 |
| GO_CELLULAR_RESPIRATION | MGI Gene Ontology | RRID:SCR_006447; GO:0045333 |
| GO_MITOCHONDRIAL_RESPIRATORY_CHAIN_COMPLEX_ASSEMBLY | MGI Gene Ontology | RRID:SCR_006447; GO:0033108 |
| GO_OXIDATIVE_PHOSPHORYLATION | MGI Gene Ontology | RRID:SCR_006447; GO:0006119 |
| GO_ELECTRON_TRANSPORT_CHAIN | MGI Gene Ontology | RRID:SCR_006447; GO:0022900 |
| GO_ENERGY_DERIVATION_BY_OXIDATION_OF_ORGANIC_COMPOUNDS | MGI Gene Ontology | RRID:SCR_006447; GO:0015980 |
| GO_GENERATION_OF_PRECURSOR_METABOLITES_AND_ENERGY | MGI Gene Ontology | RRID:SCR_006447; GO:0006091 |
| GO_ORGANIC_ACID_CATABOLIC_PROCESS | MGI Gene Ontology | RRID:SCR_006447; GO:0016054 |
| GO_DIGESTIVE_SYSTEM_PROCESS | MGI Gene Ontology | RRID:SCR_006447; GO:0022600 |
| GO_MITOCHONDRIAL_RESPIRATORY_CHAIN_COMPLEX_I_BIOGENESIS | MGI Gene Ontology | RRID:SCR_006447; |
| GO_MITOCHONDRIAL_TRANSLATION | MGI Gene Ontology | RRID:SCR_006447; GO:0032543 |
| GO_EPIDERMIS_DEVELOPMENT | MGI Gene Ontology | RRID:SCR_006447; GO:0008544 |
| GO_EPITHELIAL_CELL_DIFFERENTIATION | MGI Gene Ontology | RRID:SCR_006447; GO:0030855 |
| GO_MORPHOGENESIS_OF_AN_EPITHELIUM | MGI Gene Ontology | RRID:SCR_006447; GO:0002009 |
| GO_TISSUE_DEVELOPMENT | MGI Gene Ontology | RRID:SCR_006447 |
| GO_REGULATION_OF_EMBRYONIC_DEVELOPMENT | MGI Gene Ontology | RRID:SCR_006447; GO:0045995 |
Highlights.
AMPK promotes generation of acid-secreting parietal cells from stem cells (73 characters)
Metformin slows progenitor cell proliferation by activating AMPK and KLF4 (73 characters)
Metformin induces parietal cell maturation by activating AMPK and PGC1a (71 characters)
ACKNOWLEDGMENTS
The work is supported by National Institute of Diabetes and Digestive and Kidney Diseases (NIDDK) awards DK094989, DK105129, and DK110406, by the Alvin J. Siteman Cancer Center-Barnes Jewish Hospital Foundation Cancer Frontier Fund, NIH National Cancer Institute P30 CA091842, and the Barnard Trust (to JCM); National Institute of General Medical Sciences (NIGMS) award GM103757 and NIDDK award DK077653 (to MAT); National Key R&D Program of China Awards 2017YFC0908300, 2017YFC0908305, Liaoning Province Central Guided Local Science and Technology Development Special Fund 2018107004 (to ZNW); NIH Shared Instrumentation Grant S10 RR0227552 (for Nanozoomer slide scanning). We thank the Advanced Imaging and Tissue Analysis Core (AITAC) of the NIDDK-funded (P30 DK052574) Digestive Disease Research Core Center for histological and microscopic support, as well as the Washington University Center for Cellular imaging (WUCCI), which is supported by Washington University School of Medicine, The Children’s Discovery Institute of Washington University and St. Louis Children’s Hospital (CDI-CORE-2015-505 and CDI-CORE-2019-813) and the Foundation for Barnes-Jewish Hospital (3770 and 4642), also in conjunction with the Diabetes Research Center (P30 DK020579). We thank Karen Green of Department of Pathology Electron Microscopy Center and the Genome Technology Access Core (GTAC) at Washington University for GeneChip processing.
Footnotes
Publisher's Disclaimer: This is a PDF file of an unedited manuscript that has been accepted for publication. As a service to our customers we are providing this early version of the manuscript. The manuscript will undergo copyediting, typesetting, and review of the resulting proof before it is published in its final form. Please note that during the production process errors may be discovered which could affect the content, and all legal disclaimers that apply to the journal pertain.
Declaration of Interests
The authors declare that they have no conflicts of interest.
REFERENCES
- Abe K, Irie K, Nakanishi H, Suzuki H, and Fujiyoshi Y (2018). Crystal structures of the gastric proton pump. Nature 556, 214–218. [DOI] [PubMed] [Google Scholar]
- Adami JG (1900). On growth and overgrowth In “Festschrift” in honor of Abraham Jacobi, MD, LLD: to commemorate the seventieth anniversary of his birth, May sixth, 1900, Huber F, Sondern FE (eds) (New Rochelle, NY: Knickerbocker Press; ), pp. 422–432. [Google Scholar]
- Adami JG, and Nicholls AG (1910). The principles of pathology (Philadelphia: : Lea & Febiger, 1908-1909). [Google Scholar]
- Babcook MA, Shukla S, Fu P, Vazquez EJ, Puchowicz MA, Molter JP, Oak CZ, MacLennan GT, Flask CA, Lindner DJ, et al. (2014). Synergistic simvastatin and metformin combination chemotherapy for osseous metastatic castration-resistant prostate cancer. Mol Cancer Ther 13, 2288–2302. [DOI] [PMC free article] [PubMed] [Google Scholar]
- Bao X, Tang J, Lopez-Pajares V, Tao S, Qu K, Crabtree GR, and Khavari PA (2013). ACTL6a enforces the epidermal progenitor state by suppressing SWI/SNF-dependent induction of KLF4. Cell Stem Cell 12, 193–203. [DOI] [PMC free article] [PubMed] [Google Scholar]
- Barker N, Huch M, Kujala P, van de Wetering M, Snippert HJ, van Es JH, Sato T, Stange DE, Begthel H, van den Born M, et al. (2010). Lgr5(+ve) stem cells drive self-renewal in the stomach and build long-lived gastric units in vitro. Cell Stem Cell 6, 25–36. [DOI] [PubMed] [Google Scholar]
- Bockerstett KA, Lewis SA, Wolf KJ, Noto CN, Jackson NM, Ford EL, Ahn TH, and DiPaolo RJ (2019). Single-cell transcriptional analyses of spasmolytic polypeptide-expressing metaplasia arising from acute drug injury and chronic inflammation in the stomach. Gut. [DOI] [PMC free article] [PubMed] [Google Scholar]
- Bredemeyer AJ, Geahlen JH, Weis VG, Huh WJ, Zinselmeyer BH, Srivatsan S, Miller MJ, Shaw AS, and Mills JC (2009). The gastric epithelial progenitor cell niche and differentiation of the zymogenic (chief) cell lineage. Dev Biol 325, 211–224. [DOI] [PMC free article] [PubMed] [Google Scholar]
- Burclaff J, Osaki LH, Liu D, Goldenring JR, and Mills JC (2017). Targeted Apoptosis of Parietal Cells Is Insufficient to Induce Metaplasia in Stomach. Gastroenterology 152, 762–766 e767. [DOI] [PMC free article] [PubMed] [Google Scholar]
- Burclaff J, Willet S, Saenz JB, and Mills J (2019). Proliferation and Differentiation of Gastric Mucous Neck and Chief Cells During Homeostasis and Injury-induced Metaplasia. Gastroenterology. [DOI] [PMC free article] [PubMed] [Google Scholar]
- Chava S, Chennakesavulu S, Gayatri BM, and Reddy ABM (2018). A novel phosphorylation by AMP-activated kinase regulates RUNX2 from ubiquitination in osteogenesis over adipogenesis. Cell Death Dis 9, 754. [DOI] [PMC free article] [PubMed] [Google Scholar]
- Cheung KS, Chan EW, Wong AYS, Chen L, Seto WK, Wong ICK, and Leung WK (2019). Metformin Use and Gastric Cancer Risk in Diabetic Patients After Helicobacter pylori Eradication. J Natl Cancer Inst 111, 484–489. [DOI] [PubMed] [Google Scholar]
- Cliff TS, Wu T, Boward BR, Yin A, Yin H, Glushka JN, Prestegaard JH, and Dalton S (2017). MYC Controls Human Pluripotent Stem Cell Fate Decisions through Regulation of Metabolic Flux. Cell Stem Cell 21, 502–516 e509. [DOI] [PMC free article] [PubMed] [Google Scholar]
- Cuyas E, Verdura S, Llorach-Pares L, Fernandez-Arroyo S, Luciano-Mateo F, Cabre N, Stursa J, Werner L, Martin-Castillo B, Viollet B, et al. (2018). Metformin directly targets the H3K27me3 demethylase KDM6A/UTX. Aging Cell 17, e12772. [DOI] [PMC free article] [PubMed] [Google Scholar]
- Decensi A, Puntoni M, Goodwin P, Cazzaniga M, Gennari A, Bonanni B, and Gandini S (2010). Metformin and cancer risk in diabetic patients: a systematic review and meta-analysis. Cancer Prev Res (Phila) 3, 1451–1461. [DOI] [PubMed] [Google Scholar]
- Demitrack ES, Gifford GB, Keeley TM, Horita N, Todisco A, Turgeon DK, Siebel CW, and Samuelson LC (2017). NOTCH1 and NOTCH2 regulate epithelial cell proliferation in mouse and human gastric corpus. Am J Physiol Gastrointest Liver Physiol 312, G133–G144. [DOI] [PMC free article] [PubMed] [Google Scholar]
- El-Zaatari M, Zavros Y, Tessier A, Waghray M, Lentz S, Gumucio D, Todisco A, and Merchant JL (2010). Intracellular calcium release and protein kinase C activation stimulate sonic hedgehog gene expression during gastric acid secretion. Gastroenterology 139, 2061–2071 e2062. [DOI] [PMC free article] [PubMed] [Google Scholar]
- Franic TV, Judd LM, Robinson D, Barrett SP, Scarff KL, Gleeson PA, Samuelson LC, and Van Driel IR (2001). Regulation of gastric epithelial cell development revealed in H(+)/K(+)-ATPase beta-subunit- and gastrin-deficient mice. Am J Physiol Gastrointest Liver Physiol 281, G1502–1511. [DOI] [PubMed] [Google Scholar]
- Gautam J, Khedgikar V, Kushwaha P, Choudhary D, Nagar GK, Dev K, Dixit P, Singh D , Maurya R, and Trivedi R (2017). Formononetin, an isoflavone, activates AMP-activated protein kinase/beta-catenin signalling to inhibit adipogenesis and rescues C57BL/6 mice from high-fat diet-induced obesity and bone loss. Br J Nutr 117, 645–661. [DOI] [PubMed] [Google Scholar]
- Hall J, Guo G, Wray J, Eyres I, Nichols J, Grotewold L, Morfopoulou S, Humphreys P, Mansfield W, Walker R, et al. (2009). Oct4 and LIF/Stat3 additively induce Kruppel factors to sustain embryonic stem cell self-renewal. Cell Stem Cell 5, 597–609. [DOI] [PubMed] [Google Scholar]
- Hao Z, Sheng Y, Duncan GS, Li WY, Dominguez C, Sylvester J, Su YW, Lin GH, Snow BE, Brenner D, et al. (2017). K48-linked KLF4 ubiquitination by E3 ligase Mule controls T-cell proliferation and cell cycle progression. Nat Commun 8, 14003. [DOI] [PMC free article] [PubMed] [Google Scholar]
- Horst D, Gu X, Bhasin M, Yang Q, Verzi M, Lin D, Joseph M, Zhang X, Chen W, Li YP, et al. (2010). Requirement of the epithelium-specific Ets transcription factor Spdef for mucous gland cell function in the gastric antrum. J Biol Chem 285, 35047–35055. [DOI] [PMC free article] [PubMed] [Google Scholar]
- Huh WJ, Khurana SS, Geahlen JH, Kohli K, Waller RA, and Mills JC (2012). Tamoxifen induces rapid, reversible atrophy, and metaplasia in mouse stomach. Gastroenterology 142, 21–24 e27. [DOI] [PMC free article] [PubMed] [Google Scholar]
- Jager S, Handschin C, St-Pierre J, and Spiegelman BM (2007). AMP-activated protein kinase (AMPK) action in skeletal muscle via direct phosphorylation of PGC-1alpha. Proc Natl Acad Sci U S A 104, 12017–12022. [DOI] [PMC free article] [PubMed] [Google Scholar]
- Jain RN, Al-Menhali AA, Keeley TM, Ren J, El-Zaatari M, Chen X, Merchant JL, Ross TS, Chew CS, and Samuelson LC (2008). Hip1r is expressed in gastric parietal cells and is required for tubulovesicle formation and cell survival in mice. J Clin Invest 118, 2459–2470. [DOI] [PMC free article] [PubMed] [Google Scholar]
- Jiang H, Wang W, Zhang Y, Yao WW, Jiang J, Qin B, Yao WY, Liu F, Wu H, Ward TL, et al. (2015). Cell Polarity Kinase MST4 Cooperates with cAMP-dependent Kinase to Orchestrate Histamine-stimulated Acid Secretion in Gastric Parietal Cells. J Biol Chem 290, 28272–28285. [DOI] [PMC free article] [PubMed] [Google Scholar]
- Karam SM (2010). A focus on parietal cells as a renewing cell population. World J Gastroenterol 16, 538–546. [DOI] [PMC free article] [PubMed] [Google Scholar]
- Karam SM, and Leblond CP (1993). Dynamics of epithelial cells in the corpus of the mouse stomach. I. Identification of proliferative cell types and pinpointing of the stem cell. Anat Rec 236, 259–279. [DOI] [PubMed] [Google Scholar]
- Karam SM, Li Q, and Gordon JI (1997). Gastric epithelial morphogenesis in normal and transgenic mice. Am J Physiol 272, G1209–1220. [DOI] [PubMed] [Google Scholar]
- Katz JP, Perreault N, Goldstein BG, Actman L, McNally SR, Silberg DG, Furth EE, and Kaestner KH (2005). Loss of Klf4 in mice causes altered proliferation and differentiation and precancerous changes in the adult stomach. Gastroenterology 128, 935–945. [DOI] [PubMed] [Google Scholar]
- Khurana SS, Riehl TE, Moore BD, Fassan M, Rugge M, Romero-Gallo J, Noto J, Peek RM Jr., Stenson WF, and Mills JC (2013). The hyaluronic acid receptor CD44 coordinates normal and metaplastic gastric epithelial progenitor cell proliferation. J Biol Chem 288, 16085–16097. [DOI] [PMC free article] [PubMed] [Google Scholar]
- Kim EK, Lim S, Park JM, Seo JK, Kim JH, Kim KT, Ryu SH, and Suh PG (2012). Human mesenchymal stem cell differentiation to the osteogenic or adipogenic lineage is regulated by AMP-activated protein kinase. J Cell Physiol 227, 1680–1687. [DOI] [PubMed] [Google Scholar]
- Kim TH, and Shivdasani RA (2011). Notch signaling in stomach epithelial stem cell homeostasis. J Exp Med 208, 677–688. [DOI] [PMC free article] [PubMed] [Google Scholar]
- Koh JH, Hancock CR, Terada S, Higashida K, Holloszy JO, and Han DH (2017). PPARbeta Is Essential for Maintaining Normal Levels of PGC-1alpha and Mitochondria and for the Increase in Muscle Mitochondria Induced by Exercise. Cell Metab 25, 1176–1185 e1175. [DOI] [PMC free article] [PubMed] [Google Scholar]
- Krock B, Skuli N, and Simon MC (2011). The tumor suppressor LKB1 emerges as a critical factor in hematopoietic stem cell biology. Cell Metab 13, 8–10. [DOI] [PubMed] [Google Scholar]
- Kwak HJ, Jeong MY, Um JY, and Park J (2019). beta -Lapachone Regulates Obesity through Modulating Thermogenesis in Brown Adipose Tissue and Adipocytes: Role of AMPK Signaling Pathway. Am J Chin Med 47, 803–822. [DOI] [PubMed] [Google Scholar]
- Lee CK, Jung M, Jung I, Heo SJ, Jeong YH, An JY, Kim HI, Cheong JH, Hyung WJ, Noh SH, et al. (2016). Cumulative Metformin Use and Its Impact on Survival in Gastric Cancer Patients After Gastrectomy. Ann Surg 263, 96–102. [DOI] [PubMed] [Google Scholar]
- Lee SY, and Long F (2018). Notch signaling suppresses glucose metabolism in mesenchymal progenitors to restrict osteoblast differentiation. J Clin Invest 128, 5573–5586. [DOI] [PMC free article] [PubMed] [Google Scholar]
- Li Q, Jia Z, Wang L, Kong X, Li Q, Guo K, Tan D, Le X, Wei D, Huang S, et al. (2012). Disruption of Klf4 in villin-positive gastric progenitor cells promotes formation and progression of tumors of the antrum in mice. Gastroenterology 142, 531–542. [DOI] [PMC free article] [PubMed] [Google Scholar]
- Li WY, Han Y, Xu HM, Wang ZN, Xu YY, Song YX, Xu H, Yin SC, Liu XY, and Miao ZF (2019a). Smoking status and subsequent gastric cancer risk in men compared with women: a meta-analysis of prospective observational studies. BMC Cancer 19, 377. [DOI] [PMC free article] [PubMed] [Google Scholar]
- Li Z, Liu X, Zhu Y, Du Y, Liu X, Lv L, Zhang X, Liu Y, Zhang P, and Zhou Y (2019b). Mitochondrial Phosphoenolpyruvate Carboxykinase Regulates Osteogenic Differentiation by Modulating AMPK/ULK1-Dependent Autophagy. Stem Cells. [DOI] [PMC free article] [PubMed] [Google Scholar]
- Lo HG, Jin RU, Sibbel G, Liu D, Karki A, Joens MS, Madison BB, Zhang B, Blanc V, Fitzpatrick JA, et al. (2017). A single transcription factor is sufficient to induce and maintain secretory cell architecture. Genes Dev 31, 154–171. [DOI] [PMC free article] [PubMed] [Google Scholar]
- Lopez M, Nogueiras R, Tena-Sempere M, and Dieguez C (2016). Hypothalamic AMPK: a canonical regulator of whole-body energy balance. Nat Rev Endocrinol 12, 421–432. [DOI] [PubMed] [Google Scholar]
- Maloum F, Allaire JM, Gagne-Sansfacon J, Roy E, Belleville K, Sarret P, Morisset J, Carrier JC, Mishina Y, Kaestner KH, et al. (2011). Epithelial BMP signaling is required for proper specification of epithelial cell lineages and gastric endocrine cells. Am J Physiol Gastrointest Liver Physiol 300, G1065–1079. [DOI] [PMC free article] [PubMed] [Google Scholar]
- Marofi F, Vahedi G, Solali S, Alivand M, Salarinasab S, Zadi Heydarabad M, and Farshdousti Hagh M (2019). Gene expression of TWIST1 and ZBTB16 is regulated by methylation modifications during the osteoblastic differentiation of mesenchymal stem cells. J Cell Physiol 234, 6230–6243. [DOI] [PubMed] [Google Scholar]
- Matsuo J, Kimura S, Yamamura A, Koh CP, Hossain MZ, Heng DL, Kohu K, Voon DC, Hiai H, Unno M, et al. (2017). Identification of Stem Cells in the Epithelium of the Stomach Corpus and Antrum of Mice. Gastroenterology 152, 218–231 e214. [DOI] [PubMed] [Google Scholar]
- Mattila J, Kokki K, Hietakangas V, and Boutros M (2018). Stem Cell Intrinsic Hexosamine Metabolism Regulates Intestinal Adaptation to Nutrient Content. Dev Cell 47, 112–121 e113. [DOI] [PMC free article] [PubMed] [Google Scholar]
- McCracken KW, Aihara E, Martin B, Crawford CM, Broda T, Treguier J, Zhang X, Shannon JM, Montrose MH, and Wells JM (2017). Wnt/beta-catenin promotes gastric fundus specification in mice and humans. Nature 541, 182–187. [DOI] [PMC free article] [PubMed] [Google Scholar]
- Mills JC, Syder AJ, Hong CV, Guruge JL, Raaii F, and Gordon JI (2001). A molecular profile of the mouse gastric parietal cell with and without exposure to Helicobacter pylori. Proc Natl Acad Sci U S A 98, 13687–13692. [DOI] [PMC free article] [PubMed] [Google Scholar]
- Mills JC, and Taghert PH (2012). Scaling factors: transcription factors regulating subcellular domains. Bioessays 34, 10–16. [DOI] [PMC free article] [PubMed] [Google Scholar]
- Molloy AM, Ardill J, and Tomkin GH (1980). The effect of metformin treatment on gastric acid secretion and gastrointestinal hormone levels in normal subjects. Diabetologia 19, 93–96. [DOI] [PubMed] [Google Scholar]
- Moore BD, Khurana SS, Huh WJ, and Mills JC (2016). Hepatocyte nuclear factor 4alpha is required for cell differentiation and homeostasis in the adult mouse gastric epithelium. Am J Physiol Gastrointest Liver Physiol 311, G267–275. [DOI] [PMC free article] [PubMed] [Google Scholar]
- Muzumdar MD, Tasic B, Miyamichi K, Li L, and Luo L (2007). A global double-fluorescent Cre reporter mouse. Genesis 45, 593–605. [DOI] [PubMed] [Google Scholar]
- Nighot MP, Nighot PK, Ma TY, Malinowska DH, Shull GE, Cuppoletti J, and Blikslager AT (2015). Genetic Ablation of the ClC-2 Cl-Channel Disrupts Mouse Gastric Parietal Cell Acid Secretion. PLoS One 10, e0138174. [DOI] [PMC free article] [PubMed] [Google Scholar]
- Ocampo A, Reddy P, Martinez-Redondo P, Platero-Luengo A, Hatanaka F, Hishida T, Li M, Lam D, Kurita M, Beyret E, et al. (2016). In Vivo Amelioration of Age-Associated Hallmarks by Partial Reprogramming. Cell 167, 1719–1733 e1712. [DOI] [PMC free article] [PubMed] [Google Scholar]
- Ohashi K, Ouchi N, Higuchi A, Shaw RJ, and Walsh K (2010). LKB1 deficiency in Tie2-Cre-expressing cells impairs ischemia-induced angiogenesis. J Biol Chem 285, 22291–22298. [DOI] [PMC free article] [PubMed] [Google Scholar]
- Ramsey VG, Doherty JM, Chen CC, Stappenbeck TS, Konieczny SF, and Mills JC (2007). The maturation of mucus-secreting gastric epithelial progenitors into digestive-enzyme secreting zymogenic cells requires Mist1. Development 134, 211–222. [DOI] [PubMed] [Google Scholar]
- Riera CE, Merkwirth C, De Magalhaes Filho CD, and Dillin A (2016). Signaling Networks Determining Life Span. Annu Rev Biochem 85, 35–64. [DOI] [PubMed] [Google Scholar]
- Rodriguez-Colman MJ, Schewe M, Meerlo M, Stigter E, Gerrits J, Pras-Raves M, Sacchetti A, Hornsveld M, Oost KC, Snippert HJ, et al. (2017). Interplay between metabolic identities in the intestinal crypt supports stem cell function. Nature 543, 424–427. [DOI] [PubMed] [Google Scholar]
- Roper J, and Yilmaz OH (2017). Metabolic Teamwork in the Stem Cell Niche. Cell Metab 25, 993–994. [DOI] [PMC free article] [PubMed] [Google Scholar]
- Ryall JG, Cliff T, Dalton S, and Sartorelli V (2015). Metabolic Reprogramming of Stem Cell Epigenetics. Cell Stem Cell 17, 651–662. [DOI] [PMC free article] [PubMed] [Google Scholar]
- Saenz JB, Burclaff J, and Mills JC (2016). Modeling Murine Gastric Metaplasia Through Tamoxifen-Induced Acute Parietal Cell Loss. Methods Mol Biol 1422, 329–339. [DOI] [PMC free article] [PubMed] [Google Scholar]
- Saenz JB, and Mills JC (2018). Acid and the basis for cellular plasticity and reprogramming in gastric repair and cancer. Nat Rev Gastroenterol Hepatol 15, 257–273. [DOI] [PMC free article] [PubMed] [Google Scholar]
- Savini M, Zhao Q, and Wang MC (2019). Lysosomes: Signaling Hubs for Metabolic Sensing and Longevity. Trends Cell Biol. [DOI] [PMC free article] [PubMed] [Google Scholar]
- Saxton RA, and Sabatini DM (2017). mTOR Signaling in Growth, Metabolism, and Disease. Cell 169, 361–371. [DOI] [PubMed] [Google Scholar]
- Shyh-Chang N, and Ng HH (2017). The metabolic programming of stem cells. Genes Dev 31, 336–346. [DOI] [PMC free article] [PubMed] [Google Scholar]
- Spicer Z, Miller ML, Andringa A, Riddle TM, Duffy JJ, Doetschman T, and Shull GE (2000). Stomachs of mice lacking the gastric H,K-ATPase alpha -subunit have achlorhydria, abnormal parietal cells, and ciliated metaplasia. J Biol Chem 275, 21555–21565. [DOI] [PubMed] [Google Scholar]
- Steinberg GR, and Carling D (2019). AMP-activated protein kinase: the current landscape for drug development. Nat Rev Drug Discov 18, 527–551. [DOI] [PubMed] [Google Scholar]
- Subramanian A, Tamayo P, Mootha VK, Mukherjee S, Ebert BL, Gillette MA, Paulovich A, Pomeroy SL, Golub TR, Lander ES, et al. (2005). Gene set enrichment analysis: a knowledge-based approach for interpreting genome-wide expression profiles. Proc Natl Acad Sci U S A 102, 15545–15550. [DOI] [PMC free article] [PubMed] [Google Scholar]
- Sunaga H, Matsui H, Anjo S, Syamsunarno MR, Koitabashi N, Iso T, Matsuzaka T, Shimano H, Yokoyama T, and Kurabayashi M (2016). Elongation of Long-Chain Fatty Acid Family Member 6 (Elovl6)-Driven Fatty Acid Metabolism Regulates Vascular Smooth Muscle Cell Phenotype Through AMP-Activated Protein Kinase/Kruppel-Like Factor 4 (AMPK/KLF4) Signaling. J Am Heart Assoc 5. [DOI] [PMC free article] [PubMed] [Google Scholar]
- Syder AJ, Karam SM, Mills JC, Ippolito JE, Ansari HR, Farook V, and Gordon JI (2004). A transgenic mouse model of metastatic carcinoma involving transdifferentiation of a gastric epithelial lineage progenitor to a neuroendocrine phenotype. Proc Natl Acad Sci U S A 101, 4471–4476. [DOI] [PMC free article] [PubMed] [Google Scholar]
- Theret M, Gsaier L, Schaffer B, Juban G, Ben Larbi S, Weiss-Gayet M, Bultot L, Collodet C, Foretz M, Desplanches D, et al. (2017). AMPKalpha1-LDH pathway regulates muscle stem cell self-renewal by controlling metabolic homeostasis. EMBO J 36, 1946–1962. [DOI] [PMC free article] [PubMed] [Google Scholar]
- Todisco A (2017). Regulation of Gastric Metaplasia, Dysplasia, and Neoplasia by Bone Morphogenetic Protein Signaling. Cell Mol Gastroenterol Hepatol 3, 339–347. [DOI] [PMC free article] [PubMed] [Google Scholar]
- Udd L, Katajisto P, Kyyronen M, Ristimaki AP, and Makela TP (2010). Impaired gastric gland differentiation in Peutz-Jeghers syndrome. Am J Pathol 176, 2467–2476. [DOI] [PMC free article] [PubMed] [Google Scholar]
- Uhlen M, Zhang C, Lee S, Sjostedt E, Fagerberg L, Bidkhori G, Benfeitas R, Arif M, Liu Z, Edfors F, et al. (2017). A pathology atlas of the human cancer transcriptome. Science 357. [DOI] [PubMed] [Google Scholar]
- van den Brink GR (2007). Hedgehog signaling in development and homeostasis of the gastrointestinal tract. Physiol Rev 87, 1343–1375. [DOI] [PubMed] [Google Scholar]
- Verzi MP, Khan AH, Ito S, and Shivdasani RA (2008). Transcription factor foxq1 controls mucin gene expression and granule content in mouse stomach surface mucous cells. Gastroenterology 135, 591–600. [DOI] [PMC free article] [PubMed] [Google Scholar]
- Vidoni C, Ferraresi A, Secomandi E, Vallino L, Gardin C, Zavan B, Mortellaro C, and Isidoro C (2019). Autophagy drives osteogenic differentiation of human gingival mesenchymal stem cells. Cell Commun Signal 17, 98. [DOI] [PMC free article] [PubMed] [Google Scholar]
- Wang YW, He SJ, Feng X, Cheng J, Luo YT, Tian L, and Huang Q (2017). Metformin: a review of its potential indications. Drug Des Devel Ther 11, 2421–2429. [DOI] [PMC free article] [PubMed] [Google Scholar]
- Wei Z, Gao F, Kim S, Yang H, Lyu J, An W, Wang K, and Lu W (2013). Klf4 organizes long-range chromosomal interactions with the oct4 locus in reprogramming and pluripotency. Cell Stem Cell 13, 36–47. [DOI] [PubMed] [Google Scholar]
- Weir HJ, Yao P, Huynh FK, Escoubas CC, Goncalves RL, Burkewitz K, Laboy R, Hirschey MD, and Mair WB (2017). Dietary Restriction and AMPK Increase Lifespan via Mitochondrial Network and Peroxisome Remodeling. Cell Metab 26, 884–896 e885. [DOI] [PMC free article] [PubMed] [Google Scholar]
- Wen Y, Liao G, Pritchard T, Zhao TT, Connelly JP, Pruett-Miller SM, Blanc V, Davidson NO, and Madison BB (2017). A stable but reversible integrated surrogate reporter for assaying CRlSPR/Cas9-stimulated homology-directed repair. J Biol Chem 292, 6148–6162. [DOI] [PMC free article] [PubMed] [Google Scholar]
- White JP, Billin AN, Campbell ME, Russell AJ, Huffman KM, and Kraus WE (2018). The AMPK/p27(Kip1) Axis Regulates Autophagy/Apoptosis Decisions in Aged Skeletal Muscle Stem Cells. Stem Cell Reports 11, 425–439. [DOI] [PMC free article] [PubMed] [Google Scholar]
- Willet SG, Lewis MA, Miao ZF, Liu D, Radyk MD, Cunningham RL, Burclaff J, Sibbel G, Lo HG, Blanc V, et al. (2018). Regenerative proliferation of differentiated cells by mTORC1-dependent paligenosis. EMBO J 37. [DOI] [PMC free article] [PubMed] [Google Scholar]
- Yan M, Audet-Walsh E, Manteghi S, Dufour CR, Walker B, Baba M, St-Pierre J, Giguere V, and Pause A (2016). Chronic AMPK activation via loss of FLCN induces functional beige adipose tissue through PGC-1alpha/ERRalpha. Genes Dev 30, 1034–1046. [DOI] [PMC free article] [PubMed] [Google Scholar]
- Ye L, Morse LR, Zhang L, Sasaki H, Mills JC, Odgren PR, Sibbel G, Stanley JR, Wong G, Zamarioli A, et al. (2015). Osteopetrorickets due to Snx10 deficiency in mice results from both failed osteoclast activity and loss of gastric acid-dependent calcium absorption. PLoS Genet 11, e1005057. [DOI] [PMC free article] [PubMed] [Google Scholar]
- Yilmaz OH, Katajisto P, Lamming DW, Gultekin Y, Bauer-Rowe KE, Sengupta S, Birsoy K, Dursun A, Yilmaz VO, Selig M, et al. (2012). mTORC1 in the Paneth cell niche couples intestinal stem-cell function to calorie intake. Nature 486, 490–495. [DOI] [PMC free article] [PubMed] [Google Scholar]
- Young NP, Kamireddy A, Van Nostrand JL, Eichner LJ, Shokhirev MN, Dayn Y, and Shaw RJ (2016). AmPk governs lineage specification through Tfeb-dependent regulation of lysosomes. Genes Dev 30, 535–552. [DOI] [PMC free article] [PubMed] [Google Scholar]
- Yu T, Chen X, Lin T, Liu J, Li M, Zhang W, Xu X, Zhao W, Liu M, Napier DL, et al. (2016). KLF4 deletion alters gastric cell lineage and induces MUC2 expression. Cell Death Dis 7, e2255. [DOI] [PMC free article] [PubMed] [Google Scholar]
- Yuan X, Yao PY, Jiang J, Zhang Y, Su Z, Yao W, Wang X, Gui P, Mullen M, Henry C, et al. (2017). MST4 kinase phosphorylates ACAP4 protein to orchestrate apical membrane remodeling during gastric acid secretion. J Biol Chem 292, 16174–16187. [DOI] [PMC free article] [PubMed] [Google Scholar]
- Zavros Y (2008). The adventures of sonic hedgehog in development and repair. IV. Sonic hedgehog processing, secretion, and function in the stomach. Am J Physiol Gastrointest Liver Physiol 294, G1105–1108. [DOI] [PubMed] [Google Scholar]
- Zhao Z, Hou N, Sun Y, Teng Y, and Yang X (2010). Atp4b promoter directs the expression of Cre recombinase in gastric parietal cells of transgenic mice. J Genet Genomics 37, 647–652. [DOI] [PubMed] [Google Scholar]
Associated Data
This section collects any data citations, data availability statements, or supplementary materials included in this article.
Supplementary Materials
Data Availability Statement
The accession number for the microarray data files reported in this paper is NCBI GEO: GSE103570 and GSE141673
https://www.ncbi.nlm.nih.gov/geo/query/acc.cgi?acc=GSE103570
https://www.ncbi.nlm.nih.gov/geo/query/acc.cgi?acc=GSE141673