

Summary
Cyclin-dependent kinase 7 (CDK7) is a central regulator of cell cycle and gene transcription. However, little is known about its impact on genomic instability and cancer immunity. Using a selective CDK7 inhibitor YKL-5–124, we demonstrated that CDK7 inhibition predominately disrupts cell cycle progression and induces DNA replication stress and genome instability in small cell lung cancer (SCLC) while simultaneously triggering immune response signaling. These tumor-intrinsic events provoke a robust immune surveillance program elicited by T cells, which is further enhanced by the addition of immune checkpoint blockade. Combining YKL-5–124 with anti-PD-1 offers significant survival benefit in multiple highly aggressive murine models of SCLC, providing a rationale for new combination regimens consisting of CDK7 inhibitors and immunotherapies.
Keywords: CDK7, cell-cycle, replication stress, genome instability, immunotherapy, anti-tumor immunity, single-cell analysis, small cell lung cancer
In Brief
Zhang et al. show that selective CDK7 inhibition with YKL-5–124 disrupts the cell cycle and causes replicative stress, eliciting an inflammatory response. YKL-5–124 in combination with anti-PD-1 therapy reduces tumor growth and increases survival in mouse models of small cell lung cancer.
Graphical Abstract
Introduction
Small cell lung cancer (SCLC) is one of the deadliest human cancers, accounting for about 15% of all lung cancer (van Meerbeeck et al., 2011). It often arises in heavy smokers and is characterized by rapid growth and early metastasis (Bunn et al., 2016; Semenova et al., 2015). Although SCLC patients often initially respond to chemotherapy, tumors nearly always recur within 6 to 12 months, resulting in a 5-year survival rate of less than 7% (van Meerbeeck et al., 2011).
Immune evasion is a hallmark of cancer (Schreiber et al., 2011). The development of therapies to enhance antitumor immune response, particularly antibodies blocking inhibitory immune-checkpoint proteins such as programmed cell death protein 1 (PD-1) have achieved clinical success in the management of various cancers (Sharma and Allison, 2015). The high tumor mutation burden (TMB) in SCLC provides a rationale for investigating the effect of immune checkpoint blockades (ICBs) in this tumor type (Alexandrov et al., 2013; George et al., 2015; Hellmann et al., 2018). Indeed, results from a phase 3 trial led to FDA approval of atezolizumab (anti-PD-L1) in combination with carboplatin and etoposide for the first-line treatment of patients with extensive stage (ES)-SCLC, despite achieving only a 2-month increase in overall survival (OS) (Horn et al., 2018). However, a large number of patients do not respond to ICB. This highlights the need to identify new combination regimens to trigger anti-tumor immunity.
CDK7 is a master regulator of cell cycle progression (Fisher and Morgan, 1994; Ganuza et al., 2012). CDK7 functions as the catalytic core of the CDK-activating kinase (CAK) complex and becomes activated by binding to Cyclin H and Mat1 (Harper and Elledge, 1998; Schachter and Fisher, 2013). The trimeric CAK complex activates several central cell cycle CDKs by phosphorylation (Larochelle et al., 2007; Merrick et al., 2008; Schachter et al., 2013). Temporal activation of these CDKs by the CAK complex ensures orderly progression within the cell cycle (Asghar et al., 2015). In addition, CAK is a component of the general transcription factor TFIIH, a protein complex important for RNA polymerase II (RNA pol II)-mediated transcription (Glover-Cutter et al., 2009; Larochelle et al., 2012; Serizawa et al., 1995; Shiekhattar et al., 1995). However, whether CDK7 kinase activity is indispensable for basal transcription remains controversial (Ganuza et al., 2012; Kanin et al., 2007; Serizawa et al., 1993). We previously reported that SCLC are sensitive to THZ1, a covalent inhibitor of CDK7 that also targets CDK12/13. Due to this dual specificity of THZ1, it was challenging to pinpoint the distinct role of CDK7 in regulating transcription and cell cycle progression respectively (Christensen et al., 2014). We have recently identified a new highly selective covalent CDK7 inhibitor, YKL-5–124, with no off-target effect on CDK12/13 (Olson et al., 2019). The discovery of YKL-5–124 confirmed the role of CDK7 in regulating cell cycle progression and suggested potential redundancies in its control of gene transcription.
While previous work has elucidated CDK7 as a master regulator of the cell cycle, its potential effects on DNA replication and genome stability, as well as its tumor intrinsic immune effect remain unknown. Using YKL-5–124, we studied the effect of CDK7 inhibition in triggering an immune response and explored the efficacy of combining YKL-5–124 with immunotherapy in mouse models.
Results
YKL-5–124 specifically targets CDK7 and disrupts cell cycle progression through inhibition of CDK7 CAK activity
To confirm that YKL-5–124 confers selective engagement of CDK7 over CDK12/13 in SCLC cells, we performed a competitive pulldown assay and examined the ability of YKL-5–124 to block the pulldown of CDK7-Cyclin H complexes or Cyclin K, the obligate binding partner of CDK12/13 (Kwiatkowski et al., 2014). YKL-5–124 efficiently prevented Cyclin H pulldown, but failed to block pulldown of Cyclin K (Figures 1A and S1A). These results confirm selective targeting of CDK7 by YKL-5–124, consistent with our recent findings in other cellular models (Olson et al., 2019).
Figure 1. YKL-5–124 specifically targets CDK7 and disrupts cell cycle progression through inhibition of CDK7 CAK activity.

(A) Competitive pulldown assay in mouse SCLC (mSCLC) RPP631 cells treated with YKL-5–124 at indicated concentrations for 6 hr. Western blotting showing the pulldown (PD) or input of Cyclin H and Cyclin K. (B) Western blotting of RNA Pol II total (RNAP II), RNA Pol II p-Ser 2 and 5, CDK1, CDK2, pCDK1 (Thr161), pCDK2 (Thr160), Tubulin in RPP631 and human SCLC (hSCLC) DMS79 cells after treatment with YKL-5–124 at indicated concentrations for 24 hr. (C) Cell viability was measured at indicated time points (normalized to day 0) upon treatment with DMSO or increasing concentrations of YKL-5–124 in RPP631 and DMS79. (D) Bar graph showing the cell distribution in G1, S and G2/M phase quantified by flow cytometry analysis of Propidium Iodide (PI)-staining in RPP631 and DMS79 after YKL-5–124 treatment for 72 hr. (E) Western blotting analysis of Cyclin E and Tubulin levels in RPP631 and DMS79 after treatment with YKL-5–124 at indicated concentrations for 24 hr. (F) RT-qPCR analysis of CCNE1, CCNB1, CCND1 and CCNA1 gene expression in RPP631 and DMS79 after treatment for 24 hr. The data were presented as fold changes compared to the vehicle (DMSO). (C, D, F) Data shown as means ± SD of three independent experiments run in triplicates. (F) Unpaired two-tailed t-test. *p < 0.05. See also Figure S1.
We next examined direct targets of CDK7, CDK1 and CDK2. YKL-5–124 robustly inhibited CDK1 and CDK2 T-loop phosphorylation in a representative panel of SCLC lines at concentrations as low as 50 nM (Figures 1B and S1B). In contrast, YKL-5–124 treatment had no effect on C-terminal domain (CTD) phosphorylation of RNA Pol II (Figure 1B), indicating that selective CDK7 inhibition does not inhibit global transcription. We further confirmed that dual inhibition of CDK7 and CDK12/13 is required for inhibition of RNA Pol II CTD phosphorylation by co-treating cells with YKL-5–124 and the CDK12/13 inhibitor THZ531 (Zhang et al., 2016). Concurrent inhibition of CDK7 and CDK12/13 reduced levels of phosphorylated Pol II Ser2 and Ser5 to levels similar to treatment with the CDK7/12/13 inhibitor THZ1 (Kwiatkowski et al., 2014) (Figure S1C). In summary, selective CDK7 inhibition with YKL-5–124 is sufficient to reduce the phosphorylation levels of CDK1 and CDK2 but not that of RNA Pol II CTD. Furthermore, YKL-5–124 treatment had no effect on expression of super enhancer (SE)-associated genes including INSM1, ASCL1, NFIB and MYC (Christensen et al., 2014), while THZ1 treatment caused a significant reduction in their expression (Figure S1D).
We next investigated whether YKL-5–124 treatment affected cell viability and cell cycle progression. We first measured cell viability at different time points (up to 7 days) upon treatment with increasing concentrations of YKL-5–124. A significant reduction in growth rate was observed at all tested concentrations compared to control cells (Figures 1C and S1E). YKL-5–124 resulted in reduced growth and a cytostatic effect with a tendency of cytotoxic effects at longer time points (day 7) (Figures 1C and S1E). Cell cycle analysis further showed that YKL-5–124 induced a significant accumulation of cells in G1 phase with a corresponding loss of cells in S phase (Figures 1D and S1F). The percentage of cells in G2/M phase was not significantly changed at concentrations up to 500 nM. In parallel, an increase of Cyclin E protein and mRNA (CCNE1) levels was detected, supporting the observed accumulation of cells at the G1-S phase checkpoint, whereas expression of Cyclins A (CCNA1), B (CCNB1), and D (CCND1) remained unchanged (Figures 1E and 1F).
Consistent with recent findings in other models (Olson et al., 2019), our data in SCLC further support YKL-5–124 as a selective CDK7 inhibitor that suppresses CDK1 and CDK2 activity and impairs cell growth and cell cycle progression.
CDK7 inhibition impairs DNA replication and causes DNA damage and micronuclei formation
The inhibitory effect of YKL-5–124 on CDK1 and CDK2 activity and the consequent G1-S progression defect prompted us to address whether CDK7 inhibition affects DNA replication and hexameric minichromosome maintenance 2–7 (MCMs) (Hills and Diffley, 2014; Hyrien, 2016) complex at replication sites, subsequently causing DNA damage and genome instability.
We first examined the effect of YKL-5–124 on active DNA replication by measuring BrdU incorporation. A significant decrease in BrdU-incorporated S-phase cells was revealed (Figures 2A and 2B), indicating impaired DNA replication. We then sought to further characterize whether YKL-5–124 stalls DNA synthesis indicated by EdU incorporation in the nucleus, as well as impairs the loading of MCM2 at individual replication foci. We employed single-molecule stochastic optical reconstruction microscopy (STORM) of fluorescently labeled EdU and MCM2 (Rust et al., 2006). We observed a dramatic decrease in the EdU content in each nucleus as well as in each focus upon YKL-5–124 exposure after 48 and 72 hr (Figures 2C-2E, S1G and S1H), implying reduced origin firing events. Similarly, a significant decline of MCM2 content in each nucleus and replication focus was detected (Figures 2F-2H, S1I and S1J). Taken together, these results support an inhibitory impact of YKL-5–124 on DNA replication and MCM2 initiation complex assembly.
Figure 2. CDK7 inhibition impairs DNA synthesis and MCM2 complex and causes DNA damage and micronuclei formation.

(A) Flow cytometry analysis of BrdU and 7-AAD co-staining in DMS79 after 24 and 48 hr treatment with DMSO or 100 nM YKL-5–124. (B) Bar graph showing the cell distribution in G1, S and G2/M phase. (C-E) Quantification of DNA synthesis indicated by EdU incorporation per nucleus as well as within each replication focus using STORM imaging of fluorescently labeled EdU in RPP631 cells treated with vehicle or 100 nM YKL-5–124 after 72 hr. (C) Representative images of nuclei with EdU signal are shown in vehicle or YKL-5–124. Scale bar = 2,000 nm. (D) Quantifications of EdU nuclear density (nm−2) per nucleus and (E) EdU content per focus are plotted. (F-H) Quantification of MCM2 complex per nucleus as well as within each replication focus in RPP631 cells. (F) Representative images of nuclei with MCM2 content are shown. Scale bar = 2,000 nm. Dash-line circle indicates nuclei. (G) Quantification of MCM2 nuclear density (nm−2) per nucleus and (H) MCM2 content per focus are plotted. (I and J) Quantification of γH2AX foci upon YKL-5–124 exposure by immunofluorescence (IF) microscopy in RPP631. (I) Representative images of DAPI-stained nuclei in blue and γH2AX foci in red. (J) The percentages of γH2AX foci in cells are plotted. At least 10 field images were counted (≥ 100 cell). (K and L) Quantification of micronuclei upon YKL-5–124 exposure in RPP631 and GLC16 by IF. (K) Representative images of DAPI-stained nuclei. (L) The percentages of micronuclei in cells are plotted. At least 10 field images were counted (≥ 100 cell). (B, D, E, G, H, J, L) Data shown as means ± SD of two to three independent experiments run in triplicates. (D, E, G, H, J, L) Unpaired two-tailed t-test. *p < 0.05, **p < 0.01, ***p < 0.001, ****p < 0.0001. See also Figure S1.
Reduction of MCM2 at the DNA replication initiation complex has been shown to cause replication deficiency and stress, leading to DNA damage and genomic instability, manifested by elevated levels of γH2AX and increased micronuclei formation. We observed a significant increase of γH2AX foci in YKL-5–124-treated cells after 48 hr (Figures 2I and 2J), suggesting activation of the DNA damage response. We then examined whether CDK7 inhibition can increase micronuclei. Immunofluorescence images of DAPI-stained nuclei were recorded and quantified (Figure 2K). Percentages of cells containing micronuclei were considerably increased after YKL-5–124 treatment (Figure 2L).
YKL-5–124 triggers immune response signaling and induces pro-inflammatory cytokines/chemokines production
A growing body of evidence demonstrates that increased formation of micronuclei links genome instability to immunity (Bakhoum and Cantley, 2018; Mackenzie et al., 2017). We next performed transcriptomic analysis to comprehensively explore whether CDK7 inhibition affects immune response signaling in vitro. RPP631 cells were treated with YKL-5–124 for 48 hr and were then harvested for RNA-sequencing. As expected, expression analysis across significantly modulated genes revealed that YKL-5–124 downregulated genes within gene set enrichment analysis (GSEA) terms associated with cell cycle, mitosis and E2F targets (Figures S2A-S2D).
Our analysis further confirmed that YKL-5–124 treatment had little effect on expression of SCLC SE-associated genes, in comparison to dual CDK7 and CDK12/13 inhibition upon THZ1 treatment (Christensen et al., 2014) (Figures S2E and S2F). Intriguingly, GSEA analysis of the differentially expressed genes revealed three of the top five most positively regulated ‘Hallmarks’ signatures were ‘Interferon gamma response’ (Figure 3A), ‘Tumor necrosis factor alpha (TNFα) signaling’ (Figure 3B) and ‘Inflammatory response’ (Figure 3C).
Figure 3. YKL-5–124 triggers immune response signaling and induces pro-inflammatory cytokines and chemokines production.

(A-C) GSEA analysis of the differentially expressed genes induced by YKL-5–124 in RPP631. Here shown are three of the top five most positively regulated ‘Hallmarks’ signatures (A) Interferon Gamma Response, (B) TNF Alpha Signaling and (C) Inflammatory Response. Gene list was ranked with signed (from log2 fold change (FC)) likelihood ratio from YKL-5–124 versus vehicle comparison. (D-F) Heatmaps for differential expression of transcripts from three top positively regulated pathways (colors are log2FC). (G-I) RT-qPCR analysis of (G) Tnf, (H) Cxcl10 and (I) Cxcl9 levels in RPP631. The data were presented as fold changes compared to the vehicle. Data shown as means ± SD of three independent experiments run in triplicates. Unpaired two-tailed t-test. **p < 0.01, ****p < 0.0001. (J-L) Profiling of OT-I T cells activation markers (J) CD69, (K) TNFα and (L) IFN© by flow cytometry after treatment with DMSO- or YKL-5–124-conditioned medium. Data shown as means ± SEM of three independent experiments run in ten replicates. Unpaired two-tailed t-test. *p < 0.05, **p < 0.01. See also Figure S2
Heatmaps for the most differentially regulated genes in the top GSEA signatures induced by YKL-5–124 showed an increased expression of numerous central pro-inflammatory cytokines and chemokines, including Tnfα pathway components and C-X-C motif chemokine ligand 10 (Cxcl10) (Figures 3D-3F). TNFα signaling plays an important role in dendritic cells recruitment, maturation and activation (Brunner et al., 2000), while CXCL10/CXCL9 are involved in regulating T cell recruitment and activity (Spranger et al., 2017). These factors secreted in the TME can potentially contribute to an optimal anti-tumor T cell response. We then sought to measure the expression levels of Tnf, Cxcl10 and Cxcl9 upon YKL-5–124 exposure by quantitative reverse transcription polymerase chain reaction (RT-qPCR). YKL-5–124 significantly stimulated tumor cell expression of Tnf (Figure 3G), Cxcl10 (Figure 3H) and Cxcl9 (Figure 3I) after 48 hr. To further confirm the cytokine/chemokine production by YKL-5–124 is mediated through specific inhibition of CDK7, we used an isogenic HAP1 cell system expressing CDK7 wild-type (WT) or a mutated form of CDK7 (CDK7-Cys312Ser) in which YKL-5–124 cannot bind (Olson et al., 2019). Consistently, a significant increase in TNF and CXCL10 expression was detected after YKL-5–124 treatment in the WT cells, but not in the C312S mutant cells (Figure S2G). In addition, the cGAS-STING pathway is one of the most investigated cytosolic DNA sensing mechanism that activates immunity (Bakhoum and Cantley, 2018; Mackenzie et al., 2017). However, interestingly, the immune stimulatory effect by YKL-5–124 appears to be independent of this pathway (Figures S2H and S2I).
We next sought to examine whether this above tumor cell-intrinsic effect by YKL-5–124 could affect T cell activation ex vivo. To address this, we utilized the OT-I mouse model in which the OT-I CD8+ T cells can recognize ovalbumin peptide residues 257–264 (OVA257–264) and become activated (Barilla et al., 2019; Hogquist et al., 1994). Mouse SCLC cells were treated with either DMSO or YKL-5–124 for 48 hr. DMSO-conditioned or YKL-5–124-conditioned medium was added to OT-I T cells culture in the presence of OVA257–264 peptide. Intriguingly, a significant increase in the percentage of CD69+, TNFα+ and IFNγ+ CD8+ T cells was detected in the YKL-5–124-conditioned medium, in comparison to DMSO-conditioned medium group (Figures 3J-3L), indicating elevated T cell activity. No significant effect on CD8+ T cell activity was observed when OT-I T cells were directly treated with YKL-5–124 (Figures S2J-S2L). These findings indicate that the activation of CD8+ T cells is a tumor intrinsic effect of CDK7 inhibition rather that the drug’s direct action on CD8+ T cells.
Collectively, these findings suggest that CDK7 inhibition activates immune response signaling in SCLC cells leading to secretion of essential pro-inflammatory cytokines/chemokines, which in turn can activate CD8+ T cells.
YKL-5–124 is a well-tolerated CDK7 inhibitor in vivo and inhibits SCLC tumor growth
We next determined whether YKL-5–124 might inhibit tumor growth and prolong survival in four immunocompetent murine SCLC models, including Rb1L/Lp53L/Lp130L/L (RPP) genetically engineered mouse models (GEMMs) (Schaffer et al., 2010), RPP, Rb1−/−p53−/− (RP) and RPP-MYC orthotopic models (Figures S3A and S3B).
To overcome the long and variable latency (6 to 9 months) of conventional RPP GEMMs, we established and characterized an orthotopic syngeneic SCLC model. This was conducted via transthoracic injection using tumor cells from a CRISPR/Cas9-RPP model of C57BL/6 (B6) background (Oser et al., 2019) (Figure S3C). These tumor-bearing mice have a much shorter and consistent latency of 7 to 8 weeks. Furthermore, a highly similar frequency of different immune infiltrating populations (CD3+, CD4+, CD8+ and CD11b+) in the TME between the orthotopic model and GEMMs was observed (Figures S4A-S4E). To this end, using the same strategy, we successfully generated three syngeneic murine models (RPP, RP and RPP-MYC), which are fast and reliable for oncoimmunology studies for SCLC (Figure S3).
To evaluate the optimal YKL-5–124 dosage with minimum toxicity, we performed a dose-escalating study in B6 mice in which body weight and blood cell counts were monitored and measured (Figures S5A-S5D). YKL-5–124 was well tolerated at a dose up to 10 mg/kg and caused no significant change in body weight and blood counts. We furthermore confirmed target engagement of YKL-5–124 in tumor-bearing mice at 10 mg/kg (Figure S5E).
We first tested whether YKL-5–124 affects the tumor growth in the RPP orthotopic model. Disease development was followed by MRI. Upon confirmation of tumor burden by MRI, mice were randomized to control and YKL-5–124 treatment, respectively (Figure 4A). All mice in the control group displayed aggressive disease with tumor volumes doubling after a 3-week period (Figures 4B and 4C). YKL-5–124-treated mice had significant tumor response at the 2-week and 3-week time points (Figures 4B and 4C). We next examined the efficacy of YKL-5–124 in the RP and RPP-MYC orthotopic models (Figures 4D and S6A-S6D). Consistently, YKL-5–124 demonstrated notably delayed tumor growth in the RP and RPP-MYC (Figures 4E and S6A-S6D). Remarkably, YKL-5–124 significantly prolonged survival, with an added median survival benefit of approximately 30 days in both RPP and RP models (Figures 4F and 4G). In contrast, most vehicle-treated mice in the RPP model succumbed to their tumor burden before the 6-week time point, highlighting the aggressive disease course (Figure 4F).
Figure 4. YKL-5–124 inhibits SCLC tumor growth in vivo and enhances tumor response to anti-PD-1 immunotherapy.

(A) Quantification of baseline tumor volumes of RPP orthotopic model. Combined vehicle and isotype IgG (Control, n= 13), anti-PD-1 (n= 13), YKL-5–124 (n= 17), anti-PD-1 + YKL-5–124 (Combo, n= 25), Chemotherapy + anti-PD-1 (n= 18) and Chemotherapy + Combo (n= 17). Each dot represents one mouse. (B) Quantification of tumor volume changes of RPP orthotopic model after treatment. Waterfall plot shows tumor volumes response after week 3. Each column represents one mouse, comparing to baseline MRI measurement. (C) Representative MRI images show lung tumors of RPP orthotopic model before and after the treatment at indicated time points. Circled areas, heart. (D) Quantification of baseline tumor volumes of RP orthotopic model. Control (n= 9), anti-PD-1 (n= 10), YKL-5–124 (n= 12) and Combo (n= 12). Each dot represents one mouse. (E) Quantification of tumor volume changes of RP orthotopic model after treatment. Waterfall plot shows tumor volumes response after week 2. Each column represents one mouse, comparing to baseline MRI measurement. (F and G) Kaplan-Meier survival curve of (F) RPP or (G) RP orthotopic model after indicated treatment. Log-rank test. *p < 0.05, **p < 0.01, ***p < 0.001, ****p < 0.0001. (A, D) Data shown as means ± SEM. (A, B, D, E) Unpaired two-tailed t-test. **p < 0.01, ***p < 0.001, ****p < 0.0001. NS, not significant. See also Figures S3-S6.
To further confirm the above observed tumor response, we evaluated the efficacy of YKL-5–124 in autochthonous RPP GEMMs (Figures S6E-S6H). Consistently, the majority of mice in control group (seven of eight) had doubled their tumor volumes at the 3-week time point, while none of the mice treated with YKL-5–124 had more than 50% increase of tumor burden (Figures S6F and S6G). Similarly, YKL-5–124 greatly improved median overall survival from 28 days to 56 days (Figure S6H).
YKL-5–124 enhances tumor response to anti-PD-1 immunotherapy
Our in vitro findings suggest a potential role of CDK7 inhibition in enhancing immune response. This prompted us to investigate whether CDK7 inhibition could augment immunotherapy in vivo. Thus, we next sought to explore whether combining YKL-5–124 with anti-PD-1 could result in more durable tumor inhibition than each single agent alone. Of note, no toxicity was detected in the body weight and blood cell counts in the combination treatment group (Figures S6I-S6L).
Compared to the control group, anti-PD-1 alone significantly reduced tumor growth after 3-week treatment in the RPP and RP models (Figures 4B and 4E), although to a lesser extent when compared to YKL-5–124, as the added median overall survival benefit by anti-PD-1 was only 10 days in the RPP and 15 days in the RP model (Figures 4F and 4G). Strikingly, mice in the combined anti-PD-1 + YKL-5–124 treatment regimen (Combo) had the best response across all models tested (Figures 4B, 4E, S6C and S6F). We observed that 7 out of 25 mice exhibited stable disease (volume increase < 30%) including three mice with complete response (CR) in the RPP model (Figure 4B) and more than half of the mice had stable disease with one CR in the RP model (Figure 4E). Most importantly, combining YKL-5–124 and anti-PD-1 dramatically increased the overall survival of tumor-bearing mice in comparison to either YKL-5–124 or anti-PD-1 alone (Figure 4F). In comparison to control mice, combination treatment led to more than two times increase in survival with an added median survival benefit of 45 days and 43 days in the RPP and RP models, respectively (Figures 4F and 4G). These results were also confirmed in a separate cohort of RPP GEMMs. Whereas mice treated with anti-PD-1 alone had slower tumor growth compared to vehicle-treated mice after 3 weeks, the majority of YKL-5–124 plus anti-PD-1 treated mice (seven of nine) had substantially reduced tumor burdens (Figures S6F and S6G). Combination treatment was superior to either YKL-5–124 or anti-PD-1 alone in tumor response (Figures S6F and S6G) and led to the longest survival (Figure S6H).
We next sought to evaluate the efficacy of the Combo with standard chemotherapy (cisplatin + etoposide) and compare survival benefit with recently approved chemotherapy + anti-PD-1 (Horn et al., 2018). Strikingly, the four-drug combination group (Chemo + Combo) had the best efficacy (Figure 4B) with no toxicity in the body weight (Figure S6I). All mice had stable disease and roughly half of the 17 mice had >20% reduction in tumor volume after 3-week, whereas there was no significant difference in efficacy between YKL-5–124 + anti-PD-1 (Combo, Figure 4B) and cisplatin + etoposide (Chemo + anti-PD-1, Figure 4B). The impressive efficacy of Chemo + Combo was directly translated into the longest improved survival, as 12 out of 17 mice in this group survived more than 90 days (Figure 4F). Of note, mice under Combo treatment appear to live significantly longer than those in the Chemo + anti-PD-1 group (Figure 4F), suggesting a better survival benefit in the Combo group.
In summary, YKL-5–124 enhances the response to anti-PD-1 immunotherapy and combining YKL-5–124 with anti-PD-1 offers significant survival benefit in multiple murine models. Adding YKL-5–124 and anti-PD-1 to standard chemotherapy further improves tumor response and leads to the longest survival.
YKL-5–124 provokes a robust anti-tumor immune program in vivo, which is further enhanced by anti-PD-1 immunotherapy
The survival benefit from combining YKL-5–124 and anti-PD1 treatment suggested that combined CDK7 and PD-1 inhibition might further alter tumor immune milieu to achieve optimal immune response.
To investigate the phenotypical and functional alterations of T cells, we harvested mouse tumor-bearing lung for immune profiling after 7-day treatment as shown in Figure S4A. There was no significant change of the frequencies of total CD4+ and CD8+ T cell infiltrates after either anti-PD-1 or YKL-5–124 compared to control tumors (Figures 5A and 5B). However, a notable increase of total CD4+ T cell infiltrates was observed in the combination treated mice in comparison to control or YKL-5–124 alone treated tumors, and this trend was not seen in total CD8+ T cells (Figures 5A and 5B). Profiling of CD4+ T cells showed a substantial increase of CD44highCD62Llow effector CD4+ T cells after either YKL-5–124 or anti-PD-1 treatment (Figures 5C and 5D), while combination treatment induced the highest increase of CD44highCD62Llow CD4+ T cells (Figures 5C and 5D), which was further confirmed in a separate cohort of RPP GEMMs (Figures S6M and S6N).
Figure 5. YKL-5–124 provokes a robust anti-tumor immune program, which is further enhanced by anti-PD-1 immunotherapy.

(A and B) Tumor infiltrating lymphocytes from RPP orthotopic model were analyzed at day 7 after treatment (n = 5). Frequencies of infiltrating (A) CD4+ T cells and (B) CD8+ T cells were presented. (C-F) The expression of (C) CD44, (D) CD62L and (E) Ki67 in CD4+ T cells, and (F) frequencies of ICOS+ CD4+ T cells were analyzed (n = 5). (G) Frequencies of GzmB+ CD8+ T cells was analyzed (n = 5). (H) Frequencies of CD11c+CD103+ dendritic cells were analyzed (n = 5). (I-K) Bronchoalveolar lavage fluid (BALF) was collected from mouse lung and secretion of (I) TNFα, (J) CXCL9 and (K) CXCL10 was measured by Luminex (pg/ml) (n = 4). Data shown as means ± SD. Unpaired two-tailed t-test. *p < 0.05, **p< 0.01, ***p < 0.001, ****p < 0.0001. NS, not significant. See also Figure S6.
To further assess the functional activity of CD4+ T cells, we analyzed the expression of a proliferation marker, Ki67, and an activation/costimulatory marker ICOS. YKL-5–124 led to a modest increase of tumor-infiltrating CD4+ T cells expressing Ki67, and significantly higher frequencies of ICOS+ CD4+ T cells (Figures 5E and 5F). Anti-PD-1 also caused a moderate elevation of Ki67+ CD4+ T cells, but had no effect on the levels of ICOS+ CD4+ T cells (Figures 5E and 5F), suggesting that YKL-5–124 might be more effective in promoting activation of CD4+ T cells than anti-PD-1. The most marked increase of Ki67+ CD4+ (Figure 5E) and ICOS+ CD4+ T cells (Figures 5F and S6O) was detected in mice treated with the YKL-5–124 and anti-PD-1 combination. We next assessed the activity of CTLs by staining for Granzyme B (GzmB), a cytotoxic granule protein secreted by CD8+ T cells. A considerable but equivalent increase of GzmB+ CD8+ T cells percentage was observed in YKL-5–124 or anti-PD-1-treated mice (Figure 5G), suggesting an enhanced cytotoxic T-cell-mediated clearance of tumor cells. Of note, combination treatment resulted in the highest percentage of GzmB+ CD8+ cytotoxic T cells (Figures 5G and S6P), supporting the superior efficacy and improved survival induced by YKL-5–124 and anti-PD-1.
An optimal and efficient anti-tumor immune program requires cooperation between DCs and T cells. CD4+ T cells provide the key input signals for the DCs to relay the help signal to elicit CD8+ CTLs responses (reviewed in (Borst et al., 2018)). In particular, recent work highlighted the critical role of CD11c+ CD103+ DCs in the priming and effector phase of the anti-tumor T cell response (Salmon et al., 2016; Spranger et al., 2017). We sought to characterize whether YKL-5–124 and anti-PD-1 alone or combination treatment would have an impact on DCs population (MHCII+CD11c+CD103+). As compared to control mice, a significant increase in percentages of tumor resident DCs was observed in mice after treatment with YKL-5–124 or combination, but to a lesser extent in mice treated with anti-PD-1 (Figure 5H). In addition, to directly examine the in vivo secretion of TNFα, CXCL9 and CXCL10 in the TME, we collected bronchoalveolar lavage fluid (BALF) from mouse lung after 7-day treatment. Consistent to our in vitro data, a pronounced increase of TNFα, CXCL9 and CXCL10 was detected upon YKL-5–124 and combination treatment (Figures 5I-5K).
These findings suggest YKL-5–124 provokes a robust anti-tumor immune program elicited by cooperation between DCs, effector CD4+ T cells and cytotoxic CD8+ T cells. This effect is further enhanced by the addition of PD-1 blockade.
Single-cell transcriptomic analysis identifies intratumoral cell populations
To provide a more comprehensive and unbiased assessment of immunotherapeutic responses, we performed single-cell RNA sequencing (scRNAseq) analysis on the whole TME including tumor cells and immune counterparts.
We obtained single-cell transcriptomes for 9,307 cells in the control group, 10,018 in YKL-5–124, 5,944 in anti-PD-1 and 5,911 in Combo. To define the intratumoral cell populations, we computationally combined data from the four treatment groups using canonical correlation analysis (Butler et al., 2018), representing a total of 31,180 cells and then used graph-based clustering and dimensionality reduction with UMAP (Becht et al., 2018) to respectively identify and visualize transcriptionally homogeneous clusters of cells (Figure 6A). Clusters were further annotated by directly comparing their transcriptional state with that of known sorted populations using SingleR package (Aran et al., 2019) and assessment of known cell-type specific markers. We identified cancer cells expressing the epithelial cell adhesion molecule (Epcam), lymphoid populations represented by T cells and innate lymphoid cells (ILC) expressing Cd3d, NK cells expressing natural cytotoxicity triggering receptor 1(Ncr1), B cells expressing Cd19, and myeloid populations such as monocytes, DCs and macrophages, neutrophils expressing S100a9, basophils expressing Cd200r3 and stromal cells expressing Sparc (Figures 6A-6C and S7A). Notably, compared with distribution of cell populations in the control group, YKL-5–124, anti-PD-1 and Combo treatment resulted in an increase in the frequencies of total immune cell components (Figures 6D and 6E).
Figure 6. Single-cell analysis identifies intratumoral cell populations and confirms connection of CDK7 inhibition in tumor intrinsic signaling to immunity.

(A) umap plot showing identified cell populations within whole tumor from all groups merged. (B) Cluster dendrogram showing the lineage hierarchy of identified cell populations in (A). (C) umap plot of cancer and infiltrating cells displaying marker gene expression. (D) umap plot showing the cell distribution within identified cell populations upon treatment. (E) Distribution fraction of cancer, immune and stromal compartments in response to indicated treatment. (F) Inferred dynamic phases of cell-cycle progression from scRNAseq analysis. (G) Bar plot showing cellular distribution within the cell-cycle progression states indicated in (F). (H and I) GSEA analysis of the differentially expressed genes induced by YKL-5–124 in vivo. Here shown are two of the top most (H) negatively and (I) positively regulated ‘Hallmarks’ signatures. (J) Heatmap for most differentially expressed genes from top positively regulated pathways (colors are log2FC). See also Figure S7.
Single-cell transcriptomic analysis confirms connection of CDK7 inhibition in tumor intrinsic signaling to immunity
As shown above, CDK7 inhibition impedes cell cycle progression and DNA replication, leading to genome instability and elevated immune response. To further delineate the temporal events that occur upon in vivo treatment, we inferred a continuous cell cycle trajectory from the scRNAseq data. First, we calculated scores for genes specific to the G1, G2/M or S-phase for each cell and applied the scores to cluster cells in eight groups that represent a cell-cycle state. The center of each group was then connected with its two nearest neighbors in the computed 3D cell-cycle score space (Figure S7B). The 3D visualization was projected in 2D by retaining the order of the eight cell-cycle states, which provides a portrait of the dynamic phases of cell-cycle progression (Figure 6F). Analysis of cell distribution illustrated that cells mainly arrested at G1 phase (cluster 1) and to a lesser extent at G2/M (cluster 8) upon YKL-5–124 and combination treatment, whereas a significant decrease of percentage of S phase cells (cluster 4, 5 and 6) was observed (Figure 6G). Furthermore, GSEA analysis showed that YKL-5–124 significantly downregulated genes within the ‘cell-cycle’ and ‘E2F target’ signatures (Figure 6H). This data further supports that cell cycle progression is substantially disrupted in vivo by CDK7 inhibition. Finally, YKL-5–124 and combination treatment triggered robust immune response signaling, particularly gene signatures related to ‘Interferon gamma response’ and ‘Inflammatory response’ (Figures 6I and 6J).
Combinatorial therapy reinvigorates anti-tumor immunity
To delineate an overall immune landscape remodeling associated with treatment, we characterized the alterations of the subpopulations of the tumor-infiltrating immune cells (Figures 7A and 7B). In comparison to control, a significant increase in percentage of total T cells, NK cells and ILC cells was observed upon YKL-5–124, anti-PD-1 and combination (Figure 7B). In the myeloid compartments, anti-PD-1 induced an increase of monocytes and macrophages, while YKL-5–124 treatment induced higher numbers of monocytes and neutrophils (Figure 7B). Of note, although DCs accounted for a small fraction of the overall population, YKL-5–124, anti-PD-1 and combination all induced an increase of DCs (Figure 7B).
Figure 7. Combinatorial therapy reinvigorates anti-tumor immunity.

(A) umap plot of the identified intratumoral infiltrating immune cells. (B) Percentage of different intratumoral infiltrating immune populations identified in (A). (C) umap plot highlighting the whole population of T cells identified in (A) in purple (left) and umap plot showing the subpopulations identified within the T cells (right). (D-H) umap plot of T cells displaying select marker gene expression. (I) umap density plots showing distribution of annotated clusters in (C) within intratumoral T cells upon treatment. (J) Percentage of cells in individual CD4+ T clusters annotated in (C) by treatment. (K) Heatmap displaying expression of select genes in CD4+ T cell clusters (colors are log2FC). (L) Percentage of cells in individual CD8+ T clusters annotated in (C) by treatment. (M) Heatmap displaying expression of select genes in CD8+ T cell clusters (colors are log2FC). (N) Percentages of tumor volume after 2-week treatment combining anti-PD-1 and YKL-5–124 (Combo) with or without αCD4 (400 μg/mouse) or αCD8 (400 μg/mouse) antibodies (n = 8). Unpaired two-tailed t-test. **p < 0.01, ***p < 0.001. (O) Waterfall plot shows tumor response after week 2. Each column represents one mouse, comparing to baseline measurements (n = 8). Unpaired two-tailed t-test. **p < 0.01, ***p < 0.001. See also Figure S7.
Our in vivo immune profiling suggests YKL-5–124 and combination therapy provoke a robust anti-tumor immune program centered on effector CD4+ T cells and CD8+ T cells. Consistently, scRNAseq analysis showed a particularly prominent impact on T cells (Figure 7B). To more accurately dissect the T cell subpopulations, we separated T cells (6,698) and analyzed the data at higher granularity (Figure 7C). This approach yielded 11 distinct T cell subpopulations (c0 to c10) broadly defined by the distribution of classical marker genes, representing high plasticity and complexity (Figures 7C-7H). It was evident that YKL-5–124, anti-PD-1 and combination prompted changes in subpopulation proportions and their transcriptional profiles (Figures 7I-7M). Further characterization of each individual cluster is described here and detailed in the method section.
CD4+ T cells
Cells in c1 expressed high levels of Cd4 and the naive T cell marker Sell (CD62L), but lacked the expression of effector/memory marker Cd44 and T cell activation genes (detailed in method section), including Ifng and Icos (Figure 7K). c1 appeared to be naive T cells, whose percentage was prominently reduced following YKL-5–124, anti-PD-1 and combination (Figures 7I and 7J). c5 showed the highest levels of activated markers and intermediate levels of Sell and Cd44 (Figure 7K), representing an activated/effector T cell signature. c4 expressed much lower levels of these activation markers, and lower Sell and higher Cd44 (Figure 7K). YKL-5–124, anti-PD-1 and combination treatment led to an increase in frequency of c5 and a slight reduction of c4 percentage (Figures 7I and 7J).
c6 cells expressed high levels of Cd4 and Foxp3, which are markers for regulatory T cells (Tregs). Upon YKL-5–124, anti-PD-1 and Combo treatment, percentage of Tregs increased significantly in comparison to mice treated with control (Figures 7I-7K). This increased frequency of Tregs might indicate an acute positive feedback to an activated tumor immune environment by short-term treatment.
c7 displayed highest levels of Cd44 and low of Sell, intermediate levels of T cell activation markers, indicating an effector/activation T cell signature. Of note, this cluster of cells expressed uniquely Mki67, implying proliferative capacity of these cells. In response to YKL-5–124, anti-PD-1 and combination treatment, the numbers of Mki67+ CD4+ T cells significantly increased (Figure 7J).
CD8+ T cells
Both c0 and c8 expressed high levels of Cd8a and Sell, but low Cd44 and T cell activation genes. c9 expressed intermediate level of Sell and relatively low of the T cell activation genes. Thus, c0, c8 and c9 appeared to be naive-like cells and in an inactivated state. Notably, YKL-5–124, anti-PD-1 and Combo all caused a reduction of these three clusters of CD8+ T cells (Figures 7I, 7L and 7M).
c3 expressed high levels of memory T cell marker Klrg1, intermediate levels of cytotoxic T cells markers (Gzma and Gzmb), and Tbx21 (T-bet) and Eomes. This cluster represents “memory” population with cytotoxicity and low proliferation capability, which has the potential to differentiate into CTLs (Ebert et al., 2016; Herndler-Brandstetter et al., 2018). c10 showed the highest levels of T cell activation genes and Gzma and Gzmb, suggesting these cells are fully differentiated CTLs. c5 expressed low levels of Sell but high Cd44 and activation markers, representing an “effector” T cell signature (Figures 7I, 7L and 7M). In comparison to control, proportions of cells in both c3 and c5 increased in all other groups, whereas the number of cells in c10 increased the most upon combination treatment (Figures 7I, 7L and 7M). These findings suggest that combining YKL-5–124 and anti-PD-1 remodels the intratumoral CD8+ T cell population from cells that are more naive-like to those with more effector-like, activated and cytotoxic properties.
In line with recent work (Gubin et al., 2018), our clustering also revealed that numerous clusters were categorized more based on their functional markers rather than classic cellular subtype. c7 cells with high levels of Mki67 are comprised of a mixture of CD4+ T cells and CD8+ T cells, highlighting their cell proliferation capability (Figures 7E, 7F, 7H, 7K and 7M). c5 is another functionally defined cluster of effector/activated T cells, which contain both CD4+ and CD8+ T cells (Figures 7E, 7F, 7H, 7K and 7M). In response to YKL-5–124, anti-PD-1 and combination, the number of cells in c7 and c5 increased substantially (Figures 7J and 7L), implying a major impact on proliferation and activation of CD4+ and CD8+ T cells.
Collectively, our data highlight anti-tumor immunity alterations occurring in the intratumoral T cells compartment following YKL-5–124, anti-PD-1 and particularly combinational therapy, including (1) a significant reduction in CD4+ and CD8+ naive T cells frequency; (2) a dramatic expansion of CD4+ and CD8+ effector/memory T cells and CD8+ CTLs, with an increase in the number of Mki67+ proliferating T cells; and (3) upregulation of an anti-tumor gene signatures of T cell activation/function.
Anti-tumor immunity by combining YKL-5–124 and PD-1 is partly dependent on CD4+ and CD8+ T cells
Our in vivo data demonstrate that combining YKL-5–124 and anti-PD-1 resulted in the best tumor response and optimal immune surveillance centered on T cells. To determine whether CD4+ or CD8+ T cells directly contributes to combination therapy response, we assessed the impact of perturbing immune cell function by in vivo neutralization antibodies against CD4 (αCD4) or CD8 (αCD8) (Figures S7C and S7D). Tumor-bearing mice were randomized to either combination treatment, or combination treatment plus αCD4 or αCD8. Indeed, compared to non-depletion mice in the combination group, CD4+ T cell-depleted mice had significantly higher tumor burdens (Figures 7N and 7O). Similarly, a dramatic increase of tumor volumes was observed in CD8+ T cell-ablated mice (Figures 7N and 7O). Depleting either CD4+ or CD8+ T cells mitigated the anti-tumor effect of combining YKL-5–124 and anti-PD-1 (Figures 7N and 7O). These observations further support our findings that T cells are required for anti-tumor immunity induced by combination treatment.
Discussion
The FDA recently approved atezolizumab (anti-PD-L1) in combination with chemotherapy for the first-line treatment of patients with ES-SCLC (Horn et al., 2018). Unfortunately, the added benefit to median OS was only ~2 months, highlighting the need for new drug combinations that can potentiate ICB in SCLC. Recent work in preclinical models suggests that targeting DNA damage response could potentially enhance ICB in SCLC (Sen et al., 2019).
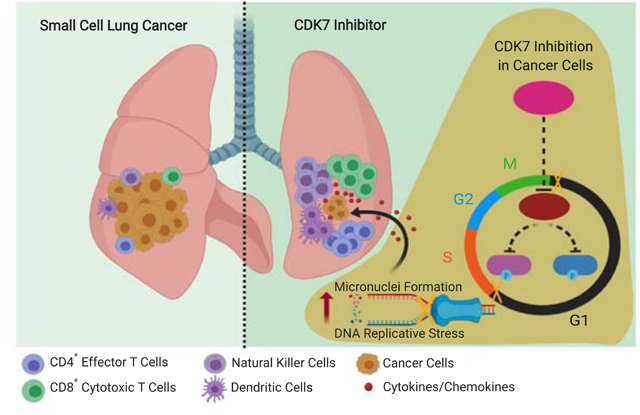
In this study, we demonstrate that targeting CDK7 with the new selective inhibitor YKL-5–124 disrupts cell cycle progression and causes DNA replicative stress and genome instability in tumor cells, leading to cellular responses including release of multiple pro-inflammatory cytokines/chemokines. These tumor cell-intrinsic events provoke a robust immune surveillance, which leads to T-cell-mediated tumor control in mouse SCLC models. Combining YKL-5–124 with PD-1 blockade promotes strong anti-tumor immunity and confers remarkable survival benefit in this highly aggressive cancer. Our findings provide a rationale for combining CDK7 inhibition and immunotherapy for SCLC patients.
In line with recent work (Olson et al., 2019), selectively targeting CDK7 by YKL-5–124 did not result in changes in CTD phosphorylation of RNA Pol II and SE-associated genes expression in SCLC. These findings reveal potential redundancies in CDK control of gene transcription. YKL-5–124 treatment leads to cells predominantly arrested at the G1 to S phase transition and unable to advance to S phase. Conventionally, at the G1/S transition, CDKs activate and facilitate the conversion of MCMs in the pre-initiation complex to an active DNA helicase, leading to initiation of DNA synthesis (Hills and Diffley, 2014; Hyrien, 2016). When the regulatory mechanisms fail, replicative stress and DNA damage ensue (Hills and Diffley, 2014). CDK7 inhibition dramatically impairs the levels of MCM2 at the replication forks, leading to decreased replication origins, elevated replicative stress and DNA damage. Genome instability such as micronuclei formation has recently emerged as a crucial cue to activate immune response (Harding et al., 2017; Mackenzie et al., 2017). These micronuclei represent an important source of immunostimulatory DNA and precede activation of inflammatory signaling. Indeed, the series of events provoked by CDK7 inhibition in cancer cells trigger robust immune response signaling and secretion of pro-inflammatory factors, which potentiates T cell activity, resulting in tumor control.
Importantly, we explored the therapeutic potential of combining CDK7 inhibitor with ICB in murine models with lung TME to closely mimic human disease. A key strength of this current study lies in the use of four histopathology validated SCLC models. Of note, combining YKL-5–124 with anti-PD-1 significantly improved efficacy and extended overall survival in all tested SCLC models, supporting the potential of CDK7 inhibition in enhancing immunity as backbone for combinational immunotherapy. Strikingly, adding YKL-5–125 and anti-PD-1 to standard chemotherapy resulted in the best tumor response and the longest survival among all treatment groups with no observed toxicities. This data provides strong evidence for combining CDK7 inhibitor in first line treatment with chemotherapy and ICB in clinical trials and highlights the translational significance of our study.
Our current understanding of the TME in SCLC is poor. To the best of our knowledge, this is the first unbiased scRNAseq analysis of TME in mouse SCLC, which was performed without prior marker selection. In the cancer cells, scRNAseq analysis confirms a unique signature of disrupted cell cycle progression and connects the tumor intrinsic effect by YKL-5–124 to immune response signaling. Our study uncovered several key observations and mechanisms of action on immune compartments: (1) complexity of tumor-immune ecosystem dynamics; YKL-5–124, anti-PD-1 and combination therapy (2) trigger the expansion/reduction of certain subtypes of tumor-infiltrating lymphoid and myeloid cells, (3) cause a dramatic shift of naive CD4+ and CD8+ T cells to effector/activated T cells and (4) enhance proliferative capacity of Mki67+ effector T cells; combination therapy (5) results in the most prominent increase of CD8+ CTLs and (6) triggers the strongest increase in the expression of an anti-tumor cytotoxic gene signature. Further work is needed to fully elucidate CDK7 function in immune cells.
In summary, our work serves as the basis for the combinatorial application of CDK7 inhibitor and immunotherapy and provides evidence for combining YKL-5–124 and PD-1 blockade in future SCLC clinical trials. Considering the universal role of CDK7 in genome instability, combining CDK7 inhibition with ICB might improve anti-tumor immunity as a widely applicable new approach in cancer immunotherapy.
STAR METHODS
LEAD CONTACT AND MATERIALS AVAILABILITY
Further information and requests for resources and reagents should be directed to and will be fulfilled by the Lead Contact, Kwok-Kin Wong (Kwok_Kin.wong@nyulangone.org).
EXPERIMENTAL MODEL AND SUBJECT DETAILS
Animal Studies
All animal studies were reviewed and approved by the Institutional Animal Care and Use Committee (IACUC) at the New York University Langone Health (NYULH) and Dana-Farber Cancer Institute (DFCI). The GEMM harboring conditional mutant Rb1, p53, and p130 (RPP) has been described previously (Schaffer et al., 2010). From 6 weeks of age, mice were induced with adenovirus-Cre recombinase (Ad-Cre) by intratracheal intubation to allow cre-lox-mediated recombination of floxed Rb1, p53 and p130 alleles. For syngeneic orthotopic models, ultrasound-guided transthoracic injection was performed using 200,000 RPP631, RP or RPP-MYC cells in 30 μL PBS directly into the lung of 6 to 8-week-old C57BL/6 (Jackson Laboratory, Stock No: 000664). For OT-I T cell assay, OT-I mice were purchased from the Jackson Laboratory (Stock No: 003831). Both males and females mice were used and all mice were maintained in accordance with the respective NYULH and DFCI on the care, welfare, and treatment of laboratory animals. All experiments met or exceeded the standards of the Association for the Assessment and Accreditation of Laboratory Animal Care, International (AAALAC), the United States Department of Health and Human Services, and all local and federal animal welfare laws.
Cell Lines
Established mouse SCLC Rb1−/−p53−/−p130−/− (RPP)631, Rb1−/−p53−/− (RP) and RPP-MYC cells were maintained in HITES medium (Carney et al., 1981) and confirmed by sequencing and western blotting (Oser et al., 2019). Human cell lines (GLC16, DMS79, NCI-H69, NCI-H82) were maintained in RPMI 1640 (Thermo Fisher Scientific). The HAP1 CDK7 WT and C312S cell lines (Olson et al., 2019) were cultured in IMDM media (Thermo Fisher Scientific). All cell line media were supplemented with 10% Fetal Bovine Serum (FBS, Sigma-Aldrich) and 1% penicillin/streptomycin (Thermo Fisher Scientific) and all cell lines were cultured in a humidified chamber with 5% CO2.
METHOD DETAILS
Chemicals
YKL-5–124 was synthesized according to (Olson et al., 2019). THZ531 was synthesized according to (Zhang et al., 2016). THZ1 and Bio-THZ1 was synthesized according to (Kwiatkowski et al., 2014). Anti-PD-1 (clone 29F.1A12) was a kind gift from Dr. Gordon Freeman (DFCI).
In vivo Toxicity Evaluation and Treatment Studies
For evaluation of in vivo toxicity of YKL-5–124, a dose-escalating study from 2.5 mg/kg to 15 mg/kg q.d. five times/week via intraperitoneal injection (i.p.) was tested in C57BL/6 mice. In vivo toxicities including body weight and blood cell counts including platelet, red blood cells and white blood cells were monitored. Similarly, a separate cohort was used to evaluate in vivo toxicity of combining YKL-5–124 and anti-PD-1 in C57BL/6 mice.
For treatment studies, mice were evaluated by MRI imaging (Preclinical Imaging Laboratory, NYULH) to quantify lung tumor burden before for randomization and after drug treatment for efficacy evaluation. Mice were treated with either vehicle and isotype IgG (Control), anti-PD-1
200 μg/mouse (clone 29F.1A12), YKL-5–124 10 mg/kg, or combined anti-PD-1 and YKL-5–124 (Combo). YKL-5–124 was administered daily from Monday to Friday, and PD-1 antibody was administered three times a week (Monday, Wednesday, and Friday). For chemotherapy, cisplatin (5 mg/kg) was given on Day 1 and etoposide (10 mg/kg) on Day 1, 2, 3 every seven days per cycle for three cycles. For CD4 or CD8 neutralization study, mice were injected intraperitoneally with either αCD8 antibody (400μg, Bio X Cell, clone 2.43), or αCD4 (400μg, Bio X Cell, clone GK1.5), or IgG2b isotype control (400μg, Bio X Cell, clone LTF-2) 48 and 24 h before beginning anti-PD-1 and YKL-5–124 (Combo) treatment, and every 4 days thereafter.
Cell Viability Assay
Cells were seeded in 96-well plates (0.01–0.02 × 10⁶ cells/well) in media and treated with YKL-5–124 at indicated concentrations and time points. Cell viability was measured using the MTS-based CCK-8 assay (Dojindo, Cat#CK04). Absorption at 450 nm was measured 3 hr after addition of CCK-8 reagent to cells.
Cell Cycle Analysis
Cells were seeded in 6-well plates (0.5–1 × 10⁶ cells/well) in media and treated with YKL-5–124 at indicated concentrations and time points. Cells were collected by centrifugation, washed in cold PBS and resuspended in 1 ml of 80% EtOH in PBS and stored overnight at −20 °C. Cells were again collected by centrifugation and washed 3X with cold PBS. Hereafter cells were resuspended in PBS containing: 0.1% Triton X-100, 25 μg/ml Propidium Iodide (PI) and 0.2 mg/ml RNase A and incubated for 45 min at 37 °C. Af ter incubation, cells were placed at 4 °C until ready for analysis with flow cytometry. Cells were gated for PI staining and cell accumulation in G1, S and G2/M were calculated using ModFit LT software.
BrdU Analysis
Cells were seeded in 6-well plates (0.5–1 × 10⁶ cells/well) in media and treated with YKL-5–124 at indicated concentrations and time points. Prior to collection, cells were pulsed with 1 mM BrdU (BD Biosciences, #559619) for 2–4 hr (depending on cell line doubling time) and collected by centrifugation. Hereafter cells were permeabilized, fixated and stained according to BrdU kit instruction (BD Biosciences, Cat#559619). Cells were gated for BrdU incorporation (FITC) and 7-aminoactinomycin D (7-AAD) to quantify cells in G1, S (BrdU positive) and G2/M.
RNA Extraction and RT-qPCR
Cell pellets were collected and then subjected to total RNA extraction using RNeasy Plus Mini Kit (QIAGEN, Cat#74136) according to the manufacturer’s instructions, or using TRIzol:Chloroform phase-separation by centrifugation followed by RNA precipitation using isopropanol. The extracted RNA was reversely transcribed into cDNA using the High-Capacity RNA-to-cDNA™ Kit (Thermo Fisher Scientific, Cat#4387406) according to the manufacturer’s instructions. The obtained cDNA samples were diluted and used for RT-qPCR. PowerUp™ SYBR™ Green Master Mix (Thermo Fisher Scientific, Cat#A25742) or TaqMan Gene Expression Master Mix (Life Technologies, Cat#4369514). Gene specific primers with sequences listed in Table S1 were used for PCR amplification and detection on the StepOnePlus™ Real-Time PCR System (Thermo Fisher Scientific). RT-qPCR data were normalized to Actb (mouse cells) or GUSB (human cells) and presented as fold changes of gene expression in the test sample compared to the control.
Protein Extraction and Western Blotting Analysis
Cells in culture were collected by centrifuging at 1,500rpm and then washed with ice-cold PBS twice to completely remove residual medium. RIPA lysis buffer (Thermo Fisher Scientific, Cat# 89900) supplemented with Halt™ Protease and Phosphatase Inhibitor Cocktail (Thermo Fisher Scientific, Cat#78440) was added to cell pellets to extract protein. Protein concentrations in lysates were measured by Pierce™ BCA Protein Assay Kit (Thermo Fisher Scientific, Cat# 23225) and followed by the addition of SDS loading buffer (6X) and heated at 95°C for 5 min. Equal amount of protein samples was subjected to 4–20% gradient gel SDS-PAGE and transferred to a nitrocellulose membrane (Bio-Rad, Cat#1704271). The membrane was blocked in Odyssey® Blocking Buffer (LI-COR, Cat#927–50003) at room temperature for 1 hour and incubated with appropriate antibodies at 4°C overni ght ( Key Resources Table). Antibodies were diluted in TBST (TBS with 0.1% Tween) with 20 % LI-COR Odyssey Blocking Buffer. On the next day, the membrane was washed with TBST (TBS with 0.1% Tween) four times and incubated with appropriate secondary antibodies (LI-COR, anti-Rabbit, Cat#925–32213; anti-Mouse, Cat#925–68072) at room temperature for 1 hour. Membranes were imaged using the LI-COR Odyssey® Imaging System.
KEY RESOURCES TABLE
| REAGENT or RESOURCE | SOURCE | IDENTIFIER |
|---|---|---|
| Antibodies | ||
| Goat IRDye 680RD anti-Mouse IgG | LI-COR Biosciences | Cat#926–68070 |
| Goat IRDye 800CW anti-Rabbit IgG | LI-COR Biosciences | Cat#926–32211 |
| CDK7 | Cell Signaling Technology | Cat#2916 |
| Cyclin H | Bethyl Labs | Cat#A301–674A |
| Cyclin K | Bethyl Labs | Cat#A301–939A |
| pCDK2 T160 | Cell Signaling Technology | Cat#2561 |
| pCDK1 T161 | Cell Signaling Technology | Cat#9114 |
| CDK1 | Cell Signaling Technology | Cat#77055 |
| CDK2 | Cell Signaling Technology | Cat#2546 |
| CDK1/2 | Santa Cruz | Cat#sc-135400 |
| Tubulin | Cell Signaling Technology | Cat#3873 |
| pCTD Ser2 | Millipore | Cat#04–1571 |
| pCTD Ser5 | Millipore | Cat#04–1572 |
| Total RNA Polymerase II | Bethyl Labs | Cat#3A300–653A |
| Cyclin E D7T3U | Cell Signaling Technology | Cat#20808 |
| Cyclin E HE12 | Cell Signaling Technology | Cat#4129 |
| Anti-MCM2 antibody [EPR4120] | Abcam | Cat#ab223403 |
| Anti-PCNA | Santa Cruz | Cat#sc-56 |
| γH2AX | Cell Signaling Technology | Cat#9718S |
| ASCL1 | Abcam | Cat#ab211327 |
| MYC | Abcam | Cat#ab32072 |
| STING (22P2F) | Cell Signaling Technology | Cat#13647S |
| pSTING (S365) (D8F4W) | Cell Signaling Technology | Cat#72971S |
| IRF3 (D83B9) | Cell Signaling Technology | Cat#4302S |
| pIRF3 (S396) (4D4G) | Cell Signaling Technology | Cat#4947S |
| pTBK1 (S172) (D52C2) | Cell Signaling Technology | Cat#5483S |
| Actin Clone AC-15 | Sigma-Aldrich | Cat#A5441 |
| STING | Cell Signaling Technology | Cat#13647 |
| Phospho-STING | Cell Signaling Technology | Cat#50907 |
| IRF3 | Cell Signaling Technology | Cat#4302 |
| pIRF3 | Cell Signaling Technology | Cat#37829 |
| TBK1 | Cell Signaling Technology | Cat#3504 |
| pTBK1 | Cell Signaling Technology | Cat#5403 |
| IKKε | Cell Signaling Technology | Cat#2905 |
| pIKKε | Cell Signaling Technology | Cat#8766 |
| InVivoMAb anti-mouse CD8α (clone 2.43) | Bio X Cell | BE0061 |
| InVivoMAb anti-mouse CD4 (clone GK1.5) | Bio X Cell | BE0003–1 |
| InVivoMAb rat IgG2b isotype control | Bio X Cell | BE0090 |
| anti-mouse PD-1 (CD279) (Clone: 29F.1A12) | Gordon J. Freeman, DFCI | N/A |
| CD45 (clone 30-F11) | BioLegend | 103155 |
| CD3 (clone 17A2) | BioLegend | 100216 |
| CD4 (clone GK1.5) | BioLegend | 100453 |
| CD8 (clone 53–6.7) | BioLegend | 100759 |
| CD11b (clone M1/70) | BioLegend | 101242 |
| CD11c (clone N418) | BioLegend | 117336 |
| CD103 (clone 2E7) | BioLegend | 121425 |
| Ki67 (clone 16A8) | BioLegend | 652411 |
| CD44 (clone IM7) | BioLegend | 103032 |
| CD62L (clone MEL-14) | BioLegend | 104417 |
| TNFα (MP6-XT22) | BioLegend | 506304 |
| IFNγ (XMG1.2) | BioLegend | 505826 |
| Chemicals, Peptides, and Recombinant Proteins | ||
| YKL-5–124 | Olson et al, 2019 | N/A |
| THZ531 | Zhang et al, 2016 | N/A |
| THZ1 | Kwiatkowski et al, 2014 | N/A |
| Cisplatin | TEVA PHARMACEUTICALS | Cat#18E01LA |
| Etoposide | Accord Healthcare, Inc. | Cat#X15146 |
| Biotinylated-THZ1 (Bio-THZ) | Kwiatkowski et al, 2014 | N/A |
| CCK8 reagent | Dojindo | Cat#CK04 |
| Odyssey Blocking Buffer | LI-COR | Cat#927–50003 |
| Propidium Iodide | Sigma-Aldrich | Cat#P4864 |
| Halt™ Protease and Phosphatase Inhibitor Cocktail | Thermo Fisher Scientific | Cat#78440 |
| TaqMan Gene Expression Master Mix | Life Technologies | Cat#4369514 |
| RIPA lysis buffer | Thermo Fisher Scientific | Cat#89900) |
| IDIM media | Thermo Fisher Scientific | Cat#12440061 |
| RPMI media | Thermo Fisher Scientific | Cat#11875093 |
| Ovalbumin peptide residues 257–264 | GenScript | Cat#RP10611 |
| Collagenase D | Sigma-Aldrich | Cat#11088866001 |
| Dnase 1 | Sigma-Aldrich | Cat#10104159001 |
| RBC Lysis Buffer | BioLegend | Cat#420301 |
| BD Cytofix/Cytoperm | BD Biosciences | Cat#554722 |
| SYBR Green Master Mix | Thermo Fisher Scientific | Cat#A25742 |
| Lipofectamine 3000 | Thermo Fisher Scientific | Cat#L3000015 |
| Glucose Oxidase | Sigma-Aldrich | Cat#2133 |
| Catalase | Sigma-Aldrich | Cat#C3155 |
| Glucose | Sigma-Aldrich | Cat#G8270 |
| Cysteamine | Fisher Scientific | BP2664100 |
| Citrate Buffer (Dako Target Retrieval Solution) | Dako | Cat#S1699 |
| Leica Novolink Polymer | Leica | Cat#RE7161 |
| Critical Commercial Assays | ||
| Rneasy Plus Mini Kit | QIAGEN | Cat#74136 |
| BrdU assay | BD Biosciences | Cat#559619 |
| High-Capacity RNA-to-cDNA™ Kit | Thermo Fisher Scientific | Cat#4387406 |
| UltraComp eBeads™ Compensation Beads | Thermo Fisher Scientific | 01–2222-42 |
| ArC™ Amine Reactive Compensation Bead Kit | Thermo Fisher Scientific | A10628 |
| Cytokine/Chemokine 32-plex Assay | Millipore | MCYTMAG-70K-PX32 |
| Pierce™ BCA Protein Assay Kit | Thermo Fisher Scientific | Cat#23225 |
| Chromium™ Single Cell 3′ Library & Gel Bead Kit v2 | 10x Genomics | PN-120237 |
| Chromium™ Single Cell Chip Kit | 10x Genomics | PN-120236 |
| Chromium™ i7 Multiplex Kit | 10x Genomics | PN-120262 |
| Deposited Data | ||
| RNA-seq (bulk) | This paper | Accession Number GEO: GSE129299 |
| scRNA-seq | This paper | Accession Number GEO: GSE129299 |
| Experimental Models: Cell Lines | ||
| Human: HAP1 | Horizon Discovery | C859 |
| Human: GLC16 | Christensen et al, 2014 | N/A |
| Human: NCI-H69 | Christensen et al, 2014 | N/A |
| Human: DMS79 | Christensen et al, 2014 | N/A |
| Human: NCI-H82 | Christensen et al, 2014 | N/A |
| Human: HEK-293T | ATCC | CRL-3216™ |
| Mouse: RPP631 | This paper | N/A |
| Mouse: RPP-MYC | This paper | N/A |
| Mouse: RP | This paper | N/A |
| Experimental Models: Organisms/Strains | ||
| C57BL/6J | The Jackson Laboratory | Stock No: 000664 |
| RPP631 Orthotopic Model | This paper | N/A |
| RPP-MYC Orthotopic Model | This paper | N/A |
| RP Orthotopic Model | This paper | N/A |
| RPP GEMM | Schaffer et al., 2010 | N/A |
| OT-I model | The Jackson Laboratory | Stock No: 003831 |
| Oligonucleotides | ||
| See Table S1 | ||
| Recombinant DNA | ||
| lentiCRISPR v2 | Addgene | Cat#52961 |
| lentiCRISPR v2-sgcGAS | This paper | N/A |
| psPAX2 | Addgene | Cat#12260 |
| pMD2.G | Addgene | Cat#12259 |
| Software and Algorithms | ||
| GraphPad Prism 7 | GraphPad Software Inc. | http://www.graphpad.com |
| ImageStudio Light | ImageStudio Software | https://www.licor.com/bio/image-studio-lite/ |
| R v3.5.1 | R Core Team (2016) The R Project for Statistical Computing | http://www.r-project.org |
| Gene Set Enrichment Analysis (GSEA) | Broad Institute | http://software.broadinstitute.org/gsea/index.jsp |
| ModFit LT | Verity Software House | https://www.vsh.com/products/mflt/ |
| Fiji NIH | ImageJ | https://imagej.nih.gov/ij/docs/guide/146–2.html |
| FlowJo | FlowJo Software | https://www.flowjo.com/ |
| STAR (v2.5.2b) | STAR Software | https://github.com/alexdobin/STAR |
| featureCounts | featureCounts Software | http://bioinf.wehi.edu.au/featureCounts/ |
| Cell Ranger (v1.3) | Cell Ranger Single Cell Software Suite | https://support.10xgenomics.com/single-cell-gene-expression/software/pipelines/latest/what-is-cell-ranger |
| Seurat (v2.3.4) | Seurat R package | https://satijalab.org/seurat/ |
| Estimate (v1.0.13) | Estimate R package | https://bioinformatics.mdanderson.org/estimate/rpackage.html |
| SingleR (v0.2.1) | SingleR R package | https://github.com/dviraran/SingleR |
| uwot (v0.0.0.9010) | Uwot R package | https://github.com/jlmelville/uwot |
| dbscan (v1.1–3) | dbscan R package | https://cran.r-project.org/web/packages/dbscan/index.html |
| scran (v1.10.1) | scran R package | https://bioconductor.org/packages/release/bioc/html/scran.html |
| scater (v1.10.0) | scater R package | https://bioconductor.org/packages/release/bioc/html/scater.html |
| limma (v3.38.2) | limma R package | https://bioconductor.org/packages/release/bioc/html/limma.html |
| BioRender | BioRender Software | https://biorender.com/ |
Competitive Pulldown Assay for YKL-5–124 Target Engagement
Bio-THZ1 pulldown experiments followed by western blotting of enriched proteins was performed as described in (Kwiatkowski et al., 2014). Briefly, cells were treated with YKL-5–124 or DMSO for 6 hr (in vitro) or 72 hr (in vivo). Following treatment, cells were washed twice with cold PBS and then lysed in the following lysis buffer: 50 mM TrisHCl pH 8.0, 150 mM NaCl, 1% NP-40, 5 mM EDTA, 1mM DTT, and protease/phosphatase cocktails. Following clearance, lysates were treated with biotinylated THZ1 for pulldown overnight at 4 °C. Lysates were further incubated at room temperature for 3 hr to increase the efficiency of covalent bond formation. Lysates were then incubated with streptavidin agarose for pulldown for an additional 2–3 hr at 4°C. Agarose beads were washed 5 times with lysis b uffer and then boiled in 2X SDS at 95 °C. SDS-page resolved precipitated proteins were probed for the indicated proteins.
Immunofluorescence Staining and Imaging
Before fixation, cells in PBS were seeded for 30 min on 0.01% Poly-lysine coated coverslip. Cells were then fixed in 4% paraformaldehyde (Diluted the 32% paraformaldehyde in PBS, Electron Microscopy Sciences 15714) for 10 min at room temperature. Cells were washed three times for 5 min with 200 mM glycine containing PBS, followed by permeabilization with 0.3% Triton X-100 in PBS for 15 min. After blocking with 5% bovine serum albumin (BSA) in PBS for 1 hour, cells were incubated with primary antibody (γH2A.X, Cell signaling 9718, 1: 200) diluted in a 5% BSA in PBS solution overnight at 4°C. After washing four times with PBS, cells were incubated with Alexa Fluor Plus 555 (Invitrogen A32732, 1: 500) secondary antibody for 1 hour and washed three times with PBS. Cell nuclei were counterstained with DAPI (BioLengend 422801, diluted to 600nM in PBS) for 5 min. Cells were washed two more times in PBS before mounting with Fluorescence Mounting Medium (Dako, S3023). Images were acquired using Zeiss 880 Laser Scanning Confocal Microscope and were processed by FIJI (NIH). Micronucleus were identified manually by distinct DAPI staining outside the main nucleus.
EdU and MCM2 Imaging by the Stochastic Reconstruction Microscopy (STORM) Sample Preparation
RPP631 cells were incubated in the presence of 100nM YKL-5–124 for 48–72 hr. EdU was pulsed during the last 30 minutes of YKL-5–124 treatment. Treated cells were pre-extracted using 0.5% Triton in CSK buffer (10 mM Hepes, 300 mM Sucrose, 100 mM NaCl, and 3 mM MgCl2, pH = 7.6) for 10 minutes, and fixed with paraformaldehyde (4%) for 30 minutes. Cells were then rinsed 3 times with PBS and blocked (2% glycine, 2% BSA, 0.2% gelatin, and 50mM NH4Cl in PBS) overnight at 4 °C for further staining. EdU was tagged with Alexa Fluor 647 picolyl azide through Click reaction (Thermo Fisher, C10640) before immunofluorescent labeling of target proteins, for which the antibodies are mouse anti-PCNA (Santa Cruz Biotech., sc56, 1:1000), goat anti-mouse (Alexa Fluor 750 conjugated, Thermo Fisher, A-21039, 1:5000), and rabbit anti-MCM2 (Alexa Fluor 647 conjugated, Abcam ab223403, 1:500). Fixed cells were mounted onto microscope glass for STORM imaging in freshly mixed imaging buffer (1 mg/mL glucose oxidase (Sigma-Aldrich, G2133), 0.02 mg/mL catalase (Sigma-Aldrich, C3155), 10% glucose (Sigma-Aldrich, G8270), and 100 mM cysteamine (MEA, Fisher Scientific, BP2664100).
Optics
STORM imaging was performed on a customized inverted microscope as described previously (Yin et al., 2019). In brief, the 639 nm laser (UltraLaser, MRL-FN-639–800) was collimated and reflected into the TIRF Objective (HCX PL APO 63X NA = 1.47, Zeiss), and the adjusted illumination power is ~ 1.5 kW/cm2. A 405 nm Laser line (MDL-III-405–150, CNI) was equipped to reactivate Alexa Fluor 647 fluorophores. A 750 nm laser (UltraLaser, MDL-III-750–500) was also applied to illuminate Alexa Fluor 750 labeled PCNA for S-phase cell selection. Cell samples were sequentially illuminated with 639 and 750 laser lines and the emitted fluorescence was collected by the same objective with a 2X magnification tube lens (Diagnostic Instruments). The fluorescence was then filtered by single band filters (Semrock FF01–676/37 and FF02–809/81). switched in a filter wheel accordingly. Photons were eventually fed to a sCMOS camera (Photometrics, Prime95B) and collected at 33 Hz, 2000 frames for an image stack.
Single-molecule Localization and Pair-Correlation Analysis
Each 2000-frame single-molecule image stack was submitted to a home-built software for precise single-molecule localization. Briefly, each frame from an image stack was box filtered, roughly-local-maxima-localized, segmented, and submitted to GPU for Point-Spread-Function (PSF) fitting using the Maximum Likelihood Estimation (MLE). The fitting accuracy was evaluated using Cramer-Rao Lower Bound (CRLB). Note that the patterned read-out noise of the sCMOS camera was calibrated before imaging. Such read-out noise for each pixel was approximated into a Gaussian distribution and convolved with the Poisson shot noise for MLE fitting (Huang et al., 2013). The generated coordinates were then submitted for Auto-Pair-Correlation analysis to estimate the nuclear density of the fluorophores within a nucleus, as well as how many fluorophores are on average in each EdU/MCM2 focus (Sengupta et al., 2011; Veatch et al., 2012). The number of fluorophores is proportional to the quantity of EdU and MCM2. This method empowered us to map the precise molecular coordinates of EdU and MCM2 molecules within a cell with a resolution of ~10 nm, and to extract robust metrics such as the amount of EdU and MCM incorporated per nucleus as well as their quantity within each focus.
Histology and Immunohistochemistry
Lungs were perfused with 10% formalin, stored in fixative overnight, and embedded in paraffin. Four-micron thick sections of formalin fixed tissue were used for immunoperoxidase analysis after baking at 60 °C for 1 hour, deparaffinization and rehydration (100% xylene X4 for 3 minutes each, 100% ethanol X4 for 3 minutes each and running water for 5 minutes). The sections were blocked for peroxidase activity with 3% hydrogen peroxide in methanol for 10 minutes and washed under the running water for 5 minutes. The sections with pressure cooked (Biocare Medical) antigen retrieval were at 120°C i n Citrate Buffer (Dako Target Retrieval Solution, S1699). The slides were cooled for 15 minutes, and transferred to Tris buffer saline (TBS). The sections were incubated with rabbit monoclonal anti-MYC (Abcam Cat#ab32072; 1:900) and or rabbit monoclonal anti-ASCL1 antibody (Abcam Cat#ab211327; 1:100) was incubated 40 min room temperature. The secondary antibody was used Leica Novolink Polymer (Cat#RE7161) 30 min incubation. All the incubations were carried out in a humid chamber at room temperature. The slides were rinsed with TBS in between incubation. The sections were developed using 3,3’-diaminobenzidine (DAB) as substrate and counter-stained with Mayer’s Hematoxylin.
Luminex Analysis of Murine BAL fluid
Mouse lung bronchoalveolar lavage (BAL) was performed by intratracheal injection of 2 mL of sterile PBS followed by collection by aspiration. TNFα, CXCL9 and CXCL10 levels were measured using mouse Cytokine/Chemokine 32-plex Assay (MILLIPLEX, Millipore) on Luminex® SD system (Luminex). Concentrations (pg/mL) of each protein were derived from 5-parameter curve fitting models according to the manufacturer’s instructions.
MRI Quantification
Animals were anesthetized with isoflurane to perform MRI of the lung field using BioSpec USR70/30 horizontal bore system (Bruker) to scan 24 consecutive sections. Tumor volumes within the whole lung were quantified using 3-D slicer software to reconstruct MRI volumetric measurements as described previously (Christensen et al., 2014). Acquisition of the MRI signal was adapted according to cardiac and respiratory cycles to minimize motion effects during imaging.
Immune Profiling Flow Cytometry
Mice were humanely euthanized, and mouse lungs were perfused using sterile PBS through heart perfusion from the left ventricle after BAL fluid collection. The whole lung was cut and minced into small pieces followed by digestion in collagenase D (Sigma-Aldrich) and DNase I (Sigma-Aldrich) in Hank’s Balanced Salt Solution (HBSS) at 37°C for 30 minutes. After incubation, the digested tissue was subjected to a 70 m cell strainer (Thermo Fisher Scientific) to obtain single-cell suspensions. Separated cells were treated with 1× red blood cell (RBC) lysis buffer (BioLegend). Live cells were determined by LIVE/DEAD fixable aqua dead cell stain kit (Molecular Probes). The cell pellets were resuspended in PBS with 2% FBS for FACS analysis. Cells were stained with cell surface markers as indicated followed by fixation/permeabilization (eBioscience). Cells were imaged on BD LSRFortessa (BD Biosciences) and analyzed using FlowJo software (Tree Star).
Ex vivo OT-I T cell Assay
The spleen of OT-I mice was minced with a razor and mashed through a 40 m strainer to form a single-cell suspension. Separated cells were then treated with RBC lysis buffer and a number of 5 × 10⁵ cells were seeded in a 96-well U-bottom plate. For conditioned medium culture assay, RPP631 cells were treated with either DMSO or YKL-5–124 for 48 hr and drug was washed off after first 6-hour treatment. Subsequently, DMSO-conditioned medium or YKL-5–124-conditioned medium were collected and added to above single-cell suspension in a 96-well U-bottom plate in the presence of Ova257–264 peptide (10 μg/ml, GenScript, Cat#RP10611) for 4 days as previously described (Barilla et al., 2019). Alternatively, DMSO or YKL-5–124 was added directly to single-cell suspension in the presence of Ova257–264 peptide for 4 days in the T cell assay medium (complete RPMI with HEPES, sodium pyruvate, MEM non-essential amino acids and 2-mercaptethonal). T cell activation markers CD69, TNFα and IFNγ were analyzed by flow cytometry.
Generation of cGAS CRISPR/Cas9 Knockout
Single guide RNA (sgRNA) oligonucleotides (Sigma-Aldrich) targeting cGAS (Table S1) were cloned into lentiviral expression vector lentiCRISPR v2 (Addgene #52961). Lentivirus was generated by transfection of HEK-293T cells with lentiCRISPR v2, or lentiCRISPR v2-sgcGAS and the packaging plasmids psPAX2 (Addgene #12260) and pMD2.G (Addgene #12259) using Lipofectamine 3000 (Thermo Fisher Scientific). Viral particles released into the cell culture supernatant were filtered with 0.45-μm filters and added to target cells.
Bulk-RNA Sequencing Analysis
Paired-end reads were aligned to mouse mm10 genome using STAR (v2.5.2b) (Dobin et al., 2013). Reads with good mapping quality (MAPQ > 30) that aligned to genomic exons were counted using featureCounts (Liao et al., 2014) (mm10 Ensembl 93) to generate a table with counts for each gene. Differential gene expression analysis was performed using the R package DESeq2 (Love et al., 2014) using the lfcShrink function. Genes with false discovery rate (FDR) lower than 0.05 were considered significantly differentially expressed. Gene set enrichment analysis (GSEA) (Subramanian et al., 2005) was performed on a list of genes ranked from high to low DESeq2 estimated fold-change using the GSEAPreRanked function with enrichment statistic classic and 1000 permutations.
Single-cell RNA Sequencing
Experimental Protocol and Library Generation
To account for interindividual variability, we harvested pooled fresh tumor-bearing lungs from two mice in two independent cohorts of RPP orthotopic mice which were treated with control, YKL-5–124, anti-PD-1 and combination treatment for seven days. Single cell suspensions were achieved as described above and were sorted using DAPI staining. Cells were then resuspended into single cells with 0.4% BSA for 10x genomics processing. Cell suspensions were loaded onto a 10x Genomics Chromium instrument to generate single-cell gel beads in emulsion (GEMs). Approximately 5,000 to 10,000 cells were loaded per channel. scRNA-seq libraries were prepared using the following Single Cell 3′ Reagent Kits: Chromium™ Single Cell 3′ Library & Gel Bead Kit v2 (PN-120237), Single Cell 3′ Chip Kit v2 (PN-120236) and i7 Multiplex Kit (PN-120262) (10x Genomics, Pleasanton, CA, USA) as previously described (Zheng et al., 2017), and following the Single Cell 3′ Reagent Kits v2 User Guide (Manual Part # CG00052 Rev A). Libraries were run on an Illumina HiSeq 4000 system (SY-401–4001, Illumina) as 2 × 150 paired-end reads, one full lane per sample, for approximately >90% sequencing saturation.
Data (Pre-)processing
The Cell Ranger Single Cell Software Suite, version 1.3 was used to perform sample de-multiplexing, barcode and UMI processing, and single-cell 3′ gene counting. A detailed description of the pipeline and specific instructions to run it can be found at: https://support.10xgenomics.com/single-cell-gene-expression/software/pipelines/latest/what-is-cell-ranger). A high quality gene expression matrix was created in sequential preprocessing steps as provided in the Seurat (v2.3.4) pipeline (Butler et al., 2018). First only genes that were detected in both independent scRNAseq datasets were retained and cells were excluded if respectively more than 0.2% or 0.3% of detected genes were from mitochondrial or ribosomal origin or if less than 500 genes were detected. The count matrix was subsequently log-normalized with a scale-factor of 10000 and the obtained normalized matrix was further corrected by retaining the residuals after regressing out systematic changes due to number of detected UMIs, percent genes from mitochondrial or ribosomal origin.
Clustering and Annotation
Cells from both independent datasets were merged together in canonical correlation (CC) space using the intersection of highly variable genes, identified as genes with higher-than-expected variability in consecutive ranked expression bins, from both datasets. The implementation of CC alignment and selection of downstream dimensions to use was performed as described in the Seurat package. Cells were clustered using the Louvain algorithm based on a shared nearest-neighbor network. The final resolution of all subsequent clustering analyses was determined by the biological questions and the need for coarse or fine-grained detail as explored in the subsequent cluster annotation. Clusters were annotated using input from multiple sources, we i) calculated a stromal, cancer and immune score using the estimate (v1.0.13) package (Yoshihara et al., 2013) in R, ii) identified cluster specific gene expression markers based on gini-scores, iii) created a hierarchical tree based on Pearson correlation scores between clusters to visualize lineage relationships and iv) compared clusters to those of the Immgen database using the SingleR (v0.2.1) package (Aran et al., 2019) in R. UMAP as implemented by the uwot (v0.0.0.9010) package in R was used to visualize clusters in 2D CC space. Overall this strategy was hierarchically used to asses all cells, cancer cells only, immune cells only and finally T-cells only.
Quality Control
In the first clustering step, several additional analyses were performed to remove dubious or non-reproducible clusters from downstream analyses. To identify contamination of immune cell clusters with cancer cells we performed k-means (2 centers) clustering on all cells on identified and known canonical markers (Epcam, Calca, Stmn1, Ascl1, Krt7, Nfib, Krt8, Krt18) specific to cancer cells. Single-cell outliers with high expression of the aforementioned cancer genes were marked using a density based clustering algorithm using the dbscan (v1.1–3) R package. Similarly, at the cluster level, immune cell clusters with high expression of aforementioned cancer genes were split and labeled as cancer-contaminated and cancer-free cells. Furthermore, clusters that represent doublets were identified using the doubletCluster function of the scran (v1.10.1) (Lun et al., 2016) and scater (v1.10.0) (McCarthy et al., 2017) package in R and concomitantly observing a significant distribution shift for total number of detected UMIs per cell. To detect non-reproducible clusters between datasets we compared changes in distribution and only removed a cluster if this cluster was only observed in all treatment conditions of only one dataset with all individual z-scores greater than 3. Together all marked single-cells identified in any of the previous quality analyses were removed from further analyses.
Cell-cycle Analysis
Cells were first classified in G1, G2/M or S categories using the Cyclone function in the scran package (Scialdone et al., 2015) in R, which provides a discrete grouping based on genes known to be specific to the specific cell-cycle phases. To infer more continuous cell-cycle states we first identified the top 50 genes that are associated with each cell-cycle phase by performing pairwise comparisons using the limma (v3.38.2) package in R (Ritchie et al., 2015). Based on those cell-cycle phase specific genes we calculated a G1, G2/M and S-score for each cell by summarizing the normalized expression values. All cells were subsequently clustered by k-means in eight groups using the three cell-cycle scores. We selected eight groups since there are at least three cell-cycle states and each cell could be considered inside (high score) or outside (low score) a state (2^3 = 8). To visualize the continuous cell-cycle progression states the median of each group was visualized in a 3D plots and nearest neighbors were connected. The 3D visualization was project in 2D by rescaling the average of each k-means group between 0 and 1. To assess changes in cell-cycle progression state distribution upon treatment we calculated the percentage of single-cells within each group for each treatment condition and compared that to vehicle-treated samples.
Gene Set Enrichment Analysis
GSEA (Subramanian et al., 2005) was performed on a list of genes ranked according to limma PI-values (-log10(adjusted p-value) x absolute logFC), using the GSEAPreRanked function with enrichment statistic classic and 1000 permutations. For specific enrichment of superenhancer-associated genes found in (Christensen et al., 2014), a custom gene set for those genes was first created and merged with in the GO BP category of the MSigDB database to obtain the enrichment ranking. Specific gene enrichment within a cluster was visualized by averaging the expression of each gene per cluster and subsequently rescaling z-scores for each gene between −1 and 1.
CD4+ and CD8+ T-cell Identification
To identify CD4+ and CD8+ subgroups within the annotated T-cell cluster, we first over-clustered, to mitigate known dropout effects in single-cell data, the T-cell population and divided all subclusters in CD4+ or CD8+ using k-means clustering (groups = 2) based on the expression of Cd4 and Cd8a. This provided a clear separation between predominant CD4+ and CD8+ cells. scRNAseq uncovered five distinctive clusters of CD4+ T cells (c1, c4, c5, c6 and c7) and seven clusters of CD8+ T cells (c0, c3, c5, c7, c8, c9 and c10). Among these, functionally defined clusters c5 and c7 are comprised of both CD4+ T cells and CD8+ T cells.
CD4+ T Cells
Cells in c1 expressed high levels of Cd4 and the naive T cell marker Sell (CD62L), but lacked the expression of effector/memory T cells marker Cd44 and T cell activation genes, including Ifng, Icos, Lag3, Havcr2 (Tim-3), Pdcd1, Tnfrsf4 and Ctla4. c1 appeared to be naive T cells. c5 showed the highest levels of activated markers such as Icos, Tim-3, Ctla4 and Pdcd1, and intermediate levels of Sell and Cd44, representing an activated/effector T cell signature. c4 expressed much lower levels of these activation markers, and lower Sell and higher Cd44. c6 cells expressed high levels of Cd4 and Foxp3, which are classic markers for regulatory T cells (Tregs). These cells also expressed intermediate levels of T cell activation genes Icos, Ctla4 and Pdcd1. c7 displayed highest levels of Cd44 and low levels of Sell, intermediate levels of T cell activation markers such as Icos, Tim-3 and Pdcd1, indicating an effector/activation T cell signature.
CD8+ T Cells
Both c0 and c8 expressed high levels of Cd8a and naive T cell marker Sell, but low levels of Cd44 and T cell activation genes Lag3, Tim-3, Pdcd1, Ifng, Icos, Tnfrsf4 and Ctla4. c9 expressed intermediate level of Sell and relatively low levels of the T cell activation genes. Thus, c0, c8 and c9 appeared to be naive-like cells and in an inactivated state. c3 expressed high levels of Cd8a and memory T cell marker Klrg1, intermediate levels of cytotoxic T cells marker Gzma and Gzmb, and intermediate levels of two central T cell differentiation genes Tbx21 (T-bet) and Eomes. This cluster of CD8+ T cells is thought to represent “memory” population with cytotoxicity and low proliferation capability. c10 showed the highest levels of T cell activation genes Lag3, Tim-3, Pdcd1, Tnfrsf18 and Ifng, and cytotoxic markers Gzma, Gzmb and Prf1, suggesting these cells are fully differentiated CTLs. c5 expressed low levels of Sell but high levels of effector T cell marker Cd44 and activation markers Icos, Ctla4 and Tnfrsf4, representing an “effector” T cell signature. c7 cells expressed high levels of Mki67 are comprised of a mixture of CD4+ T cells and CD8+ T cells, highlighting their cell proliferation capability. In addition, c5 is another functionally defined cluster of effector/activated T cells, which contain both CD4+ and CD8+ T cells.
Illustration Tool
The graphical abstract image is created with BioRender.
QUANTIFICATION AND STATISTICAL ANALYSIS
Statistical analyses were performed using GraphPad Prism 7 software and statistical significance was determined by p < 0.05. Data are presented as mean with SD unless otherwise specified. Statistical comparisons were performed using unpaired Student t test for two-tailed p value unless otherwise specified (*p < 0.05, **p < 0.01, ***p < 0.001, ****p < 0.0001).
DATA AND CODE AVAILABILITY
The accession number for the raw and processed data of bulk RNA sequencing and single-cell RNA sequencing generated and reported in this paper is GEO: GSE129299.
Supplementary Material
Table S1. RT-qPCR Primer Sequences and sgRNAs, related to STAR Methods.
Highlights.
CDK7 inhibition impairs cell cycle, DNA replication and induces genome instability
CDK7 inhibitor YKL-5–124 activates IFNγ signaling and induces TNFα and CXCL9/10
YKL-5–124 provokes a robust immune program, which is further improved by anti-PD-1
Combining YKL-5–124 with anti-PD-1 and chemotherapy improves tumor response
Significance.
SCLC is one of the deadliest human cancers and new treatment paradigms are urgently needed. Recently, ICB with chemotherapy was approved for first line therapy, however, the added survival benefit remains limited. Here we demonstrate that CDK7 inhibition results in cell cycle disruption and genomic instability while activating immune response signaling in SCLC. This tumor cell-intrinsic effect potentiates activation of infiltrating immune cells, supporting a role of CDK7 in regulating anti-tumor immunity. Our results show that the CDK7 inhibitor YKL-5–124 increases the susceptibility of SCLC to anti-PD-1, and provides better survival in multiple murine SCLC models. Our data suggests that adding YKL-5–124 to ICB and chemotherapy may improve treatment efficacy and survival benefit in patients with SCLC.
Acknowledgement
We thank the NYU Langone Health Preclinical Imaging Laboratory (partially funded by NIH/NCI 5P30CA016087 and NIH P41 EB017183) and the Genome Technology Center (partially supported by P30CA016087) for library preparation and sequencing. This work is supported by a Lung Cancer Research Foundation grant (H.Z.), NCI/NIH K99CA20161 (C.L.C.), K08CA222657(M.G.O.), U01CA213333 (K.K.W. and N.S.G.) and P01 CA154303 (K.K.W.). This work is also supported by the Bridge Project at the Dana-Farber Cancer Institute.
Footnotes
Declaration of Interests
K.K.W. is a founder and equity holder of G1 Therapeutics and has sponsored research agreements with MedImmune, Takeda, TargImmune, Bristol-Myers Squibb (BMS), Mirati, Merus, Alkermes, and consulting and sponsored research agreements with AstraZeneca, Janssen, Pfizer, Novartis, Merck, Ono, and Array. N.G.S. is a founder, science advisory board member (SAB) and equity holder in Gatekeeper, Syros, Petra, C4, B2S and Soltego. The Gray lab receives or has received research funding from Novartis, Takeda, Astellas, Taiho, Janssen, Kinogen, Voronoi, Her2llc, Deerfield and Sanofi. G.M. has research contract agreements with GlaxoSmithKline, Pfizer, and Puretech Health. V.V. has advisory/consult role at Genentech, Merck, BMS, Astrazeneca, Foundation Medicine, Nektar Therapeutics, Alkermes, Reddy labs, Millennium pharma. M.G.O. is a consultant for HVH precision analytics, and has research funding from AstraZeneca and Eli Lilly and Company. H.Z., C.L.C., N.S.G. and K.K.W. have ownship interest in a patent application.
Publisher's Disclaimer: This is a PDF file of an unedited manuscript that has been accepted for publication. As a service to our customers we are providing this early version of the manuscript. The manuscript will undergo copyediting, typesetting, and review of the resulting proof before it is published in its final form. Please note that during the production process errors may be discovered which could affect the content, and all legal disclaimers that apply to the journal pertain.
Publisher's Disclaimer: This is a PDF file of an article that has undergone enhancements after acceptance, such as the addition of a cover page and metadata, and formatting for readability, but it is not yet the definitive version of record. This version will undergo additional copyediting, typesetting and review before it is published in its final form, but we are providing this version to give early visibility of the article. Please note that, during the production process, errors may be discovered which could affect the content, and all legal disclaimers that apply to the journal pertain.
References
- Alexandrov LB, Nik-Zainal S, Wedge DC, Aparicio SA, Behjati S, Biankin AV, Bignell GR, Bolli N, Borg A, Borresen-Dale AL, et al. (2013). Signatures of mutational processes in human cancer. Nature 500, 415–421. [DOI] [PMC free article] [PubMed] [Google Scholar]
- Aran D, Looney AP, Liu L, Wu E, Fong V, Hsu A, Chak S, Naikawadi RP, Wolters PJ, Abate AR, et al. (2019). Reference-based analysis of lung single-cell sequencing reveals a transitional profibrotic macrophage. Nat Immunol 20, 163–172. [DOI] [PMC free article] [PubMed] [Google Scholar]
- Asghar U, Witkiewicz AK, Turner NC, and Knudsen ES (2015). The history and future of targeting cyclin-dependent kinases in cancer therapy. Nat Rev Drug Discov 14, 130–146. [DOI] [PMC free article] [PubMed] [Google Scholar]
- Bakhoum SF, and Cantley LC (2018). The Multifaceted Role of Chromosomal Instability in Cancer and Its Microenvironment. Cell 174, 1347–1360. [DOI] [PMC free article] [PubMed] [Google Scholar]
- Barilla RM, Diskin B, Caso RC, Lee KB, Mohan N, Buttar C, Adam S, Sekendiz Z, Wang J, Salas RD, et al. (2019). Specialized dendritic cells induce tumor-promoting IL-10(+)IL-17(+) FoxP3(neg) regulatory CD4(+) T cells in pancreatic carcinoma. Nat Commun 10, 1424. [DOI] [PMC free article] [PubMed] [Google Scholar]
- Becht E, McInnes L, Healy J, Dutertre CA, Kwok IWH, Ng LG, Ginhoux F, and Newell EW (2018). Dimensionality reduction for visualizing single-cell data using UMAP. Nat Biotechnol. [DOI] [PubMed] [Google Scholar]
- Borst J, Ahrends T, Babala N, Melief CJM, and Kastenmuller W. (2018). CD4(+) T cell help in cancer immunology and immunotherapy. Nat Rev Immunol 18, 635–647. [DOI] [PubMed] [Google Scholar]
- Brunner C, Seiderer J, Schlamp A, Bidlingmaier M, Eigler A, Haimerl W, Lehr HA, Krieg AM, Hartmann G, and Endres S. (2000). Enhanced dendritic cell maturation by TNF-alpha or cytidine-phosphate-guanosine DNA drives T cell activation in vitro and therapeutic anti-tumor immune responses in vivo. J Immunol 165, 6278–6286. [DOI] [PubMed] [Google Scholar]
- Bunn PA Jr., Minna JD, Augustyn A, Gazdar AF, Ouadah Y, Krasnow MA, Berns A, Brambilla E, Rekhtman N, Massion PP, et al. (2016). Small Cell Lung Cancer: Can Recent Advances in Biology and Molecular Biology Be Translated into Improved Outcomes? J Thorac Oncol 11, 453–474. [DOI] [PMC free article] [PubMed] [Google Scholar]
- Butler A, Hoffman P, Smibert P, Papalexi E, and Satija R. (2018). Integrating single-cell transcriptomic data across different conditions, technologies, and species. Nat Biotechnol 36, 411–420. [DOI] [PMC free article] [PubMed] [Google Scholar]
- Carney DN, Bunn PA Jr., Gazdar AF, Pagan JA, and Minna JD (1981). Selective growth in serum-free hormone-supplemented medium of tumor cells obtained by biopsy from patients with small cell carcinoma of the lung. Proc Natl Acad Sci U S A 78, 3185–3189. [DOI] [PMC free article] [PubMed] [Google Scholar]
- Christensen CL, Kwiatkowski N, Abraham BJ, Carretero J, Al-Shahrour F, Zhang T, Chipumuro E, Herter-Sprie GS, Akbay EA, Altabef A, et al. (2014). Targeting transcriptional addictions in small cell lung cancer with a covalent CDK7 inhibitor. Cancer Cell 26, 909–922. [DOI] [PMC free article] [PubMed] [Google Scholar]
- Dobin A, Davis CA, Schlesinger F, Drenkow J, Zaleski C, Jha S, Batut P, Chaisson M, and Gingeras TR (2013). STAR: ultrafast universal RNA-seq aligner. Bioinformatics 29, 15–21. [DOI] [PMC free article] [PubMed] [Google Scholar]
- Ebert PJR, Cheung J, Yang Y, McNamara E, Hong R, Moskalenko M, Gould SE, Maecker H, Irving BA, Kim JM, et al. (2016). MAP Kinase Inhibition Promotes T Cell and Anti-tumor Activity in Combination with PD-L1 Checkpoint Blockade. Immunity 44, 609–621. [DOI] [PubMed] [Google Scholar]
- Fisher RP, and Morgan DO (1994). A novel cyclin associates with MO15/CDK7 to form the CDK-activating kinase. Cell 78, 713–724. [DOI] [PubMed] [Google Scholar]
- Ganuza M, Saiz-Ladera C, Canamero M, Gomez G, Schneider R, Blasco MA, Pisano D, Paramio JM, Santamaria D, and Barbacid M. (2012). Genetic inactivation of Cdk7 leads to cell cycle arrest and induces premature aging due to adult stem cell exhaustion. EMBO J 31, 2498–2510. [DOI] [PMC free article] [PubMed] [Google Scholar]
- George J, Lim JS, Jang SJ, Cun Y, Ozretic L, Kong G, Leenders F, Lu X, Fernandez-Cuesta L, Bosco G, et al. (2015). Comprehensive genomic profiles of small cell lung cancer. Nature 524, 47–53. [DOI] [PMC free article] [PubMed] [Google Scholar]
- Glover-Cutter K, Larochelle S, Erickson B, Zhang C, Shokat K, Fisher RP, and Bentley DL (2009). TFIIH-associated Cdk7 kinase functions in phosphorylation of C-terminal domain Ser7 residues, promoter-proximal pausing, and termination by RNA polymerase II. Mol Cell Biol 29, 5455–5464. [DOI] [PMC free article] [PubMed] [Google Scholar]
- Gubin MM, Esaulova E, Ward JP, Malkova ON, Runci D, Wong P, Noguchi T, Arthur CD, Meng W, Alspach E, et al. (2018). High-Dimensional Analysis Delineates Myeloid and Lymphoid Compartment Remodeling during Successful Immune-Checkpoint Cancer Therapy. Cell 175, 1014–1030 e1019. [DOI] [PMC free article] [PubMed] [Google Scholar]
- Harding SM, Benci JL, Irianto J, Discher DE, Minn AJ, and Greenberg RA (2017). Mitotic progression following DNA damage enables pattern recognition within micronuclei. Nature 548, 466–470. [DOI] [PMC free article] [PubMed] [Google Scholar]
- Harper JW, and Elledge SJ (1998). The role of Cdk7 in CAK function, a retro-retrospective. Genes Dev 12, 285–289. [DOI] [PubMed] [Google Scholar]
- Hellmann MD, Callahan MK, Awad MM, Calvo E, Ascierto PA, Atmaca A, Rizvi NA, Hirsch FR, Selvaggi G, Szustakowski JD, et al. (2018). Tumor Mutational Burden and Efficacy of Nivolumab Monotherapy and in Combination with Ipilimumab in Small-Cell Lung Cancer. Cancer Cell 33, 853–861 e854. [DOI] [PMC free article] [PubMed] [Google Scholar]
- Herndler-Brandstetter D, Ishigame H, Shinnakasu R, Plajer V, Stecher C, Zhao J, Lietzenmayer M, Kroehling L, Takumi A, Kometani K, et al. (2018). KLRG1(+) Effector CD8(+) T Cells Lose KLRG1, Differentiate into All Memory T Cell Lineages, and Convey Enhanced Protective Immunity. Immunity 48, 716–729 e718. [DOI] [PMC free article] [PubMed] [Google Scholar]
- Hills SA, and Diffley JF (2014). DNA replication and oncogene-induced replicative stress. Curr Biol 24, R435–444. [DOI] [PubMed] [Google Scholar]
- Hogquist KA, Jameson SC, Heath WR, Howard JL, Bevan MJ, and Carbone FR (1994). T cell receptor antagonist peptides induce positive selection. Cell 76, 17–27. [DOI] [PubMed] [Google Scholar]
- Horn L, Mansfield AS, Szczesna A, Havel L, Krzakowski M, Hochmair MJ, Huemer F, Losonczy G, Johnson ML, Nishio M, et al. (2018). First-Line Atezolizumab plus Chemotherapy in Extensive-Stage Small-Cell Lung Cancer. N Engl J Med 379, 2220–2229. [DOI] [PubMed] [Google Scholar]
- Huang F, Hartwich TM, Rivera-Molina FE, Lin Y, Duim WC, Long JJ, Uchil PD, Myers JR, Baird MA, Mothes W, et al. (2013). Video-rate nanoscopy using sCMOS camera-specific single-molecule localization algorithms. Nat Methods 10, 653–658. [DOI] [PMC free article] [PubMed] [Google Scholar]
- Hyrien O. (2016). How MCM loading and spreading specify eukaryotic DNA replication initiation sites.F1000Res 5. [DOI] [PMC free article] [PubMed] [Google Scholar]
- Kanin EI, Kipp RT, Kung C, Slattery M, Viale A, Hahn S, Shokat KM, and Ansari AZ (2007). Chemical inhibition of the TFIIH-associated kinase Cdk7/Kin28 does not impair global mRNA synthesis. Proc Natl Acad Sci U S A 104, 5812–5817. [DOI] [PMC free article] [PubMed] [Google Scholar]
- Kwiatkowski N, Zhang T, Rahl PB, Abraham BJ, Reddy J, Ficarro SB, Dastur A, Amzallag A, Ramaswamy S, Tesar B, et al. (2014). Targeting transcription regulation in cancer with a covalent CDK7 inhibitor. Nature 511, 616–620. [DOI] [PMC free article] [PubMed] [Google Scholar]
- Larochelle S, Amat R, Glover-Cutter K, Sanso M, Zhang C, Allen JJ, Shokat KM, Bentley DL, and Fisher RP (2012). Cyclin-dependent kinase control of the initiation-to-elongation switch of RNA polymerase II. Nat Struct Mol Biol 19, 1108–1115. [DOI] [PMC free article] [PubMed] [Google Scholar]
- Larochelle S, Merrick KA, Terret ME, Wohlbold L, Barboza NM, Zhang C, Shokat KM, Jallepalli PV, and Fisher RP (2007). Requirements for Cdk7 in the assembly of Cdk1/cyclin B and activation of Cdk2 revealed by chemical genetics in human cells. Mol Cell 25, 839–850. [DOI] [PMC free article] [PubMed] [Google Scholar]
- Liao Y, Smyth GK, and Shi W. (2014). featureCounts: an efficient general purpose program for assigning sequence reads to genomic features. Bioinformatics 30, 923–930. [DOI] [PubMed] [Google Scholar]
- Love MI, Huber W, and Anders S. (2014). Moderated estimation of fold change and dispersion for RNA-seq data with DESeq2. Genome Biol 15, 550. [DOI] [PMC free article] [PubMed] [Google Scholar]
- Lun AT, McCarthy DJ, and Marioni JC (2016). A step-by-step workflow for low-level analysis of single-cell RNA-seq data with Bioconductor. F1000Res 5, 2122. [DOI] [PMC free article] [PubMed] [Google Scholar]
- Mackenzie KJ, Carroll P, Martin CA, Murina O, Fluteau A, Simpson DJ, Olova N, Sutcliffe H, Rainger JK, Leitch A, et al. (2017). cGAS surveillance of micronuclei links genome instability to innate immunity. Nature 548, 461–465. [DOI] [PMC free article] [PubMed] [Google Scholar]
- McCarthy DJ, Campbell KR, Lun AT, and Wills QF (2017). Scater: pre-processing, quality control, normalization and visualization of single-cell RNA-seq data in R. Bioinformatics 33, 1179–1186. [DOI] [PMC free article] [PubMed] [Google Scholar]
- Merrick KA, Larochelle S, Zhang C, Allen JJ, Shokat KM, and Fisher RP (2008). Distinct activation pathways confer cyclin-binding specificity on Cdk1 and Cdk2 in human cells. Mol Cell 32, 662–672. [DOI] [PMC free article] [PubMed] [Google Scholar]
- Olson CM, Liang Y, Leggett A, Park WD, Li L, Mills CE, Elsarrag SZ, Ficarro SB, Zhang T, Duster R, et al. (2019). Development of a Selective CDK7 Covalent Inhibitor Reveals Predominant Cell-Cycle Phenotype. Cell Chem Biol. [DOI] [PMC free article] [PubMed] [Google Scholar]
- Oser MG, Sabet AH, Gao W, Chakraborty AA, Schinzel AC, Jennings RB, Fonseca R, Bonal DM, Booker MA, Flaifel A, et al. (2019). The KDM5A/RBP2 histone demethylase represses NOTCH signaling to sustain neuroendocrine differentiation and promote small cell lung cancer tumorigenesis. Genes Dev. [DOI] [PMC free article] [PubMed] [Google Scholar]
- Ritchie ME, Phipson B, Wu D, Hu Y, Law CW, Shi W, and Smyth GK (2015). limma powers differential expression analyses for RNA-sequencing and microarray studies. Nucleic Acids Res 43, e47. [DOI] [PMC free article] [PubMed] [Google Scholar]
- Rust MJ, Bates M, and Zhuang X. (2006). Sub-diffraction-limit imaging by stochastic optical reconstruction microscopy (STORM). Nat Methods 3, 793–795. [DOI] [PMC free article] [PubMed] [Google Scholar]
- Salmon H, Idoyaga J, Rahman A, Leboeuf M, Remark R, Jordan S, Casanova-Acebes M, Khudoynazarova M, Agudo J, Tung N, et al. (2016). Expansion and Activation of CD103(+) Dendritic Cell Progenitors at the Tumor Site Enhances Tumor Responses to Therapeutic PD-L1 and BRAF Inhibition. Immunity 44, 924–938. [DOI] [PMC free article] [PubMed] [Google Scholar]
- Schachter MM, and Fisher RP (2013). The CDK-activating kinase Cdk7: taking yes for an answer. Cell Cycle 12, 3239–3240. [DOI] [PMC free article] [PubMed] [Google Scholar]
- Schachter MM, Merrick KA, Larochelle S, Hirschi A, Zhang C, Shokat KM, Rubin SM, and Fisher RP (2013). A Cdk7-Cdk4 T-loop phosphorylation cascade promotes G1 progression. Mol Cell 50, 250–260. [DOI] [PMC free article] [PubMed] [Google Scholar]
- Schaffer BE, Park KS, Yiu G, Conklin JF, Lin C, Burkhart DL, Karnezis AN, Sweet-Cordero EA, and Sage J. (2010). Loss of p130 accelerates tumor development in a mouse model for human small-cell lung carcinoma. Cancer Res 70, 3877–3883. [DOI] [PMC free article] [PubMed] [Google Scholar]
- Schreiber RD, Old LJ, and Smyth MJ (2011). Cancer immunoediting: integrating immunity’s roles in cancer suppression and promotion. Science 331, 1565–1570. [DOI] [PubMed] [Google Scholar]
- Scialdone A, Natarajan KN, Saraiva LR, Proserpio V, Teichmann SA, Stegle O, Marioni JC, and Buettner F. (2015). Computational assignment of cell-cycle stage from single-cell transcriptome data. Methods 85, 54–61. [DOI] [PubMed] [Google Scholar]
- Semenova EA, Nagel R, and Berns A. (2015). Origins, genetic landscape, and emerging therapies of small cell lung cancer. Genes Dev 29, 1447–1462. [DOI] [PMC free article] [PubMed] [Google Scholar]
- Sen T, Rodriguez BL, Chen L, Corte CMD, Morikawa N, Fujimoto J, Cristea S, Nguyen T, Diao L, Li L, et al. (2019). Targeting DNA Damage Response Promotes Antitumor Immunity through STING-Mediated T-cell Activation in Small Cell Lung Cancer. Cancer Discov 9, 646–661. [DOI] [PMC free article] [PubMed] [Google Scholar]
- Sengupta P, Jovanovic-Talisman T, Skoko D, Renz M, Veatch SL, and Lippincott-Schwartz J. (2011). Probing protein heterogeneity in the plasma membrane using PALM and pair correlation analysis. Nat Methods 8, 969–975. [DOI] [PMC free article] [PubMed] [Google Scholar]
- Serizawa H, Conaway JW, and Conaway RC (1993). Phosphorylation of C-terminal domain of RNA polymerase II is not required in basal transcription. Nature 363, 371–374. [DOI] [PubMed] [Google Scholar]
- Serizawa H, Makela TP, Conaway JW, Conaway RC, Weinberg RA, and Young RA (1995). Association of Cdk-activating kinase subunits with transcription factor TFIIH. Nature 374, 280–282. [DOI] [PubMed] [Google Scholar]
- Sharma P, and Allison JP (2015). The future of immune checkpoint therapy. Science 348, 56–61. [DOI] [PubMed] [Google Scholar]
- Shiekhattar R, Mermelstein F, Fisher RP, Drapkin R, Dynlacht B, Wessling HC, Morgan DO, and Reinberg D. (1995). Cdk-activating kinase complex is a component of human transcription factor TFIIH. Nature 374, 283–287. [DOI] [PubMed] [Google Scholar]
- Spranger S, Dai D, Horton B, and Gajewski TF (2017). Tumor-Residing Batf3 Dendritic Cells Are Required for Effector T Cell Trafficking and Adoptive T Cell Therapy. Cancer Cell 31, 711–723 e714. [DOI] [PMC free article] [PubMed] [Google Scholar]
- Subramanian A, Tamayo P, Mootha VK, Mukherjee S, Ebert BL, Gillette MA, Paulovich A, Pomeroy SL, Golub TR, Lander ES, and Mesirov JP (2005). Gene set enrichment analysis: a knowledge-based approach for interpreting genome-wide expression profiles. Proc Natl Acad Sci U S A 102, 15545–15550. [DOI] [PMC free article] [PubMed] [Google Scholar]
- van Meerbeeck JP, Fennell DA, and De Ruysscher DK (2011). Small-cell lung cancer. Lancet 378, 1741–1755. [DOI] [PubMed] [Google Scholar]
- Veatch SL, Machta BB, Shelby SA, Chiang EN, Holowka DA, and Baird BA (2012). Correlation functions quantify super-resolution images and estimate apparent clustering due to over-counting. PLoS One 7, e31457. [DOI] [PMC free article] [PubMed] [Google Scholar]
- Yin Y, Lee WTC, and Rothenberg E. (2019). Ultrafast data mining of molecular assemblies in multiplexed high-density super-resolution images. Nat Commun 10, 119. [DOI] [PMC free article] [PubMed] [Google Scholar]
- Yoshihara K, Shahmoradgoli M, Martinez E, Vegesna R, Kim H, Torres-Garcia W, Trevino V, Shen H, Laird PW, Levine DA, et al. (2013). Inferring tumour purity and stromal and immune cell admixture from expression data. Nat Commun 4, 2612. [DOI] [PMC free article] [PubMed] [Google Scholar]
- Zhang T, Kwiatkowski N, Olson CM, Dixon-Clarke SE, Abraham BJ, Greifenberg AK, Ficarro SB, Elkins JM, Liang Y, Hannett NM, et al. (2016). Covalent targeting of remote cysteine residues to develop CDK12 and CDK13 inhibitors. Nat Chem Biol 12, 876–884. [DOI] [PMC free article] [PubMed] [Google Scholar]
- Zheng GX, Terry JM, Belgrader P, Ryvkin P, Bent ZW, Wilson R, Ziraldo SB, Wheeler TD, McDermott GP, Zhu J, et al. (2017). Massively parallel digital transcriptional profiling of single cells. Nat Commun 8, 14049. [DOI] [PMC free article] [PubMed] [Google Scholar]
Associated Data
This section collects any data citations, data availability statements, or supplementary materials included in this article.
Supplementary Materials
Table S1. RT-qPCR Primer Sequences and sgRNAs, related to STAR Methods.
Data Availability Statement
The accession number for the raw and processed data of bulk RNA sequencing and single-cell RNA sequencing generated and reported in this paper is GEO: GSE129299.