

Abstract
Background:
Caloric restriction (CR) delays the onset of metabolic and age-related disorders. Recent studies have demonstrated that formation of beige adipocytes induced by CR is strongly associated with extracellular remodeling in adipose tissue, decrease in adipose tissue inflammation, and improved systemic metabolic homeostasis. However, beige adipocytes rapidly transition to white upon CR withdrawal through unclear mechanisms.
Materials and methods:
Six-week old C57BL6 mice were fed with 40% CR chow diet for 6 weeks. Subsequently, one group of mice was switched back to ad libitum chow diet, which was continued for additional 2 weeks. Adipose tissues were assessed histologically and biochemically for beige adipocytes.
Results:
Beige adipocytes induced by CR rapidly transition to white adipocytes when CR is withdrawn independent of parkin-mediated mitophagy. We demonstrate that the involution of mitochondria during CR withdrawal is strongly linked with a decrease in mitochondrial biogenesis. We further demonstrate that beige-to-white fat transition upon β3-AR agonist-withdrawal could be attenuated by CR, partly via maintenance of mitochondrial biogenesis.
Conclusion:
In the model of CR, our study highlights the dominant role of mitochondrial biogenesis in the maintenance of beige adipocytes. We propose that loss of beige adipocytes upon β3-AR agonist withdrawal could be attenuated by CR.
Keywords: Caloric restriction, mitochondrial biogenesis, mitochondrial dynamics, fission, fusion, mitophagy, beige adipocytes
1. Introduction
Adipose tissue is one of the most dynamic organs in the mammalian system that integrates metabolic cues to store triglycerides or undergo lipolysis, and adipose tissue dysfunction plays a key role in obesity-associated metabolic diseases [1, 2]. The adipose tissue possesses two forms of adipocytes, namely white and brown adipocytes. Recent studies have uncovered another form of inducible adipocytes in the white fat depots namely beige (or brite) adipocytes [3]. Beige cells are multilocular adipocytes with cristae-dense mitochondria that promote energy expenditure via uncoupled protein 1 (UCP1)-dependent and independent non-shivering thermogenesis [3–7]. Induction of beige adipocytes improves metabolic homeostasis [8, 9] and thus, beige adipocytes become an attractive target for combating obesity-associated metabolic disorders.
Obesity is a man-made health disaster that has affected the present generation and may also affect the future generations. The origin of obesity can be easily traced back to cultural changes, which include unhealthy food habits and a sedentary lifestyle, which significantly impacted the overall energy balance [10, 11]. Caloric restriction (CR) is known to promote metabolic health and longevity [12, 13]. Recent evidence shows that CR could decrease the incidence of cancer and improve chemotherapeutic outcomes in cancer patients [14, 15]. The earlier studies with CR mainly focused on muscle and liver biology with less emphasis on the adipose tissue. However, a recent study from Fabbiano et al. has demonstrated that CR induces UCP1-positive beige adipocytes that confer the metabolic effects of CR [16]. However, subsequent studies from other groups could not identify UCP1 expression during CR [17, 18]. Therefore, the identity of the CR-induced beige adipocytes remains unknown. Beige adipocytes tend to transition to white adipocytes upon stimulus withdrawal through mitochondrial clearance driven by parkin-mediated mitophagy [19, 20]. Indeed, CR withdrawal reverses the beigeing of white adipose tissue (WAT) [16]. It is unclear whether parkin-mediated mitophagy is involved in the reversal of CR-induced beigeing of the WAT.
In this study, we show that CR induces beige adipocytes, which express genes involved in the futile creatine substrate cycle. We demonstrate that sustained mitochondrial biogenesis including augmented mitochondrial dynamics is essential for CR-mediated induction and maintenance of beige adipocytes. Using parkin knockout mice, we demonstrate that beige-to-white adipocyte transition during CR withdrawal is due to decrease in mitochondrial biogenesis, but not via parkin-mediated mitophagy. We also demonstrate that CR attenuates CL withdrawal-mediated loss of beige adipocytes by sustaining mitochondrial biogenesis in the WAT.
2. STAR Methods
2.1. Animal studies
C57BL6 mice on normal chow or 60% high-fat diet for 7 weeks were purchased from Jackson Laboratories, Bar Harbor, ME, USA. Upon arrival, all the mice were housed individually in a specific pathogen-free facility with 12-hr day and night cycles and continued on their respective chow diet (D12450J, Research Diets, New Brunswick, NJ, USA) or 60% high-fat diet (D12492, Research Diets). After 3 days of acclimatization in the animal facility, the mice were divided into two groups and were fed ad libitum (RD-AL) or 40% less calories (CR) than those consumed by the age-matched ad libitum group for 6 weeks, unless mentioned otherwise in the figure legends. For CR withdrawal, 40% CR was performed for 6 weeks following which one group of mice was switched back to ad libitum feeding, which was continued for additional 2 weeks. After the acclimatization period, the diet-induced obese mice models were 40% calorie restricted with high-fat diet as detailed in the figure legends. β3-adrenergic agonist CL316, 243 (CL) was injected in the mice intraperitoneally at the dosage of 1 mg/kg bodyweight once a day for 7 days. Weekly food intake was monitored and the mice on CR were fed daily between 17.00 and 18.00 h. The body weights of the mice were recorded daily throughout the experiment. Generation of global Parkin knockout (Park2−/−) mice has been described before [21]. The Park2−/− mice were purchased from Jackson Labs to establish a breeding colony at the University of Pittsburgh. The colony was maintained using heterozygous breeding pairs and study mice were female wild type mice and knockout littermates. All the animal procedures were approved by the University of Pittsburgh Institutional Animal Care and Use Committee.
2.2. Tissue histology and immunohistochemistry
Hematoxylin and Eosin (H&E) staining was performed in 6-μm thick sections of formalin-fixed paraffin-embedded (FFPE) tissues. For immunohistochemistry, FFPE sections were antigen retrieved using citrate buffer (10 mM sodium citrate and 0.05% tween-20 pH 6.0) at 95°C for 15 min. Next, peroxidase blocking was performed for 15 min using methanol containing 0.3% H2O2, followed by Avidin/Biotin (PK6100, Vector Labs) blocking for an additional 15 min at room temperature. The sections were then blocked with 5% goat serum in PBST for 30 min at room temperature and incubated overnight with a primary antibody against TOM20 (Invitrogen, Waltham, MA, USA) in a humidified chamber at 4°C. The sections were subsequently stained with a secondary antibody for 1 h at room temperature and developed using DAB Peroxidase Substrate kit (Vector Labs, Burlingame, CA, USA). Images were acquired using Olympus Provis microscope and processed for noise background equally.
2.3. Adipose tissue transmission electron microscopy
For ultrastructural analysis of the mitochondria, inguinal adipose tissue was fixed with cold 2.5% glutaraldehyde in 0.01 M PBS for 4 h at room temperature and post-fixed in 1% osmium tetroxide containing 1% potassium ferricyanide. The specimens were then rinsed in PBS, dehydrated using a graded series of ethanol and propylene oxide, and embedded in Poly/Bed® 812 (Luft formulations). Semi-thin (300 nm) sections were obtained using Leica Reichart Ultracut microtome (Leica microsystems, Buffalo Groove, IL, USA), stained with 0.5% toluidine blue in 1% sodium borate, and examined under the light microscope. Ultrathin sections (65 nm) were stained with uranyl acetate and Reynold’s lead citrate and examined using JEOL 1011 transmission electron microscope equipped with a side mount AMT 2k digital camera (Advanced Microscopy Techniques, Danvers, MA, USA).
2.4. Western blot analysis
Protein extracts from tissues were prepared using RIPA lysis buffer (50 mM Tris pH 7.4, 150 mM NaCl, 5 mM EDTA, 1% NP-40) containing protease and phosphatase inhibitors (Sigma Aldrich, St Louis, MO, USA). About 20–25μg of protein extracts were separated on 8–15% polyacrylamide gels and transferred onto nitrocellulose or PVDF membranes. The membranes were blocked with 5% skimmed milk powder in tris-buffered saline containing 0.01% tween-20 and probed with primary antibodies overnight at 4°C. The membranes were then probed with secondary antibodies (Cell Signaling Technology, Boston, MA, USA) conjugated with DyLight and visualized using Odyssey CLx Imaging System (LI-COR, Lincoln, NE, USA). List of primary antibodies and other details are given in Table 1. The western blot images were quantified using ImageJ software (NIH, Bethesda, MD, USA).
2.4. RNA isolation and real-time PCR
Total RNA was extracted using TRIzol (Invitrogen) or RNeasy Lipid Tissue Mini Kit (Qiagen) following the manufacturer’s protocol. About 1 μg of total RNA was reverse transcribed using Mu-MLV reverse transcriptase (Promega, Madison, WI, USA) and the relative expression of genes was assessed using SYBR Green master mix (Radiant Molecular Tools, Fort Lauderdale, FL, USA) and QuantStudio 3 Station qPCR machine (Applied Biosystems, Foster City, CA, USA). Gene expression was estimated using a comparative CT method and 18S or β-actin was used as an internal normalization control. Primer sequences are provided in Table 2.
2.5. Intraperitoneal glucose and insulin tolerance tests (ipGTT and ipITT)
The ipGTT and ipITT were performed on awake mice that were fasted for 6 h. Briefly, for ipGTT, 20% glucose was administered intraperitoneally at 1.5 g/kg lean mass, and for ipITT, insulin was injected at 0.75 U/kg lean mass. The tail was snipped and blood glucose level was measured after 0, 15, 30, 45, 60, and 120 min of glucose administration using a glucometer (Bayer, Parsippany, NJ, USA).
2.6. Serum insulin
Serum insulin levels were measured using an insulin rodent chemiluminescence ELISA kit (ALPCO, Salem, NH, USA) following the manufacturer’s instructions.
2.7. Body composition analysis
Whole body composition of conscious living mice was analyzed via EchoMRI (EchoMRI LLC, TX, USA). Percent fat and lean mass were calculated for individual mice by dividing the weight of the tissue determined by EchoMRI with the body weight.
2.8. Indirect calorimetry
Energy expenditure was measured by indirect calorimetry using the Promethion Multiplexed Metabolic Cage System (Sable Systems, Las Vegas, NV, USA). Mice were housed individually in a home cage setting and fed either ad libitum or a calculated amount of food around 18.00–19.00 h every day. All the mice had free access to water. The first 24 h were considered as acclimatization period and data collected during this time were not considered for analysis. Energy expenditure was normalized to lean body mass immediately after indirect calorimetry.
2.9. Mitochondrial respirometry
Mitochondrial respirometry rates were determined in fresh permeabilized adipose tissue (iWAT) samples using O2K respirometer (Oroboros Instruments). In brief, the finely minced fat depot was placed in ice-cold BIOPS buffer (10 mM Ca-EGTA buffer, 0.1 μM free calcium, 5.77 mM ATP, 6.56 mM MgCl2, 20 mM taurine, 15 mM phosphocreatine, 20 mM imidazole, 0.5 mM DTT, and 50 mM MES hydrate). The tissue was permeabilized with Saponin (final concentration 100μg/ml) and then incubated on a rotational mixer for 30 mins at 4°C. The fat tissue was washed several times with Saponin through 3 cycles of centrifugation (5000xg, 4C, 5 minutes) and replaced with fresh BIOPS buffer for 5 minutes on the rotational mixer. Finally, the fat depot was transferred to Oroboros O2K Respirometer, which contained 2ml Mir05 respiration medium and the chamber was sealed. Once baseline respiration was achieved, the tissue was subjected to titrations of substrates (10μM cytochrome C, 5mM pyruvate, 2mM malate, 10mM glutamate, 2mM ADP, 2.5μM oligomyin, 1.5μM carbonyl cyanide-4-phenylhydrazone (FCCP) in 0.5μM increments, and 2.5μM antimycin A). Oxygen consumption was normalized to tissue weight.
2.10. Cell culture
Primary mouse inguinal adipose-derived stromal vascular fraction (SVF) cells were isolated as described previously [22]. The SVF cells were cultured to confluency in advanced Dulbecco’s Minimum Essential Medium (DMEM/F12) containing 10% fetal bovine serum (FBS) and 1% penicillin/streptomycin cocktail. The cells were then trypsinized and plated in a 12-well plate and differentiated using a brown adipocyte cocktail containing 0.5 mM isobutylmethylxanthine, 125 nM indomethacin, 2 μg/mL dexamethasone, 850 nM insulin, 1 nM T3, and 0.5 μM rosiglitazone [19]. After two days, the cells were maintained on a maintenance medium containing DMEM/F12 supplemented with 850 nM insulin, 1 nM T3, and 0.5 μM rosiglitazone. Protein lysates and RNA were obtained every 2 days for 6 days.
2.11. Statistical data analysis
The experimental data were analyzed using GraphPad Prism 8 software and presented as mean ± standard error of mean (SE). Significance between experimental groups was derived using unpaired t-test (Two-tailed) for two groups and one-way ANOVA (Tukey’s multiple comparison test) for multiple groups. p<0.05 was considered significant.
3. Results
3.1. CR-mediated mitochondrial biogenesis and dynamics promote beigeing of WAT
To determine the effect of CR on mitochondrial remodeling of adipose tissue, C57BL6 mice were calorie-restricted (40% CR) for 6 weeks. CR progressively decreased the body weight of the mice (Figure 1A) leading to a significant decrease in fat but not lean mass (Figures S1A and B). Six weeks of CR decreased fasting glucose levels (Figure S1C) and improved glucose tolerance (Figure 1B). Further, insulin tolerance test (ITT) showed a trend towards better insulin sensitivity in CR mice and the blood glucose levels remained lower at all time-points in the CR group (Figure S1D and E). Glucose-stimulated insulin secretion showed lower insulin levels in CR mice but islet size was not different between the groups (Figure S1F–H). H&E analysis showed an increased number of smaller multilocular adipocytes in the inguinal white adipose tissue (iWAT) of CR mice, a typical feature of beige adipocytes (Figure 1C (top panel)). Another important feature of beige adipocytes is the increased mitochondrial content [23]. Immunohistochemistry (TOM20), western blot, and qPCR analysis for mitochondrial markers showed an increased mitochondrial content in the iWAT of CR mice (Figures 1C (bottom panel)-1D and S1I). Further, transmission electron microscopy showed an increased number of small spherical mitochondria in the iWAT of CR mice, a characteristic feature of beige adipocytes (Figure 1E and S1J). Similarly, CR led to increase in the number of beige adipocytes in epididymal WAT (eWAT) (Figures S1K and L). These data are consistent with the previous reports that CR induces beigeing of WAT [16].
Figure 1. CR-induced mitochondrial biogenesis promotes CKMT2-beige adipocytes.
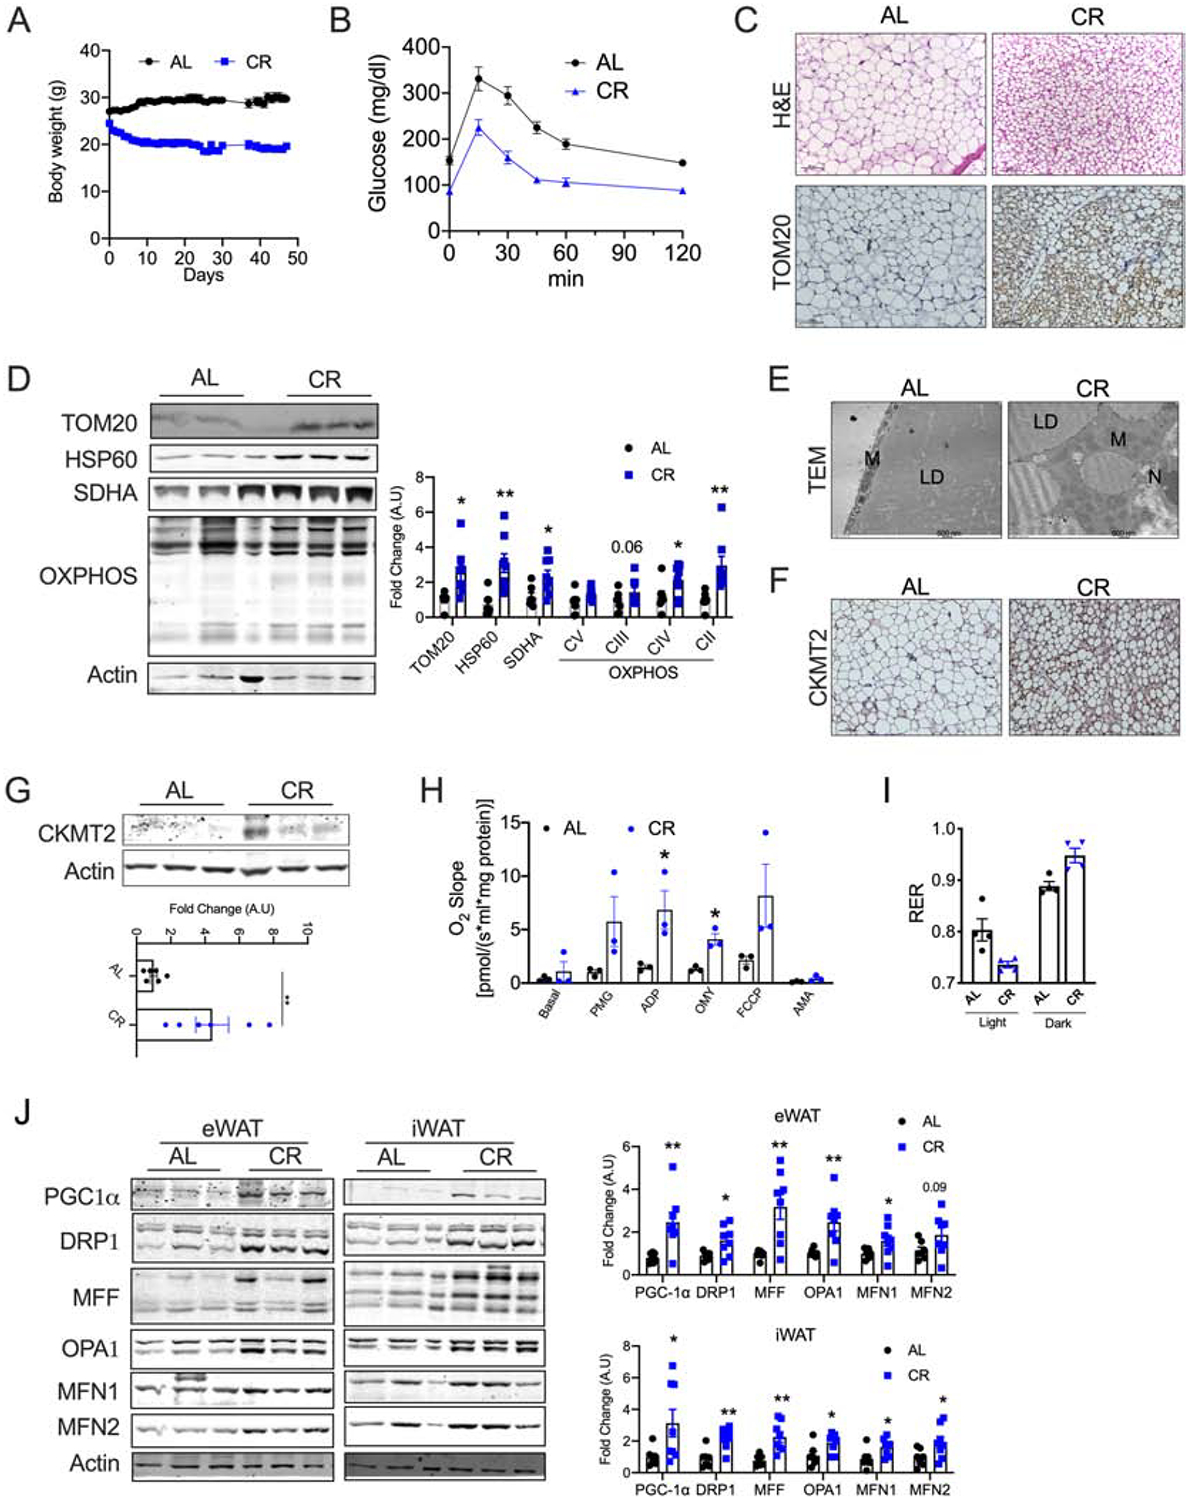
Six-weeks old C57BL6 mice were fed with 40% less calories (CR) for 6 weeks compared to control mice who were fed with chow diet ad libitum (AL). (A) Body weight of the mice. (B) Intraperitoneal glucose tolerance test in CR mice. (C) H&E staining (top panel) and immunohistochemistry for TOM20 (bottom panel) in iWAT, magnification - 20X. (D) Immunoblots and densitometric analysis for the mitochondrial and OXPHOS proteins in the iWAT. (E) Transmission electron micrograph images in the iWAT (M=Mitochondria, LD=Lipid droplet, N=Nucleus), magnification - 20,000X. (F) Immunohistochemistry for CKMT2 in iWAT, magnification - 20X. (G) Western blot and densitometric analysis for CKMT2 in the iWAT. (H) Oxygen consumption in the iWAT assessed by Oroboros. (I) Respiratory exchange ratio (RER) assessed by indirect calorimetry in the CR mice (n=4 mice/group). (J) Immunoblots and densitometric analysis for proteins involved in mitochondrial biogenesis and dynamics in the WAT and iWAT of CR mice. Results are representative data from one cohort. Bar graphs are presented as mean SE ± SEM (*p < 0.05, **p < 0.01).
In the CR-induced beige adipocytes, the expression of UCP1 remains controversial [16–18]. In our study, we found high variability in UCP1 expression following CR (Figure S1M). A reciprocal relationship exists between the expression of UCP1 and creatine kinase mitochondrial 2 (CKMT2), which is involved in the futile creatine substrate cycle for promotion of energy expenditure [24, 25]. Immunohistochemical and western analysis showed a significant increase in the expression of CKMT2 in the iWAT of CR mice (Figures 1F and G). We found that the mRNA levels of Phospho1, a phosphatase involved in the creatine-driven substrate cycle, were induced in the iWAT of CR mice. However, the expression of genes involved in creatine metabolism such as Gamt, Ckmt1, and Slc6a8 is not affected by CR (Figure S1N). Together, the data shows that the beige adipocytes induced by CR express genes involved in the futile creatine substrate cycle.
To determine whether CR induces functional beige adipocytes, we assessed oxygen consumption in the iWAT using Oroboros. When compared to the AL group, CR increased the oxygen consumption in the isolated iWAT demonstrating increased oxidative capacity (Figure 1H). To gain a deeper insight, we assessed the CR-induced metabolic adaptation by indirect calorimetry. During the light phase, relative fat utilization as reflected by a reduced respiratory exchange ratio (RER) was increased in the CR mice (Figures 1I). Interestingly, CR promoted a rapid switch in RER between the light and dark phases (1.3-fold in CR vs. 1.1-fold in AL group), indicating that when nutrients are available, CR mice rapidly switch from fat to carbohydrate metabolism (Figure 1I). Together, the data shows that metabolic flexibility in utilizing the available substrates is improved by CR.
We then investigated the mechanisms by which CR induces beige adipocytes. Mitochondrial homeostasis is regulated by a balance between mitochondrial biogenesis and clearance via mitophagy [25]. Mitochondrial biogenesis encompasses biogenesis, fission, and fusion. PGC-1α is known to be a critical driver of CR-mediated mitochondrial biogenesis [17, 26]. However, the roles of mitochondrial dynamics driven by fission and fusion are often underestimated. Fission is driven by the cytosolic protein dynamin-related protein 1 (DRP1), which binds to its receptor mitochondrial fission factor (MFF) on the outer mitochondrial membrane. Conversely, optic atrophy 1 (OPA1), mitofusin 1 (MFN1), and MFN2 promote mitochondrial fusion [27]. Western blot data showed that CR induces the expression of genes involved in biogenesis (PGC-1α), fission (DRP1 and MFF), and fusion (OPA1, MFN1 and 2) in both iWAT and eWAT (Figure 1J). The mRNA levels were in line with the protein levels in the iWAT (Figure S1O). When we assessed the SVF cells differentiated to beige adipocytes, we found a similar increase in the levels of biogenesis and dynamics-related proteins (Figure S1P). CR is known to induce mitophagy in a tissue-specific manner [28]. We found a moderate increase in p62 expression, but no difference was observed in LC3B expression (Figures S1Q), suggesting a modest effect of 6-week CR on autophagy in the WAT. Together, the data indicate that mitochondrial biogenesis and dynamics play a key role in CR-mediated induction of beige adipogenesis.
3.2. Short-term CR does not affect mitochondrial dynamics in BAT and other CR-responsive tissues
We further assessed whether CR induced beigeing markers in BAT. We did not observe any significant changes in the mitochondrial markers in the BAT as assessed by real-time PCR and western blotting (Figure 2A and B). In line with mitochondrial markers, we did not observe any changes in the levels of mitochondrial dynamics-related proteins in the BAT (Figure 2C). As earlier studies have demonstrated a potential involvement of the liver and muscle in CR-mediated metabolic homeostasis [29–31], we studied the mitochondrial dynamics in the liver and muscle. Short-term CR did not affect mitochondrial homeostasis in the liver as revealed by the assessment of mitochondrial markers and dynamics-related proteins (Figure 2D and E). Moreover, 6 weeks of CR is not sufficient to induce the hepatic expression of G6PASE and PEPCK, key genes involved in gluconeogenesis (Figure 2F). Similarly, short-term CR did not affect the mitochondrial homeostasis in the skeletal muscle (Figure 2G and H). Together, our data demonstrate that short-term CR for 6 weeks induces mitochondrial biogenesis and dynamics in the WAT but not in the BAT, liver, and skeletal muscle.
Figure 2: CR did not induce mitochondrial remodeling in the BAT, liver, and muscle.
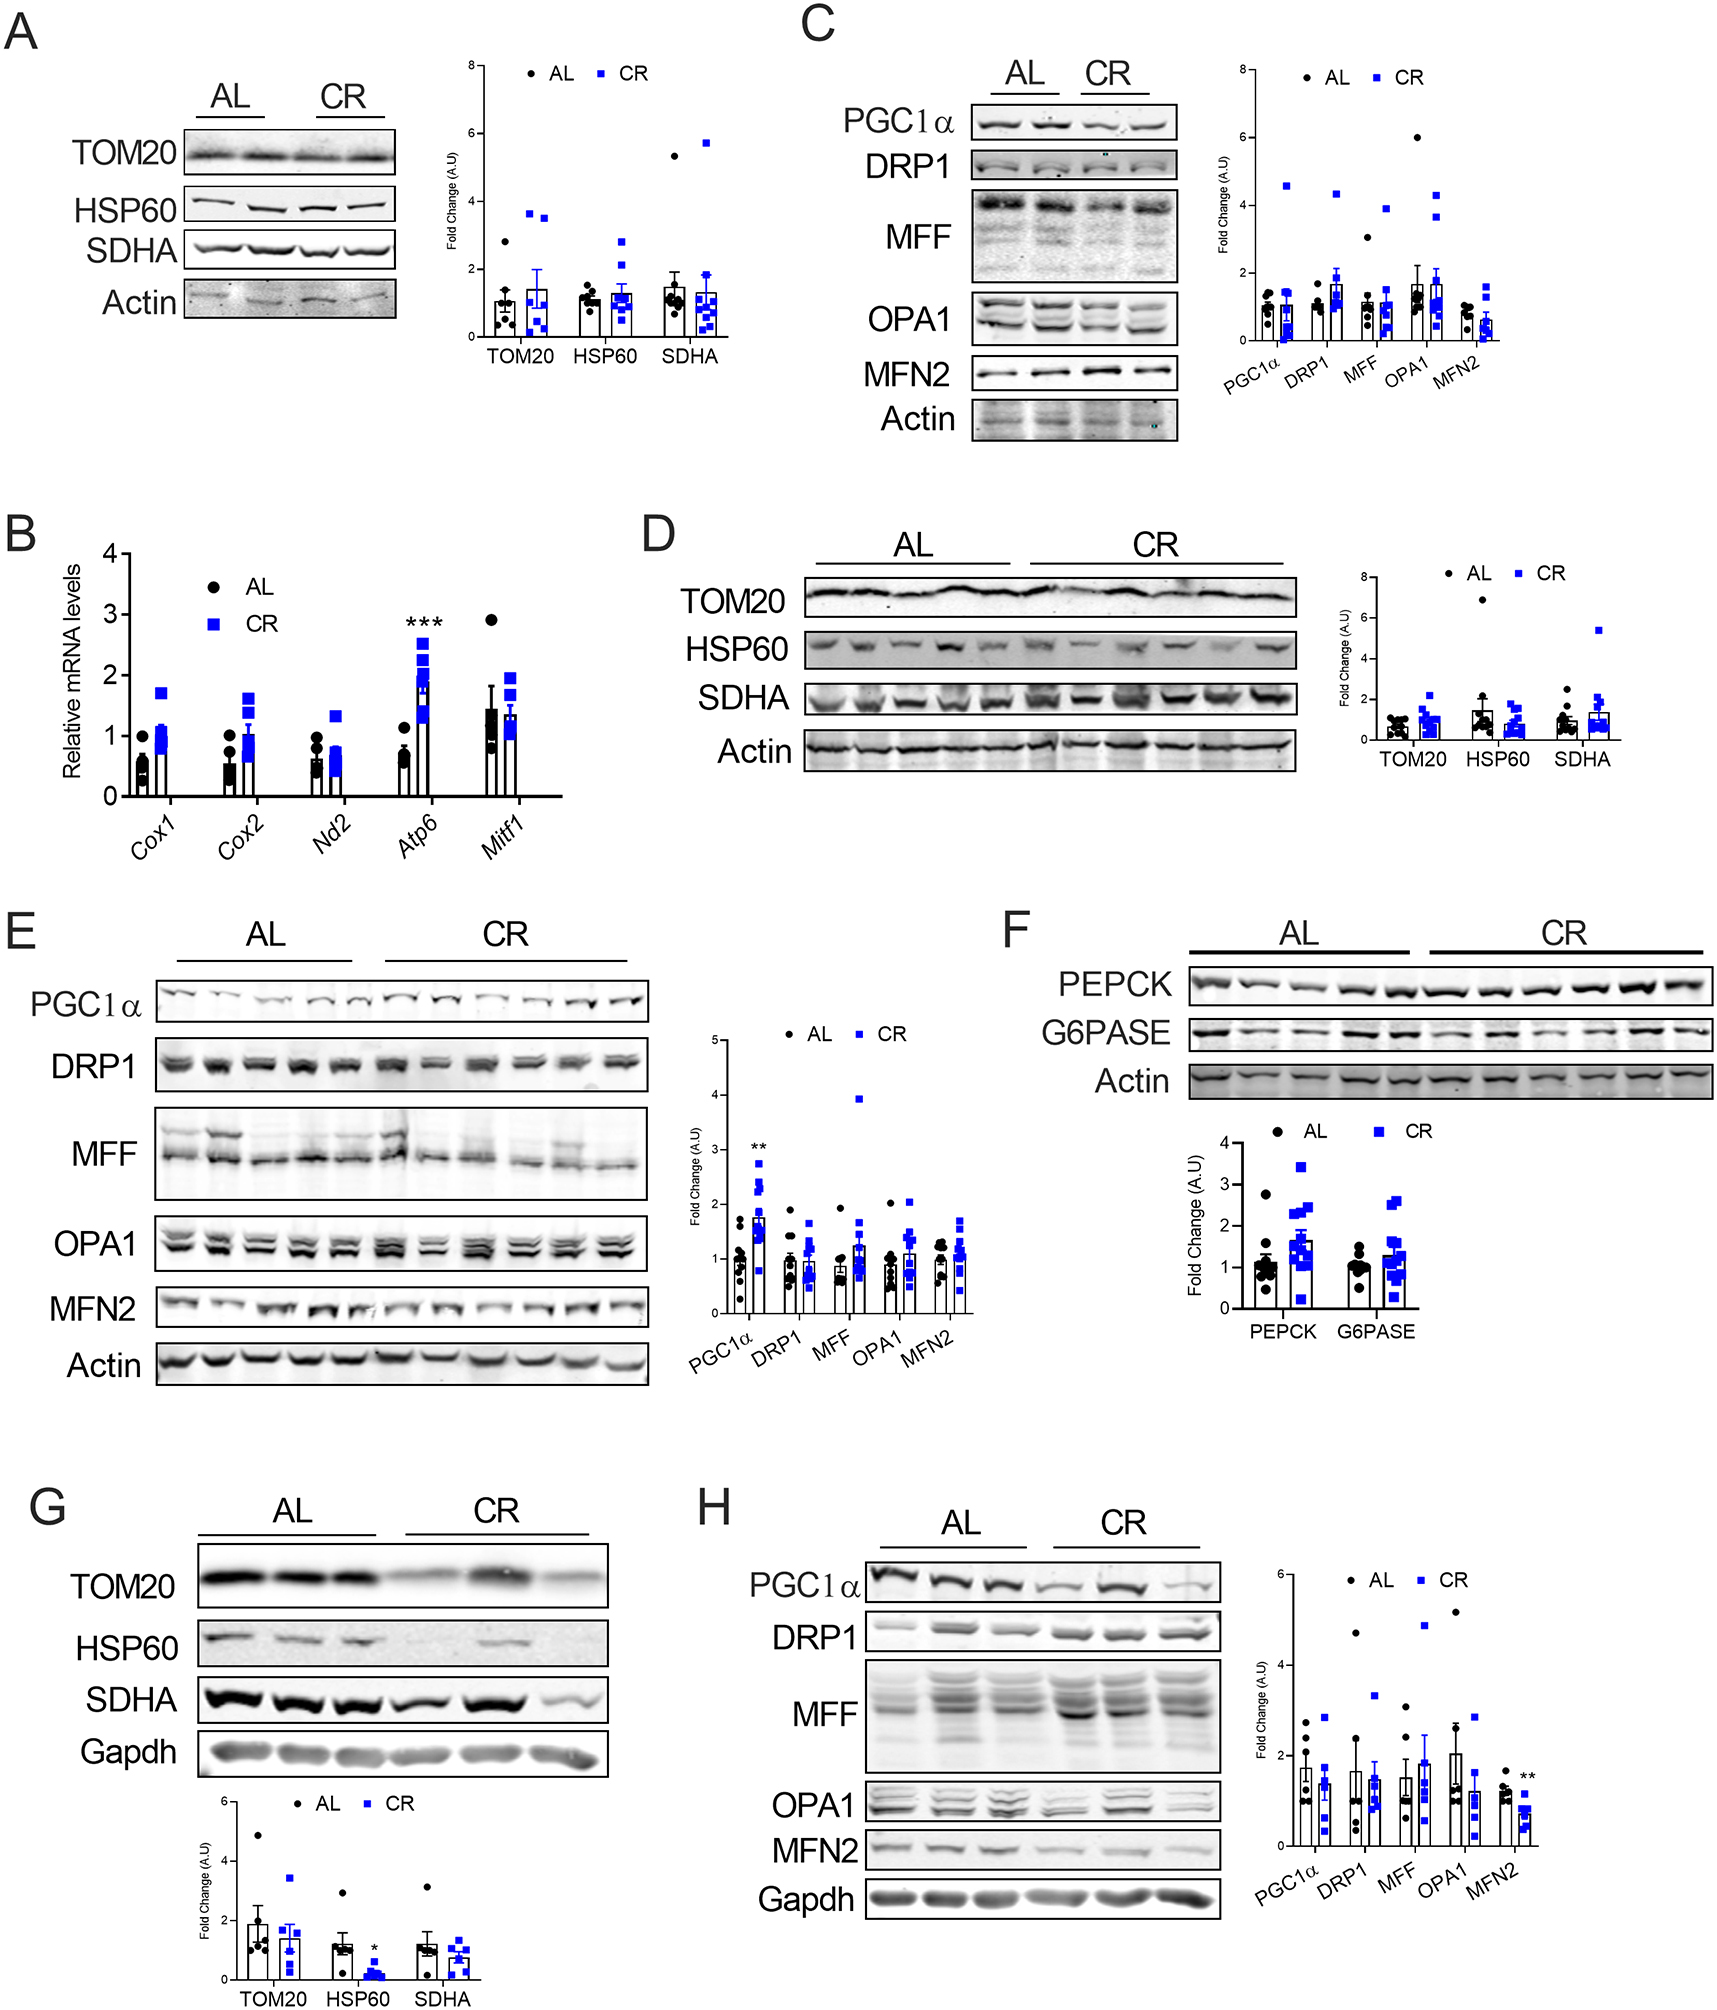
(A) Immunoblots and densitometric analysis for mitochondrial proteins in the BAT. (B) mRNA levels of the mitochondrial genes in the BAT. The mRNA levels were normalized to that of 18S. (C) Immunoblots and densitometric analysis of the mitochondrial biogenesis and dynamics-related proteins in the BAT. (D) Immunoblots and densitometric analysis of the mitochondrial proteins in the liver. (E) Immunoblots and densitometric analysis of the mitochondrial biogenesis and dynamics-related proteins in the liver. (F) Immunoblots and densitometric analysis of the gluconeogenesis-related proteins in the liver. (G) Immunoblots and densitometric analysis of the mitochondrial proteins in the muscle. (H) Immunoblots and densitometric analysis of the mitochondrial biogenesis and dynamics-related proteins in the muscle.
3.3. Beige-to-white fat transition upon CR withdrawal is due to a decrease in mitochondrial biogenesis
The health benefits of CR vanish rapidly after discontinuation of CR through mechanisms that are not well understood [32]. To determine if CR withdrawal affects adipose tissue homeostasis, caloric restricted C57BL6 mice were placed back on the chow diet ad libitum for 2 weeks (CR→AL, Figure 3A). As expected, body composition analysis revealed a decrease in fat but not lean mass in the CR group, and ad libitum feeding for 2 weeks reversed the effect of CR on body weight and fat and lean mass (Figure 3B and S2A and B). Glucose tolerance test showed that 2 weeks of ad libitum feeding was sufficient to reverse the metabolic effect of CR (Figure 3C). When we assessed the WAT after CR withdrawal, there was a decrease in the number of multilocular beige adipocytes and mitochondrial content indicating beige-to-white fat transition (Figure 3D and S2C). Western blot analysis further confirmed the decrease in the expression of mitochondrial proteins in the WAT of CR→AL mice (Figure 3E and S2D) indicating that CR withdrawal resulted in beige-to-white adipocyte transition. To determine the mechanism of transition of beige adipocytes, we first assessed the expression of p62 and LC3B. Western blot analysis showed a modest decrease in p62 levels in the iWAT of the CR→AL group compared to those in the CR group. However, the expression of LC3B was not affected by CR or CR withdrawal in either iWAT or eWAT (Figure S2E and S2F). Parkin, an E3 ubiquitin ligase, plays a critical role in beige-to-white fat transition via selective mitochondrial clearance called mitophagy [19, 33]. The ability of parkin to maintain mitochondrial quality by removing damaged mitochondria is partly determined by its phosphorylation and mitochondrial recruitment. Indeed, parkin recruitment but not expression is affected during mitophagy [34]. However, when mitophagy is induced, parkin could regulate mitochondrial biogenesis [34]. Thus, under steady state, loss of parkin did not affect mitochondrial homeostasis in the eWAT of Park2−/− mice on a regular chow diet (Figure 3SG and H). To further investigate whether parkin-mediated mitophagy is involved in the transition of beige adipocytes, the Park2−/− mice were withdrew from the CR diet (CR withdrawal). Interestingly, loss of parkin did not protect the Park2−/− mice from CR withdrawal-mediated loss of the beige adipocytes and mitochondrial content (Figure 3F and 3G) indicating that parkin-mediated mitophagy is not involved in the beige-to-white adipocyte transition during CR withdrawal. We further assessed whether decline in the mitochondrial content is associated with a decrease in mitochondrial biogenesis. Western blot analysis showed a decrease in the expression of proteins involved in mitochondrial biogenesis suggesting that CR withdrawal rapidly attenuated mitochondrial biogenesis in both iWAT and eWAT of Park2+/+ mice (Figure 3H and S2I). A similar decrease in mitochondrial biogenesis was observed in the Park2−/− mice (Figure 3I). Notably, CR or CR withdrawal did not affect the mitochondrial content or mitochondrial biogenesis in the BAT (Figure S2J and K).
Figure 3. Beige-to-white fat transition upon CR withdrawal is due to decrease in mitochondrial biogenesis.
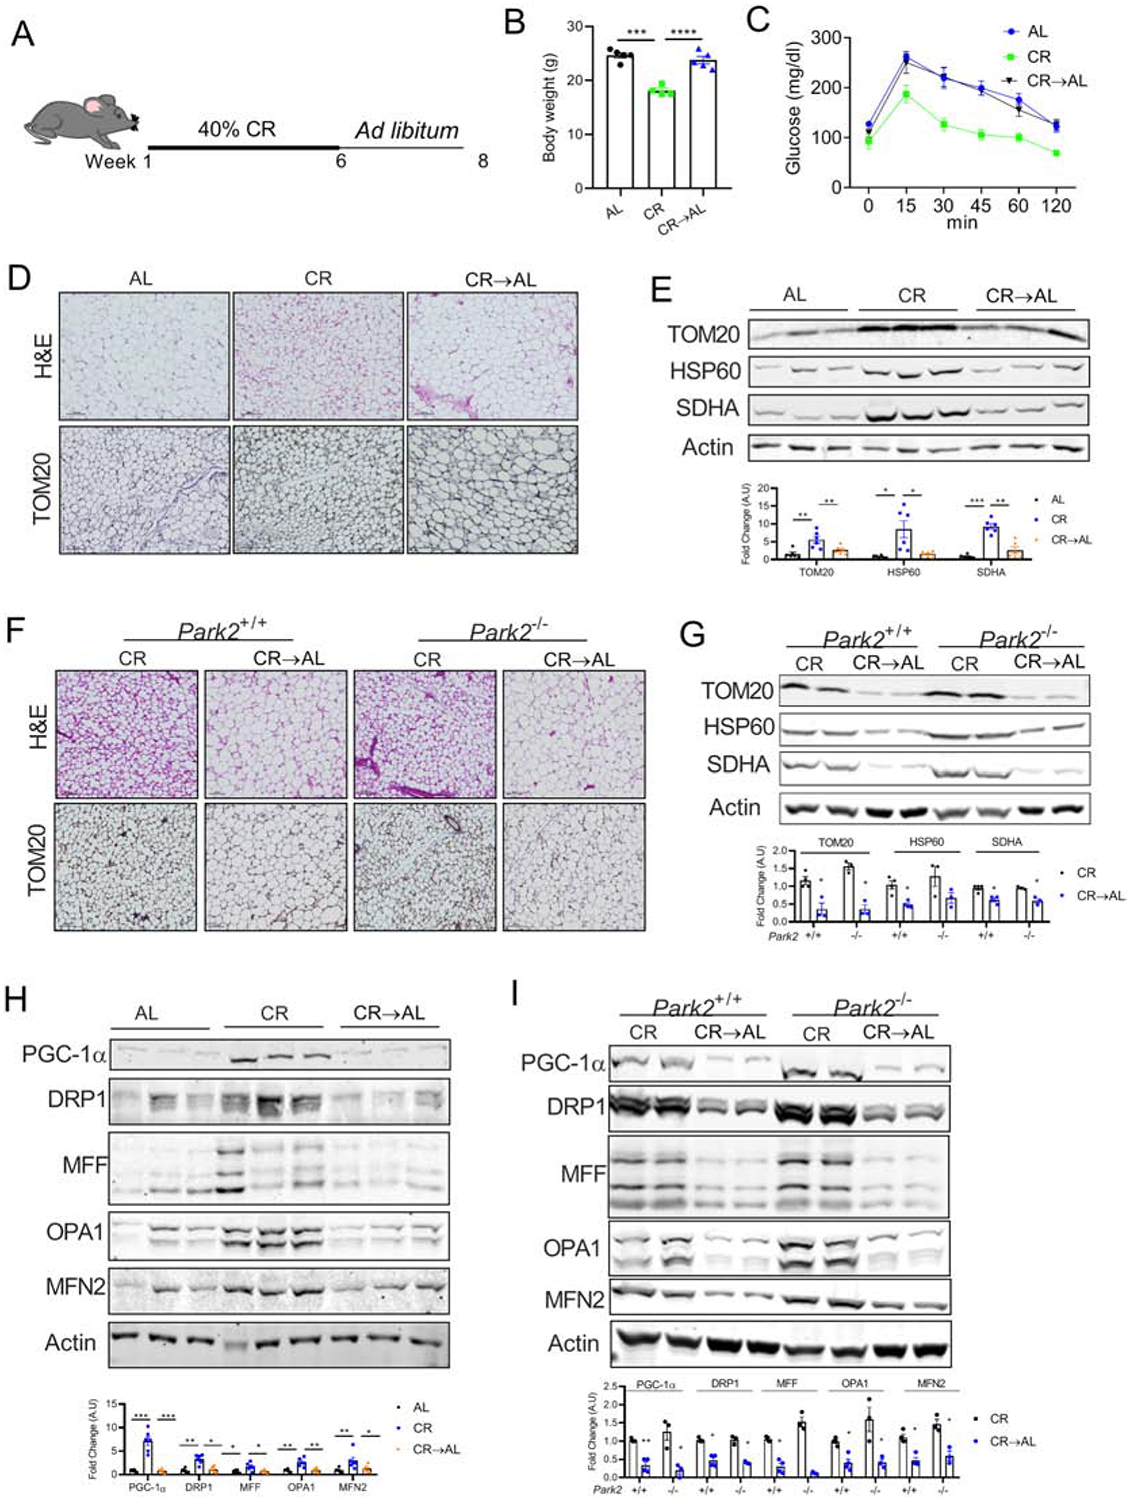
(A) Schematic representation of the experimental design. Six-weeks old C57BL6 mice were fed with 40% calorie restricted chow diet (CR) for 6 weeks following which one group of mice were switched back to ad libitum chow diet and all the mice continued on their respective diets for additional 2 weeks. (B) Body weight of the mice. (C) Intraperitoneal glucose tolerance test (ipGTT) performed in CR→AL mice (n=3–5 mice/group). (D) H&E staining (top panel) and immunohistochemistry for TOM20 (bottom panel) in the iWAT, magnification - 20X. (E) Immunoblots and densitometric analysis for mitochondrial proteins in the iWAT. (F) H&E staining (top panel) and immunohistochemistry (bottom panel) performed on the iWAT of global females parkin2 KO (Park2−/−) and their littermates (Park2+/+) controls, magnification - 20X (n= 3–4 mice/group). (G) Immunoblots and densitometric analysis of the mitochondrial proteins in the iWAT of female Park2−/−mice. (H) Immunoblots and densitometric analysis of the mitochondrial biogenesis and dynamics-related proteins in the iWAT. (I) Immunoblots and densitometric analysis of the mitochondrial biogenesis and dynamics-related proteins in the iWAT of Park2−/−mice.
During CR, lipolysis of adipose tissue is substantially induced. Lipolysis-derived fatty acids are utilized as fuel by peripheral tissues. Adipose triglyceride lipase (ATGL) triggers lipolysis by breaking down triacylglycerol to diacyl glycerol, which is then converted to monoacyl glycerol by hormone-sensitive lipase (HSL) [35]. As expected, the levels of ATGL and phosphorylated HSL (active form) are increased in the iWAT during CR; however, upon CR withdrawal, these levels are decreased to the levels seen in the Al group suggesting that lipolysis is attenuated upon CR withdrawal (Figure S2L). Further investigation is required to determine the relationship between adipose tissue lipolysis and mitochondrial biogenesis in CR-induced beigeing. Together, the data suggest that a decrease in mitochondrial biogenesis but not parkin-mediated mitophagy drives beige-to-white fat transition during CR withdrawal.
3.4. Beige-to-white transition upon β3-AR agonist-withdrawal is attenuated by CR
Administration of β3-AR agonist CL316, 243 (CL) induces beige adipocytes; however, its withdrawal results in the loss of mitochondrial content via parkin-mediated mitophagy leading to beige-to-white adipocyte transition [7, 19, 20]. As mitochondrial biogenesis is induced by CL administration (Figure 4A), we assessed whether the expression of proteins involved in mitochondrial biogenesis and dynamics is affected by CL withdrawal. As shown in Figure 4A and B, 10 days of withdrawal completely reversed the CL-mediated increase in the expression of PGC-1α, fission, and fusion-related proteins in the iWAT. As our data indicated that CR promotes beigeing via mitochondrial biogenesis, we questioned whether maintenance of mitochondrial biogenesis by CR could prevent the CL withdrawal-mediated decline in the number of beige adipocytes (CR+CL-WDL). To this end, C57BL6 mice fed with a 60% high-fat diet for 7 weeks were injected with CL for 7 days with or without 40% CR, and then CL was withdrawn and the mice were maintained on their respective dietary regimen for additional 10 days (CL-WDL or CDL-CR+WDL, Figure S3A). High-fat fed mice injected with CL for 7 days were used as control (CL, Figure S3A). As expected, CR decreased the fat mass and weight of the WAT in the CR+CL-WDL group when compared to those in CL-WDL group (Figure 4C). When we assessed the iWAT, we found that CR attenuated the decline in the number of multilocular beige adipocytes and mitochondrial content in the CR+CL-WDL group (Figure 4D and E). We also found that the size of the adipocytes was smaller in the adipose tissue of the mice of CR+CL-WDL compared to that in the adipose tissue of the mice of CL group. Similarly, CR prevented the loss of beige adipocytes in the eWAT (Figure S3B and C). However, CL administration did not affect the expression of mitochondrial markers in the BAT (Figure S3D and E). A previous report has demonstrated that CL withdrawal decreases p62 levels and increases LC3B levels suggesting augmented autophagy [19]. However, we did not find any difference in the expression of p62 or LC3B expression in the WAT during CL withdrawal (Figure S3F). Further analysis showed that mitochondrial biogenesis was maintained during CL withdrawal in both iWAT and eWAT (Figure 4F and S3G). Together, the data suggest that CL withdrawal-mediated decrease in beige adipocytes could be attenuated by CR, partly by maintaining mitochondrial biogenesis.
Figure 4. CR attenuates CL withdrawal-mediated loss of mitochondria in WAT.
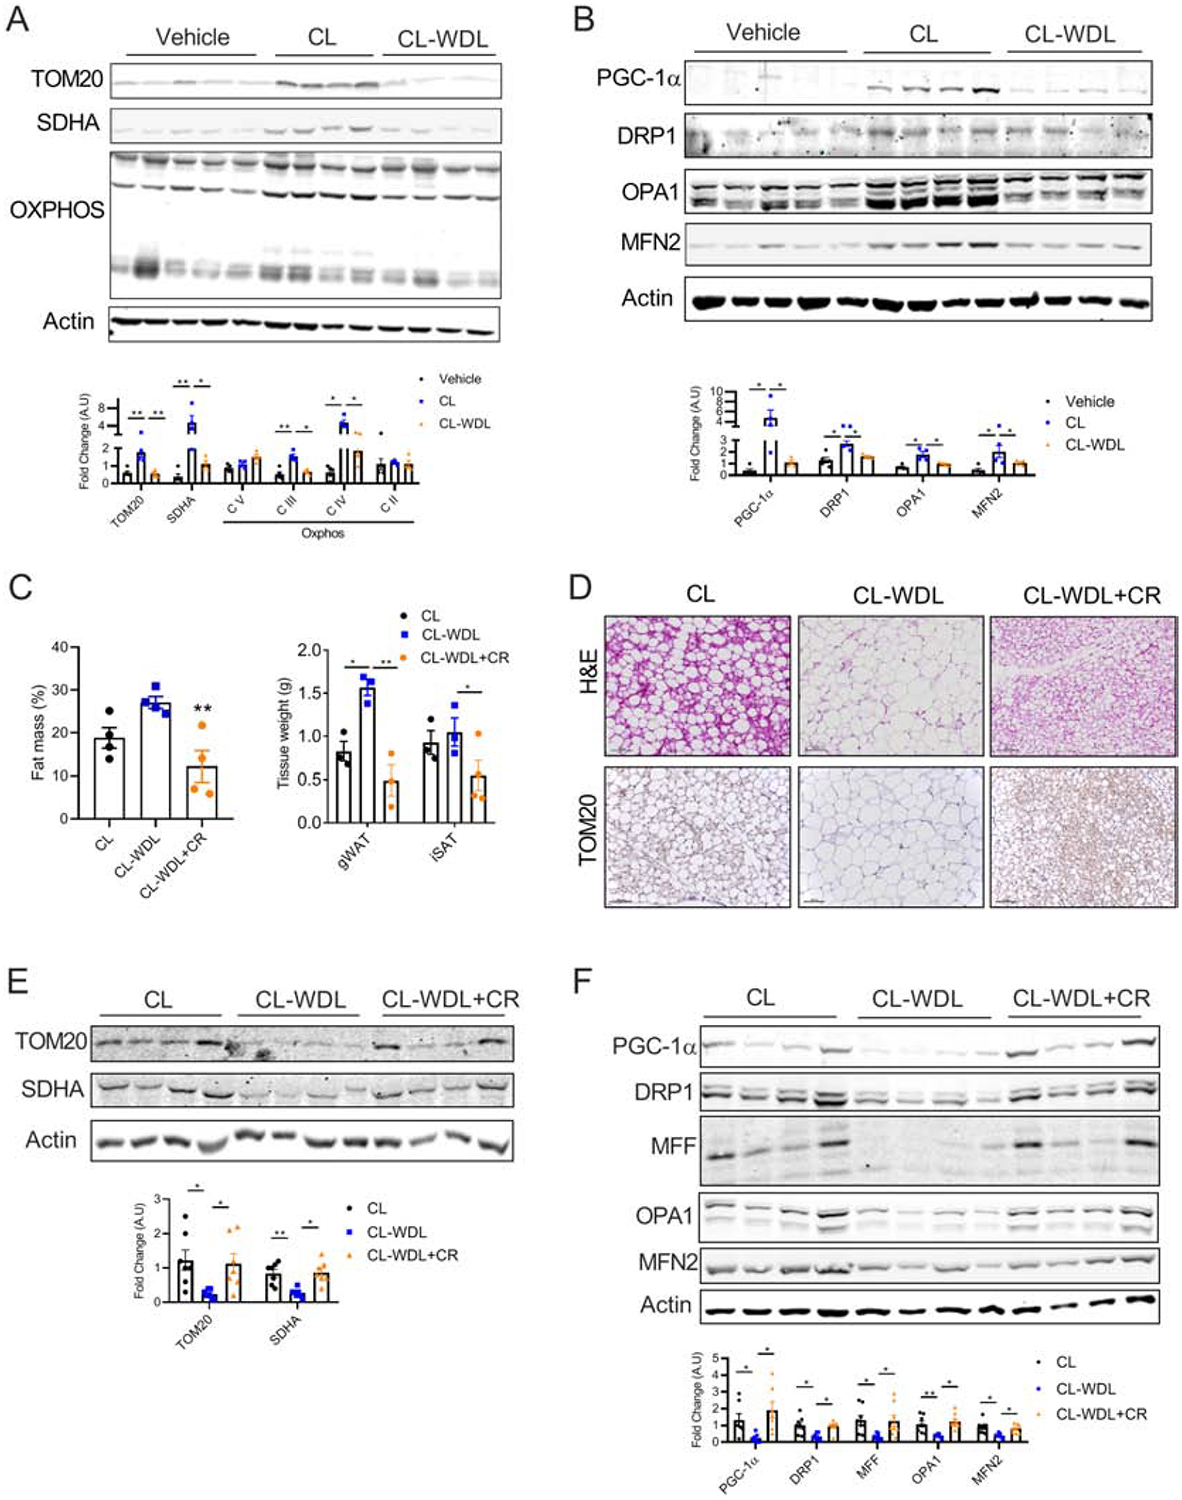
(A) Immunoblots and densitometric analysis of the mitochondrial proteins, and (B) Mitochondrial biogenesis and dynamics and densitometric analysis of the iWAT of WT mice injected with CL (1 mg/kg) for 7 days following which one group of mice was withdrawn from CL injection and maintained for another additional 10 days (n=4–5 mice/group). (C–F) C57BL6 mice fed with 60% high-fat diet for 7 weeks were injected with CL (1 mg/kg) for 7 days with or without 40% CR, and then CL was withdrawn for 10 days while the mice were continued on their respective dietary regimen (CL-WDL or CL-WDL+CR). For the CL group, CL (1 mg/kg) was injected for 7 days in mice fed with high-fat diet ad libitum. (C) Fat mass and weight of organs. (D) H&E analysis (top panel) and TOM20 immunostaining (bottom panel) in iWAT, magnification - 20X. (E) Immunoblots and densitometric analysis of the mitochondrial proteins. (F) Western blot and densitometric analysis of proteins involved in mitochondrial biogenesis and dynamics in the iWAT. Results are representative data from one cohort. Bar graphs are presented as mean SE ± SEM (*p < 0.05, **p < 0.01).
3.5. CR maintains CL-mediated uncoupled respiration and improves metabolic homeostasis
The beige adipocytes induced by β3-AR agonists express both CKMT2 and UCP1, thereby increasing energy expenditure [7, 36]. Since CR prevented the beige-to-white adipocyte transition, we further assessed the expression of CKMT2 and UCP1 in the iWAT of the CR+CL-WDL group. As expected, the results of immunohistochemistry and western blot showed decreased expression of both CKMT2 and UCP1 in the beige adipocytes during CL withdrawal. Further, our results showed that the CL-induced expression of CKMT2 (iWAT) and UCP1 (both iWAT and eWAT) could be maintained by CR even after CL withdrawal (Figure 5A–D, and S4A, S4B). Further assessment showed that CR attenuated the CL withdrawal-mediated decrease in the levels of oxphos proteins in both iWAT and eWAT (Figure 5E and S4A), but no effect was observed in the BAT (Figure S5B). Interestingly, though the mRNA levels of Ucp1 decreased in the CR+CL-WDL group, we did not observe any changes in the levels of other browning markers (Figure S4C), suggesting that post-transcriptional mechanisms may be involved in the maintenance of UCP1 expression by CR. To determine whether CR maintained the increased respiratory capacity of CL-induced beige adipocytes, oxygen consumption was measured in the iWAT using Oroboros. Our data showed that CR mitigated CL withdrawal-mediated decrease in mitochondrial respiratory capacity and uncoupled respiration (Figure 5F). To further determine the impact of maintaining beige adipocytes on metabolic homeostasis, we performed a glucose tolerance test in mice following CL withdrawal with or without CR. As expected, CL improved glucose tolerance, which was reversed by CL-WDL. Our data show that CR during CL withdrawal attenuates the reversal of glucose tolerance (Figure 5G). Together, the data suggest that CR during CL withdrawal helps in maintaining functional beige adipocytes and systemic glucose homeostasis.
Figure 5. CR maintains uncoupled respiration and improves metabolic homeostasis during CL withdrawal.
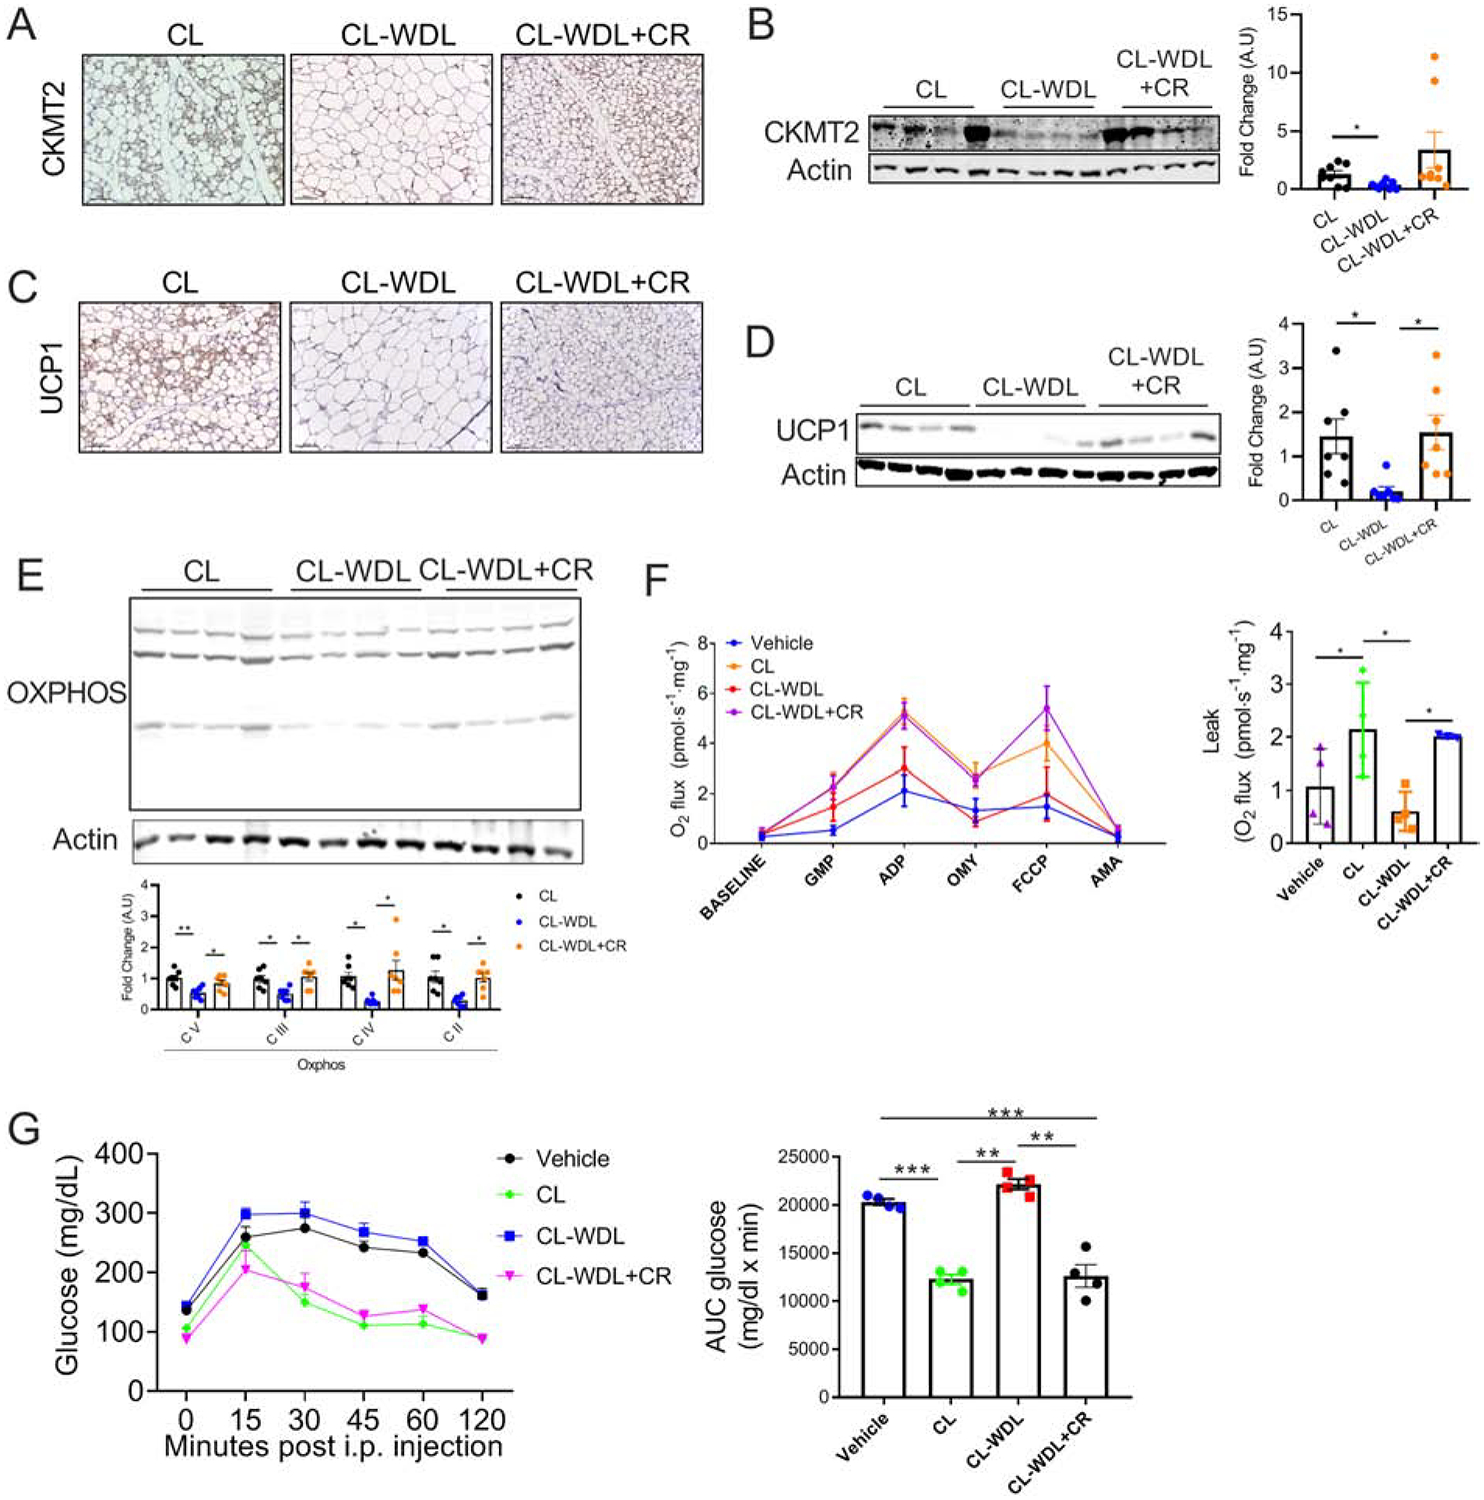
(A–G) C57BL6 mice fed with 60% high-fat diet for 7 weeks were injected with CL (1 mg/kg) for 7 days with or without 40% CR, and then CL was withdrawn for 10 days while the mice were continued on their respective dietary regimen (CL-WDL or CL-WDL+CR). For the CL group, CL (1 mg/kg) was injected for 7 days in mice fed with high-fat diet ad libitum. (A) Immunohistochemistry, magnification - 20X and (B) Immunoblot and densitometric analysis of CKMT2 in the iWAT. (C) Immunohistochemistry, magnification-20X and (D) Immunoblot and densitometric analysis of UCP1 in the iWAT. (E) Immunoblot and densitometric analysis of the Oxphos proteins in the iWAT. (F) Oxygen consumption and proton leak assessed in the iWAT using Oroboros. (G) Intraperitoneal glucose tolerance test (left panel) and area under curve (AUC; right panel) (n= 4 mice/group). Bar graphs are presented as mean SE ± SEM (*p < 0.05, **p < 0.01, ***p < 0.001).
4. Discussion
The discovery of beige adipocytes has garnered interest towards obesity-associated metabolic diseases. Here, we demonstrate that CR induces beige adipocytes, which express genes involved in the futile creatine substrate cycle. Beige adipogenesis is associated with the induction of PGC-1α-mediated mitochondrial biogenesis [37]. However, mitochondrial biogenesis requires the concomitant activation of fission and fusion [38, 39]. Indeed, beige adipocytes are characterized by fragmented mitochondria that are small and spherical suggesting enhanced fission [40]. Here, we demonstrate that CR-induced beige adipogenesis is associated with increased expression of proteins involved in mitochondrial biogenesis including fission and fusion. Our study shows that a decrease in mitochondrial biogenesis but not parkin-mediated mitophagy is involved in the involution of beige adipocytes during CR withdrawal. We further provide empirical evidence that beige adipocytes could be maintained by CR during β3-AR agonist-withdrawal, partly via sustained mitochondrial biogenesis.
Although the loss of beige adipocytes during stimulus withdrawal is associated with a significant decrease in mitochondrial biogenesis [20], studies have shown that inhibiting mitochondrial clearance is sufficient to maintain the beige adipocytes [20, 41, 42]. Based on these studies, it is conceivable that inhibiting autophagy may be effective in maintaining beige adipocytes. It should be noted that autophagy plays a critical role in regulating mitochondrial function [43] and inhibiting mitophagy impairs mitochondrial oxidative function in the BAT [34]. Moreover, the half-life of mitochondria is short [44], therefore further investigation is required to determine whether mitophagy is a viable target for maintaining beige adipocytes. In the model of CR, we demonstrate that withdrawal mediated reversal of beigeing is strongly associated with a decrease in mitochondrial biogenesis and disruption of parkin did not prevent beige-to-white fat transition. This is consistent with the recent report, where β3-AR agonist withdrawal leads to white fat transition in adipose tissue-specific parkin KO mice [42]. It should be noted that parkin recruitment and not parkin expression is modulated during mitophagy [19]. It is unclear whether the recruitment of parkin during withdrawal is solely dependent on phosphorylation of parkin or mitochondrial damage-mediated pink1 expression triggers the clearance mechanism [19]. Nonetheless, targeting parkin alone is not sufficient to increase mitochondrial density or beige adipogenesis in the adipose tissue [19, 45]. Thus, adipose tissue parkin may play a key role in beigeing by controlling mitochondrial quality. In the model of CR, we demonstrate that mitochondrial biogenesis plays a dominant role in regulating beigeing. This is also evident from the effect of CR in attenuating beige-to-white transition in the model of CL-withdrawal, where parkin-mediated mitophagy has been shown to induce beige-to-white fat transition.
In summary, we demonstrate that mitochondrial biogenesis drives beigeing of WAT during short-term CR. The present work emphasizes that mitochondrial biogenesis has a pivotal role in the maintenance of beige adipocytes. This study also provides a possible approach for maintenance of β3-AR agonists-induced beige adipocytes via dietary intervention. Thus, mitochondrial biogenesis pathways should also be considered in addition to mitophagy to attain better outcome in targeting and maintaining beige adipocytes. Further investigation on determining the mechanism by which CR coordinates mitochondrial biogenesis and clearance will help us to identify novel targets for promoting beige adipogenesis.
Translational Significance:
Although β3-AR agonists improve metabolic homeostasis, off-target cardiovascular effects have undermined the use of β3-AR agonists in humans [46–48]. Nevertheless, β3-AR agonists are still the most widely studied models for beige adipogenesis with the hope to determine novel downstream mechanisms. Another key constraint in targeting beige adipocytes arises from their intrinsic property to transition to white adipocytes upon withdrawal of the stimulus. Here, we provide empirical evidence that dietary intervention such as CR attenuates beige-to-white fat conversion partly by maintaining mitochondrial biogenesis. Although health benefits are huge, the compliance rate to CR is low due to the socio-economic burden [49]. This study lays a foundation for future investigations where dietary and pharmacological regimens could be tailored to maximize the metabolic benefits with minimal intervention.
Limitations of the Study:
We demonstrate that sustained mitochondrial biogenesis has a more dominant role compared to mitophagy in the maintenance of beige adipocytes using CR model. We understand that steady-state measurement of p62 and LC3B levels may not be an ideal assessment of autophagy, and therefore, further investigation using autophagy-deficient or mito-keima mice will provide a conclusive evidence for the role of autophagy in CR-mediated mitochondrial turnover and maintenance of beige adipocytes [19, 20, 50]. We believe that the characterization of the creatine substrate cycle in the CR-induced adipocytes is beyond the scope of this study. However, from a thermo-centric view, the induction of beige adipocytes by CR rather appears paradoxical, as a wealth of literature shows that CR decreases core body temperature and basal metabolic rate [51, 52]. Based on our study, we speculate that CR induces reserve beige adipocytes, which could exhibit thermogenic function via UCP-1 dependent or independent mechanism to counteract thermal stress from the loss of adipose tissue insulation, whenever required [16, 36, 53]. Further assessment of the molecular features of the CR-induced beige adipocytes will provide novel insights into their role in thermo-regulation and systemic metabolic homeostasis.
Supplementary Material
Highlights.
Short-term CR induces mitochondrial biogenesis and dynamics-related proteins in the WAT.
Beige-to-white transition during CR withdrawal is independent of parkin-mediated mitophagy.
Sustained mitochondrial biogenesis is essential to maintain beige adipocyte formation.
CR attenuates b3-AR agonist withdrawal-induced beige-to-white fat transition.
Acknowledgements
We would like to acknowledge Dr. Simon Watkins and his team at the Center for Biologic Imaging, University of Pittsburgh for their support with TEM and other image acquisition and analysis.
Funding
This study was funded by the National Institute of Diabetes and Digestive and Kidney Diseases (DK110537) and Pittsburgh Liver Research Center Pilot and Feasibility grant (P30DK120531) to S.K.R., NIH grant to M.J. (DK114012 and DK119627), grants from the Center for Metabolism and Mitochondrial Medicine and Pittsburgh Foundation to M.J., and NIH grant (1S10RR019003-01) to Simon Watkins.
Abbreviations:
- CR
Calorie restriction
- UCP1
Uncoupling protein 1
- WAT
White adipose tissue
- BAT
Brown adipose tissue
- SVF
Stromal vascular fractions
- DRP1
Dynamin-related protein 1
- MFN 1&2
Mitofusin 1& 2
- OPA1
optic atrophy 1
- ATGL
Adipose triglyceride lipase
- HSL
Hormone sensitive lipase
- PGC-1a
Peroxisome proliferator activator receptor gamma coactivator-alpha
- CKMT2
Creatine kinase mitochondrial 2
- HSP60
Heat shock protein60
- SDHA
Succinate dehydrogenase complex, subunit A
- PRDM16
PR domain containing 16
- COX1 &2
Cyclooxygenase 1& 2
- ND2
NADH dehydrogenase 2
- β3-AR
Beta 3 adrenergic receptor
- G6PASE
Glcose-6 phosphatase
- PEPCK
Phosphoenolpyruvate carboxykinase
Primers sequence details
| No | Gene | Forward (5’−3’) | Reverse (5’−3’) |
|---|---|---|---|
| 1 | Cox1 | TAGCCCATGCAGGAGCATCA | TGGCTGGGGGTTTCATGTTGA |
| 2 | Cox2 | ACCTGGTGAACTACGACTGCT | CCTAGGGAGGGGACTGCTCA |
| 3 | ATP6 | TGGCATTAGCAGTCCGGCTT | ATGGTAGCTGTTGGTGGGCT |
| 4 | ND2 | GCCTGGAATTCAGCCTACTAGC | GGCTGTTGCTTGTGTGACGA |
| 5 | Mitf | AAGTCGGGGAGGAGTTTCACG | GGAGCTTAACGGAGGCTTGGA |
| 6 | UCP1 | GGCCTCTACGACTCAGTCCA | TAAGCCGGCTGAGATCTTGT |
| 7 | PGC-1 | CCCTGCCATTGTTAAGACC | TGCTGCTGTTCCTGTTTTC |
| 8 | DIO2 | CATGCTGACCTCAGAAGGGC | CCCAGTTTAACCTGTTTGTAGGCA |
| 9 | Glut4 | GTGACTGGAACACTGGTCCTA | CCAGCCACGTTGCATTGTAG |
| 10 | Cidea | ATCACAACTGGCCTGGTTACG | TACTACCCGGTGTCCATTCT |
| 11 | Prdm16 | CAGCACGGTGAAGCCATTC | GCGTGCATCCGCTTGTG |
| 12 | Slc6a8 | TGCATATCTCCAAGGTGGCAG | CTACAAACTGGCTGTCCAGA |
| 13 | Gamt | CAGACACAAATTGGCCGCTC | CCCAGGTAGTTTGTAACCTGGC |
| 14 | Ckmt1 | GCATGGTGGCTGGTGATGAG | AAACTGCCCGTGAGTAATCTTG |
| 15 | Phospho1 | AAGCACATCATCCACAGTCCCTC | TTGGTCTCCAGCTGTCATCCAG |
| 16 | Dnm1 | TAGTGGGCAGGGACCTTCTT | TGCTTCAACTCCATTTTCTTCTCC |
| 17 | Mfn2 | CAGCAAGTTGACATCACCCG | ACCAGCCAGCTTTATTCCTGA |
| 18 | Mff | AAGTGGCTCTCACCCTAGCA | TGCCCCACTCACCAAATGT |
| 19 | Opa1 | TTGCCAGTTTAGCTCCCGAC | CCAGGTGAACCTGCAGTGAA |
| 20 | β-actin | TATTGGCAACGAGCGGTTCC | GGCATAGAGGTCTTTACGGATGT |
| 16 | 18S | ATTGGAGCTGGAATTACCGC | CGGCTACCACATCCAAGGAA |
Antibody catalog number and source
| # | Name | Catalogue Number | Source |
|---|---|---|---|
| 1 | Actin | 66009–1-Ig | Proteintech |
| 2 | DRP1 | 8570T | Cell Signaling Technology |
| 4 | LC3A/B | 12741T | Cell Signaling Technology |
| 5 | MFF | 84580T | Cell Signaling Technology |
| 6 | MFN1 | 14739T | Cell Signaling Technology |
| 7 | MFN2 | 11925T | Cell Signaling Technology |
| 8 | Opa1 | 80471T | Cell Signaling Technology |
| 9 | Oxphos | Ab110411 | Abcam |
| 10 | p62 | 18420–1-AP | Proteintech |
| 11 | Parkin | 4211S | Cell Signaling Technology |
| 12 | PGC-1α | ab54481 | Abcam |
| 13 | SDHA | 5839 | Cell Signaling Technology |
| 14 | Tom20 | 42406S | Cell Signaling Technology |
| 15 | UCP1 | PA1–24894 | Invitrogen |
| 16 | CKMT-2 | 13207–1-AP | Proteintech |
| 17 | pMff | #49281 | Cell Signaling Technology |
| 18 | ATGL | #2439 | Cell Signaling Technology |
| 19 | HSL | #4107 | Cell Signaling Technology |
| 20 | p-HSL | #4139 | Cell Signaling Technology |
Footnotes
Publisher's Disclaimer: This is a PDF file of an unedited manuscript that has been accepted for publication. As a service to our customers we are providing this early version of the manuscript. The manuscript will undergo copyediting, typesetting, and review of the resulting proof before it is published in its final form. Please note that during the production process errors may be discovered which could affect the content, and all legal disclaimers that apply to the journal pertain.
Declaration of interests
The authors declare no conflict of interests.
Bibliography:
- [1].Kusminski CM, Bickel PE, Scherer PE. Targeting adipose tissue in the treatment of obesity-associated diabetes. Nat Rev Drug Discov. 2016;15:639–60. [DOI] [PubMed] [Google Scholar]
- [2].Choe SS, Huh JY, Hwang IJ, Kim JI, Kim JB. Adipose Tissue Remodeling: Its Role in Energy Metabolism and Metabolic Disorders. Front Endocrinol (Lausanne). 2016;7:30. [DOI] [PMC free article] [PubMed] [Google Scholar]
- [3].Kajimura S, Spiegelman BM, Seale P. Brown and Beige Fat: Physiological Roles beyond Heat Generation. Cell Metab. 2015;22:546–59. [DOI] [PMC free article] [PubMed] [Google Scholar]
- [4].Harms M, Seale P. Brown and beige fat: development, function and therapeutic potential. Nat Med. 2013;19:1252–63. [DOI] [PubMed] [Google Scholar]
- [5].Ikeda K, Kang Q, Yoneshiro T, Camporez JP, Maki H, Homma M, et al. UCP1-independent signaling involving SERCA2b-mediated calcium cycling regulates beige fat thermogenesis and systemic glucose homeostasis. Nat Med. 2017;23:1454–65. [DOI] [PMC free article] [PubMed] [Google Scholar]
- [6].Mottillo EP, Ramseyer VD, Granneman JG. SERCA2b Cycles Its Way to UCP1-Independent Thermogenesis in Beige Fat. Cell Metab. 2018;27:7–9. [DOI] [PubMed] [Google Scholar]
- [7].Wu J, Bostrom P, Sparks LM, Ye L, Choi JH, Giang AH, et al. Beige adipocytes are a distinct type of thermogenic fat cell in mouse and human. Cell. 2012;150:366–76. [DOI] [PMC free article] [PubMed] [Google Scholar]
- [8].Hasegawa Y, Ikeda K, Chen Y, Alba DL, Stifler D, Shinoda K, et al. Repression of Adipose Tissue Fibrosis through a PRDM16-GTF2IRD1 Complex Improves Systemic Glucose Homeostasis. Cell Metab. 2018;27:180–94 e6. [DOI] [PMC free article] [PubMed] [Google Scholar]
- [9].Kahn CR, Wang G, Lee KY. Altered adipose tissue and adipocyte function in the pathogenesis of metabolic syndrome. J Clin Invest. 2019;129:3990–4000. [DOI] [PMC free article] [PubMed] [Google Scholar]
- [10].Martinez-Gonzalez MA, Martinez JA, Hu FB, Gibney MJ, Kearney J. Physical inactivity, sedentary lifestyle and obesity in the European Union. Int J Obes Relat Metab Disord. 1999;23:1192–201. [DOI] [PubMed] [Google Scholar]
- [11].Hruby A, Hu FB. The Epidemiology of Obesity: A Big Picture. Pharmacoeconomics. 2015;33:673–89. [DOI] [PMC free article] [PubMed] [Google Scholar]
- [12].Lane MA, Ingram DK, Roth GS. Calorie restriction in nonhuman primates: effects on diabetes and cardiovascular disease risk. Toxicol Sci. 1999;52:41–8. [DOI] [PubMed] [Google Scholar]
- [13].Lin SJ, Ford E, Haigis M, Liszt G, Guarente L. Calorie restriction extends yeast life span by lowering the level of NADH. Genes Dev. 2004;18:12–6. [DOI] [PMC free article] [PubMed] [Google Scholar]
- [14].Hursting SD, Dunlap SM, Ford NA, Hursting MJ, Lashinger LM. Calorie restriction and cancer prevention: a mechanistic perspective. Cancer Metab. 2013;1:10. [DOI] [PMC free article] [PubMed] [Google Scholar]
- [15].Berrigan D, Perkins SN, Haines DC, Hursting SD. Adult-onset calorie restriction and fasting delay spontaneous tumorigenesis in p53-deficient mice. Carcinogenesis. 2002;23:817–22. [DOI] [PubMed] [Google Scholar]
- [16].Fabbiano S, Suarez-Zamorano N, Rigo D, Veyrat-Durebex C, Stevanovic Dokic A, Colin DJ, et al. Caloric Restriction Leads to Browning of White Adipose Tissue through Type 2 Immune Signaling. Cell Metab. 2016;24:434–46. [DOI] [PubMed] [Google Scholar]
- [17].Pardo R, Vila M, Cervela L, de Marco M, Gama-Perez P, Gonzalez-Franquesa A, et al. Calorie restriction prevents diet-induced insulin resistance independently of PGC-1-driven mitochondrial biogenesis in white adipose tissue. FASEB J. 2019;33:2343–58. [DOI] [PubMed] [Google Scholar]
- [18].Barquissau V, Leger B, Beuzelin D, Martins F, Amri EZ, Pisani DF, et al. Caloric Restriction and Diet-Induced Weight Loss Do Not Induce Browning of Human Subcutaneous White Adipose Tissue in Women and Men with Obesity. Cell Rep. 2018;22:1079–89. [DOI] [PubMed] [Google Scholar]
- [19].Lu X, Altshuler-Keylin S, Wang Q, Chen Y, Henrique Sponton C, Ikeda K, et al. Mitophagy controls beige adipocyte maintenance through a Parkin-dependent and UCP1-independent mechanism. Sci Signal. 2018;11. [DOI] [PMC free article] [PubMed] [Google Scholar]
- [20].Altshuler-Keylin S, Shinoda K, Hasegawa Y, Ikeda K, Hong H, Kang Q, et al. Beige Adipocyte Maintenance Is Regulated by Autophagy-Induced Mitochondrial Clearance. Cell Metab. 2016;24:402–19. [DOI] [PMC free article] [PubMed] [Google Scholar]
- [21].Goldberg MS, Fleming SM, Palacino JJ, Cepeda C, Lam HA, Bhatnagar A, et al. Parkin-deficient mice exhibit nigrostriatal deficits but not loss of dopaminergic neurons. J Biol Chem. 2003;278:43628–35. [DOI] [PubMed] [Google Scholar]
- [22].Liu L, Zheng LD, Donnelly SR, Emont MP, Wu J, Cheng Z. Isolation of Mouse Stromal Vascular Cells for Monolayer Culture. Methods Mol Biol. 2017;1566:9–16. [DOI] [PubMed] [Google Scholar]
- [23].Ikeda K, Maretich P, Kajimura S. The Common and Distinct Features of Brown and Beige Adipocytes. Trends Endocrinol Metab. 2018;29:191–200. [DOI] [PMC free article] [PubMed] [Google Scholar]
- [24].Bertholet AM, Kazak L, Chouchani ET, Bogaczynska MG, Paranjpe I, Wainwright GL, et al. Mitochondrial Patch Clamp of Beige Adipocytes Reveals UCP1-Positive and UCP1-Negative Cells Both Exhibiting Futile Creatine Cycling. Cell Metab. 2017;25:811–22 e4. [DOI] [PMC free article] [PubMed] [Google Scholar]
- [25].Kazak L, Rahbani JF, Samborska B, Lu GZ, Jedrychowski MP, Lajoie M, et al. Ablation of adipocyte creatine transport impairs thermogenesis and causes diet-induced obesity. Nat Metab. 2019;1:360–70. [DOI] [PMC free article] [PubMed] [Google Scholar]
- [26].Dominy JE, Puigserver P. Mitochondrial biogenesis through activation of nuclear signaling proteins. Cold Spring Harb Perspect Biol. 2013;5. [DOI] [PMC free article] [PubMed] [Google Scholar]
- [27].Tilokani L, Nagashima S, Paupe V, Prudent J. Mitochondrial dynamics: overview of molecular mechanisms. Essays Biochem. 2018;62:341–60. [DOI] [PMC free article] [PubMed] [Google Scholar]
- [28].Ntsapi C, Loos B. Caloric restriction and the precision-control of autophagy: A strategy for delaying neurodegenerative disease progression. Exp Gerontol. 2016;83:97–111. [DOI] [PubMed] [Google Scholar]
- [29].Lee K, Haddad A, Osme A, Kim C, Borzou A, Ilchenko S, et al. Hepatic Mitochondrial Defects in a Nonalcoholic Fatty Liver Disease Mouse Model Are Associated with Increased Degradation of Oxidative Phosphorylation Subunits. Mol Cell Proteomics. 2018;17:2371–86. [DOI] [PMC free article] [PubMed] [Google Scholar]
- [30].Putti R, Sica R, Migliaccio V, Lionetti L. Diet impact on mitochondrial bioenergetics and dynamics. Front Physiol. 2015;6:109. [DOI] [PMC free article] [PubMed] [Google Scholar]
- [31].Civitarese AE, Carling S, Heilbronn LK, Hulver MH, Ukropcova B, Deutsch WA, et al. Calorie restriction increases muscle mitochondrial biogenesis in healthy humans. PLoS Med. 2007;4:e76. [DOI] [PMC free article] [PubMed] [Google Scholar]
- [32].Xu H, Li X, Adams H, Kubena K, Guo S. Etiology of Metabolic Syndrome and Dietary Intervention. Int J Mol Sci. 2018;20. [DOI] [PMC free article] [PubMed] [Google Scholar]
- [33].Jin SM, Youle RJ. PINK1- and Parkin-mediated mitophagy at a glance. J Cell Sci. 2012;125:795–9. [DOI] [PMC free article] [PubMed] [Google Scholar]
- [34].Lu Y, Fujioka H, Joshi D, Li Q, Sangwung P, Hsieh P, et al. Mitophagy is required for brown adipose tissue mitochondrial homeostasis during cold challenge. Sci Rep. 2018;8:8251. [DOI] [PMC free article] [PubMed] [Google Scholar]
- [35].Lass A, Zimmermann R, Oberer M, Zechner R. Lipolysis - a highly regulated multi-enzyme complex mediates the catabolism of cellular fat stores. Prog Lipid Res. 2011;50:14–27. [DOI] [PMC free article] [PubMed] [Google Scholar]
- [36].Kazak L, Chouchani ET, Jedrychowski MP, Erickson BK, Shinoda K, Cohen P, et al. A creatine-driven substrate cycle enhances energy expenditure and thermogenesis in beige fat. Cell. 2015;163:643–55. [DOI] [PMC free article] [PubMed] [Google Scholar]
- [37].Weir HJ, Yao P, Huynh FK, Escoubas CC, Goncalves RL, Burkewitz K, et al. Dietary Restriction and AMPK Increase Lifespan via Mitochondrial Network and Peroxisome Remodeling. Cell Metab. 2017;26:884–96 e5. [DOI] [PMC free article] [PubMed] [Google Scholar]
- [38].Liesa M, Shirihai OS. Mitochondrial dynamics in the regulation of nutrient utilization and energy expenditure. Cell Metab. 2013;17:491–506. [DOI] [PMC free article] [PubMed] [Google Scholar]
- [39].Lackner LL, Nunnari JM. The molecular mechanism and cellular functions of mitochondrial division. Biochim Biophys Acta. 2009;1792:1138–44. [DOI] [PMC free article] [PubMed] [Google Scholar]
- [40].Pisani DF, Barquissau V, Chambard JC, Beuzelin D, Ghandour RA, Giroud M, et al. Mitochondrial fission is associated with UCP1 activity in human brite/beige adipocytes. Mol Metab. 2018;7:35–44. [DOI] [PMC free article] [PubMed] [Google Scholar]
- [41].Sarraf SA, Youle RJ. Parkin mediates mitophagy during beige-to-white fat conversion. Sci Signal. 2018;11. [DOI] [PubMed] [Google Scholar]
- [42].Corsa CAS, Pearson GL, Renberg A, Askar MM, Vozheiko T, MacDougald OA, et al. The E3 ubiquitin ligase parkin is dispensable for metabolic homeostasis in murine pancreatic beta cells and adipocytes. J Biol Chem. 2019;294:7296–307. [DOI] [PMC free article] [PubMed] [Google Scholar]
- [43].Lopez de Figueroa P, Lotz MK, Blanco FJ, Carames B. Autophagy activation and protection from mitochondrial dysfunction in human chondrocytes. Arthritis Rheumatol. 2015;67:966–76. [DOI] [PMC free article] [PubMed] [Google Scholar]
- [44].Vendelbo MH, Nair KS. Mitochondrial longevity pathways. Biochim Biophys Acta. 2011;1813:634–44. [DOI] [PMC free article] [PubMed] [Google Scholar]
- [45].Taylor D, Gottlieb RA. Parkin-mediated mitophagy is downregulated in browning of white adipose tissue. Obesity (Silver Spring). 2017;25:704–12. [DOI] [PMC free article] [PubMed] [Google Scholar]
- [46].Xiao C, Goldgof M, Gavrilova O, Reitman ML. Anti-obesity and metabolic efficacy of the beta3-adrenergic agonist, CL316243, in mice at thermoneutrality compared to 22 degrees C. Obesity (Silver Spring). 2015;23:1450–9. [DOI] [PMC free article] [PubMed] [Google Scholar]
- [47].Danysz W, Han Y, Li F, Nicoll J, Buch P, Hengl T, et al. Browning of white adipose tissue induced by the ss3 agonist CL-316,243 after local and systemic treatment - PK-PD relationship. Biochim Biophys Acta Mol Basis Dis. 2018;1864:2972–82. [DOI] [PubMed] [Google Scholar]
- [48].Bhadada SV, Patel BM, Mehta AA, Goyal RK. beta(3) Receptors: Role in Cardiometabolic Disorders. Ther Adv Endocrinol Metab. 2011;2:65–79. [DOI] [PMC free article] [PubMed] [Google Scholar]
- [49].Cheon BK, Hong YY. Mere experience of low subjective socioeconomic status stimulates appetite and food intake. Proc Natl Acad Sci U S A. 2017;114:72–7. [DOI] [PMC free article] [PubMed] [Google Scholar]
- [50].Sun N, Yun J, Liu J, Malide D, Liu C, Rovira II, et al. Measuring In Vivo Mitophagy. Mol Cell. 2015;60:685–96. [DOI] [PMC free article] [PubMed] [Google Scholar]
- [51].Soare A, Cangemi R, Omodei D, Holloszy JO, Fontana L. Long-term calorie restriction, but not endurance exercise, lowers core body temperature in humans. Aging (Albany NY). 2011;3:374–9. [DOI] [PMC free article] [PubMed] [Google Scholar]
- [52].Carrillo AE, Flouris AD. Caloric restriction and longevity: effects of reduced body temperature. Ageing Res Rev. 2011;10:153–62. [DOI] [PubMed] [Google Scholar]
- [53].Corrales P, Vivas Y, Izquierdo-Lahuerta A, Horrillo D, Seoane-Collazo P, Velasco I, et al. Long-term caloric restriction ameliorates deleterious effects of aging on white and brown adipose tissue plasticity. Aging Cell. 2019;18:e12948. [DOI] [PMC free article] [PubMed] [Google Scholar]
Associated Data
This section collects any data citations, data availability statements, or supplementary materials included in this article.