Abstract
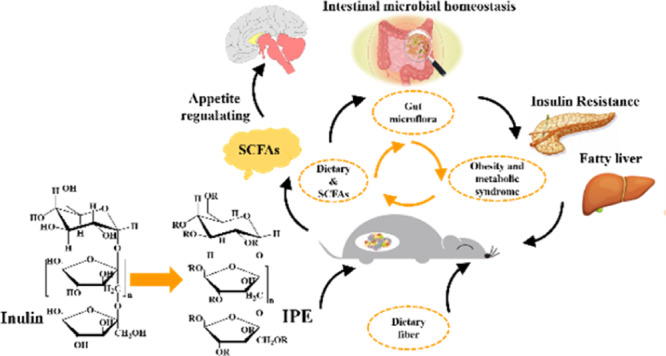
Short-chain fatty acid (SCFA) plays an important role in improving obesity and related metabolic syndrome induced by high-fat diet. We used the prepared inulin propionate ester (IPE) as a system for the targeted release of propionate to the colon to elucidate the role of IPE in regulating obesity and metabolic syndrome, and intestinal microbial homeostasis, in diet-induced obese mice. With this strategy, IPE significantly increased the SCFA contents in the colon and resulted in significant body weight reduction, insulin resistance amelioration, and gastrointestinal hormone (glucagon-like peptide and peptide YY) secretion (P < 0.05). The IPE intervention reduced liver fatty accumulation, which improved obesity-related fatty liver disease (P < 0.05). IPE supplementation increased the richness and diversity of the microbial community and altered bacterial population at both the phylum and family level. Intestinal microbial results showed that the relative abundance of Desulfovibrionaceae and Erysipelotrichaceae, which promote the production of inflammatory factors, was reduced. Our results demonstrate that IPE can be used as an effective strategy for delivering propionate to obese mice colon, which can ameliorate obesity and associated metabolic syndrome and modify intestinal microbial homeostasis.
Introduction
Owing to the improvement in living standards and changes in the dietetic habits of people, especially increase in the consumption of processed food products lacking fiber, the incidence of obesity has increased, which has not only seriously threatened human well-being and health but is associated with increased risk of various diseases such as type 2 diabetes (T2D), insulin resistance (IR), and hepatic and cardiovascular diseases.1,2 The beneficial effects of dietary fibers on obesity-related metabolic diseases have been recognized previously.3 Previous studies have reported that dietary fibers and short-chain fatty acids (SCFAs) play an important role in regulating high-fat diet (HFD)-induced obesity and related metabolic syndrome.4,5
Dietary fibers, such as inulin, which escape digestion in the upper gut could be metabolized by the microbiota in the cecum and colon into SCFAs, which mainly include acetate, propionate, and butyrate.6,7 SCFAs affect various biological processes and play important roles in improving the metabolism and function of the large intestine by acting via the free fatty acid receptor GPR43.8,9 High amounts of acetate suppress appetite and increase energy expenditure via central hypothalamic mechanisms in rodents.10 Propionate is a precursor for gluconeogenesis in the intestine, which improves glucose homeostasis and inhibits the synthesis of hepatic lipid.11,12 Furthermore, Chambers et al. reported that inulin propionate ester (IPE) can be used for SCFA delivery to increase propionate levels in colon.13 Butyrate, which can be absorbed and utilized by epithelial cells, is the most important energy source of the human colon and cecum epithelial cells.14,15 Although SCFAs have been extensively studied for the effects on intestinal health, glucose and lipid metabolism, as well as appetite regulation and energy expenditure, the precise mechanisms remain unclear. Dietary fibers are fermented by human intestinal bacteria and stimulate the production of SCFA, which contribute to the growth of specific bacteria and are beneficial for the host. Recent studies have indicated that the microbiota composition plays an important role in intestinal health and metabolic diseases such as obesity or T2D.15−17 The relationship between intestinal microflora and SCFA has been widely recognized. Furthermore, we have highlighted the importance of intestinal microflora and SCFA in regulating metabolism, where dietary supplementation with SCFA can be used as a strategy to improve intestinal microbial composition and body health.5 Oral SCFA supplementation in humans has been investigated to regulate appetite; however, the poor organoleptic properties and ease of being absorbed in the proximal small intestine have limited its use.
We have synthesized IPE, which can be used as a propionate carrier to increase the levels of SCFA in colon, previously.18 Propionate regulates appetite by stimulating the release of gastrointestinal hormones glucagon-like peptide (GLP-1) and peptide YY (PYY) via activation of the G-protein-coupled receptors (GPCRs) 41 and 43, which in turn affect food intake and body weight gain.13,17,19 Furthermore, based on the results of our previous studies, we hypothesized that IPE can be used to increase the propionate content in vivo, stimulate gastrointestinal hormone secretion, and alter intestinal microbial composition and metabolism. To thoroughly investigate these processes, we analyzed whether direct supplementation of IPE affects the development of obesity in HFD-induced obese mice in this study. We investigated the effects of IPE on food intake, body weight, and blood lipid level and analyzed its influence on homeostatic model assessment-IR (HOMA-IR) and steatohepatitis. Furthermore, we determined the SCFA levels and intestinal microbiota composition in fecal samples.
Results and Discussion
Effects of Inulin, Pr, and IPE on Food Consumption and Body Weight
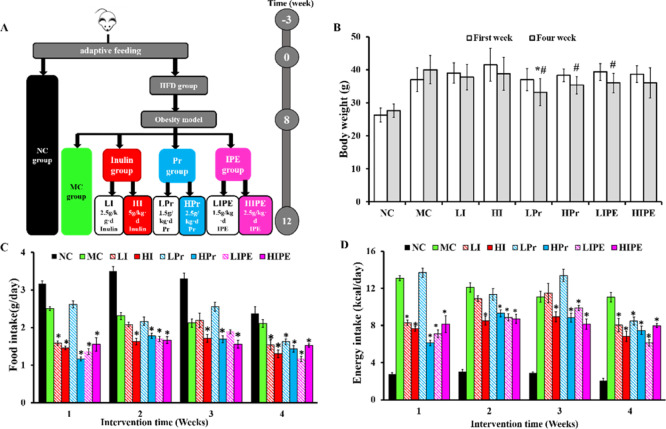
Dietary supplementation with a fermentable fiber and SCFA has been reported to alleviate diet-induced obesity and its associated metabolic syndrome as they can improve intestinal health by altering the homeostasis of gut microbial composition, which is essential for the maintenance of human health.4,20 As shown in Figure 1, we investigated the effects of inulin, Pr, and IPE on the body weight and food intake of HF diet-induced obese mice. The animals of the MC group were more obese than the animals of the NC group. Similarly, compared to the MC group, supplementation with inulin, Pr, and IPE showed different degrees of reduction in obesity (Figure 1B). Only the body weight increased in the NC and MC groups, whereas the body weight decreased in all the experimental groups (Figure 1B). Comparison of the results before and after intervention showed that the body weight of the animals in the LPr, HPr, and LIPE groups decreased significantly (P < 0.05, Figure 1B), whereas the decrease in body weight was not significant in LI, HI, and HIPE groups. Compared to the MC group, the inulin, Pr, and IPE supplementation groups showed reduction in the final body weight, whereas only the LPr group showed statistically significant difference in weight loss (P < 0.05, Figure 1B).
Figure 1.
Timeline and results of inulin, Pr, and IPE treatment. Inulin, Pr, and IPE prevented increases in body weight and food intake in obese mice. (A) flowchart of design and protocol of the study; (B) body weight comparison before and after intervention; (C,D) food and energy intake per mouse during the experiment. Data were shown as mean ± SD. *P < 0.05, vs MC; #P < 0.05, body weight comparison before and after intervention in the experimental group (n = 10).
Compared to the MC group, supplementation with inulin, Pr, and IPE significantly decreased the amount of food and energy intake (P < 0.05, Figure 1C,D), which was especially prominent in the LIPE group. Furthermore, we analyzed the cumulative food and energy intake over the 4 weeks, which is shown in Figure S1. Our results indicated that the cumulative food and energy intake over the 4 weeks were significantly decreased in the HI, HPr, and IPE (LIPE and HIPE) groups compared with that in the MC group (P < 0.05, Figure S1A,B). However, there was no linear relationship between the body weight and food intake. Our study was consistent with previous studies that supplementation with dietary fiber and SCFAs plays an important role in reducing food intake and preventing body weight gain, as well as energy homeostasis.4,21 Although dietary fibers and SCFAs have been shown to protect against food intake and body weight gain in both mice and overweight humans, the underlying mechanisms were unclear. These diverse effects of SCFAs may be due to differences in HFD formula and mouse species, age, and the quantity of SCFA added.
Effects of Inulin, Pr, and IPE on Oral Glucose Tolerance Test, Fasting Blood Glucose, Fasting Insulin, HOMA-IR
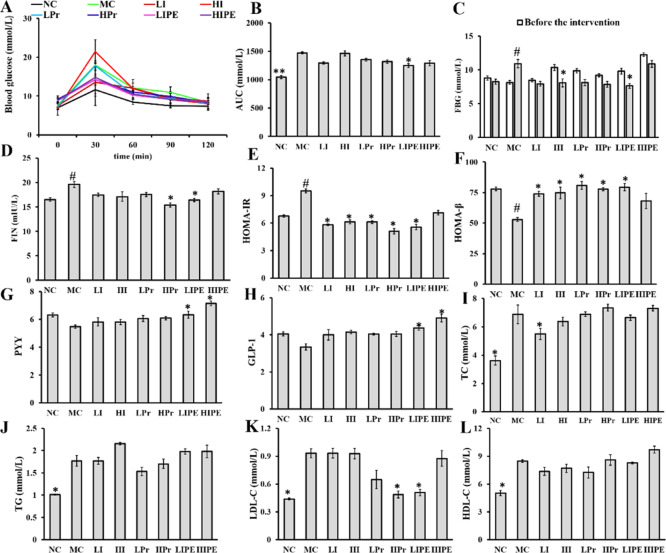
Dietary fibers and SCFAs have also been reported to be associated with regulation of blood glucose and IR where propionate plays an important role in gluconeogenesis.11,22 Oral glucose tolerance test (OGTT) results indicated that the blood glucose levels were significantly higher before and after glucose load (P < 0.05, Figure 2A). Glucose intolerance was elevated dramatically in obese mice of the MC group (P < 0.05, Figure 2B). Compared to that with the MC group, glucose tolerance was reduced significantly with LIPE treatments (P < 0.05, Figure 2B), consistent with the results of previous studies where inulin and SCFA improved HFD-induced IR and glucose tolerance, where propionate plays an important role in the underlying mechanism.23 After 4 weeks of intervention, the fasting blood glucose (FBG) level increased only in the MC group (P < 0.05, Figure 2C), while that of both the HI (31.64%) and LIPE (22.14%) groups decreased significantly. Furthermore, compared to the preintervention levels, the FBG levels in LI, Pr (LPr and HPr), and HIPE treatment groups decreased, albeit not significantly (P > 0.05, Figure 2C).
Figure 2.
Effect of inulin, Pr, and IPE on glucose tolerance, FBG, serum insulin, HOMA-IR and HOMA-β indices, PYY, GLP-1, and blood lipid profiles. (A) Blood glucose in OGTT; (B) area under curve (AUC) in OGTT; (C) FBG; (D) serum insulin; (E) HOMA-IR; (F) HOMA-β; (G) PYY; (H) GLP-1; (I) TC; (J) TG; (K) LDL-C; (L) HDL-C. Data show the mean ± SD. Compared to the MC, *P < 0.05, vs MC; #P < 0.05 vs NC (n = 6).
Compared to that of the NC group, the MC group showed increase in serum fasting insulin level (FIN) (P < 0.05, Figure 2D), whereas the FIN levels after HPr and LIPE treatments were significantly lower than that of the MC group (P < 0.05, Figure 2D). Furthermore, it was obvious that the symptoms of IR were severe in the MC group, as indicated by the HOMA-IR and HOMA-β indices (Figure 2E,F), which were used to evaluate the level of IR and the function of pancreatic beta cells, respectively. Compared to that of the MC group, HOMA-IR was significantly alleviated in the inulin (LI and HI), Pr (LPr and HPr), and LIPE groups (P < 0.05, Figure 2E), with the exception of the HIPE group (P > 0.05, Figure 2E). Similarly, inulin (LI and HI), Pr (LPr and HPr), and LIPE treatment (P < 0.05, Figure 2F) but not HIPE treatment (P > 0.05, Figure 2F) significantly increased HOMA-β, which is used as an indicator of pancreatic β-cell function, as Chambers has suggested that supplementation of 20 g/day of IPE or inulin in overweight and obese adults could improve IR. These positive effects have been observed with SCFAs, especially propionate, which have been suggested to improve insulin sensitivity via metabolic pathways and receptor-mediated mechanisms.24
Effects of Inulin, Pr, and IPE on Biochemical Parameters
The levels of PYY and GLP-1 decreased in the MC group, whereas inulin, Pr, and IPE supplementation increased the concentration where only the IPE (LIPE and HIPE) group showed a significant increment (P < 0.05, Figure 2G,H). The inulin (LI and HI) and Pr (LPr and HPr) groups showed an increase in GLP-1 and PYY levels, albeit with no significant change. Chambers et al. also reported that the SCFAs produced by microbial fermentation of dietary fibers in the colon can stimulate the release of the anorectic gut hormones PYY and GLP-1 from rodent enteroendocrine L cells.24 However, orally administered SCFAs would be rapidly absorbed in the small intestine which could be explained why added LPr and HPr showed no significant effect. Furthermore, supplementation of diets with dietary fiber inulin could not predictably increase propionate production in colon because of the variability in gut microbial activity.13,25 Overall, the above analyses illustrated that IPE can be used as a delivery system targeting the release of propionate in the colon.
SCFAs, especially propionate, promote the release of gastrointestinal hormones (PYY and GLP-1) and protect against energy intake and body weight gain in obese adults.13 However, various studies have demonstrated that acetate and propionate selectively activate the GPCR 43 (GPR43), while propionate and butyrate preferentially activate GPR41. Lu et al. observed that the expression of GPR43 and GPR41 correlated positively with PYY and GLP-1 levels in mice, which may result in the reduction in food intake and body weight gain.26,27 The decrease in food intake and body weight gain in our study may also occur via the gastrointestinal hormone mechanism, which supports the importance of SCFA, especially propionate, in appetite regulation.
Serum lipid analysis revealed that the serum lipid levels of total cholesterol (TC), triglyceride (TG), high density lipoprotein cholesterol (HDL-C), and low density lipoprotein cholesterol (LDL-C) in the MC group were significantly higher than that in the NC group (P < 0.05, Figure 2I–L), whereas LI treatment reduced only the TC level (P < 0.05, Figure 2I); in addition, there was no statistical difference in the results obtained after Pr and IPE intervention. Inulin treatment had no effect on TG, LDL-C, and HDL-C levels in this study. Our results were consistent with Mistry et al. who reported that neither short- nor long-chain inulin affected intestinal cholesterol absorption and metabolism.28 Supplementation with LPr slightly reduced the TG level, while the other treatments showed mitigating effect (P > 0.05, Figure 2J). Compared to that of the MC group, HPr and LIPE treatments significantly reduced the LDL-C level (P < 0.05, Figure 2K), which was consistent with the improvement observed in the NC group. These results indicated that Pr and IPE can be used to deliver extra propionate to the colon and ameliorate the serum lipid levels, which corroborates the previous report showing that SCFA can modulate serum lipid concentration and alter hepatic lipogenesis.29 The LPr and LIPE intervention slightly increased the HDL-C level, although the observation was not significant (Figure 2L), which may be due to our intervention that was not long enough to cause significant changes in blood lipids. Meanwhile, the acute administration may cause unpalatable affect which would influence the lipid metabolism of mice.13
Effects of Inulin, Pr, and IPE on the Improvement of Hepatic Lipid Metabolism
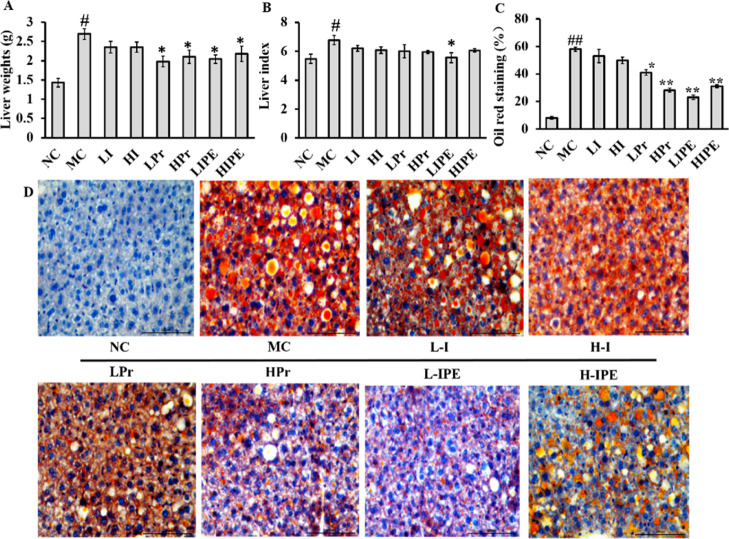
The liver weight and liver index results of the MC group were significantly high (P < 0.05, Figure 3A), which revealed that fat accumulation in obese mice, especially in the liver, was much higher than that in the NC group. Propionate has already been suggested to attenuate lipid biosynthesis in the liver and reduce plasma cholesterol levels,30,31 although the mechanism was unclear. Weitkunat et al. observed that supplementation with inulin or SCFA reduces hepatic TG concentrations, while the plasma parameters remain unchanged.3 Compared to the MC group, the liver weight was significantly reduced with Pr and IPE intervention (P < 0.05, Figure 3A), while the inulin groups showed no significant improvement (P > 0.05, Figure 3A). However, only the LIPE treatment significantly decreased the liver index (P < 0.05, Figure 3B). The oil red O staining results showed the MC group with significant hepatocyte swelling (Figure 3C,D). With the intervention of Pr and IPE, the orange-red lipid droplets decreased significantly, especially in the HPr and LIPE group (Figure 3C,D), which showed that the liver cell structure was clear and that fat accumulation had significantly reduced. Our results are consistent with the previous report where propionate was used as a precursor for intestinal gluconeogenesis, which suppressed the synthesis of cholesterol and fatty acids in the liver of mice.11,12 Previous studies also suggested a mechanism that propionate can activate the adrenergic receptor, which increased the expression of brown-fat-enriched secreted factor (Nrg4) and decreased hepatic steatosis.32,33
Figure 3.
Inulin, Pr, and IPE-reduced liver weight, liver index, and liver fat in obesity mice. (A) Liver weight; (B) liver index; (C) quantification of positive stained area (% of pos area); (D) effect on liver sections with Oil Red O staining. Data show the mean ± SD. Compared to the MC, *P < 0.05, **P < 0.01 vs MC; #P < 0.05, ##P < 0.01 vs NC (n = 6).
Analysis of the Effect Size of the Treatment with IBR
The integrated biomarker response (IBR) index was calculated to evaluate the effect size of inulin, Pr, and IPE on obesity-related metabolic syndrome in diet-induced obesity mice. Briefly, a set of biochemical biomarkers including body weight, food, and energy intake, FBG, FIN, HOMA-IR, HOMA-β, biochemical parameters (PYY, GLP-1, TC, TG, LDL-C, HDL-C), and hepatic lipid metabolism (liver weight and liver index) were standardized and used to draw a star plot (Figure 4). It was obvious that the IBR value (star plot area) at GLP-1, PYY, HOMA-β was higher, while food consumption, HOMA-IR, FBG, FIN, and liver weight and liver index were ameliorated with the treatment of LIPE compared with that of the MC group. The IBR value gives an intuitionistic effect size of inulin, Pr, and IPE on various physiological indicators. Identically, the star plot also indicated that the treatment with Pr (LPr and HPr) and IPE (LIPE and HIPE) showed little effect on blood lipid improvement. Consequently, the IBR index was useful to calculate the effect size of the treatment to evaluate the physiological effects.
Figure 4.
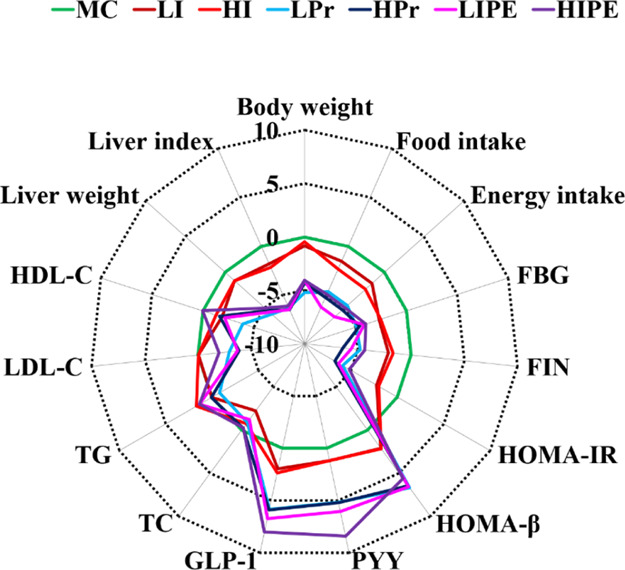
IBR index of different treatment groups.
Effects of Inulin, Pr, and IPE on Fecal SCFA Levels
The total SCFA content in the MC group and experimental groups was significantly decreased compared with that in the NC group (P < 0.05, Figure 5A). The total SCFA content in the Pr (LPr and HPr) intervention group was lower than those of the other groups. The acetate level was lower in all the experimental groups than in the MC group (Figure 5B), as the molar ratio of acetate also decreased with the intervention of inulin, Pr, and IPE (Figure 5C). In contrast, the acetate level in the MC group was abnormally high, which can be explained by Rachel’s observation that acetate mediates a microbiome–brain−β-cell axis to promote obesity and body weight gain (Figure 5B).34 In particular, LIPE supplementation significantly increased the fecal propionate content and the propionate molar ratio compared to other treatment groups (P < 0.05, Figure 5B), as well as the MC group. Furthermore, both LIPE and HIPE supplementation also significantly increased the butyrate molar ratio in feces (Figure 5B). Previous studies have shown that propionate could improve IR and obesity-related metabolic syndrome, while other studies have also shown that via gut microbial transplantation would promote caecal propionate production in mice and improve glucose metabolism.3,24 Therefore, our study preliminarily indicated that IPE can be used as an effective strategy for delivering the SCFA propionate to the colon to improve obesity and the metabolic syndrome.
Figure 5.
(A) Total SCFA; (B) molar ratios in feces with 4 weeks of inulin, Pr, and IPE intervention. *P < 0.05, **P < 0.01 vs MC; #P < 0.05, ##P < 0.01 vs NC (n = 4).
Effects of Inulin, Pr, and IPE on Fecal Microbial Diversity Indices
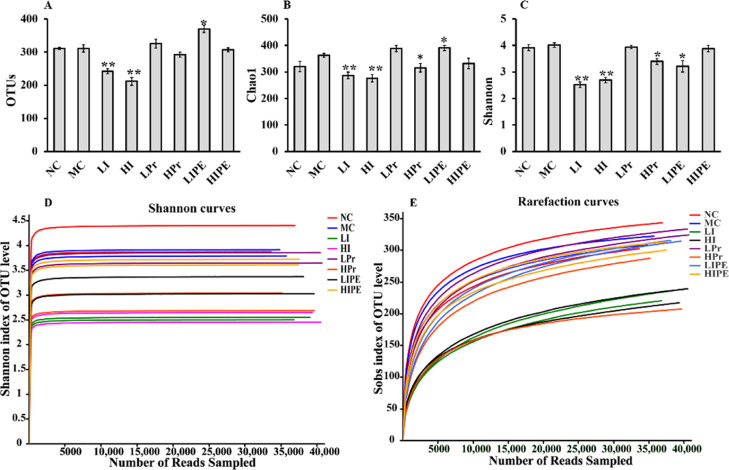
We generated a dataset of 142,5993 sequence reads of 32 fecal samples (4 samples were taken from each group for microbial sequencing analysis), with an average of 43,844 reads per fecal sample. The high-quality sequences of all samples were clustered with a consistency of 97%, and 532 OTUs were obtained. The Chao1 species richness and Shannon diversity index were used to evaluate the richness and diversity of the microbial community, respectively (Figure 6). The OTUs, Chao1 index, and Shannon diversity were higher in the MC group than in the NC group (Figure 6). The OTUs and Chao1 and Shannon index were significantly reduced by LI and HI intervention (P < 0.01, Figure 6A–C), whereas HPr treatments significantly decreased Chao1 and Shannon index compared to that of the MC group. The alpha diversity indices illustrated that treatment with inulin (LI and HI) and HPr would reduce the microbial diversity, while replenishment with LIPE increased the bacterial community richness but decreased the diversity. The rarefaction and Shannon–Wiener curves tended to be saturated, which indicated that the obtained sequencing data were adequate for covering the entire spectrum of bacterial diversity and the majority of the information pertaining to microbial species in the sample (Figure 6D,E).
Figure 6.
Effect of inulin, Pr, and IPE on the alpha diversity indices of fecal microbiota (A), OUT numbers; (B) bacterial richness estimated using the Chao1 value; (C) bacterial diversity estimated using the Shannon index; (D) Shannon–Wiener curve; (E) rarefaction curve. Data were presented as means ± SD. *P < 0.05, **P < 0.01 vs MC (n = 4).
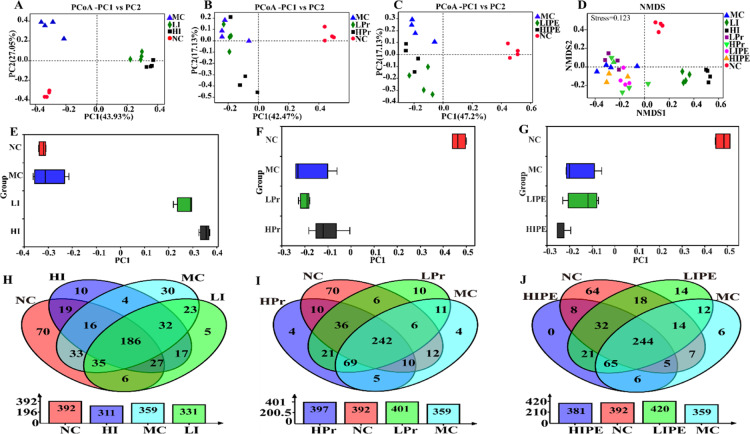
Principal coordinate analysis (PCoA) (Figure 7) showed that the microbiome in inulin (LI and HI), Pr (LPr and HPr), and IPE (LIPE and HIPE) treatment groups significantly differed from one another, while the LPr and MC groups shared some overlapping regions, which indicated that the overall gut microbial community had been significantly modified (Figures 7A–C and 6E–G). Nonmetric multidimensional scaling (NMDS) analysis based on Bray–Curtis similarity distance showed that the MC, LPr, and LIPE groups were closer, whereas the NC, inulin (LI and HI), HPr, and HIPE group could be distinguished from each other (Figure 7D).
Figure 7.
Effect of inulin, Pr, and IPE on the beta diversity of fecal microbiota. (A–C) and (E–G) PCoA; (D) NMDS ordination based on Bray–Curtis similarities of bacterial communities; (H–J) Venn diagrams analysis of the different groups showing overlaps of OTUs (at 97% similarity).
Venn diagrams revealed similarities in the relationship between different treatment groups and control groups (Figure 7H–J). The number of OTUs in the NC group was 292; nevertheless, the shared OTUs of the NC and MC groups reduced to 270 with the HFD diet, which indicated that HFD reduced the extent of similarity of the microbial composition between the NC and MC groups. We observed that the amount of OTUs shared between the Pr group and the NC group increased to 290 and 298 (LPr vs HPr), while that with the IPE group was 308 and 298 (LIPE vs HIPE), respectively (Figure 7H,I). However, the shared OTUs among the inulin group and NC group decreased to 254 and 248, respectively (LI vs HI) (Figure 7H).
Effects on Fecal Bacterial Community Composition
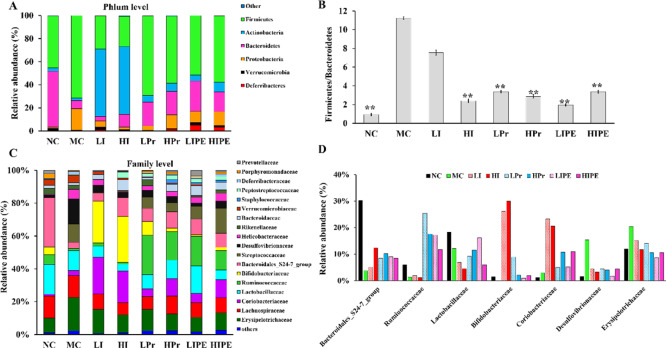
Dietary fiber and SCFAs have been described as important factors ameliorating obesity and associated disorders by modifying the composition and activity of the gut microbiota.35 At the phylum and family levels, Bacteroidetes and Firmicutes were the two dominant bacterial phyla in all samples, with the exception of the inulin group (LI and HI) (Figure 8A). The relative abundance of Firmicutes (P < 0.05) was higher, whereas that of Bacteroidetes was lower in the MC group than in the NC group (P < 0.05, Figure 8A), which was consistent with the results of several previous reports.36 The same conclusion was also obtained in genetically obese mice.26 In the inulin (LI and HI) group, the abundance of Firmicutes decreased significantly (P < 0.05), whereas that of Bacteroidetes increased, although the difference was not significant. The relative abundance of Firmicutes in Pr and IPE groups was reduced and that of Bacteroidetes increased with no statistical significance (Figure 8A). Dramatically, the abundance of actinomycetes increased significantly to 58.34 and 58.73% in the LI and HI groups, respectively (P < 0.01, Figure 8A). In agreement with the observations of Weitkunat et al., the relative abundance of Actinobacteria significantly increased only in the inulin group which was probably due to the increase of Bifdobacteria population.3 Chambers et al. also indicated that compared to IPE, inulin supplementation promoted a bifidogenic effect.24
Figure 8.
Inulin, Pr, and IPE modulate the composition of the gut microbiota. (A) Relative abundance of predominant bacteria at the phylum level; (B) changes in Firmicutes/Bacteroidetes ratio in different groups; (C) relative abundance of predominant bacteria at the family level; and (D) relative abundance of certain bacteria at the family level, which were affected by inulin, Pr, and IPE interventions. **P < 0.01 vs MC.
The relative abundance ratios of Firmicutes and Bacteroidetes (F/B) ratio, which can be used as an indicator of gut microbial imbalance and the obesity degree in the MC group, was significantly higher than that of the NC group (P < 0.01, Figure 8B). Both the body weight and F/B results in the NC group were significantly lower than that in the MC group. The relative abundance of F/B significantly decreased in the HI, Pr (LPr and HPr), and IPE (LIPE and HIPE) groups (P < 0.01, Figure 8B) where the HI, HPr, and LIPE groups showed more obvious reduction. At the family level, the abundances of primary bacterial communities in the NC group were as follows: Lachnospiraceae (13.28%), Lactobacillaceae (18.25%), and Bacteroidales_ S24_7 group (30.23%). The MC group showed a significant decrease in the Bacteroidales_ S24_7 population and a significant increase in Erysipelotrichaceae and Desulfovibrionaceae abundance (P < 0.05), which was consistent with the observations of Gerritsen et al.37 Our results also indicated that the abundance of the Bacteroidales_ S24_7 group increased, whereas that of Lachnospiraceae decreased with the intervention of inulin, Pr, and IPE, albeit without statistical significance. The relative abundances of Bifidobacteriaceae and Coriobacteriaceae increased with inulin (LI and HI) supplementation (P < 0.01, Figure 8C,D), which may have contributed to the increase in Actinobacteria abundance (Figure 8A,C). The abundance of Ruminococcaceae of phylum Firmicutes was significantly higher in the Pr (LPr and HPr) and IPE (LIPE and HIPE) groups than in any other group (P < 0.05, Figure 8C,D). As previously reported, both Bacteroidales_S24-7 group and Ruminococcaceae contained several butyrate-producing bacteria.38 Zhang et al. indicated that the abundance of Ruminococcaceae was higher in obese mice, whereas inulin-treated mice showed lower abundance.39 Compared to that in the MC group, the abundance of Erysipelotrichaceae and Desulfovibrionaceae was reduced significantly in the HPr and LIPE groups (P < 0.05, Figure 8C), which corroborated Lu et al.’s observations that addition of acetate and propionate to diets reduced the abundance of Desulfovibrionaceae.26 The heat map analysis of microbial community composition at the family level confirmed that the abundance of Erysipelotrichaceae and Desulfovibrionaceae that cause obesity and metabolic syndrome-related inflammation were reduced (Figure S2). Previous studies have confirmed that Desulfovibrionaceae are lipopolysaccharide producers, which might lead to IR-related metabolic disorders.40−42
Comparing our research with Chambers’, our results indicated that IPE significantly improved liver fat accumulation. Meanwhile, the composition of gut microbes was affected at different levels with IPE supplementation in the current study and the study of Chambers.24 There may be several reasons for this difference. On the one hand, we noticed that only 12 people were involved in the study of Chambers et al.24 On the other hand, different genders were used in Chambers’ research and the three treatments (IPE, inulin, and cellulose) were consecutively done in the same 12 people (the experiments were repeated every 28 days with IPE, inulin, and cellulose intervention, respectively). In addition, different IPE preparation methods and dosages may have different effects. However, the underlying mechanisms still require further investigation.
Inulin derivatives have been widely used for the development of a microbiota-triggered colon targeting drug delivery system. In this study, we used IPE as a delivery system targeting the release of propionate to the colon, which significantly increased the SCFA content, especially propionate in the colon with the fermented role of gut microbes. The increment of propionate improved gastrointestinal hormone secretion and IR. By reducing the abundance of pathogenic bacteria that cause obesity and metabolic syndrome-related inflammation, the composition of gut microbes was altered and the metabolism was improved.
Predicted Metabolic Functional Profiles of Microbial Communities Using PICRUSt
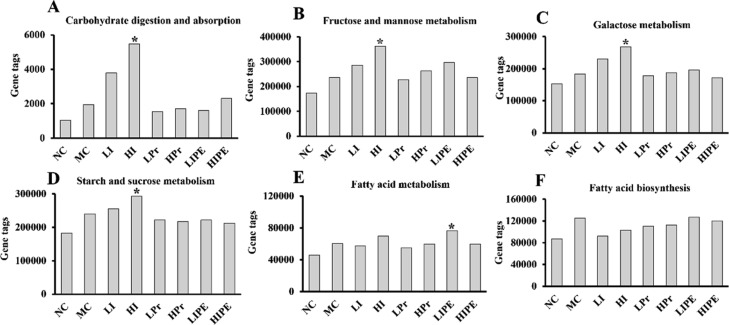
The potential function profiling of gut bacteria with respect to metabolism was investigated using the PICRUSt program. Among 217 KEGG pathways, the number of genes related to carbohydrate digestion and absorption, fructose, and mannose metabolism, galactose metabolism, and starch and sucrose metabolism increased with HI treatment (P < 0.05, Figure 9A–D). Nonetheless, the inulin group showed no significant effect on fatty acid biosynthesis and fatty acid metabolism (P > 0.05) compared to the MC group, while only the LIPE group showed increase in the number of the genes related to fatty acid metabolism (P < 0.05, Figure 9E). Compared to other groups, the LIPE group showed increase in fatty acid biosynthesis, although the observations were not statistically significant (P > 0.05, Figure 9F). Comprehensive analysis of serum lipid and liver section staining showed that LIPE supplementation may be involved in lipid metabolism by augmenting SCFA production, especially that of propionate. Nevertheless, the effect of propionate on hepatic synthesis is being debated. Therefore, further studies are required to elucidate the mechanism of propionate action on lipid metabolism in the liver as well as in other organs.
Figure 9.
Prediction on energy and carbohydrate metabolism of bacterial communities using the PICRUSt program. (A) Carbohydrate digestion and absorption; (B) fructose and mannose metabolism; (C) galactose metabolism; (D) starch and sucrose metabolism; (E) fatty acid metabolism; (F) fatty acid biosynthesis. *P < 0.05, vs MC.
Conclusions
In summary, we used IPE as a strategy to ameliorate obesity and its metabolic syndrome in an HFD-induced mice model. IPE was used as propionate carrier targeting of colon, which effectively improved IR and alleviated liver fat accumulation in obese mice. Intestinal microbial results showed that the relative abundance of Desulfovibrionaceae and Erysipelotrichaceae was reduced. The improvement of obesity and related metabolic syndrome may be related to the decrease of pathogenic bacteria abundance with the increment of propionate in colon. This study highlights that IPE is an effective strategy to increase propionate in the colon.
Materials and Methods
Chemicals
The research diets D12492 and D12450B were purchased from New Brunswick, NJ, USA, and their composition is shown in Table S1. All kits used were purchased from Nanjing Jiancheng Chemical Industrial Co. Ltd., China. All other chemicals and solvents used were of reagent grade.
Animal Treatments and Experimental Design
All experimental procedures and protocols were performed with the approval of the Animal Care Committee of Binzhou Medical University (BMU-2018-71), and all methods were performed in compliance with the approved guidelines and regulations. The experiments involved 4-week-old male C57BL/6 mice (20 ± 2.5) g, originally purchased from Peng Yue Experimental Animal Breeding Co., Ltd. (Jinan, Shandong, China, SCXK-2013-0020). All mice were maintained at the Experimental Animal Center of Binzhou Medical University (Shandong, China) in cages in a climate-controlled room (22 ± 2 °C, relative air humidity 50 ± 10%) with a 12 h light–dark cycle (lights on at 7 a.m.). The animals were provided free access to food and water. After 2 weeks of adaptive feeding, all mice were randomly divided into two groups, which were fed either low-fat diet (LFD) (kcal %: 10% fat, research diet D12450B) in the normal control group (NC, n = 10) or HFD (kcal %: 60 fat, research diet D12492, New Brunswick, NJ, USA) (Table S1) in the obese model group (n = 70) for 8 weeks until the body weight of the mice in the model group was 20% higher than the average weight of the control group, which was the standard for the obesity model.19 Afterward, the obese mice were randomly divided into 7 groups (Figure 1A, n = 10 per group): the animals in the HFD model control group (MC) were administered with saline, while the animals in the other groups were orally administered low and high dose of inulin (LI and HI) via gavage. Inulin (degree of polymerization 8–10, extracted from chicory) was procured from Sensus (Roosendaal, the Netherlands). Low- and high-dose propionate (Pr) (LPr and HPr) and low- and high-dose IPE (LIPE and HIPE) were used for intervention; the degree of substitution of IPE was 2.86, which was synthesized in our previous study.18 All the supplements were dissolved in water and 0.2 mL supplement/(10 g body weight) was administered to the animals in the experimental group, while the animals in the control group (NC and MC group) were administered the same volume of saline. The doses used in different groups are shown in Figure 1A. Body weight was measured weekly, while food consumption and energy intake were measured daily and analyzed once a week. Fresh stool samples were collected after 4 weeks of intervention. Mice were placed in sterile cages separately and allowed to defecate naturally. The feces were collected with sterile forceps, stored in EP tubes, immediately frozen in liquid nitrogen, and stored at −80 °C for SCFA and microbiota analysis.
The FBG was measured once a week after fasting for 12 h before the experiment via collecting blood from caudal vein. In week 4, an OGTT was performed after fasting for 12 h as described previously, and after OGTT, the mice were given 1 week of recovery time.43,44 Furthermore, the animals were fasted for 12 h and then euthanized to obtain the blood samples from the intraorbital retrobulbar plexus. Serum was prepared to measure the TC, TG, as well as LDL-C and HDL-C levels as per manufacturer’s instruction (Nanjing Jiancheng Chemical Industrial Co. Ltd., China). Enzyme-linked immunosorbent assay kits were used for the detection of FIN, GLP-1, and PYY levels. HOMA-IR and homeostasis model assessment-β (HOMA-β) were calculated as described previously.45,46 Liver tissues were removed, weighed to calculate the liver index (the ratio of liver weight to the mice weight), and fixed in 4% paraformaldehyde at 4 °C for making pathological sections for Oil Red O staining as described previously to analyze fat accumulation.47,48
According to Burgeot et al. methods, the IBR version 2 (IBRv2), adapted from the IBR previously described by Beliaeff and Burgeot, was used to evaluate the effect size of the treatment with inulin (LI and HI), Pr (Lpr and HPr), and IPE (LIPE and HIPE) on obese mice.49,50 All the biomarker responses at different levels were standardized at each site into one general “stress index”.
SCFA Analysis in Feces
The concentration of SCFAs in the feces was measured using gas chromatography–mass spectrometry as described previously.51,52
Fecal DNA Extraction, Polymerase Chain Reaction (PCR), and Illumina MiSeq Sequencing
Total DNA was extracted from the fecal samples, and the V3–V4 regions of the 16S rRNA were amplified using PCR and sequenced using an Illumina MiSeq sequencer (Illumina, San Diego, USA). After removing unqualified sequences, 142,5993 high-quality 16S rRNA sequences were generated for 32 mice samples. Operational taxonomic units (OTUs) were clustered with a 97% similarity cutoff using UPARSE.53 OTUs were used for biodiversity analysis. Alpha diversity was calculated using Chao1 and Shannon indexes to identify community richness and diversity using the MacQIIME software package, and PCoA plots were drawn using OTUs from each sample based on unweighted UniFrac distances to represent beta diversity.54,55 Phylogenetic Investigation of Communities by Reconstruction of Unobserved States (PICRUSt) was used to predict the functional microbiota content in the fecal samples with the 16S rRNA sequence data.56 Then, the Kyoto Encyclopedia of Genes and Genomes (KEGG) database was used to predict metabolic functions.
Statistical Analysis
All data were expressed as means ± SD. To ensure the accuracy of the data, we prepared three samples of each mouse for parallel experiments. Statistical calculation was performed using GraphPad Prism 5 (GraphPad Software, San Diego, CA, USA), and the results were processed using SPSS 16.0. The liver sections with Oil Red O staining were quantitatively analyzed with ImageJ software (Version 1.8.0-112). The significant differences of the results were subjected to one-way analysis of variance, followed by Tukey’s post hoc test when the data were normal and variances were equal; otherwise, the Kruskal–Wallis test and Mann–Whitney test were applied. Differences with P < 0.05 were considered statistically significant.
Acknowledgments
This work was supported by the National Key Research & Development Program in China (2019YFD1002704), the Science and Technology Service Initiative of the Chinese Academy of Sciences (KFJ-STS-ZDTP-023) and the Key Research and Development Program of Yantai (2018XSCC046).
Glossary
Abbreviations
- IPE
inulin propionate ester
- Pr
propionate
- LI and HI
low- and high-dose inulin
- LPr and HPr
low- and high-dose propionate
- LIPE and HIPE
low- and high-dose inulin propionate ester
- NC
normal control group
- MC
model control group
- GLP-1
glucagon-like peptide
- PYY
peptide YY
- HFD
high-fat diet
- SCFAs
short-chain fatty acids
- FIN
fasting insulin
- FBG
fasting blood glucose
- OGTT
oral glucose tolerance test
- IBR
integrated biomarker response
Supporting Information Available
The Supporting Information is available free of charge at https://pubs.acs.org/doi/10.1021/acsomega.0c00649.
Diet composition of LFD and HFD; cumulative food and energy intake over the 4 weeks in different groups; and heat map analysis of microbial community composition at the family level (PDF)
Author Contributions
∇ Xiaozhen Zhu and Xia Zhang contributed equally to this work.
The authors declare no competing financial interest.
Supplementary Material
References
- Hamilton M. T.; Hamilton D. G.; Zderic T. W. Role of low energy expenditure and sitting in obesity, metabolic syndrome, type 2 diabetes, and cardiovascular disease. Diabetes 2007, 56, 2655–2667. 10.2337/db07-0882. [DOI] [PubMed] [Google Scholar]
- Kahn S. E.; Hull R. L.; Utzschneider K. M. Mechanisms linking obesity to insulin resistance and type 2 diabetes. Nature 2006, 444, 840–846. 10.1038/nature05482. [DOI] [PubMed] [Google Scholar]
- Weitkunat K.; Stuhlmann C.; Postel A.; Rumberger S.; Fankhänel M.; Woting A.; Petzke K. J.; Gohlke S.; Schulz T. J.; Blaut M.; Klaus S.; Schumann S. Short-chain fatty acids and inulin, but not guar gum, prevent diet-induced obesity and insulin resistance through differential mechanisms in mice. Sci. Rep. 2017, 7, 6109–6121. 10.1038/s41598-017-06447-x. [DOI] [PMC free article] [PubMed] [Google Scholar]
- Sonnenburg E. D.; Sonnenburg J. L. Starving our microbial self: the deleterious consequences of a diet deficient in microbiota-accessible carbohydrates. Cell Metab. 2014, 20, 779–786. 10.1016/j.cmet.2014.07.003. [DOI] [PMC free article] [PubMed] [Google Scholar]
- Koh A.; De Vadder F.; Kovatcheva-Datchary P.; Bäckhed F. From dietary fiber to host physiology: short-chain fatty acids as key bacterial metabolites. Cell 2016, 165, 1332–1345. 10.1016/j.cell.2016.05.041. [DOI] [PubMed] [Google Scholar]
- Anderson J. W.; Baird P.; Davis R. H.; Ferreri S.; Knudtson M.; Koraym A.; Waters V.; Williams C. L. Health benefits of dietary fiber. Nutr. Rev. 2009, 67, 188–205. 10.1111/j.1753-4887.2009.00189.x. [DOI] [PubMed] [Google Scholar]
- Flint H. J.; Scott K. P.; Louis P.; Duncan S. H. The role of the gut microbiota in nutrition and health. Nat. Rev. Gastro. Hepat. 2012, 9, 577–589. 10.1038/nrgastro.2012.156. [DOI] [PubMed] [Google Scholar]
- Byrne C. S.; Chambers E. S.; Alhabeeb H.; Chhina N.; Morrison D. J.; Preston T.; Tedford C.; Fitzpatrick J.; Irani C.; Busza A.; Garcia-Perez I.; Fountana S.; Holmes E.; Goldstone A. P.; Frost G. S. Increased colonic propionate reduces anticipatory reward responses in the human striatum to high-energy foods. Am. J. Clin. Nutr. 2016, 104, 5–14. 10.3945/ajcn.115.126706. [DOI] [PMC free article] [PubMed] [Google Scholar]
- Brooks L.; Viardot A.; Tsakmaki A.; Stolarczyk E.; Howard J. K.; Cani P. D.; Everard A.; Sleeth M. L.; Psichas A.; Anastasovskaj J.; Bell J. D.; Bell-Anderson K.; Mackay C. R.; Ghatei M. A.; Bloom S. R.; Frost G.; Bewick G. A. Fermentable carbohydrate stimulates FFAR2-dependent colonic PYY cell expansion to increase satiety. Mol. Metab. 2017, 6, 48–60. 10.1016/j.molmet.2016.10.011. [DOI] [PMC free article] [PubMed] [Google Scholar]
- Frost G.; Sleeth M. L.; Sahuri-Arisoylu M.; Lizarbe B.; Cerdan S.; Brody L.; Anastasovska J.; Ghourab S.; Hankir M.; Zhang S.; Carling D.; Swann J. R.; Gibson G.; Viardot A.; Morrison D.; Thomas E. L.; Bell J. D. The short-chain fatty acid acetate reduces appetite via a central homeostatic mechanism. Nat. Commun. 2014, 5, 3611–3621. 10.1038/ncomms4611. [DOI] [PMC free article] [PubMed] [Google Scholar]
- De Vadder F.; Kovatcheva-Datchary P.; Goncalves D.; Vinera J.; Zitoun C.; Duchampt A.; Bäckhed F.; Mithieux G. Microbiota-generated metabolites promote metabolic benefits via gut-brain neural circuits. Cell 2014, 156, 84–96. 10.1016/j.cell.2013.12.016. [DOI] [PubMed] [Google Scholar]
- Daubioul C.; Nicolas R.; Roger D.; Bernard G.; Henryk T.; Barbara D.; Delzenne N. Dietary fructans, but not cellulose, decrease triglyceride accumulation in the liver of obese zucker fa/fa rats. J. Nutr. 2002, 132, 967–973. 10.1093/jn/132.5.967. [DOI] [PubMed] [Google Scholar]
- Chambers E. S.; Viardot A.; Psichas A.; Morrison D. J.; Murphy K. G.; Zac-Varghese S. E. K.; MacDougall K.; Preston T.; Tedford C.; Finlayson G. S.; Blundell J. E.; Bell J. D.; Thomas E. L.; Mt-Isa S.; Ashby D.; Gibson G. R.; Kolida S.; Dhillo W. S.; Bloom S. R.; Morley W.; Clegg S.; Frost G. Effects of targeted delivery of propionate to the human colon on appetite regulation, body weight maintenance and adiposity in overweight adults. Gut 2014, 64, 1744–1754. 10.1136/gutjnl-2014-307913. [DOI] [PMC free article] [PubMed] [Google Scholar]
- Gao Z.; Yin J.; Zhang J.; Ward R. E.; Martin R. J.; Lefevre M.; Cefalu W. T.; Ye J. Butyrate improves insulin sensitivity and increases energy expenditure in mice. Diabetes 2009, 58, 1509–1517. 10.2337/db08-1637. [DOI] [PMC free article] [PubMed] [Google Scholar]
- Li Z.; Yi C.-X.; Katiraei S.; Kooijman S.; Zhou E.; Chung C. K.; Gao Y.; van den Heuvel J. K.; Meijer O. C.; Berbée J. F. P.; Heijink M.; Giera M.; Willems van Dijk K.; Groen A. K.; Rensen P. C. N.; Wang Y. Butyrate reduces appetite and activates brown adipose tissue via the gut-brain neural circuit. Gut 2018, 67, 1269–1279. 10.1136/gutjnl-2017-314050. [DOI] [PubMed] [Google Scholar]
- Marietta E.; Horwath I.; Taneja V. Microbiome, immunomodulation, and the neuronal system. Neurotherapeutics 2018, 15, 23–30. 10.1007/s13311-017-0601-4. [DOI] [PMC free article] [PubMed] [Google Scholar]
- Aguirre M.; Bussolo de Souza C.; Venema K. The gut microbiota from lean and obese subjects contribute differently to the fermentation of arabinogalactan and inulin. PLoS One 2016, 11, e0159236 10.1371/journal.pone.0159236. [DOI] [PMC free article] [PubMed] [Google Scholar]
- Zhu X.; Jia C.; Meng X.; Xing M.; Yi Y.; Gao X. Synthesis, Characterization of Inulin Propionate Ester, and Evaluation of its in Vitro Effect on SCFA Production. Starch-Stärke 2018, 70, 1800037. 10.1002/star.201800037. [DOI] [Google Scholar]
- Lei F.; Zhang X. N.; Wang W.; Xing D. M.; Xie W. D.; Su H.; Du L. J. Evidence of anti-obesity effects of the pomegranate leaf extract in high-fat diet induced obese mice. Int. J. Obes. 2007, 31, 1023–1029. 10.1038/sj.ijo.0803502. [DOI] [PubMed] [Google Scholar]
- Zou J.; Chassaing B.; Singh V.; Pellizzon M.; Ricci M.; Fythe M. D.; Kumar M. V.; Gewirtz A. T. Fiber-mediated nourishment of gut microbiota protects against diet-induced obesity by restoring IL-22-mediated colonic health. Cell Host Microbe 2018, 23, 41–53. 10.1016/j.chom.2017.11.003. [DOI] [PMC free article] [PubMed] [Google Scholar]
- Lin H. V.; Frassetto A.; Kowalik Jr E. J. Jr.; Nawrocki A. R.; Lu M. M.; Kosinski J. R.; Hubert J. A.; Szeto D.; Yao X.; Forrest G.; Marsh D. J. Butyrate and propionate protect against diet-induced obesity and regulate gut hormones via free fatty acid receptor 3-independent mechanisms. PLoS One 2012, 7, e35240 10.1371/journal.pone.0035240. [DOI] [PMC free article] [PubMed] [Google Scholar]
- Den Besten G.; Lange K.; Havinga R.; Van Dijk T. H.; Gerding A.; Van Eunen K.; Müller M.; Groen A. K.; Hooiveld G. J.; Bakker B. M.; Reijngoud D.-J. Gut-derived short-chain fatty acids are vividly assimilated into host carbohydrates and lipids. Am. J. Physiol.: Gastrointest. Liver Physiol. 2013, 305, G900–G910. 10.1152/ajpgi.00265.2013. [DOI] [PubMed] [Google Scholar]
- Ito H.; Takemura N.; Sonoyama K.; Kawagishi H.; Topping D. L.; Conlon M. A.; Morita T. Degree of polymerization of inulin-type fructans differentially affects number of lactic acid bacteria, intestinal immune functions, and immunoglobulin A secretion in the rat cecum. J. Agric. Food Chem. 2011, 59, 5771–5778. 10.1021/jf200859z. [DOI] [PubMed] [Google Scholar]
- Chambers E. S.; Byrne C. S.; Morrison D. J.; Murphy K. G.; Preston T.; Tedford C.; Garcia-Perez I.; Fountana S.; Serrano-Contreras J. I.; Holmes E.; Reynolds C. J.; Roberts J. F.; Boyton R. J.; Altmann D. M.; McDonald J. A. K.; Marchesi J. R.; Akbar A. N.; Riddell N. E.; Wallis G. A.; Frost G. S. Dietary supplementation with inulin-propionate ester or inulin improves insulin sensitivity in adults with overweight and obesity with distinct effects on the gut microbiota, plasma metabolome and systemic inflammatory responses: a randomised cross-over trial. Gut 2019, 68, 1430. 10.1136/gutjnl-2019-318424. [DOI] [PMC free article] [PubMed] [Google Scholar]
- Cummings J. H.; Pomare E. W.; Branch W. J.; Naylor C. P.; Macfarlane G. T. Short chain fatty acids in human large intestine, portal, hepatic and venous blood. Gut 1987, 28, 1221–1227. 10.1136/gut.28.10.1221. [DOI] [PMC free article] [PubMed] [Google Scholar]
- Lu Y.; Fan C.; Li P.; Lu Y.; Chang X.; Qi K. Short chain fatty acids prevent high-fat-diet-induced obesity in mice by regulating G protein-coupled receptors and gut microbiota. Sci. Rep. 2016, 6, 37589–37601. 10.1038/srep37589. [DOI] [PMC free article] [PubMed] [Google Scholar]; Million M.; Lagier J. C.; Yahav D.; Paul M. Gut bacterial microbiota and obesity. Clin Microbiol Infec 2013, 19, 305–313. 10.1111/1469-0691.12172. [DOI] [PubMed] [Google Scholar]
- Ang Z.; Ding J. L. GPR41 and GPR43 in obesity and inflammation–protective or causative?. Front. Immunol. 2016, 7, 28. 10.3389/fimmu.2016.00028. [DOI] [PMC free article] [PubMed] [Google Scholar]
- Mistry R. H.; Gu F.; Schols H. A.; Verkade H. J.; Tietge U. J. Effect of the prebiotic fiber inulin on cholesterol metabolism in wildtype mice. Sci. Rep. 2018, 8, 13238. 10.1038/s41598-018-31698-7. [DOI] [PMC free article] [PubMed] [Google Scholar]
- Han K.-H.; Yamamoto A.; Shimada K.-i.; Kikuchi H.; Fukushima M. Dietary fat content modulates the hypolipidemic effect of dietary inulin in rats. Mol. Nutr. Food Res. 2017, 61, 1600635. 10.1002/mnfr.201600635. [DOI] [PubMed] [Google Scholar]
- Nishina P. M.; Freedland R. A. Effects of propionate on lipid biosynthesis in isolated rat hepatocytes. J. Nutr. 1990, 120, 668–673. 10.1093/jn/120.7.668. [DOI] [PubMed] [Google Scholar]
- Lin Y.; Vonk R. J.; Slooff M. J. H.; Kuipers F.; Smit M. J. Differences in propionate-induced inhibition of cholesterol and triacylglycerol synthesis between human and rat hepatocytes in primary culture. Br. J. Nutr. 1995, 74, 197–207. 10.1079/bjn19950123. [DOI] [PubMed] [Google Scholar]
- Ma Y.; Gao M.; Liu D. Preventing high fat diet-induced obesity and improving insulin sensitivity through neuregulin 4 gene transfer. Sci. Rep. 2016, 6, 26242. 10.1038/srep26242. [DOI] [PMC free article] [PubMed] [Google Scholar]
- Wang G.-X.; Zhao X.-Y.; Meng Z.-X.; Kern M.; Dietrich A.; Chen Z.; Cozacov Z.; Zhou D.; Okunade A. L.; Su X.; Li S.; Blüher M.; Lin J. D. The brown fat-enriched secreted factor Nrg4 preserves metabolic homeostasis through attenuation of hepatic lipogenesis. Nat. Med. 2014, 20, 1436. 10.1038/nm.3713. [DOI] [PMC free article] [PubMed] [Google Scholar]
- Perry R. J.; Peng L.; Barry N. A.; Cline G. W.; Zhang D.; Cardone R. L.; Petersen K. F.; Kibbey R. G.; Goodman A. L.; Shulman G. I.; Shulman G. I. Acetate mediates a microbiome-brain-β-cell axis to promote metabolic syndrome. Nature 2016, 534, 213–217. 10.1038/nature18309. [DOI] [PMC free article] [PubMed] [Google Scholar]
- David L. A.; Maurice C. F.; Carmody R. N.; Gootenberg D. B.; Button J. E.; Wolfe B. E.; Ling A. V.; Devlin A. S.; Varma Y.; Fischbach M. A.; Biddinger S. B.; Dutton R. J.; Turnbaugh P. J. Diet rapidly and reproducibly alters the human gut microbiome. Nature 2014, 505, 559–563. 10.1038/nature12820. [DOI] [PMC free article] [PubMed] [Google Scholar]
- Turnbaugh P. J.; Ley R. E.; Mahowald M. A.; Magrini V.; Mardis E. R.; Gordon J. I. An obesity-associated gut microbiome with increased capacity for energy harvest. Nature 2006, 444, 1027–1031. 10.1038/nature05414. [DOI] [PubMed] [Google Scholar]
- Gerritsen J.; Smidt H.; Rijkers G. T.; de Vos W. M. Intestinal microbiota in human health and disease: the impact of probiotics. Genes Nutr. 2011, 6, 209–240. 10.1007/s12263-011-0229-7. [DOI] [PMC free article] [PubMed] [Google Scholar]
- Garcia-Mazcorro J. F.; Ivanov I.; Mills D. A.; Noratto G. Influence of whole-wheat consumption on fecal microbial community structure of obese diabetic mice. PeerJ 2016, 4, e1702 10.7717/peerj.1702. [DOI] [PMC free article] [PubMed] [Google Scholar]
- Zhang Q.; Yu H.; Xiao X.; Hu L.; Xin F.; Yu X. Inulin-type fructan improves diabetic phenotype and gut microbiota profiles in rats. PeerJ 2018, 6, e4446 10.7717/peerj.4446. [DOI] [PMC free article] [PubMed] [Google Scholar]
- Cani P. D.; Bibiloni R.; Knauf C.; Waget A.; Neyrinck A. M.; Delzenne N. M.; Burcelin R. Changes in gut microbiota control metabolic endotoxemia-induced inflammation in high-fat diet–induced obesity and diabetes in mice. Diabetes 2008, 57, 1470–1481. 10.2337/db07-1403. [DOI] [PubMed] [Google Scholar]
- Ussar S.; Griffin N. W.; Bezy O.; Fujisaka; Vienberg S.; Softic S.; Deng L.; Bry L.; Gordon J. I.; Kahn C. R. Interactions between Gut Microbiota, Host Genetics and Diet Modulate the Predisposition to Obesity and Metabolic Syndrome. Cell Metab. 2015, 22, 516–530. 10.1016/j.cmet.2015.07.007. [DOI] [PMC free article] [PubMed] [Google Scholar]
- Chen L.; Wilson J. E.; Koenigsknecht M. J.; Chou W.-C.; Montgomery S. A.; Truax A. D.; Brickey W. J.; Packey C. D.; Maharshak N.; Matsushima G. K.; Plevy S. E.; Young V. B.; Sartor R. B.; Ting J. P.-Y. Nlrp12 attenuates colon inflammation by maintaining colonic microbial diversity and promoting protective commensal bacterial growth. Nat. Immunol. 2017, 18, 541–551. 10.1038/ni.3690. [DOI] [PMC free article] [PubMed] [Google Scholar]
- Weitkunat K.; Schumann S.; Nickel D.; Kappo K. A.; Petzke K. J.; Kipp A. P.; Blaut M.; Klaus S. Importance of propionate for the repression of hepatic lipogenesis and improvement of insulin sensitivity in high-fat diet-induced obesity. Mol. Nutr. Food Res. 2016, 60, 2611–2621. 10.1002/mnfr.201600305. [DOI] [PMC free article] [PubMed] [Google Scholar]
- Zhang Q.; Sun X.; Xiao X.; Zheng J.; Li M.; Yu M.; Ping F.; Wang Z.; Qi C.; Wang T.; Wang X. Maternal chromium restriction leads to glucose metabolism imbalance in mice offspring through insulin signaling and Wnt signaling pathways. Int. J. Mol. Sci. 2016, 17, 1767–1780. 10.3390/ijms17101767. [DOI] [PMC free article] [PubMed] [Google Scholar]
- Albareda M.; Rodríguez-Espinosa J.; Murugo M.; de Leiva A.; Corcoy R. Assessment of insulin sensitivity and beta-cell function from measurements in the fasting state and during an oral glucose tolerance test. Diabetologia 2000, 43, 1507–1511. 10.1007/s001250051561. [DOI] [PubMed] [Google Scholar]
- Matsuda M.; DeFronzo R. A. Insulin sensitivity indices obtained from oral glucose tolerance testing: comparison with the euglycemic insulin clamp. Diabetes Care 1999, 22, 1462–1470. 10.2337/diacare.22.9.1462. [DOI] [PubMed] [Google Scholar]
- Heber D.; Zhang Y.; Yang J.; Ma J. E.; Henning S. M.; Li Z. Green tea, black tea, and oolong tea polyphenols reduce visceral fat and inflammation in mice fed high-fat, high-sucrose obesogenic diets. J. Nutr. 2014, 144, 1385–1393. 10.3945/jn.114.191007. [DOI] [PubMed] [Google Scholar]
- Mehlem A.; Hagberg C. E.; Muhl L.; Eriksson U.; Falkevall A. Imaging of neutral lipids by oil red o for analyzing the metabolic status in health and disease. Nat. Protoc. 2013, 8, 1149–1154. 10.1038/nprot.2013.055. [DOI] [PubMed] [Google Scholar]
- Sanchez W.; Burgeot T.; Porcher J.-M. A novel “Integrated Biomarker Response” calculation based on reference deviation concept. Environ. Sci. Pollut. Res. 2013, 20, 2721–2725. 10.1007/s11356-012-1359-1. [DOI] [PubMed] [Google Scholar]
- Beliaeff B.; Burgeot T. Integrated biomarker response: a useful tool for ecological risk assessment. Environ. Toxicol. Chem. 2002, 21, 1316–1322. 10.1002/etc.5620210629. [DOI] [PubMed] [Google Scholar]
- Van de Wouw M.; Boehme M.; Lyte J. M.; Wiley N.; Strain C.; O’Sullivan O.; Clarke G.; Stanton C.; Dinan T. G.; Cryan J. F. Short-chain fatty acids: microbial metabolites that alleviate stress-induced brain-gut axis alterations. J. Physiol. 2018, 596, 4923–4944. 10.1113/jp276431. [DOI] [PMC free article] [PubMed] [Google Scholar]
- Shang H.; Sun J.; Chen Y. Q. Clostridium butyricum CGMCC0313. 1 modulates lipid profile, insulin resistance and colon homeostasis in obese mice. PLoS One 2016, 11, e0154373 10.1371/journal.pone.0154373. [DOI] [PMC free article] [PubMed] [Google Scholar]
- Edgar R. C. Search and clustering orders of magnitude faster than BLAST. Bioinformatics 2010, 26, 2460–2461. 10.1093/bioinformatics/btq461. [DOI] [PubMed] [Google Scholar]
- Lozupone C.; Knight R. UniFrac: a new phylogenetic method for comparing microbial communities. Appl. Environ. Microbiol. 2005, 71, 8228–8235. 10.1128/aem.71.12.8228-8235.2005. [DOI] [PMC free article] [PubMed] [Google Scholar]
- Caporaso J. G.; Kuczynski J.; Stombaugh J.; Bittinger K.; Bushman F. D.; Costello E. K.; Fierer N.; Peña A. G.; Goodrich J. K.; Gordon J. I.; Huttley G. A.; Kelley S. T.; Knights D.; Koenig J. E.; Ley R. E.; Lozupone C. A.; McDonald D.; Muegge B. D.; Pirrung M.; Reeder J.; Sevinsky J. R.; Turnbaugh P. J.; Walters W. A.; Widmann J.; Yatsunenko T.; Zaneveld J.; Knight R. QIIME allows analysis of high-throughput community sequencing data. Nat. Methods 2010, 7, 335–336. 10.1038/nmeth.f.303. [DOI] [PMC free article] [PubMed] [Google Scholar]
- Langille M. G. I.; Zaneveld J.; Caporaso J. G.; McDonald D.; Knights D.; Reyes J. A.; Clemente J. C.; Burkepile D. E.; Vega Thurber R. L.; Knight R.; Beiko R. G.; Huttenhower C. Predictive functional profiling of microbial communities using 16S rRNA marker gene sequences. Nat. Biotechnol. 2013, 31, 814–821. 10.1038/nbt.2676. [DOI] [PMC free article] [PubMed] [Google Scholar]
Associated Data
This section collects any data citations, data availability statements, or supplementary materials included in this article.


