

SUMMARY
Most neurons are not replaced during an animal’s lifetime. This nondividing state is characterized by extreme longevity and age-dependent decline of key regulatory proteins. To study the lifespans of cells and proteins in adult tissues, we combined isotope labeling of mice with a hybrid imaging method (MIMS-EM). Using 15N mapping, we show that liver and pancreas are composed of cells with vastly different ages, many as old as the animal. Strikingly, we also found that a subset of fibroblasts and endothelial cells, both known for their replicative potential, are characterized by the absence of cell division during adulthood. In addition, we show that the primary cilia of beta cells and neurons contains different structural regions with vastly different lifespans. Based on these results, we propose that age mosaicism across multiple scales is a fundamental principle of adult tissue, cell, and protein complex organization.
Graphical Abstract
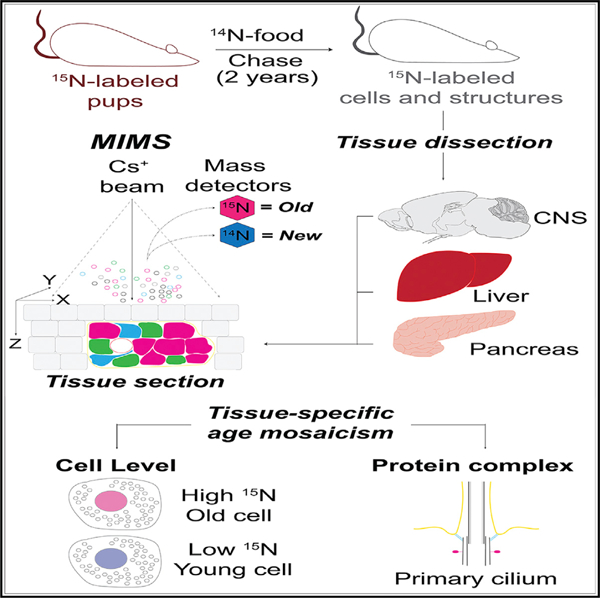
In Brief
Arrojo e Drigo et al. measure the age of cells and proteins using high-resolution isotope imaging and show that adult mouse organs are mosaics of cells of different ages. The liver, which has high turnover, contains cells as old as the animal, while cilia have differentially aged structural protein components.
INTRODUCTION
The lifespan of a terminally differentiated cell is quite variable among organs: 3 to 4 days for epithelial intestinal cells, to olfactory neuronal cells replaced from basal stem cells, to a life time for the majority of neurons, cardiomyocytes, and all inner hear hair cells (De Anda et al., 2016; Brann and Firestein, 2014; Foglia and Poss, 2016; Steinhauser et al., 2012; Zhang et al., 2012). In some cases, somatic stem cells can respond to tissue damage and proliferate according to tissue-specific needs, as in the striated muscle, which can somewhat regenerate after wound because of activation of its satellite stem cells (Blau et al., 2015). A similar pattern is also observed at the proteome level, where proteins have different lifespans, ranging from hours and days to years (Ori et al., 2015; Toyama et al., 2013). Like stressed and/or damaged cells, misfolded and damaged proteins must be degraded and replaced with new and functional versions (Taylor and Dillin, 2011). Over the last decades these insights steered biomedical research toward focusing on cellular and molecular replacement processes.
It remains poorly understood how neurons, cardiomyocytes, and potentially other long-lived cells (LLCs), maintain functional integrity and protein homeostasis over the span of several decades. Because these cells are almost never replaced, they are essentially as old as the animal itself and must function properly throughout life, which in humans can be more than a century (De Anda et al., 2016). Understanding how functionality is maintained in LLCs is important given that aging is associated with physiological impairments in these kinds of cells (e.g., neurons and cardiomyocytes) (D’Angelo et al., 2009; Mattson and Magnus, 2006).
Recent advances in whole-animal metabolic-labeling strategies and quantitative mass spectrometry (MS/MS) have enabled system-wide, high-resolution analyses of global protein turnover rates. However, imaging approaches for studying extreme cell longevity are not well developed. We recently combined stable isotope metabolic pulse-chase labeling of rats using 15N (herein called 15N-SILAM [stable isotope labeling in mammals]) with quantitative MS/MS to discover a class of long-lived proteins (LLPs) in neurons (Toyama et al., 2013). These neuronal LLPs localize primarily to the nuclear pore complex (NPC) and chromatin, and are maintained with no or limited turnover, in striking contrast to the majority of the proteome, which is renewed within hours or days (Ori et al., 2015; Schoenheimer, 1942). Only a few other LLPs have been previously identified, including lens crystalline, collagen, and myelin basic protein (Fischer and Morell, 1974; Lynnerup et al., 2008; Verzijlbergen et al., 2010). These proteins deteriorate with age and, with the exception of myelin, are unlikely to contribute to cellular aging because they typically reside in cells with minimal metabolic activity and/or play structural roles (Lynnerup et al., 2008). In contrast, the neuronal LLPs that we identified play critical roles in gene regulation and nuclear trafficking pathways and age-dependent loss of these LLPs impairs nuclear function (D’Angelo et al., 2009; Ibarra et al., 2016; Toyama et al., 2013).
LLCs face a constant lifelong demand for performance to maintain organ function and homeostasis and are constantly exposed to drivers of molecular and cellular damage. In fact, the accumulation of such damage over time may eventually alter gene expression and protein homeostasis pathways, leading to impaired cellular function and disease (D’Angelo et al., 2009; Ibarra et al., 2016). Understanding these mechanisms requires the identity and distribution pattern of LLCs in different organs. However, lifelong cell persistence has not been analyzed in a systematic and quantitative manner, and therefore fundamental questions about cell type-specific turnover rates remains poorly characterized. In addition, while implementation of 15N-SILAM together with quantitative MS/MS allowed us to identify LLPs (Toyama et al., 2013), this approach lacks spatial information (other than the region of tissue that was dissected) and does not provide any information regarding cell identities. To overcome this challenge, we made use of 15N-SILAM-labeled animals initially labeled for MS/MS to develop a new imaging pipeline for correlated scanning electron microscopy (SEM) and multi-isotope imaging mass spectroscopy (MIMS) (herein called MIMS-electron microscopy [EM]). MIMS is a mapping technique compatible with electron microscopy that can determine the relative amount of different stable isotopes incorporated into nucleic acids and proteins in cells and tissues (Lechene et al., 2006; Steinhauser et al., 2012; Zhang et al., 2012). Given the high spatial resolution and sensitivity of EM and MIMS, we used MIMS-EM to visualize and quantify cell and protein turnover in the brain, liver, and pancreas in young and old 15N-SILAM mice and rats.
Using MIMS-EM on tissue samples from exceptionally long-lived mice initially labeled for stable isotope mass spectrometry experiments (Toyama et al., 2013), we found that neurons and cardiomyocytes are not the only cell types with exceptional longevity. Much to our surprise, adult mouse liver and pancreas contain populations of cells with vastly different lifespans, many of which are as old as neurons. The pancreas serves a paradigm for the observed cellular age mosaicism, in that a subset of insulin-beta cells are as old as cortical neurons, while others have been replaced through cell division during adulthood. In the liver, contrary to what has been inferred from liver regeneration models, we discovered that most hepatocytes, bile duct cells, and stellate-like cells (i.e., hepatic stellate cells and Kupffer cells) are LLCs. Age mosaicism can also be observed among capillary endothelial cells, which exhibit vastly different lifespans in different tissue such as the brain, pancreas, and liver. Furthermore, age mosaicism also occurs at the molecular level, where proteins with vastly different lifespans coexist at the supramolecular level in the basal body and axoneme of the primary cilium of neurons and beta cells.
RESULTS AND DISCUSSION
Identification of LLCs and Structures in the Central Nervous System (CNS) with MIMS-EM
Information about the lifespan of different cells is still lacking for many adult tissues, largely because of technical limitations. To determine which and whether cells divide or persist in a nondividing state throughout life we combined 15N metabolic labeling of mice with MIMS-EM (Steinhauser et al., 2012). In brief, we used animals initially intended for protein MS/MS as in our previous studies (Toyama et al., 2013). As such, molecular components of these animals (i.e., nucleic and amino acids) were labeled with 15N throughout their embryonic development and fed an 15N-rich diet until the 21st or 45th day of post-natal development (see details in STAR Methods). We refer to these mice as P21- or P45-15N-SILAM mice, respectively. After the 15N-labeling period, 15N-animals were chased with a normal diet with the natural 99.4% content of 14N for 6, 18, or 26 months of age. During the chase period, when 15N-labeled cells are replaced by newly synthesized cells, 15N is replaced by 14N. Therefore, the rate of cell (and protein turnover) can be quantified with MIMS by simultaneously imaging 15N and 14N in a target region and determining the 15N/14N ratio (i.e., old-to-young ratio). Importantly, our previous work has shown that the relative amount of nuclear 15N-labeled protein represents less than 2% of the whole nuclear proteome after 12 months of chase (Toyama et al., 2013). Therefore, the vast majority of the nuclear 15N is expected to stem from 15N-DNA and which decreases by 50% after each cell division, as expected (Steinhauser et al., 2012).
Since our SILAM approach cannot distinguish between 15N-DNA and rare 15N-proteins in the nucleus, we used MIMS-EM to quantitatively determine the 15N content of random sections of neuronal nuclei in different regions of the CNS. This allowed us to establish a mean baseline and range of the nuclear 15N signal that is characteristic for nondividing cells (De Anda et al., 2016; D’Angelo et al., 2009). We targeted neurons in the mouse layer-2 (L2) in the motor cortex and in the rat cerebellum from animals labeled with 15N until P45 and chased for 6 months. MIMS-EM of the mouse L2 cortex showed that most of the 15N signal was nuclear or overlapping with myelin sheaths, as expected (Figure S1C) (Toyama et al., 2013). We measured whole nuclei 15N/14N ratios and found that they were markedly higher than the natural occurrence (15N/14N = 37 × 104) because of a significant retention of 15N in all neuronal nuclei mapped (Figures 1A–1I and S1A–S1C). Since we observed species-specific differences (Figure S1E), we therefore decided to focus the rest of our analysis on mouse tissues.
Figure 1. MIMS-EM of LLCs and Structures in the CNS.
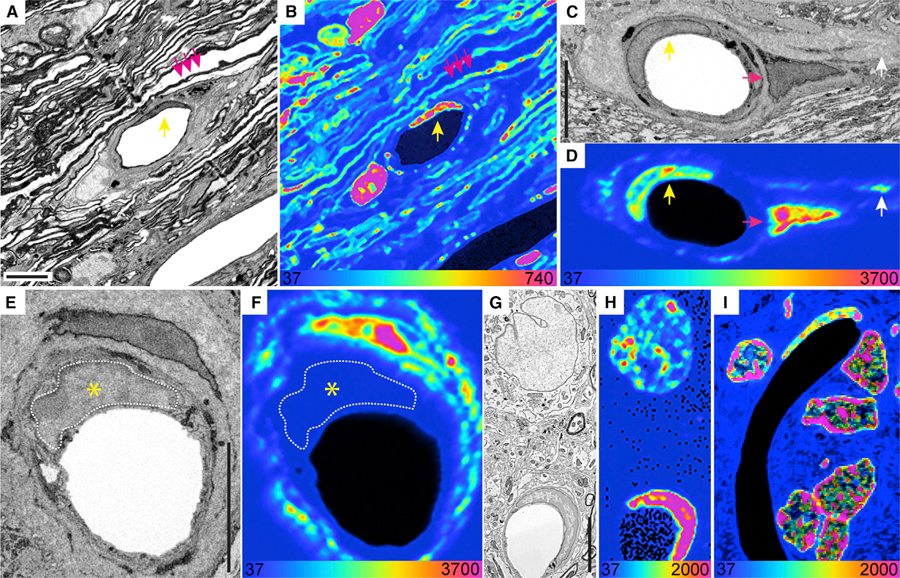
(A and B) SEM (A) and MIMS (B) of two capillaries in the optic nerve head (ONH) of a 6-month chase mouse. An endothelial cell nucleus (yellow arrow) and myelin sheaths (pink arrows) are indicated. A pericyte nucleus is visible to the left the capillary lumen.
(C and D) SEM (C) and MIMS (D) of a capillary in the ONH. An old endothelial cell nucleus (yellow arrow), a fibroblast (pink arrow) and 15N-rich extracellular matrix (ECM) (white arrow) are indicated.
(E and F) SEM (E) and MIMS (F) of a capillary in the ONH, with an old fibroblast (top) and a young endothelial cell (nucleus delineated in white and indicated by the yellow asterisk).
(G and H) SEM (G) and MIMS (H) of an L2 neuron (top) and an endothelial cell.
(I) Close-up of granular cells in the rat cerebellum with an old endothelial cell visible. Full mosaic is shown in Figure S1B.
Scale bars: 5 μm (A, C, E, and G) (SEM). At the bottom of the MIMS images, the heatmap shows the 15N/14N × 104 and scaled with a hue saturation intensity (HSI).
It is well established that cortical neurons do not divide during adulthood, thus we decided to use the mean 15N/14N ratio from random nuclear sections of L2 neurons as baseline level for the identification of nondividing cells. We observed that the mean 15N/14N in the L2 neuron population analyzed varied between 5- and 19-fold higher than the natural ratio (Figure S3D). This variation is likely explained by the random occurrence of dense heterochromatin patches in the nuclear sections imaged with MIMS-EM, whereby sections with a higher density of heterochromatin in a given section are expected to yield higher 15N signals due to a relatively higher concentration of 15N-DNA in comparison with euchromatin-rich sections. In fact, we observed a maximum level of 15N labeling in intranuclear regions that correlate with dense patches of heterochromatin, which may also contain rare 15N-proteins in addition to 15N-DNA (Figures 1G, 1H, S1A, S1D, and S1E).
Accordingly, we decided to classify cells as ‘‘old’’ when their nuclear mean 15N/14N ratio was similar to L2 neurons, namely 15N/14N ratios at least 5.5-fold over the natural ratio (i.e., 15N/14N > 208, Figure S1F). Importantly, the relative age of non-neuronal cells in nervous and somatic organs was determined by comparing their 15N/14N with that of L2 neurons from P45- or P21-SILAM (e.g., cells from P45-SILAM animals were benchmarked against P45-SILAM L2 neurons). Of note, while this classification approach can determine the relative longevity of ‘‘old’’ cells after 6, 18, or 26 months of chase, it cannot determine their proliferative potential during the pulse period or how many times a cell has divided during the chase period (see below, Limitations of Study). Nevertheless, we found that cells in the inner nuclear layer of the retina; and most endothelial cells in the mouse optic nerve head (ONH) and all in the cerebellum were LLCs and as old as neurons, and did not show any sign of turnover (Figures 1A–1F and S1A–S1D). In fact, we observed retention of 15N in endothelial cells located in the L2 cortical layer of a P21-15N-SILAM mouse chased for almost 26 months (Figures 1G and 1H). In addition, the nuclear 15N/14N ratio in perivascular fibroblasts and an oligodendrocyte was >20-fold higher than the natural 15N/14N ratio, similar to neurons (Figures 1A–1F and 4D). These data suggest that lifelong cell persistence extends to non-neuronal cells, is more prominent than previously thought and also confirms a recent report regarding oligodendrocyte longevity (Tripathi et al., 2017). In contrast, we found one example of a capillary endothelial cell in the ONH that had close-to-background 15N levels (Figures 1E and 1F), which indicates that turnover of endothelial cells in the brain can happen, although it may be a rare event. Together, these data from these exceptionally long-lived SILAM mice provides the first evidence that the neurovascular unit, and, more specifically, endothelial cells in the brain, are mostly old. However, it also suggests that some vessels are mosaics, built of cells with vastly different lifespans (Figures 1A–1F). We conclude that MIMS-EM is a powerful tool to study cellular lifespan and we decided to explore the concept of age mosaicism in other tissues (see below).
Figure 4. Longevity of Primary Cilia in LLCs.
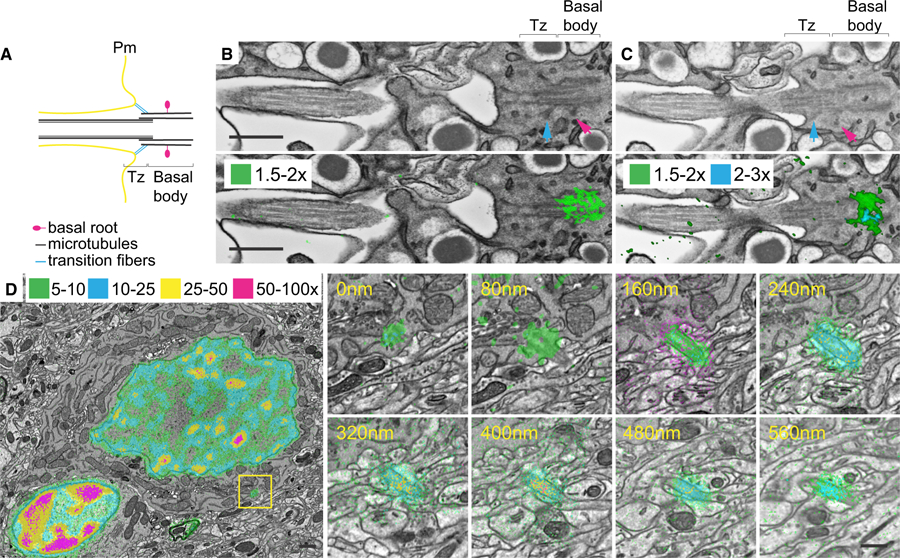
(A) Cartoon of a primary cilium Bb. Microtubules (black), transition fibers (cyan), basal root (pink), transition zone (Tz), axoneme, and plasma membrane (Pm) are shown.
(B and C) Two different sections of a beta cell primary cilium from a P21-15N-SILAM mouse chased for 26 months and imaged with MIMS-EM. Top rows: SEM micrographs with visible transition zone, Bb, transition fibers (cyan arrows), and basal root (pink arrows). Bottom rows: overlay of SEM micrographs and 15N/14N thresholds: 1.5×–2× (green) and 2×–3× (cyan) the natural 15N/14N of 37 × 104.
(D) SEM micrograph overlaid with thresholded 15N/14N of an L2 neuron from a P45-15N-SILAM mouse chased for 6 months. The yellow box indicates the Bb. On the right are serial sections of the neuron Bb and primary cilium. 15N/14N thresholds: 5×–10× (green), 10×–25× (cyan), 25×–50× (yellow), and 50×–100× (magenta) the natural 15N/14N. At the bottom of the MIMS images, the heatmap shows the 15N/14N × 104 and scaled with a HSI.
Scale bars: 300 nm (B), 1 μm (D), 500 nm (D, inset).
Cellular Age Mosaicism in the Liver
Several studies in the context of tissue injury have led to the well-established concept that the liver has a high regenerative capacity (Malato et al., 2011). In line with this concept, our previous 15N-SILAM MS/MS experiments in rats did not identify 15N-labeled peptides in the liver after only a 4-month chase, which further suggested that these cells are replaced within months (Toyama et al., 2013). However, little is known about the longevity of hepatocytes and other key liver cell types in healthy adult mice (Magami et al., 2002; Malato et al., 2011). We applied MIMS-EM to map cells located near bile ducts, portal or central veins, and sinusoid capillaries (Figures 2A and 2B), and found that most hepatocytes in P45-15N-SILAM mice were as old as neurons. Long-lived hepatocytes were observed in the vicinity of central veins, portal veins, and capillary sinusoids after 6 and 18 months of chase (92% and 95%, respectively) (Figures 2A, 2B, and S2A–S2D). Similarly, MIMS-EM revealed that most cholangiocytes were old as neurons and, therefore, are also LLCs (red arrows in Figures 2A, 2B, 2D, 2F, and S2A–S2D). In contrast, while endothelial cells in portal and central veins did not divide (Figures 2A–2C, white arrows; Figures S2A–S2D), most sinusoid capillary endothelial cells contained 15N levels at the 18-month time point that were lower than at the 6-month time point (Figures 2A, 2B, and 2E, white arrows; Figures S2A–S2D). A similar phenotype was observed in stellate-like cells (Figures 2A, 2B, and 2F, green arrows; Figures S2A–S2D). These results indicate that, while hepatocytes remain largely quiescent throughout life, endothelial cells in hepatic sinusoids and most stellate-like cells undergo a major turnover event between 6 and 18 months of life. Lastly, the exceptional longevity of liver cells was associated with old extracellular matrix elements located to the perivascular space of portal and central veins and interstitial space (Figures 2A–2D and S2B). These data suggest that the aging liver has a tissue architecture characterized by an intercellular age mosaicism, where a young sinusoid vasculature would support the function of relatively older cells, a notion that is further supported by hepatocyte lineage tracing studies that estimate that hepatocytes could indeed last for at least 1 year (Magami et al., 2002; Malato et al., 2011).
Figure 2. LLCs in the Liver.
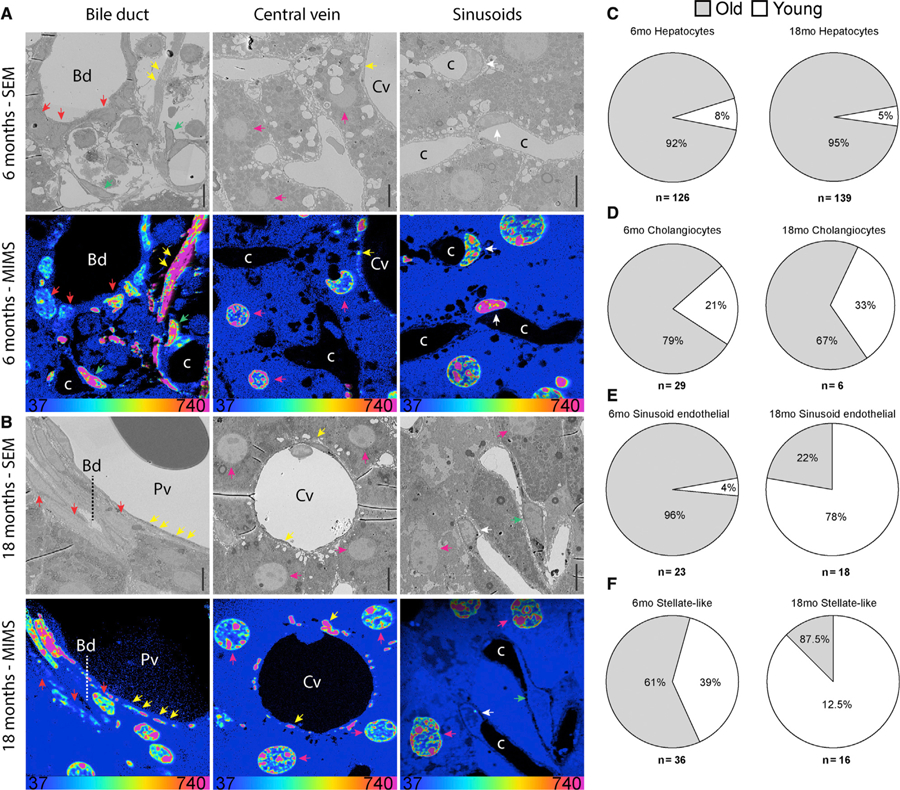
(A and B) SEM and MIMS of cells near bile ducts, central veins or capillary sinusoids from a 15N-SILAM P45 mouse chased for 6 months (A) or 18 months (B). ECM (yellow arrowheads), hepatocytes (pink arrowheads), cholangiocytes (red arrowheads), stellate-like (green arrowheads), and endothelial cells (white arrowheads) are indicated. Cv, central vein; Bd, bile duct; c, capillary.
(C–F) Relative turnover of liver hepatocytes (C), cholangiocytes (D), sinusoid endothelial cells (E), and hepatic stellate-like cells (HSCs) (F) after a 6- or 18-month (mo) chase. The total number of cells analyzed for each cell type is indicated underneath each pie chart. At the bottom of the MIMS images, the heatmap shows the 15N/14N × 104 and scaled with a HSI. Scale bar, 10 μm.
Adult Pancreas is Composed of Cells with Vastly Different Lifespans
Having identified blood vessels containing endothelial cells with different ages, we asked whether age mosaicism is a more general principle and turned our attention to the pancreas, which contains exocrine and endocrine cells. Development and maturation of pancreatic endocrine and exocrine cells extends to the early postnatal period when cells are mostly generated by self-duplication (Dor et al., 2004; Houbracken and Bouwens, 2017). Here, we used MIMS-EM to determine the longevity and turnover of the endocrine and exocrine pancreas in adult animals labeled until two different time points in early life (post-natal day 21 [P21] or P45, shown in Figures 3A and 3B) and chased for almost 2 years. First, we analyzed islets from a P21-15N-SILAM mouse chased with 14N for 26 months and observed that the turnover rate of alpha, beta, and delta cells is not uniform. As expected, we observed a large number of alpha and beta cells exhibiting background 15N (representing 77% and 76%, respectively) (Figures 3F and S3D), likely reflecting the wave of alpha and beta cell proliferation that takes place in neonates and is important for beta cell maturation (Stolovich-Rain et al., 2015). Strikingly, almost a quarter of alpha and beta cells (representing 23% and 24%, respectively) and all delta cells had 15N levels similar to neurons (Figure 3F), and therefore suggest that a subpopulation of islet endocrine cells can become LLCs before or at the weaning stage and may not proliferate for an entire lifetime.
Figure 3. LLCs in the Pancreas.
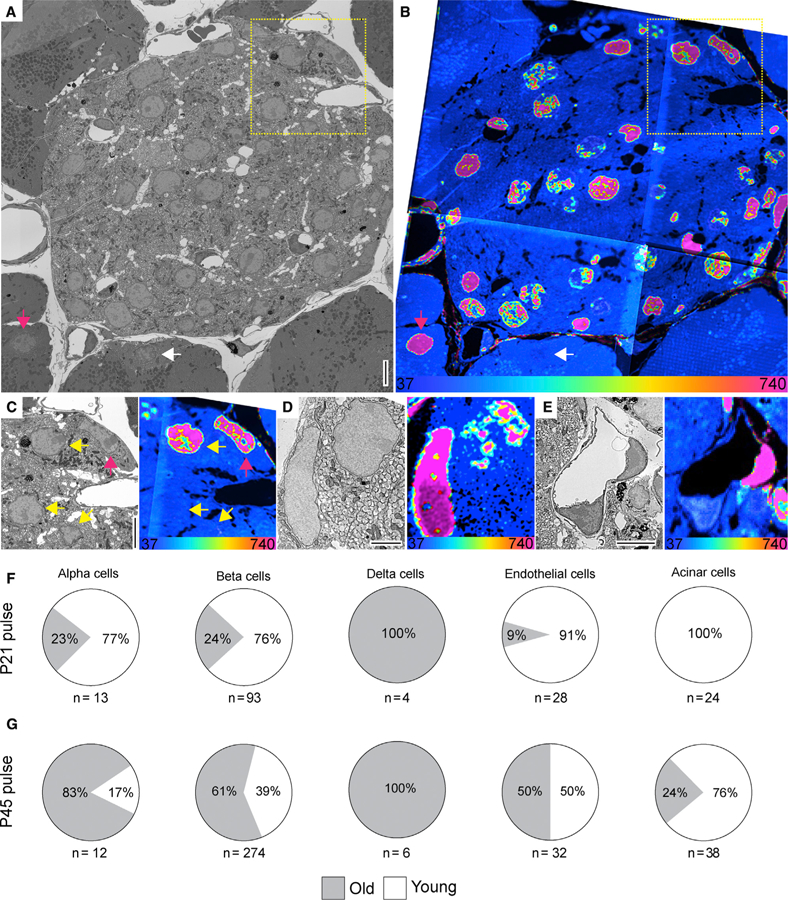
(A and B) SEM (A) and MIMS (B) of a cross-section of the islets of Langerhans. Old and young acinar cells are indicated by pink and white arrow, respectively. Yellow dotted box highlights cells shown in (C).
(C) Enlarged view of boxed region in (A) and (B). SEM and MIMS of beta cells (yellow arrows) and an old alpha cell (pink arrow).
(D) An old delta cell (left) next to a younger beta cell (top right).
(E) SEM and MIMS of a young (bottom) and an old (top right) endothelial cell. Old pancreatic stellate cells are seen in the top and lower right corners.
(F) Relative turnover in percentages of cells that are as old (gray) or younger (white) than L2 neurons from 15N-SILAM P21 mouse chased for 26 months.
(G) Same as in (F), but from a 15N-SILAM P45 mouse chased for 18 months. The total number of cells analyzed for each cell type is listed underneath each pie chart. At the bottom of the MIMS images, the heatmap shows the 15N/14N × 104 and scaled with an HSI.
Scale bars: 5 μm (A, C, and E) and 2.5 μm (D).
Next, we analyzed islets from a P45-15N-SILAM mouse chased for 18 months and observed that most beta cells (61%) had 15N levels approximately 10-fold higher than the natural ratio, similar to L2 neurons after 18 months of chase (Figure S3D), while 39% of beta cells had lower 15N levels and therefore had proliferated during adulthood (Figures 3B–3G and S3D). Recent data indicate that different types of beta cells exist in the islet, including proliferation-prone and/or immature beta cells located in a neogenic niche at the islet periphery (Bader et al., 2016; van der Meulen et al., 2017). We mapped the location of proliferative beta cells in relation to the islet periphery and found no correlation between beta cell age and intraislet cellular location (Figure S3E), thus suggesting that beta cell proliferation is random within the islet ultrastructure. Similar results were observed for alpha cells, pancreatic endothelial cells, and stellate cells, which were also found to be mostly LLCs (Figures 3B–3G and S3D–S3F). In striking contrast, all delta cells and the majority of ductal cells did not show age mosaicism, and their 15N levels were similar to neurons (Figures 3A–3G and S3B–S3D). In contrast, most acinar cells we observed had close to or background 15N levels and thus have clearly undergone significant turnover during adulthood (Figures 3A and 3B, white arrow; Figure S3D), as expected (Houbracken and Bouwens, 2017). Notably, the observation of long-lived acinar cells suggests that some acinar cells become long-lived in early adult life (Figure 3G, pink arrow), which could have a role in pancreatic cancer (Pan et al., 2013; Westphalen et al., 2016; Wollny et al., 2016).
Together, these data indicate that the islet is a mosaic composed of cells with vastly different lifespans, where most alpha and beta cells assume a quiescent and LLC phenotype between weaning (P21) and the first month (P45) of adult life. Moreover, it suggests that proliferation of alpha and beta cells is not uniform throughout adulthood, contrary to what earlier studies have indicated (Brennand et al., 2007; Dor et al., 2004). While the specific differences between young and old beta or alpha cells remains to be understood, our data adds to recent studies that have begun to investigate the cellular identity, the heterogeneity and aging of beta cell subpopulations and its potential role in age-associated type II diabetes onset (Aguayo-Mazzucato et al., 2017; Almaça et al., 2014; Basu et al., 2003; Johnston et al., 2016; van der Meulen et al., 2017; Segerstolpe et al., 2016).
Visualization of LLP Assemblies In Vivo
Our previous SILAM MS/MS experiments revealed that LLCs do contain a subset of proteins that persist throughout life. Specifically, we found that scaffold NPC proteins are maintained in the nuclear envelope throughout adulthood in neurons (Savas et al., 2012; Toyama et al., 2013). However, it was unclear whether this exceptional longevity extended to other subcellular components. While studying long-lived beta cells, we observed the retention of significant 15N signal by a small, ‘‘star-shaped’’ structure within the cytoplasm of a beta cell from a P45-15N-SILAM mouse (data not shown). We hypothesized that this signal was associated with the basal body (Bb) of the cell’s primary cilium (Figure 4A), which is a signaling organelle important for beta-cell function (Gerdes et al., 2014). We tested this hypothesis by imaging different beta-cell BBs from P21- and P45-15N-SILAM mice chased for 18 and 26 months, respectively. We applied MIMS-EM to serial cross-sections of different primary cilia within beta cells and discovered that, indeed, the Bb contained high 15N levels, while the rest of the cilium has been replaced by new components (Figures 4B, 4C, S4C, and S4D). We expanded this analysis to L2 neurons, where we observed that the 15N signal was not limited to the Bb and was also found in the axoneme, decreasing as the cilium projected toward the extracellular space (Figure 4D). These findings provide evidence of the occurrence of protein age mosaicism within one subcellular structure, while suggesting that long-lived structures are present in the primary cilium and that their turnover could be different in beta cells and neurons (Figures 4B–4D). While the identity of these long-lived components remains to be discovered, it is noteworthy that long-lived nucleoporins, including Nup93, are known to form a permeability barrier in the ciliary gate in the cilium transition zone (McClure-Begley and Klymkowsky, 2017). These exciting findings raise the question of whether aging is associated with impaired primary cilium function due to loss of LLPs, as seen for NPCs in old neurons (D’Angelo et al., 2009).
Analogous to genetic mosaicism, which refers to the presence of two or more populations of cells with different genotypes in one individual, we propose the concept of age mosaicism as a key feature of adult tissue organization. Our data indicate that non-uniform turnover of cells and proteins gives rise to tissue- and cell-specific aging architectures characterized by a mosaic organization of young and old elements at the cell and protein level. These data provide insight into an organization pattern in biology that forms an age mosaic across the mesoscale, where the close relationship of young and old components is found in protein super complexes and organelles (i.e., Bb in the primary cilium), to cells (e.g., beta cells and hepatocytes) and tissues (e.g., brain, liver, and pancreas). This study raises the exciting possibility that the age-dependent decline in LLPs is not limited to neurons, but may be a widespread phenomenon for all tissues rich in LLCs and links the loss of LLPs with the onset of age-related disease such as diabetes (Basu et al., 2003). More broadly, future SILAM studies will contain the use of different stable isotope-labeled molecules (i.e., 15N-thymidine for DNA and 18O-Leucine for proteins) to help identify and functionally characterize other examples of heterogeneity in the aging of cells and proteins in different organs and in health and disease.
Limitations of Study
Our pulse-chase labeling approach using 15N-enriched food can provide information about protein identity using MS/MS analyses (Toyama et al., 2013). However, our experimental set up using MIMS-EM cannot distinguish between 15N-labeled nucleic acids and amino acids in the regions we investigated. Although most of the 15N signal shown in brain, liver, and pancreatic cells is most likely due to 15N-DNA, we cannot rule out a potential small contribution of 15N-peptides from intranuclear LLPs (Toyama et al., 2013). However, regardless of the nature of the 15N signal our results suggest that these cells are long-lived. Second, in its current stage, MIMS-EM is not a high-throughput imaging technique as it is time and labor intensive, requiring cells and tissues to be cut in thin sections (50–250 nm in thickness) and long acquisition times (e.g., 0.5–48 h for a 30 × 30-μm raster), thus making volumetric imaging of any number of cells very challenging. As a result, this study was limited by the acquisition of random nuclear sections, which can add variability to the 15N measurements by the random distribution of heterochromatin-rich domains in the sections analyzed. Nevertheless, we have imaged >700 cells in total with MIMS-EM to provide an important insight into the location and identity of LLCs outside the brain. MIMS-EM is a very sensitive and quantitative technique with multiplexed detection capabilities, and therefore future applications of MIMS-EM will take advantage of a SILAM approach that labels nucleic acids, amino acids, and fatty acids with different stable isotopes (15N, 18O, and 13C, for example). Together with improved tools for cell/tissue mapping and data acquisition pipelines, MIMS-EM can be used to investigate a large number of cells and intracellular components from cells in virtually any SILAM tissue, including humans (Steinhauser et al., 2012).
STAR★METHODS
CONTACT FOR REAGENT AND RESOURCE SHARING
For additional information and requests for regents and resources, please contact the Lead Contact, Martin W. Hetzer (hetzer@salk.edu).
EXPERIMENTAL MODEL AND SUBJECT DETAILS
Animal Studies
All mice used in this study were of the FVB/NJ strain (Stock No: 001800) and were acquired from the Jackson Laboratory (Maine, USA). All animal experimentation was approved by the University of California San Diego IACUC (protocol number S03172M).
METHOD DETAILS
Stable Isotope Metabolic Labeling of Mammals (SILAM)
Four FVB females were fed 15N-based spirulina chow (Cambridge isotope Laboratories, Inc.) starting at P45 for 10 weeks prior to introducing a male for 1 week. The females were kept on 15N chow diet during mating, gestation, and lactation. The Pups were weaned at P21. 15N-labeled pups were either kept on 15N chow up to P45 or weaned to 14N food after P21 (and then at P45). The pups were then euthanized, perfused with fixative as previously described (Sosinsky et al., 2005) at different time points representing 6, 18 or 26-months after the start of the 14N chase. Briefly, mice were transcardially perfused with 2.5% glutaraldehyde / 2% PFA in 0.15M sodium cacodylate containing 2mM calcium chloride and the brain, liver and pancreas were dissected and prepared for X-ray microscopy (XRM) and electron microscopy.
Processing of Samples for Electron Microscopy
After dissection, the tissue was cut into approximately 1mm3 pieces and then postfixed in the same fixative at 4°C overnight. The specimens were washed with cacodylate buffer and then fixed in 2% osmium tetroxide / 1.5% potassium ferrocyanide in cacodylate for 1 hour at room temp. Specimens were thoroughly washed with water and then placed in 0.5% thiocarbohydrazide for 30 minutes and washed with water. The specimens were placed in 2% aq. osmium tetroxide for 1 hour and washed. The specimens were then placed in 2% aq. uranyl acetate at 4°C overnight. The specimens were washed with water and then placed into Walton’s lead aspartate solution for 30 min at 60°C. The specimens were washed with water and then dehydrated on ice with 70% EtOH, 90% EtOH, 100% EtOH, 100% EtOH, and dry acetone (10 minutes each step). The specimens were placed into 1:3, 1:1, and 3:1 solutions of Durcupan ACM:acetone for 12 hours each. The specimens were placed into 3 changes of 100% Durcupan ACM for 1 day each and then placed into 60°C oven for 48 hours.
X-Ray Microscopy (XRM)
Identification and mapping of the 3D coordinates of islets in the exocrine pancreas was achieved by scanning epoxy-embedded pancreas blocks with X-ray microscopy (XRM, X-radia, Zeiss). Specimens were scanned with a Zeiss Versa 510 with the source set at 60 kV and 5W power using a 4X power objective (final pixel size ~ 2 microns depending on final geometric magnification). The specimens were rotated 360 degrees and 3201 projection images were collected. We were able to identify islets in situ due to their x-ray contrast differences with the surrounding tissue (Figure S2A, inset A′ and Video S1). This allowed us to visualize and reconstruct large volumes of the mouse pancreas block in 3D and estimate the volume of islets in situ (Figures S1A and S1B). Next, based on the resulting microCT scan, we used a Leica ultramicrotome to trim the specimen block down to the targeted islet and 250-nm-thick sections were collected on silicon wafers for MIMS imaging.
Correlative Electron Microscopy and Multi-isotope Mass Spectroscopy (MIMS)
The MIMS technique is capable of measuring spatially localized concentrations of isotopes in the sample and hence, providing accurate chemical maps (Lechene et al., 2006; Steinhauser et al., 2012; Zhang et al., 2012). However, the XY spatial resolution in the MIMS is limited to about ~50 nm (Herrmann et al., 2007), in comparison the achievable resolution in the SEM is typically about a nm or less (Goldstein et al., 2003). To obtain 2D or 3D chemical information from our samples, single or serial sections of 50–250nm were cut and arranged on a Si wafer. Large field of view SEM micrographs of 80–250nm-thick sections of brain, liver and pancreas were acquired using a GeminiSEM (Zeiss, Germany) guided by automated tile acquisition using AtlasAT software (Fibics, Ottawa, Canada) and a pixel size of 4nm. Endogenous islets were imaged with XRM to acquire their 3D coordinates prior to guide islet sectioning using an ultra-microtome and prepared for SEM-AtlasAT mapping. MIMS image acquisition of mapped areas of interest and organelles was done as previously described (Steinhauser et al., 2012; Zhang et al., 2012). Briefly, brain, liver and pancreas tissue sections containing different mapped cells and organelles of interest were imaged with a NanoSIMS 50L (Cameca, France) using a cesium (Cs−) beam and 15N and 14N levels were detected simultaneously.
MIMS-EM Image Analysis and Display
The chemical maps (i.e. 15N/14N ratiometric images) obtained by the Cameca NanoSIMS were overlaid on the SEM image of the same section, after alignment and post-processing. Therefore, in the overlay image, the chemical sensitivity of the MIMS image and the spatial resolution of the SEM image are both preserved. These post-processing steps used to create the overlay image are explained below. The SEM images of the serial sections were aligned using the affine transformations of the StackReg plug in of ImageJ (Thévenaz et al., 1998) or using a python-based alignment tool developed in house (NCMIR) to compensate for any image distortions due to sectioning. The MIMS images were resized to match the pixel size of the SEM image. Since the NanoSIMS is a destructive imaging technique, and it tends to have preferential sputtering rates depending on the atomic species being sputtered (Lechene et al., 2006; Steinhauser et al., 2012; Zhang et al., 2012), the images were considerably distorted with respect to the SEM images. Just using an affine transformation was not sufficient to get a good correlation between the MIMS and the SEM image, and images had to be adjusted for warping. The typical distortion map of the MIMS image when aligned to the SEM image is shown in Figures S4A and S4B. All the linear and warp transformations of the MIMS image with respect to the SEM image was performed using Photoshop CS2015 (Adobe, USA), and the transformations were recorded. The recorded transformations were then applied to the chemical map of interest, which in our case is the 15N/14N ratio map. The ratio maps were computed using the openMIMS plug in in ImageJ. The aligned 15N/14N ratio map was then thresholded to split it into 4 images, representing signal levels from low to high. A histogram stretching algorithm was applied to all the 4 images, so that signal was spread from 20000 to 63353 (maximum value of 16-bit images). The 4 images were color coded to green, cyan, yellow and magenta; with green being the lowest signal and magenta being the highest signal. To overlay the color coded 15N/14N ratio map on the SEM image, a transparency factor was added to the color, so that it did not obscure the gray scale information. An ImageJ plug in ‘Multi Color EM’ was developed for this purpose, and details of the algorithm used are available (Adams et al., 2016). This plug in is available online (https://github.com/CRBS/multicolor_em/releases).
QUANTIFICATION AND STATISTICAL ANALYSIS
Quantification of 15N/14N Ratio in Tissues and Cell Age Classification
Quantification of MIMS 15N, 14N and 15N/14N ratio data was done with the Fiji plug in OpenMIMS (available at https://github.com/BWHCNI/OpenMIMS/) (Steinhauser et al., 2012; Zhang et al., 2012). Briefly, we quantified the intensity of 15N and 14N in each pixel inside the nucleus of individual cells in the brain, liver and pancreas. Next, we determined the 15N/14N ratio for each pixel and generated the ratiometric images shown in the paper. To determine the relative age of cells in the brain, liver and pancreas, we used the average nuclear 15N/14N of L2 cortical neurons from old animals (e.g., 18- or 26-months of chase) from which the target tissue was dissected. This L2 15N/14N was therefore used as a ‘‘15N/14N standard value’’ that would be expected for non-dividing LLCs (Figures S1–S3, n=60 for P45–18mo chase and n=44 for P21–26mo chase). Next, and based on the fact that cells lose ~50% of nuclear 15N after each cell division (Steinhauser et al., 2012), we determined that young cells (i.e. younger than L2 neurons) would have an average nuclear 15N/14N value that was lower than the respective L2 15N/14N mean value ± standard deviation of the data (S.D.). Similarly, old cells (i.e. as old as neurons) would have a 15N/14N mean value that was at least equal or higher than the respective L2 15N/14N mean value ± S.D. The number (n) of each cell type quantified in liver and pancreas can be found under the pie charts in Figure 2 and Figure 3, respectively.
Cell Type Classification in Electron Micrographs
Cells were classified according the following anatomical hallmarks: in the CNS, neurons were identified as cells that had synaptic connection to the cell body and relatively electron ‘‘light’’ chromatin; glial cells were identified as cells with electron dense heterochromatin patches and next to neurons (see Figure 4); endothelial cells were identified by their often thin and elongated nuclei and presence of a capillary lumen. In the liver, hepatocytes were identified by their relatively large nuclei (sometimes cells were bi-nucleated) and the presence of electron-dense granular structures in the cytosol that correspond to glycogen stores, hepatic endothelial cells were found lining the sinusoid capillary (these were often found to be perforated), central or portal vein lumen. Stellate-like cells were identified by their elongated and fibroblast-like morphology and their cytosol usually contained lipofuscin bodies and the cells were in the tissue interstitium or near vessels. In the pancreas, beta cells were identified by the morphology of the insulin granules with condensed electron-dense crystals surrounded by a large halo; alpha cells were identified by the morphology of the glucagon granules with dark and electron-dense crystals surrounded by a small halo, delta cells by the morphology of the somatostatin granules with electron-light lumen and no halo, endothelial cells were lining the capillary lumen and were fenestrated. Pancreatic stellate cells were classified using the same parameters as hepatic ‘‘stellate-like’’ cells. Acinar cells were identified by their dense endoplasmic reticulum network and the presence of large secretory granules. Ductal cells were found lining the epithelium of pancreatic ducts and that were in the interstitium of the exocrine pancreas.
Supplementary Material
KEY RESOURCES TABLE
| REAGENT or RESOURCE | SOURCE | IDENTIFIER |
|---|---|---|
| Chemicals, Peptides, and Recombinant Proteins | ||
| Cacodylate sodium salt (Cacodylate buffer pH 7.4) | Ted Pella Inc., Redding, CA | Cat no. 18851 |
| Glutaraldehyde (2.5%) | Ted Pella Inc., Redding, CA | Cat no. 18426 |
| Fresh Formaldehyde (2%) | Electron Microscopy Sciences, Hartfield, PA | Cat no. 18200 |
| Calcium Chloride | Sigma-Aldrich | Cat no. 223506-500g |
| Potassium Ferrocyanide (3%) | J. T. Baker Chemical | Cat no. 3114 |
| Osmium Tetroxide (4%, aqueous) | Electron Microscopy Sciences | Cat no. 19190 |
| Thiocarbohydrazide | Electron Microscopy Sciences | Cat no. 21900 |
| L-Aspartic Acid | Sigma-Aldrich | Cat no. A8949-25g |
| Lead Nitrate | Fisher Scientific | Cat no. L62-100 |
| Ethanol (100 and 190 proof) | Koptec | Cat no. V1016 (100 proof) Cat no. V1105M (190 proof) |
| Durcupan ACM resin | Sigma-Aldrich, St Louis, MO | Cat no. 44611-500ml (Component A) Cat no. 44612-500ml (Component B) Cat no. 44613-100ml (Component C) Cat no. 44614-100ml (Component D) |
| Acetone | Fisher Chemical | Cat no. A949-4 |
| 15N-mouse feed (u-15n, 98%+) | Cambridge Isotope Laboratories | Cat no. MF-SPIRULINA-N-S |
|
Deposited Data | ||
| Imaging data | Mendeley data | DOI: 10.17632/gkb5kz7vtp.1 |
|
Experimental Models: Organisms/Strains | ||
| Mouse: FVB | The Jackson Laboratory, Bar Harbor, ME | Stock No: 001800 |
|
Software and Algorithms | ||
| OpenMIMS | https://github.com/BWHCNI/OpenMIMS/ | Steinhauser et al, 2012 |
| Adobe Photoshop CS2015 | Adobe | |
| Multi-color EM plug in for ImageJ | https://github.com/CRBS/multicolor_em/releases | Adams et al, 2016 |
Highlights.
Isotope microscopy reveals age mosaicism of cells and specific protein complexes
Most hepatocytes are as old as neurons, while sinusoidal endothelial cells are young
Pancreatic alpha, beta, and delta cells can be as old as the animal they reside in
Components of the beta cell primary cilium last a lifetime
Context and Significance.
Some cells in the body, such as skin, are constantly being replaced during one’s lifetime, while most brain cells are not. Cells with minimal to no turnover contain long-lived proteins whose function declines with age. Researchers at the Salk Institute and University of California, San Diego, in California used a detailed isotope-tracing method to measure and map the age of cells and protein in different mouse organs. Unexpectedly, most organs are a mix of cells and proteins of vastly different ages, regardless of whether they are slow or quick to regenerate. Some cells also contain proteins of different ages. Understanding the principles of cellular aging will be important in helping combat the age-associated decline in organ function.
ACKNOWLEDGMENTS
This work was supported by grants to M.W.H. from the NIH Transformative Research Award (R01 NS096786), the Keck Foundation, and the NOMIS Foundation. It was also supported by grants to M.H.E. and V.L.-R. from the NIH NINDS (NIH RO1 NS027177-30), which supported the creation of the 15N/14N mice; and the NIH NIGMS (5P41 GM103412-29), which supports the advanced technologies and instrument development activities of the NCMIR, most heavily used, and whose new methods developments were partly driven by this work. V.O. and M.H.E. are also supported to develop and carry out correlated light and electron microscopy with MIMS under an award from the US Department of Energy, Office of Science, Office of Biological and Environmental Research (DE-SC0016469). R.A.eD. is supported by an American Diabetes Association postdoctoral fellowship (1-18-PMF-007) and benefitted from assistance from Daniela Rhodes and the Nanyang Institute of Structural Biology (NISB) (at the Nanyang Technological University, Singapore) from a career development stipend. The authors are also thankful to Yunbin Guan, Ph.D., from the Caltech Microanalysis Center in the Division of Geological and Planetary Sciences, California Institute of Technology for technical support and assistance with MIMS image acquisition; to Dr. Ting-Di Wu and Dr. Jean-Luc Guerquin-Kern from the INSERM, Université Paris-Sud, Paris; and the Cell and Tissue Imaging Facility of the Institut Curie (PICT), a member of the France BioImaging National Infrastructure (ANR-10-INBS-04), for the use of Curie NanoSIMS instrument; Greg McMahon from the National Center of Excellence in Mass Spectrometry Imaging, National Physical Laboratory (NPL), UK; and to David O’Keefe (Salk Institute) for critical inputs on manuscript editing and revision.
Footnotes
SUPPLEMENTAL INFORMATION
Supplemental Information can be found online at https://doi.org/10.1016/j.cmet.2019.05.010.
DECLARATION OF INTERESTS
The authors declare no competing interests.
DATA AND SOFTWARE AVAILABILITY
All data and software used in this manuscript are available upon request to the Lead Contact (hetzer@salk.edu). The images shown in the main figures in this manuscript are available online (Mendeley Data DOI 10.17632/gkb5kz7vtp.1).
ADDITIONAL RESOURCES
Please visit https://ncmir.ucsd.edu/sbem-protocol for an online version of the protocol used to process samples for electron microscopy.
REFERENCES
- Adams SR, Mackey MR, Ramachandra R, Palida Lemieux SF, Steinbach P, Bushong EA, Butko MT, Giepmans BNG, Ellisman MH, and Tsien RY (2016). Multicolor electron microscopy for simultaneous visualization of multiple molecular species. Cell Chem. Biol 23, 1417–1427. [DOI] [PMC free article] [PubMed] [Google Scholar]
- Aguayo-Mazzucato C, van Haaren M, Mruk M, Lee TB, Crawford C, Hollister-Lock J, Sullivan BA, Johnson JW, Ebrahimi A, Dreyfuss JM, et al. (2017). Beta cell aging markers have heterogeneous distribution and are induced by insulin resistance. Cell Metab 25, 898–910. [DOI] [PMC free article] [PubMed] [Google Scholar]
- Almaça J, Molina J, Arrojo e Drigo R, Abdulreda MH, Jeon WB, Berggren PO, Caicedo A, and Nam HG (2014). Young capillary vessels rejuvenate aged pancreatic islets. Proc. Natl. Acad. Sci. USA 111, 17612–17617. [DOI] [PMC free article] [PubMed] [Google Scholar]
- Bader E, Migliorini A, Gegg M, Moruzzi N, Gerdes J, Roscioni SS, Bakhti M, Brandl E, Irmler M, Beckers J, et al. (2016). Identification of proliferative and mature b-cells in the islets of Langerhans. Nature 535, 430–434. [DOI] [PubMed] [Google Scholar]
- Basu R, Breda E, Oberg AL, Powell CC, Dalla Man C, Basu A, Vittone JL, Klee GG, Arora P, Jensen MD, et al. (2003). Mechanisms of the age-associated deterioration in glucose tolerance: contribution of alterations in insulin secretion, action, and clearance. Diabetes 52, 1738–1748. [DOI] [PubMed] [Google Scholar]
- Blau HM, Cosgrove BD, and Ho ATV (2015). The central role of muscle stem cells in regenerative failure with aging. Nat. Med 21, 854–862. [DOI] [PMC free article] [PubMed] [Google Scholar]
- Brann JH, and Firestein SJ (2014). A lifetime of neurogenesis in the olfactory system. Front. Neurosci 13, 112. [DOI] [PMC free article] [PubMed] [Google Scholar]
- Brennand K, Huangfu D, and Melton D (2007). All b cells contribute equally to islet growth and maintenance. PLOS Biol Published May 29, 2007 10.1371/journal.pbio.0050163. [DOI] [PMC free article] [PubMed] [Google Scholar]
- D’Angelo MA, Raices M, Panowski SH, and Hetzer MW (2009). Age-dependent deterioration of nuclear pore complexes causes a loss of nuclear integrity in postmitotic cells. Cell 136, 284–295. [DOI] [PMC free article] [PubMed] [Google Scholar]
- De Anda FC, Madabhushi R, Rei D, Meng J, Gräff J, Durak O, Meletis K, Richter M, Schwanke B, Mungenast A, et al. (2016). Cortical neurons gradually attain a post-mitotic state. Cell Res 26, 1033–1047. [DOI] [PMC free article] [PubMed] [Google Scholar]
- Dor Y, Brown J, Martinez OI, and Melton DA (2004). Adult pancreatic beta-cells are formed by self-duplication rather than stem-cell differentiation. Nature 429, 41–46. [DOI] [PubMed] [Google Scholar]
- Fischer CA, and Morell P (1974). Turnover of proteins in myelin and myelin-like material of mouse brain. Brain Res 74, 51–65. [DOI] [PubMed] [Google Scholar]
- Foglia MJ, and Poss KD (2016). Building and re-building the heart by cardiomyocyte proliferation. Development 143, 729–740. [DOI] [PMC free article] [PubMed] [Google Scholar]
- Gerdes JM, Christou-Savina S, Xiong Y, Moede T, Moruzzi N, Karlsson-Edlund P, Leibiger B, Leibiger IB, Östenson CG, Beales PL, et al. (2014). Ciliary dysfunction impairs beta-cell insulin secretion and promotes development of type 2 diabetes in rodents. Nat. Commun 5, 5308. [DOI] [PubMed] [Google Scholar]
- Goldstein JI, Lyman CE, Newbury DE, Lifshin E, Echlin P, Sawyer L, Joy DC, and Micheal JR (2003). Scanning electron microscopy and microanalysis. Scanning Electron Microsc. X-Ray Microanal 34, 690. [Google Scholar]
- Herrmann AM, Ritz K, Nunan N, Clode PL, Pett-Ridge J, Kilburn MR, Murphy DV, O’Donnell AG, and Stockdale EA (2007). Nano-scale secondary ion mass spectrometry - a new analytical tool in biogeochemistry and soil ecology: a review article. Soil Biol. Biochem 39, 1835–1850. [Google Scholar]
- Houbracken I, and Bouwens L (2017). Acinar cells in the neonatal pancreas grow by self-duplication and not by neogenesis from duct cells. Sci. Rep 7. [DOI] [PMC free article] [PubMed] [Google Scholar]
- Ibarra A, Benner C, Tyagi S, Cool J, and Hetzer MW (2016). Nucleoporin-mediated regulation of cell identity genes. Genes Dev 30, 2253–2258. [DOI] [PMC free article] [PubMed] [Google Scholar]
- Johnston NR, Mitchell RK, Haythorne E, Pessoa MP, Semplici F, Ferrer J, Piemonti L, Marchetti P, Bugliani M, Bosco D, et al. (2016). Beta cell hubs dictate pancreatic islet responses to glucose. Cell Metab 24, 389–401. [DOI] [PMC free article] [PubMed] [Google Scholar]
- Lechene C, Hillion F, McMahon G, Benson D, Kleinfeld AM, Kampf JP, Distel D, Luyten Y, Bonventre J, Hentschel D, et al. (2006). High-resolution quantitative imaging of mammalian and bacterial cells using stable isotope mass spectrometry. J. Biol 5, 20. [DOI] [PMC free article] [PubMed] [Google Scholar]
- Lynnerup N, Kjeldsen H, Heegaard S, Jacobsen C, and Heinemeier J (2008). Radiocarbon dating of the human eye lens crystallines reveal proteins without carbon turnover throughout life. PLoS One 3, e1529. [DOI] [PMC free article] [PubMed] [Google Scholar]
- Magami Y, Azuma T, Inokuchi H, Kokuno S, Moriyasu F, Kawai K, and Hattori T (2002). Cell proliferation and renewal of normal hepatocytes and bile duct cells in adult mouse liver. Liver 22, 419–425. [DOI] [PubMed] [Google Scholar]
- Malato Y, Naqvi S, Schürmann N, Ng R, Wang B, Zape J, Kay MA, Grimm D, and Willenbring H (2011). Fate tracing of mature hepatocytes in mouse liver homeostasis and regeneration. J. Clin. Invest 121, 4850–4860. [DOI] [PMC free article] [PubMed] [Google Scholar]
- Mattson MP, and Magnus T (2006). Ageing and neuronal vulnerability. Nat. Rev. Neurosci 7, 278–294. [DOI] [PMC free article] [PubMed] [Google Scholar]
- McClure-Begley TD, and Klymkowsky MW (2017). Nuclear roles for cilia-associated proteins. Cilia 6, 8. [DOI] [PMC free article] [PubMed] [Google Scholar]
- Ori A, Toyama BH, Harris MS, Bock T, Iskar M, Bork P, Ingolia NT, Hetzer MW, and Beck M (2015). Integrated transcriptome and proteome analyses reveal organ-specific proteome deterioration in old rats. Cell Syst 1, 224–237. [DOI] [PMC free article] [PubMed] [Google Scholar]
- Pan FC, Bankaitis ED, Boyer D, Xu X, Van de Casteele M, Magnuson MA, Heimberg H, and Wright CVE (2013). Spatiotemporal patterns of multipotentiality in Ptf1a-expressing cells during pancreas organogenesis and injury-induced facultative restoration. Development 140, 751–764. [DOI] [PMC free article] [PubMed] [Google Scholar]
- Savas JN, Toyama BH, Xu T, Yates JR, and Hetzer MW (2012). Extremely long-lived nuclear pore proteins in the rat brain. Science 335, 942. [DOI] [PMC free article] [PubMed] [Google Scholar]
- Schoenheimer R (1942). The dynamic state of body constituents. Cancer Res 2, 810. [Google Scholar]
- Segerstolpe Å, Palasantza A, Eliasson P, Andersson EM, Andréasson AC, Sun X, Picelli S, Sabirsh A, Clausen M, Bjursell MK, et al. (2016). Single-cell transcriptome profiling of human pancreatic islets in health and Type 2 diabetes. Cell Metab 24, 593–607. [DOI] [PMC free article] [PubMed] [Google Scholar]
- Sosinsky GE, Deerinck TJ, Greco R, Buitenhuys CH, Bartol TM, and Ellisman MH (2005). Development of a model for microphysiological simulations: small nodes of Ranvier from peripheral nerves of mice reconstructed by electron tomography. Neuroinformatics 3, 133–162. [DOI] [PubMed] [Google Scholar]
- Steinhauser ML, Bailey AP, Senyo SE, Guillermier C, Perlstein TS, Gould AP, Lee RT, and Lechene CP (2012). Multi-isotope imaging mass spectrometry quantifies stem cell division and metabolism. Nature 481, 516–519. [DOI] [PMC free article] [PubMed] [Google Scholar]
- Stolovich-Rain M, Enk J, Vikesa J, Nielsen FC, Saada A, Glaser B, and Dor Y (2015). Weaning triggers a maturation step of pancreatic b cells. Dev. Cell 32, 535–545. [DOI] [PubMed] [Google Scholar]
- Taylor RC, and Dillin A (2011). Aging as an event of proteostasis collapse. Cold Spring Harb. Perspect. Biol 3, 1–17. [DOI] [PMC free article] [PubMed] [Google Scholar]
- Thévenaz P, Ruttimann UE, and Unser M (1998). A pyramid approach to subpixel registration based on intensity. IEEE Trans. Image Process 7, 27–41. [DOI] [PubMed] [Google Scholar]
- Toyama BH, Savas JN, Park SK, Harris MS, Ingolia NT, Yates JR, and Hetzer MW (2013). Identification of long-lived proteins reveals exceptional stability of essential cellular structures. Cell 154, 971–982. [DOI] [PMC free article] [PubMed] [Google Scholar]
- Tripathi RB, Jackiewicz M, McKenzie IA, Kougioumtzidou E, Grist M, and Richardson WD (2017). Remarkable stability of myelinating oligodendrocytes in mice. Cell Rep 21, 316–323. [DOI] [PMC free article] [PubMed] [Google Scholar]
- van der Meulen T, Mawla AM, DiGruccio MR, Adams MW, Nies V, Dólleman S, Liu S, Ackermann AM, Cáceres E, Hunter AE, et al. (2017). Virgin beta cells persist throughout life at a neogenic niche within pancreatic islets. Cell Metab 25, 911–926. [DOI] [PMC free article] [PubMed] [Google Scholar]
- Verzijlbergen KF, Menendez-Benito V, van Welsem T, van Deventer SJ, Lindstrom DL, Ovaa H, Neefjes J, Gottschling DE, and van Leeuwen F (2010). Recombination-induced tag exchange to track old and new proteins. Proc. Natl. Acad. Sci. USA 107, 64–68. [DOI] [PMC free article] [PubMed] [Google Scholar]
- Westphalen CB, Takemoto Y, Tanaka T, Macchini M, Jiang Z, Renz BW, Chen X, Ormanns S, Nagar K, Tailor Y, et al. (2016). Dclk1 defines quiescent pancreatic progenitors that promote injury-induced regeneration and tumorigenesis. Cell Stem Cell 18, 441–455. [DOI] [PMC free article] [PubMed] [Google Scholar]
- Wollny D, Zhao S, Everlien I, Lun X, Brunken J, Brüne D, Ziebell F, Tabansky I, Weichert W, Marciniak-Czochra A, et al. (2016). Single-cell analysis uncovers clonal acinar cell heterogeneity in the adult pancreas. Dev. Cell 39, 289–301. [DOI] [PubMed] [Google Scholar]
- Zhang DS, Piazza V, Perrin BJ, Rzadzinska AK, Poczatek JC, Wang M, Prosser HM, Ervasti JM, Corey DP, and Lechene CP (2012). Multi-isotope imaging mass spectrometry reveals slow protein turnover in hair-cell stereocilia. Nature 481, 520–524. [DOI] [PMC free article] [PubMed] [Google Scholar]
Associated Data
This section collects any data citations, data availability statements, or supplementary materials included in this article.