

SUMMARY
Brain endothelial cells (BECs) are key constituents of the blood-brain barrier (BBB), protecting the brain from pathogens and restricting access of circulatory factors. Yet, because circulatory proteins have prominent age-related effects on adult neurogenesis, neuroinflammation, and cognitive function in mice, we wondered whether BECs receive and potentially relay signals between the blood and brain. Using single-cell RNA sequencing of hippocampal BECs, we discover that capillary BECs—compared with arterial and venous BECs—undergo the greatest transcriptional changes in normal aging, upregulating innate immunity and oxidative stress response pathways. Short-term infusions of aged plasma into young mice recapitulate key aspects of this aging transcriptome, and remarkably, infusions of young plasma into aged mice exert rejuvenation effects on the capillary transcriptome. Together, these findings suggest that the transcriptional age of BECs is exquisitely sensitive to age-related circulatory cues and pinpoint the BBB itself as a promising therapeutic target to treat brain disease.
In Brief
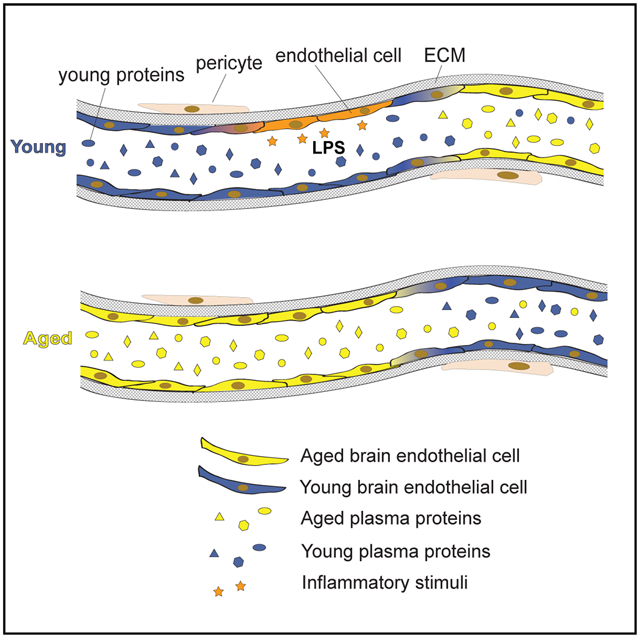
Through scRNA-seq, Chen et al. demonstrate how mouse hippocampal capillary cells undergo significant alterations with age, including the upregulation of innate immunity and oxidative stress pathways, and that components of these aging signatures can be recapitulated or rejuvenated with acute exposure to aged or young mouse plasma, respectively.
Graphical Abstract
INTRODUCTION
Aging drives the deterioration of brain structure and function, increasing susceptibility to neurodegenerative disease and cognitive decline (Andrews-Hanna et al., 2007; Bishop et al., 2010; Mattson and Magnus, 2006). While the cell-intrinsic hallmarks of aging, from stem cell exhaustion to loss of proteostasis, are established aspects of brain aging (López-Otín et al., 2013), recent studies have demonstrated cell non-autonomous mechanisms of brain aging via heterochronic parabiosis or blood plasma infusions (Wyss-Coray, 2016). Specifically, old plasma impairs, and young plasma revitalizes, cognitive function and hippocampal neurogenesis (Castellano et al., 2017; Katsimpardi et al., 2014; Khrimian et al., 2017; Villeda et al., 2011, 2014; Yousef et al., 2019). Specific mouse and human proteins have recapitulated the effects of plasma, such as the pro-aging B2M and CCL11, and the rejuvenating tissue inhibitor of metalloproteinases 2 (TIMP2) (Castellano et al., 2017; Smith et al., 2015; Villeda et al., 2011). Nevertheless, while these studies show systemic effects on the brain, the exact mechanisms mediating these effects are largely unclear.
This is especially so considering that the brain is partitioned from the periphery via specialized vasculature–the blood-brain barrier (BBB) (Abbott et al., 2006; Broadwell, 1989; Daneman and Prat, 2014; Reese and Karnovsky, 1967). Relative to peripheral endothelium, the BBB exhibits limited permeability to macromolecules by employing unique tight junctions and low rates of transcytosis (Andreone et al., 2017; Ben-Zvi et al., 2014; Chow and Gu, 2015). These special properties are induced in development and maintained in adulthood by surrounding pericytes, smooth muscle cells, astrocytes, and neurons that form a functional “neurovascular unit” (Armulik et al., 2010; Daneman et al., 2010). Dysfunction and breakdown of this unit have been implicated in age-related neurodegeneration and manifest in reduced cerebral blood flow, leakage of toxic factors, and a general inability to maintain an optimal environment for neuronal and stem cell function (Bell et al., 2012; Iadecola, 2013; Sweeney et al., 2018; Zhao et al., 2015; Zlokovic, 2008).
The vasculature is composed of three broad segments: arteries/arterioles, capillaries, and veins/venules that fulfill different functions (Aird, 2007; Wilhelm et al., 2016). Recently, unbiased single-cell RNA sequencing of isolated brain endothelial cells (BECs) revealed distinct gene expression signatures specific to each vessel segment (Vanlandewijck et al., 2018; Yousef et al., 2019). For example, vascular cell adhesion molecule 1 (Vcam1) is expressed specifically in arterial and venous segments of the brain vasculature. Concurrently, peripherally administered VCAM1-blocking antibodies reduced neuroinflammation and improved memory function in aged mice (Yousef et al., 2019). Together, this raises the question of how specific BEC segments age and the role of each in modulating plasma-induced brain aging. Indeed, while age-related BBB dysfunction has been probed with a diverse toolkit of tracers (Bien-Ly et al., 2015; Marques et al., 2013; Montagne et al., 2015; Mooradian, 1988), the transcriptional response of vessel segment-specific BECs to aging and changes in the systemic environment have not yet been explored in-depth.
Here, we use single-cell RNA sequencing to study normal hippocampal BEC aging and their response to inflammatory and age-related circulatory cues. We find that the most significant and unique transcriptional changes occur in capillary endothelial cells, discover the ability of aged plasma to recapitulate–and remarkably, young plasma to reverse–key capillary aging signatures, and correlate between luminal receptors and their putative ligands in the mouse circulatory proteome that support a capillary-dependent blood-parenchyma signaling axis. This suggests that capillary BECs are positioned to and capable of mediating reversible, non-autonomous mechanisms of brain aging.
RESULTS
BECs Exhibit Arterial, Capillary, and Venous Segmental Identities
We rapidly isolated and pooled CD31+CD45−Cd11b− BECs from mouse hippocampi and analyzed their transcriptomes using single-cell RNA sequencing as previously described (Figure 1A) (Yousef et al., 2019). Cells passing QC had at least 50,000 reads, with a median of ~700,000 reads and ~1,800 expressed genes per cell (Figures S1A-S1C; Table S1). All cells expressed at least one pan-BBB/endothelial marker at the mRNA level (Cldn5, Cdh5, Pecam1, Ocln, Flt1, and Esam). Few cells exhibited both high mitochondrial and ribosomal gene counts, typical features of poor cell quality or health during isolation and collection (Butler et al., 2018) (Figure S1B).
Figure 1. BECs Segment into Arterial, Capillary, and Venous Identities.

(A) Experimental design for single-cell analyses of BEC transcriptomes.
(B) (Top panel) tSNE of a subset (179) of young BECs collected in an unbiased manner (CD31+) overlaid with the expression pattern (log10CPM) of key segment identity genes Bmx (arterial), Slc16a1 (capillary), Nr2f2 (venous), and Vcam1 (arterial and venous). Note the low number of Vcam1+ cells and the absence of a clear venous population. (Bottom panel) Addition of a subset of VCAM1+ cells into principal-component analysis (PCA) (62, as collected by FACs enrichment) significantly improves A-C-V identification.
(C) Identification of arterial, venous, and capillary populations after the addition of Vcam1+ cells. Pie charts of the proportion of A-C-V cells in unbiased CD31 sorts, in VCAM1+CD31+ sorts, and unbiased sorts with an added 25% of cells from VCAM1+ cell enrichment (final condition).
(D) Heatmap of the top 25 most enriched genes per A-C-V population (which were identified by unbiased whole transcriptome clustering) in young BECs.
(E) Expression bar plots of top genes that could serve as novel markers for arterial and venous identities. Genes encoding for cell surface receptors are indicated by *R. Expression levels in A-C-V segments are consistent across 981 young BECs (4 biological replicates).
(F) Representative in situ RNA hybridization images confirming Cdh13 expression and enrichment in Vwf+ Acta2+ arterial cells (representative of 4 mice). Scale bar, 20 μm.
(G) Representative in situ RNA hybridization images confirming Ilr1r1 expression and enrichment in Vwf+ Acta2− venous cells (representative of 4 mice). Scale bar, 20 μm.
We first characterized hippocampal BECs heterogeneity from young (3-month-old) mice via transcriptome clustering of the top 2,500 over-dispersed genes. Specifically, we searched for BEC populations corresponding to arteriole, capillary, and venule segment identities, as described in Vanlandewijck et al. (2018). Principal component analyses did not yield clear segmental or other phenotypic signatures, with venous (V) (Slc38a5, Nr2f2) and capillary (C) (Slc16a1) markers showing a generally diffuse distribution along the first 10 principal components (PCs), and arterial (A) (Bmx, Efnb2) markers being slightly more biased (Figure 1B, top panel). Upon further inspection, we found that fluorescence activated cell sorting (FACS) sorting via CD31+CD45−Cd11b− alone yielded low numbers of arterial and venous cells (<6% per population), which were defined by a non-zero expression of at least 2/3 classical A and V gene markers (Arterial: Bmx, Efnb2, and Vegfc, Venous: Nr2f2, Slc38a5, and Vwf) (Figure S1D). Vcam1, a cell surface receptor that facilities endothelial-immune cell interactions, has previously been shown to be highly enriched in arterial and venous cells (Vanlandewijck et al., 2018; Yousef et al., 2019). Taking advantage of the surface expression of VCAM1, we infused a fluorescently labeled anti-VCAM1 monoclonal antibody intravenously (retro-orbital [r.o.]) prior to mouse perfusion and tissue dissection to enable enrichment of VCAM1+ arterial and venous BECs by FACS (Yousef et al., 2018). Addition of VCAM1+ sorted cells to the original dataset (~25% of all cells) resulted in a more biased (yet still continuous) distribution of the expression of known A-C-V markers (Figure 1B, bottom panel), and an increase in arterial and venous cell identities (Figure 1C; Figure S1F). VCAM1 protein levels highly correlated with Vcam1 mRNA content; and nearly all Vcam1 mRNA+ cells co-expressed arterial or venous markers and were largely absent in capillaries. Not all arterial and venous cells defined were Vcam1+, suggesting that Vcam1 is expressed in a subset of arterial and venous cells. Indeed, Vcam1+ arterial and venous populations were more transcriptionally activated at baseline (Figure S1E). VCAM1-based enrichment resolved previously small populations of arterial and venous cells that express a transcriptomic signature more similar to that of capillaries (Vanlandewijck et al., 2018).
By systematically classifying the genes most enriched in arterial and venous clusters, we could predict new segment identity markers (Figure 1D). Venous cells were transcriptionally more similar to capillaries than arterial cells. Arterial cells were enriched in Mgp, Clu, Stmn2, and Cdh13, while venous cells were enriched in Il1r1, Cfh, Ctsc, and Tmsb10. These markers were confirmed to be enriched in vascular structures in the dentate gyrus in the Allen ISH Brain Atlas (Figure S2). These markers appear to be expressed mainly in Vcam1+ subpopulations, making them potentially better suited for pan-arterial/venous cell identification. Of those, proteins encoded by Cdh13 (cadherin-13) and Il1r1 (interleukin 1 receptor type 1) are expressed on the cell surface, making them potential markers for antibody-based FACS enrichment of arterial or venous cells, respectively (Figure 1E). Indeed, in contrast to classical venous (Nr2f2) and arterial (Efnb2) markers, these new markers were expressed across a significantly larger number of cells in their respective segment populations (Figure S1G). Importantly, RNA in situ hybridization confirmed enriched Cdh13 expression in Acta2+Vwf+ arterial cells but not in Acta2−Vwf+ venous cells, and vice versa for Il1r1 (Figures 1F and 1G; Figure S1H).
Systemic Lipopolysaccharide (LPS) Administration Activates Common Transcriptional Programs across Segment Identities
To understand whether BECs can act as sensors of organismal-level perturbations, we administered LPS peripherally in young mice to induce an acute inflammatory response. Of 10,955 expressed genes across BECs, 1,610 differentially expressed genes (DEGs) were identified (false discovery rate [FDR] < 0.05 threshold) between LPS-treated and untreated mice, with 865 DEGs in capillaries, 881 in venous cells, and 956 in arterial cells. Fairly balanced numbers of up- and downregulated genes are observed with LPS, for all three segments (Figure 2A). Furthermore, LPS stimulation did not seem to change the native compositions of A-C-V identities (Figure S3A). 357/1610 (22%) DEGs are shared between all three segments; and Gene Ontology (GO) pathway analysis revealed common perturbed pathways across vessel segments, including upregulation of interleukin and interferon (IFN) signaling, cytoskeletal remodeling, cell-matrix adhesion, and transforming growth factor β (TGF-β) signaling, as well as the downregulation of proliferation, lipid and lipoprotein metabolism, and adherens junctions maintenance (Figures 2B and 2C; Figure S3B).
Figure 2. Systemic LPS Exposure Activates Common Transcriptional Programs across Segment Identities.

(A) Venn diagram showing the number of DEGs (FDR < 0.05) shared between each vessel segment. Heatmap showing the distribution of up- and downregulated genes per vessel segment.
(B) Dotted heatmap of top 60 DEGs ranked by the signed-FDR value (product of log2FC*−log10(FDR)). Color indicates the average log2FCof LPS/untreated, while the dot size represents degree of statistical significance. Only genes with FDR < 0.05 for at least one vessel segment is listed, and hierarchical clustering is performed (dot size = 0 indicates FDR > 0.05).
(C) GO enrichment analysis of DEGs (FDR < 0.05) up- and downregulated in LPS treated A, C, and V cells. Left-hand side (red) indicates pathways over-represented in DEGs upregulated with LPS, right-hand side (blue) likewise in DEGs downregulated with LPS exposure. Exemplary genes contributing to pathway enrichments are listed on the side.
(D) Representative images and quantification of MFSD2A expression (green) in the hippocampus of PBS- and LPS-exposed young (3 months) mice (n = 5, two-sided t test; mean ± SEM). Scale bar, 40 μm.
LPS exposure induced large fold changes in expression levels of DEGs such as the innate immunity genes Lcn2, Icam1, Cebpd, Irf7, Litaf, and Ifit3 (Figure S3C). Lcn2 (Lipocalin2), a neutrophil-associated lipocalin that plays roles in innate immunity, was the most highly upregulated gene following LPS treatment in all A-C-V segments, while Cd14, a receptor for LPS was significantly upregulated in venous cells. In contrast, Mfsd2a was significantly downregulated, particularly in capillaries. MFSD2A is critical for the formation of the BBB by limiting non-specific caveolar transcytosis (Andreone et al., 2017; Ben-Zvi et al., 2014; Nguyen et al., 2014). Therefore, we confirmed the predicted decrease in Mfsd2a expression upon LPS exposure by immunofluorescence (Figure 2D). Decreased MFSD2A expression suggests a mechanism for previously observed LPS-induced BBB permeability and immune cell transmigration (Banks et al., 2015; Lutz et al., 2017; Peralta Ramos et al., 2019; Varatharaj and Galea, 2017).
Vessel Segments Exhibit Divergent Aging Transcriptomic Signatures
The hippocampus appears particularly vulnerable to aging, exhibiting the first signs of degeneration in Alzheimer’s disease (Bobinski et al., 2000; Johnson et al., 2012; Pennanen et al., 2004). Because BECs are responsible for maintaining the necessary environment for optimal brain function, understanding how they age is crucial to understanding overall brain aging and neurodegeneration. We sequenced CD31+CD45−CD11b− BECs from the hippocampi of young (3-month-old) (981 cells) and aged (19-month-old) (1,053 cells) disease-free mice. Approximately 20% of BECs were VCAM1-enriched by FACS to increase arterial and venous BEC representation. Unbiased transcriptome clustering across young and aged cells revealed 3 continuous subpopulations with transcriptional signatures of A-C-V segment identities, illustrated by the gradual zonation of Gja4, Bmx, Slc16a1, Slc38a5, Nr2f2, and Vcam1 (Figures 3A and 3B). Aged and young BECs did not show clear distinguishing signatures within the first 10 PCs, indicating that age does not drastically alter segmental identity.
Figure 3. Normal Aging Induces Transcriptomic Changes Specific to Each Segment Identity.

(A) t-Distributed stochastic neighbor embedding (tSNE) of normally aged and young BECs after canonical correlation analysis (CCA), using the top-9 correlation components. Aged and young cells show comparable distributions of A, C, and V identities along the A-C-V axis. Note that segmental identity largely drives cluster formation, rather than age.
(B) Distribution of key A-C-V segment identity markers in tSNE-space.
(C) Venn diagram showing the numbers of DEGs (FDR < 0.1) shared between different vessel segments. Heatmap of the union of all DEGs up- and downregulated in aged A, C, or V cells, illustrating the degree of overlap of DEGs between each segment.
(D) Dotted heatmap of the top 80 DEGs ranked by the signed-FDR value (product of log2FC*−log10(FDR)). Color indicates the average log2FCof aged/young, while the dot size represents degree of statistical significance. DEGs with FDR < 0.1 for at least one vessel segment are listed and ordered by hierarchically clustering (dot size = 0 indicates FDR > 0.1).
(E) GO analysis of DEGs (FDR < 0.1) up- and downregulated in aged A, C, and V cells. Left-hand side (red) indicates pathways over-represented in DEGs upregulated with aging, right-hand side (blue) likewise in DEGs downregulated with aging. Exemplary genes contributing to pathway enrichments are listed on the side.
(F) Representative images and quantification of B2m and Itm2a expression in young and aged hippocampal capillaries (Slc16a1+Pecam1+) following RNA in situ hybridization (B2m: n = 205 cells (young), 295 cells (aged); Itm2a: n = 429 cells (young), 356 cells (aged), two-sided t test; mean ± SEM). Scale bar, 5 μm.
(G) Representative images and quantification of VWF and ALPL expression (green) in CD31+ or collagen IV+ vasculature (red) in the hippocampus of young (3 months) and aged (20 months) mice (n = 6, two-sided t test; mean ± SEM). Scale bar, 40 μm.
Comparing aged and young BECs across A-C-V populations yielded 642 unique DEGs (FDR < 0.1, capillary: 443, venous: 207, arterial 182 DEGs). Analyzed BECs were ensured free of contamination from parenchymal or mural cells (Figure S4A). Relative to LPS treatment, there were fewer age-related DEGs in common across vessel segments (Figure 2), with only 40/642 (6%) DEGs shared by all three segments. Moreover, most aging DEGs showed a shift in the expression distribution (a largely non-zero distribution shifting to one with a higher average) rather than an “on-off” expression change (going from a zero-heavy expression to non-zero expression pattern) that is characteristic of LPS treatment (e.g., Ly6e (aged over young) versus Irf7 (LPS over PBS), Figures S4B and S2C). The majority of DEGs were increased (86%) rather than decreased, suggesting a general up-regulation of transcriptional programs (Figure 3C), corroborating recent reports (Hu et al., 2014; Zhao et al., 2019). Interestingly, aged cells exhibited a slightly higher number of expressed genes (mean = 1,801 compared to 1,474). Capillaries had more DEGs than arterial or venous cells, of which 298/443 (67%) were capillary-specific (Figures 3C and 3D), despite expressing ~25% fewer genes overall (mean = 1,465 versus A: 1,899 and V: 1,928 genes) with comparable number of reads.
Aged capillaries strong upregulated innate immunity (Vwf, Cxcl12, Dusp3, Ifi27, Ifnar1, Il10rb, Ly6e, and Ly6a), antigen-processing (B2m, H2-K1, H2-D1, Tapbp, and H2-T23), VEGF-signaling (Kdr, Flt1, and Flt4), matrix assembly (Vim, Vwa1, and Spock2), cell adhesion (Itga1, Itga6, and Esam), TGF-β signaling (Eng, Acvrl1,and Ltbp4), hypoxia response (Ldha, Pkm, Aldoa, and Nos3), and oxidative stress pathways (Sod1, Apoe, App, Prnp, and Alpl) Figures 3E; Figure S4B). Consistent with a recent report (Ximerakis et al., 2019), we also find a consistent upregulation of ribosomal subunit genes across vessel segments (e.g., Rpl37, Rpl31, Rpl21, Rpl35, Rplp2, Rpl37a, Rps20, and Rps27a) (Figure 3E). Changes in gene expression between aged and young BECs are subtler than those after LPS treatment. A comparison of DEGs in disease-free aging and with LPS treatment reveals few commonly shared DEGs. However, several involved in innate immunity and antigen processing (B2m, H2-K1, and H2-D1) as well as ribosomal biogenesis and rRNA processing (Rpl23, Rps12, Rps27, Rpl10, and Rpsa) were commonly upregulated (Figure S3D).
Notably, several upregulated genes in aged capillaries have known associations with Alzheimer’s disease (e.g., Stmn2, Prnp, Nos3, Sod1, Apoe, Vwf, Alpl, Ctsd, Alpl2, App Sqstm1, and Clstn1) and brain aging (Cuyvers et al., 2015; Dahiyat et al., 1999; Guerreiro et al., 2014; Liu et al., 2013; Vardy et al., 2012; Wolters et al., 2018), highlighting the potential for BECs to contribute to molecular mechanisms and functional deficits in aging and Alzheimer’s disease (Figure S4E). Of these, we confirmed several key DEGs were indeed upregulated with age in situ: VWF and ALPL by protein immunofluorescence–and B2m and Itm2a by RNA hybridization (Figures 3F and 3G; Figure S4D).
Gene-gene correlation analysis of the top 125 aging DEGs (ranked by FDR) suggests the presence of co-regulatory programs (Spearman rho ~0.2–0.4; Figure S4F). We thus analyzed DEGs using Hypergeometric Optimization of Motif Enrichment (HOMER) to systematically search for common regulatory motifs between −400 to +100 bp of the transcription start-site of each DEG (Figure S5A). Strikingly, we found an enrichment of 11 regulatory motifs (4 known and 7 best matches) potentially governing a large subset of our target DEGs (88/125 genes). Not only were top innate immunity genes B2m, Ifitm3, Ly6a, and Ly6c1 expression profiles highly correlated, they shared the HOXB13 (Homeobox protein) motif. Other innate immunity candidates Ifnar1, Cp, H2-D1, H2-K1, Vwf, and Ly6e shared multiple dependencies on RXRs (retinoid X receptors) and NFkb (nuclear factor kappa B). Further signs of co-regulation included TGF-β signaling genes Eng and Ltbp4 by NF1 (neurofibromin), hypoxia genes Nos3, Aldoa, and Pkm by RXRs, and oxidative stress genes Sod1, Apoe, and Alpl by PR (progesterone receptor). Thus, the large degree of shared regulatory elements suggests that a small number of key regulatory factors could drive the concerted upregulation of the aging transcriptional program.
While VCAM1 FACS enrichment boosted arterial/venous cell numbers and enhanced discretization of these segmental populations in unsupervised clustering, we sought to ensure this did not confound age-related DEGs by repeating the differential expression analysis with only BECs sorted in an unbiased manner (CD31+CD45−Cd11b−). Here, Vcam1 expression spanned a wide range, and was not detectable in most arterial and venous cells (Figure S5B). We found that the top 50th percentile of DEGs (as ranked by FDR) after VCAM1-enrichment were consistent with those after unbiased sorting (Figure S5C). Moreover, the number of DEGs (FDR < 0.1, log2FC > 0.1) after unbiased sorting did not differ significantly (V: 210 versus 207 DEG with 178 overlapping; A: 204 versus 186 DEGs with 171 overlapping), indicating that our discovery of age-related capillary transcriptional activation is not a consequence of our VCAM1 enrichment strategy.
To further ensure that DEGs were not a consequence of technical or biological artifacts, we performed several tests. A permutation test was conducted on all DEGs (FDR < 0.1) to ensure that the true average log fold change of each DEG fell beyond the 95th percentile of a randomly shuffled distribution (Figure S4C). In addition, DEGs were calculated within each of the four pairs of biological replicates (instead of pooling cells from all mice of each age), and only those found to be differentially expressed in 3 out of 4 replicates passed the criteria. Importantly, higher gene expression in aged cells is likely not due to technical nor biological biases. No differences in accuracy and sensitivity of detection of External RNA Controls Consortium (ERCC) spike-in control species were found between age groups across replicates, indicating gene upregulation patterns in aged cells are likely not due to higher mRNA capture or conversion efficiencies (Figures S5D and S5E). Interestingly, while aged cells were not significantly larger in size (Figure S5F), they did contain slightly more mRNA, as extrapolated by amplified cDNA concentrations of single cells. Nonetheless, these size effects were largely mitigated by normalizing each cell’s cDNA content (to 0.2 ng/nL) prior to library preparation to obtain comparable distributions of sequencing depths between ages, in addition to normalizing each gene by total library sizes (Figure S5G). Altogether, we find that each vessel segment ages differently, and that aged capillaries undergo the greatest changes in upregulating innate immunity, antigen processing, TGF-β signaling, and oxidative stress response pathways.
Luminal Exposure of BECs to Aged Plasma Recapitulates Aspects of Transcriptional Aging
An aged circulatory environment can promote brain dysfunction (Silva-Vargas et al., 2016; Villeda et al., 2011; Yousef et al., 2019). However, the mechanisms involved in relaying circulatory signals to the brain are unclear. We hypothesized that BECs play an intermediary role in sensing and responding to an aged circulatory proteome. Thus, we measured the transcriptional response of young BECs to soluble factors in the plasma of aged mice. We injected young mice with pooled plasma from aged mice (AMP) or PBS (150 μL per injection) retro-orbitally, twice-daily for 4 days (Yousef et al., 2019) and collected CD31+CD45− as well as CD31+CD45−VCAM1+ cells from the hippocampus (Figure 4A). Single-cell RNA sequencing of AMP (n = 333 cells) and PBS (n = 206) treated young BECs revealed that arteriovenous zonation, rather than plasma treatment, was the main driver of heterogeneity (within the first 15 PCs) (Figures 4B and 4C; Figure S6A). Interestingly, BECs again responded differentially to plasma treatment depending on vessel segment identity, with capillaries exhibiting a strikingly larger number of DEGs compared to arterial and venous cells, even when downsampled to match sample powers with arterial and venous cells. Of 12,042 detected genes, 829 genes were differentially regulated in capillaries (FDR < 0.1), with most upregulated (692, 83% of DEGs). Importantly, only a small subset (<10%) of these DEGs were also differentially regulated after injecting aged-matched young plasma into young mice, indicating that most of the effects of AMP in young mice are specific to the age of the plasma (Table S2). Thus, capillaries are highly responsive to factors in the exogenous aged plasma (Figures 4D and 4E; Figures S6D and S6G).
Figure 4. Brain Capillaries Sense and Adopt Cues in the Circulatory Milieu, with Aged Plasma Exposure Recapitulating the Normal Aging Transcriptomic Signature.

(A) Schematic of the aged mouse plasma (AMP) acute infusion paradigm in young mice.
(B) tSNE of AMP- and PBS-treated BECs from young (3 months) mice after CCA, using the top-9 correlation components. AMP- and PBS-treated cells show comparable distributions of A, C, and V identities, suggesting plasma infusions do not significantly alter native segmental identities.
(C) Expression bar plots of canonical A-C-V marker genes in AMP- and PBS-treated BECs, with segmental identities defined by unbiased clustering in (B).
(D) Volcano plot depicting up- and downregulated genes with AMP treatment in capillaries (compared to PBS control). Genes marked in red are significant (FDR < 0.1). FDR values are calculated only with genes showing an average log2FC > 0.1. Genes labeled red are FDR <0.1.
(E) Dotted heatmap of top 60 DEGs ranked by the signed-FDR value (product of log2FC*−log10(FDR)). Color indicates the average log2FCof AMP/PBS, while the dot size represents degree of statistical significance. DEGs with FDR < 0.1 for at least one vessel segment are listed and ordered by hierarchically clustering (dot size = 0 indicates FDR > 0.1).
(F) Scatterplot of genes and their log2FCin both aged/young and AMP/PBS treatment in capillaries. The 153 genes commonly up- (blue) or downregulated (green) in both groups (FDR <0.1 in both) are labeled. These DEGs may be modulated by plasma factors upregulated in normal aging. Inset shows the same genes (red) on a scatterplot of the signed-FDR value (product of log2FC*−log10(FDR)) for normal aging and AMP.
(G) Top pathways over-represented by DEGs upregulated in both normal aging and with AMP treatment (149 intersecting DEGs).
Excitingly, we discovered a significant overlap between transcriptional changes in BECs as a result of normal aging and exposure to AMP. This overlap was most striking in capillaries and less pronounced in venous and arterial cells (Figures S6B and S6C). Out of 443 DEGs in aging and 829 DEGs in AMP treatment, 149 (upregulated) and 4 (downregulated) transcripts were found to be shared, and these intersecting DEGs comprised ~34% and 18% of total DEGs in each comparison, respectively (Figure 4F). This overlap is significant as the intersecting number is above the 99th percentile of the distribution of intersects if genes were randomly chosen from each group. Surprisingly, nearly all of the intersecting genes are expressed at higher absolute levels in AMP treated cells compared to normal aging (Figures S6E and S6F) suggesting that factors in AMP are powerful inducers of key aspects of BEC aging. Indeed, pathway analysis of the 149 commonly upregulated transcripts pointed to similar pathways enriched in normal aging, including innate immunity (Dusp3, Ifi27, Ifnar1, Il10rb, Vim, H2-T23, Icam2, Calm1, Myo10, Anxa2, and Canx), cellular senescence (Uba52, Sod1, Rbx1, Elob, and Fkbp4), TGF-β signaling (Nedd8, Bmpr2, Id1, and Pdgfb), hypoxia and stress (Hspa1a and Hspb1), and ribosomal processing (Rpl10, Rpl10a, Rpl13, Rpl18a, Rpl26, and Rpl28) (Figure 4G).
Luminal Exposure of BECs to Young Plasma Reverses Aspects of Transcriptional Aging
The plasma of young mice can rejuvenate the brains of aged mice, as assessed by enhanced neurogenesis, memory and learning, dendritic spine density, and diminished neuroinflammation (Wyss-Coray, 2016). To see if aged BECs are similarly responsive to acute young mouse plasma (YMP) exposure, we injected aged mice with pooled YMP or PBS, isolated hippocampal BECs, and sequenced RNA from individual cells as described above (Figure 5A). Dimensionality reduction of all YMP- (n = 256) and control PBS-treated cells (n = 121) resulted in distinct ACV populations, with no obvious separation between treatment conditions (PCs 1–15) (Figures 5B and 5C). Again, capillaries responded most significantly to plasma injections but, unlike BECs exposed to AMP, the great majority of transcripts were downregulated with YMP infusion (206/257 DEGs–80% downregulated) (Figure 5D). Prominently downregulated pathways include antigen processing and presentation via MHC Class 1 (H2-D1, H2-Q6, H2-Q7, H2-T22, H2-T23, B2m, H2-K1, and Tapbp), innate immune response and cytokine (IFN) signaling (Icam2, Ifi27, Ifitm3, Ifih1, Ifit3, and Vwf) metabolic processes, and ribosomal biogenesis and rRNA processing (Rpl13, Rpl38, Rpl41, Rps27, Rps27a, Rps29, and Rps8) (Figures S7A and S7D).
Figure 5. Young Plasma Exposure Partially Reverses the Transcriptomic Signature of Normal Brain Capillary Aging.

(A) Schematic of the young mouse plasma (YMP) acute infusion paradigm in aged mice.
(B) tSNE of YMP-treated and PBS-treated BECs from aged (20 months) mice after CCA, using the top-9 correlation components. AMP- and PBS-treated cells show comparable distributions of A, C, and V identities, suggesting plasma infusions do not significantly alter native segmental identities.
(C) Expression bar plots of canonical A-C-V marker genes in YMP- and PBS-treated BECs, with segmental identities defined by unbiased clustering in (B).
(D) Volcano plot depicting up- and downregulated genes with YMP treatment in capillaries (compared to PBS control). Genes marked in red are significant (FDR < 0.1). FDR values are calculated only with genes showing an average log2FC > 0.1. Genes labeled red are FDR < 0.1.
(E) Scatterplot of genes and their log2FCin both aged/young and YMP/PBS treatment in capillaries. The 89 genes that are upregulated with age (aged/young) but decreased with YMP (YMP/PBS)—and vice-versa (FDR < 0.1 in aging and FDR < 0.1 in YMP)—are labeled. These age-upregulated DEGs are likely modulated and/or reversed via exposure to YMP. Inset shows the same genes (red) on a scatterplot of the signed-FDR value (product of log2FC*−log10(FDR)) for normal aging and YMP.
(F) Top pathways over-represented by DEGs upregulated in normal aging and downregulated with YMP treatment (89 intersecting DEGs).
These findings suggest that YMP infusions are capable of reversing certain aspects BEC aging. Indeed, in capillaries, 89 DEGs that increase with normal aging decrease with YMP exposure, comprising 12% and 31% of all DEGs in normal aging and YMP infusions, respectively (Figure 5E; Figures S7B and S7C). Strikingly, these 89 genes are enriched in key aging signature pathways (Figure 3E) including ribosomal biogenesis/rRNA processing (Rpl13, Rpl31, Rpl36, Rpl38, Rpl41, Rps13, Rps21, Rps27, Rps28, and Rps8), immune system and cytokine signaling (Vwf, Ifi27, Ifitm3, Ifitm2, and Ifit3), antigen processing and presentation (B2m, H2-K1, H2-D1, H2-T23, Psmb9, and Psmc2), and response to oxidative stress (Ndufb4, Apoe, Sod1, and Nostrin) (Figure 5D).
The Circulatory Environment Induces Cell Non-autonomous Brain Endothelial Aging
To determine whether young plasma factors could specifically reverse transcriptional changes in BECs induced by aged circulatory factors, we compared the 149 shared DEGs between aged/young and AMP/PBS (commonly upregulated) (Figure 4F) and 89 shared DEGs between aged/young and YMP/PBS (commonly upregulated and downregulated, respectively) (Figure 5E) using GeneAnalytics software to identify commonly perturbed biological pathways (Figures 6A and 6B; Figure S8A). Pathways included TGF-b signaling, cellular senescence, respiratory electron transport, innate immunity, IFN signaling, cholesterol biosynthesis, response to oxidative stress, and rRNA processing. Notably, genes enriched in each common pathway do not entirely intersect, suggesting that upregulation and then attenuation of pathways may not necessarily involve the same full set of genes. 42 DEGs lie in the “triple-intersect,” representing various pathways such as immune response signaling, with antigen processing (H2-T23), immune cell adhesion (Icam2), and IFN (Ifi27) among the top genes upregulated by aging and AMP and downregulated by YMP (Figure 6C; Figure S8B). Strikingly, the oxidative stress response pathway was strongly enriched in aging and AMP-treated BECs and reduced by YMP, with Apoe, Sod1, Ndufa6, Nostrin, and Selenow being differentially regulated in all three datasets. We therefore probed for Sod1 expression via RNA in situ hybridization, confirming a strong upregulation upon AMP exposure (Figure 6E). Sod1 mutants have been reported to disrupt BBB function (Zhong et al., 2008), suggesting that dynamic Sod1 upregulation is a dynamic response to oxidative stress pathway perturbations triggered by cell non-autonomous influences, corroborating prior reports of BBB dysfunction upon Sod1 inactivation.
Figure 6. The Circulatory Environment Induces Cell Non-autonomous Brain Endothelial Aging.

(A) Venn diagram depicting the number of DEGs shared between each treatment condition (aged/young, AMP/PBS, and YMP/PBS). 42 genes are differentially expressed in all three treatment groups (i.e., increasing with normal aging and AMP but decreasing with YMP).
(B) Bar plot of top biological pathways over-represented in DEGs shared between aging and AMP (149 DEGs) or shared between aging and YMP (89 DEGs). Score is derived from GeneAnalytics software. The presence of common pathways suggests YMP may reverse some transcriptional consequences of AMP treatment and normal aging. Select genes in each pathway are listed, with DEGs shared across all three treatments labeled in red.
(C) Bar plot of the log2FC of top DEGs that intersect in all three treatments (aged/young, AMP/PBS, and YMP/PBS). These genes are likely modulated by plasma factors upregulated in a normal aged milieu, with expression changes reversible via exposure to young plasma.
(D) Sankey plot depicting relationships between DEGs encoding BEC surface receptor or membrane proteins, and their corresponding plasma ligands. Directionality of expression changes in each condition (normal aging, AMP, and YMP) are denoted with arrows. Corresponding ligands found significantly up- (red) or downregulated (blue) with age in mouse plasma (SOMALogic) are highlighted.
(E) Representative images and quantification of Sod1 and Ifnar1 expression in AMP-exposed hippocampal capillaries (Slc16a1+Pecam1+) following RNA in situ hybridization (Sod1: n = 595 cells [PBS], 576 cells [AMP]; Ifnar1: n = 746 cells [PBS], 916 cells [AMP]; two-sided t test; mean ± SEM). Scale bar, 5 μm.
To further explore how BECs sense and respond to age-related circulatory cues, we identified genes among the 42 intersecting DEGs (Figure 6A) that encode cell surface receptors or membrane proteins (Figure 6D; Figure S8C). Well-established endothelial receptors including Lrp1 and Ager (receptor for advanced glycation endproducts [RAGE]) (Deane et al., 2003; Storck et al., 2016) were confirmed to be present in capillary segments. We then matched the resulting 15 BEC external membrane proteins with putative plasma ligands using a published database of receptor-ligand pairs (Ramilowski et al., 2015), highlighting the ligands we detected in mouse plasma. Interestingly, we identified Bmpr2 (ligands: BMP7 and GDF9), Flt4 (ligand: FN1), Ifnar1 (ligand: IFNA10), Igf1r (ligands: CDH1, GPC3, and INS), and Lsr (ligand: APOB) not only as genes upregulated in both aging and AMP exposure, but also whose ligands significantly increase in the plasma of aged mice (Lehallier et al., 2019) (Figure 6D). These ligands have also been reported to increase in human plasma with age (Sun et al., 2018; Tanaka et al., 2018). Several of these genes, such as Ifnar1, have been reported to promote the deleterious effects of brain aging via IFN signaling (Baruch et al., 2014). Thus, we confirmed the predicted increase in Ifnar1 expression upon AMP exposure by RNA in situ hybridization (Figure 6E), suggesting capillary Ifnar1 may contribute to IFN-modulated cognitive decline via aged plasma.
DISCUSSION
In the brain, aging is a key risk factor for cognitive decline, neuro-degeneration, and diseases such as Alzheimer’s disease. With growing evidence that systemic factors can modulate brain aging and function (Wyss-Coray, 2016), the brain vasculature becomes an obvious putative receiver and transmitter of such circulatory cues to the brain. With this in mind, we characterize here the transcriptome of aging BECs and demonstrate that capillaries are especially sensitive to changes in aging factors in blood.
Single-cell RNA sequencing in young mice revealed unique transcriptional signatures for BECs composing arterial, capillary, and venous vascular segments, confirming recent findings by Vanlandewijck and colleagues (Vanlandewijck et al., 2018) and our own lab (Yousef et al., 2019). Importantly, we report here that this zonation is not perturbed with age despite significant age-related gene expression changes. Moreover, BEC zonation does not change following systemic exposure of mice to a strong inflammatory trigger, LPS, in spite of several hundred genes changing in unison across the BEC subtypes. Lastly, BEC zonation does not change in mice injected systemically with heterochronic plasma. Together, these observations suggest segmental identity at the transcriptional level is rather stable in response to circulatory environmental cues and possibly defined by more proximal, cellular interactions and signals in the BBB. Additional studies will be necessary to identify these determinants of BEC identity.
While LPS injection induced a concerted upregulation of inflammatory and downregulation of metabolic pathways across all BEC subtypes, aging induced largely zonation-specific changes, except a prominent increase in genes involved in translation and RNA biogenesis. Overall, capillary transcriptomes are most responsive to aging as well as intravenous heterochronic plasma administration. Capillary BECs are by far the most abundant segmental subtype in the brain vasculature and while the hemodynamic conditions are different in capillaries than in arterioles and venules, it seems unlikely that this is the cause of their differential response to circulatory cues. It will thus be interesting to determine if capillary BECs are transcriptionally wired to respond to systemic changes and whether this is the result of their interaction with pericytes, other mural cells, glia, and neurons. Equally interesting will be to study the implications of the observed age-related capillary changes on BBB function, neuro-vascular coupling, and endothelial-CNS parenchyma communication in general.
It seems perhaps surprising that administration of relatively small amounts of heterochronic plasma (<10% of blood volume per injection) over just 4 days induces robust transcriptional changes in BECs across hundreds of genes. This was particularly evident in capillary BECs of young mice treated with aged plasma (829 DEGs) but also significant in aged mice treated with young plasma (206 DEGs), supporting the notion that capillary BECs are exquisitely and acutely sensitive to changes in the circulation. More importantly, heterochronic plasma injections are sufficient to induce signatures of aging according to the age of the injected plasma. Aged plasma infusions into young mice strongly induces pathways seen in normal BEC aging, including ribosomal RNA processing, hypoxia response, innate immunity, cellular senescence, and TGF-β signaling. Of note, TGF-β signaling in the vasculature has been linked to age-related basement membrane thickening and cerebral amyloid angiopathy (Wyss-Coray et al., 1997) and to inhibition of neural progenitor cell proliferation in the hippocampus (Buckwalter et al., 2006; Yousef et al., 2015b).
Conversely, young plasma infusions result in a strong downregulation of normal BEC aging signatures including oxidative stress response, innate immunity (via major histocompatibility complex class 1 [MHC class 1]), IFN signaling and antigen presentation. B2m, upregulated in aging and reversed by YMP, is a critical component of major MHC-1 molecules (e.g., H2-K1 and H2-D1) that enable recognition of pathogenic antigens by cognate T cells. These functions can be augmented by IFN genes such as Ifi27 and Ifnar1, also increased with aging. Suggestive of a functional role, plasma B2m increases in human patients with HIV-associated dementia and Alzheimer’s disease (Carrette et al., 2003); and infusions exert negative effects on hippocampal neurogenesis and cognition in mice (Smith et al., 2015). Strikingly, young plasma exposure upregulates β-catenin in aged BECs. Wnt/ β-catenin signaling is necessary for maintaining specialized BBB properties, such as tight junction expression and low expression of leukocyte adhesion molecules, but is compromised upon injury, inflammation, and likely during aging (Lengfeld et al., 2017; Liebner et al., 2008; Tran et al., 2015; Zhou and Nathans, 2014). Recently, β-catenin expression alone has been found sufficient to convert leaky vessels in circumventricular organs to a barrier-type state, with stabilized junctions and decreased tracer permeability (Benz et al., 2019; Wang et al., 2019). This suggests factors in young plasma may hold restorative properties for an aged BBB, perhaps modulated by Wnt/β-catenin signaling programs.
The 42 genes which mimic an aging transcriptome in young AMP-infused mice and whose expression is reversed (“rejuvenated”) in aged YMP-infused mice are of particular interest. Several of these genes (Sod1, Apoe, Selenow, Ndufa6, and Nostrin) have established roles in oxidative stress response. Increases in reactive oxygen species (ROS) have been consistently observed in aging and accumulation of oxidative damage to macromolecules is a hallmark of aging, contributing to cellular senescence, loss of proliferation, and secretion of chemokines, interleukins and MMPs (Balaban et al., 2005; Liguori et al., 2018). Interestingly, transcript levels of superoxide dismutase (Sod1)–an antioxidant shown to increase lifespan, decrease the rate of telomere shortening (Serra et al., 2003), protect AD model mice (Murakami et al., 2011), and maintain BBB function (Zhong et al., 2008)–increase in BECs with aging and AMP exposure. Similarly, selenoprotein W (Selenow), an antioxidant that protects cells from peroxide-mediated damage (Jeong et al., 2004), and endothelial nitric oxide synthase (eNOS) traffic inducer (Nostrin), an endothelial-specific attenuator of vascular oxidative stress (Förstermann, 2010), are upregulated with aging and AMP infusions, possibly reflecting a protective response induced by factors present in aged plasma.
Importantly, the non-intersecting genes between AMP/normal aging and YMP/normal aging datasets suggest that some aspects of AMP and YMP treatments are not directly antagonistic. YMP treatments can possibly result in the rejuvenation of aging signatures that are not consequences of factors in aged blood but are due to other, cell-autonomous mechanisms of aging. For instance, YMP infusion reduces the expression of genes involved in antigen presentation (B2m, H2-K1, H2-D1, and H2-T23), yet most of these genes are only increased with normal aging and not with AMP infusions. Conversely, regulators of cell death (Txn, Lmna, Pim1, and Ndrg1) increase with aging and AMP but are not significantly affected by YMP. Nonetheless, there appears to be a consistent cell non-autonomous influence in overall age-related transcriptional activity, with normal aging and acute AMP exposure upregulating global gene expression–and YMP the opposite. Whether this emerging hallmark of aging and its modulation have functional consequences will be the focus of future work (Pal and Tyler, 2016; Sen et al., 2016).
It is likely that many of the changes in BEC gene expression observed with AMP or YMP exposure involve direct receptor-ligand interactions at the luminal surface of these cells. We identified 15 BEC cell surface genes that increase with age but are amenable to AMP or YMP exposure–and matched them with their predicted ligands (Ramilowski et al., 2015) and our own database of the mouse plasma proteome. Standing out in this list are Bmpr2 (ligands: BMP7 and GDF9), Ifnar1 (ligand: IFNA10), Igf1r (ligands: CDH1, GPC3, and INS), all of which have been implicated in organismal longevity and brain aging and whose plasma ligands similarly change with age (Katsimpardi et al., 2014; Kimura et al., 1997; Loffredo et al., 2013; Milman et al., 2016; Tatar et al., 2001; Yousef et al., 2015a). Together, these findings suggest an important role for cell non-autonomous mechanisms in BEC–and perhaps overall brain–aging that may be reversible by systemic factors.
STAR★METHODS
LEAD CONTACT AND MATERIALS AVAILABILITY
All unique/stable reagents generated in this study are available from the Lead Contact, Tony Wyss-Coray (twc@stanford.edu), without restriction.
EXPERIMENTAL MODEL AND SUBJECT DETAILS
Animals
Aged C57BL/6 mice (18-20 months old) were obtained from the National Institute on Aging rodent colony. Young male C57BL/6 mice (3 months old, Charles River Strain Code: 027) were obtained from Charles River Laboratories. All experiments used male mice. All mice were kept on a 12h light/dark cycle and provided ad libitum access to food and water. All animal care and procedures complied with the Animal Welfare Act and were in accordance with institutional guidelines and approved by the V.A. Palo Alto Committee on Animal Research and the institutional administrative panel of laboratory animal care at Stanford University.
METHOD DETAILS
Plasma collection, dialysis and processing
Approximately 500 ml of blood was drawn from the heart in 250 mM EDTA (Sigma Aldrich, CAS Number: 60-00-4) and immediately transferred to ice. Blood was centrifuged at 1,000 g for 10 minutes at 4°C with a break set to 5 or less. Plasma was collected and immediately snap frozen on dry ice and stored at −80°C until further processing. Plasma was dialyzed in 4 L of 1X PBS (51226, Lonza) stirred at room temperature. Plasma was transferred to a fresh 4 L of 1 X PBS after 45 min and then again 20 min later. After the second transfer, plasma was dialyzed overnight at 4°C in 4 L of stirred 1X PBS.
Plasma injections in young and aged mice
Young (3 month-old) C57BL6J male mice were treated with 7 injections of aged (18-20 month-old) or young (3 month-old) dialyzed and pooled mouse plasma (150 μL, r.o.), coming from 8-10 mice per pooled plasma sample as recently described (Yousef et al., 2019). Mice were treated acutely over 4 days, with 2 injections per day spaced 10-12 hours apart. Mice were sacrificed and perfused on the 4th day, 3 hours after the 7th plasma injection. Aged (19-20 month-old) C57BL6J mice were treated with young (3 month) plasma in the same manner.
LPS Injections
Mice were injected intraperitoneally (i.p.) with Lipopolysaccharide (LPS) derived from Salmonella enterica Serotype Typhimurium (Sigma, L6511) at a dose of 1 mg LPS/ kg body weight at three successive time points: 0h, 6h, and 24h (Yousef et al., 2019). Control mice were injected with bodyweight corresponding volumes of PBS. Experimental mice received i.p. and subcutaneous injections of sterile 0.9% saline with 5% glucose to ensure hydration and stable glucose levels during the procedure. Two hours after the last LPS injection (26h) mouse brains were harvested for BEC isolation and flow analysis.
Primary BEC isolation and enrichment of CD31+VCAM1+ cells
BEC isolation was based on previously described procedures (Schaum et al., 2018; Yousef et al., 2018; Zuchero et al., 2016). Briefly, mice were anesthetized with avertin and perfused with ice-cold PBS. After thoroughly dissecting the meninges, hippocampi were microdissected, minced and enzymatically dissociated using the Neural Dissociation Kit according to manufacturer instructions (Miltenyi, 130-092-628). Suspensions were filtered through a 100 μm strainer and myelin removed by centrifugation in 0.9 M sucrose. The remaining myelin-depleted cell suspension was filtered through a 35 μm strainer, blocked for ten minutes with Fc preblock (CD16/CD32, BD 553141) on ice, and stained for 20 minutes with anti-CD31-APC (1:100, BD 551262), anti-CD31-PE/CF594 (1:100, BD clone MEC 13.3, 563616), anti-CD45-FITC or anti-CD45-APC/Cy7 (1:100, BD Clone 30-F11, 553080; Biolegend, 103116), and anti-Cd11b-BV421 (1:100, Biolegend Clone M1/70, 101236) or anti-Cd11b-FITC (1:100, Biolegend Clone M1/70, 101206) in FACS buffer (0.5%–1% BSA, 2 mM EDTA in PBS). Dead cells were excluded by staining with propidium iodide solution (1:3,000, Sigma, P4864) or LIVE/DEAD Fixable Violet Dead Cell Stain (1:1,000 in protein-free buffer, Thermo, L34963). Flow cytometry data and cell sorting were acquired on an ARIA II or III (BD Biosciences) with FACSDiva software (BD Biosciences). FlowJo software was used for further analysis and depiction of the gating strategy. Gates are indicated by framed areas. Cells were gated on forward (FSC = size) and sideward scatter (SSC = internal structure). FSC-A and FSC-W gating was used to discriminate single cells from cell doublets/aggregates. Dead cells were excluded. CD11b+ and CD45+ cells were gated to exclude monocytes/macrophages and microglia. CD31+Cd11b−CD45− BECs were sorted directly into lysis buffer in 96 or 384 well plates (Biorad), containing RNAase inhibitor, oligodT, dNTPs and ERCC spike-ins (Picelli et al., 2014), and stored at −80°C for further processing. If mice were injected with fluorescently labeled anti-mouse VCAM1-DyLight488 as described above, CD45 was stained in the APC/Cy7 channel, and CD31+VCAM1+ cells were also gated in the APC and FITC channels.
Anti-VCAM1 antibody in vivo retro-orbital injections to label and enrich CD31+VCAM1+ BECs
Enrichment and gating of VCAM1+ cells was done as previously described (Yousef et al., 2018). In the LPS paradigm, mice were retro-orbitally (r.o.) injected with either 100μg fluorescently labeled (DyLight488, Thermo Scientific, 53025) InVivoMAb anti-mouse CD106 (VCAM-1, clone M/K-2.7, Bioxell, BE0027) or fluorescently labeled Rat IgG1 Isotype antibody (Clone HRPN, Bioxell, BE0088) immediately after the third LPS injection (24h). Two hours later (26h), mice were sacrificed and hippocampus processed for BEC isolation and flow analysis or brains fixed for immunofluorescence staining. In the aging, AMP, and YMP paradigms, healthy young (3 month-old), aged (19 month-old), or plasma injected (r.o.) young mice were similarly injected (r.o.) with fluorescently labeled anti-VCAM1 mAb two hours before sacrifice. VCAM1+ hippocampal BECs gating was set based on LPS-stimulated mice injected (r.o.) with anti-VCAM1 compared to IgG control. For VCAM1-enriched sorts, half of the wells (96- or 384-well plates containing lysis buffer) were sorted with CD31+VCAM1+ BECs; for unbiased sorts, CD31+ BECs were collected in plates agnostic to VCAM1 signal. Plates were immediately snap frozen and stored at −80°C until RNA extraction and library preparation.
Single cell RNA-sequencing
Cell lysis, first-strand synthesis and cDNA synthesis was performed using the Smart-seq-2 protocol as described previously (Picelli et al., 2014) in both 96-well and 384-well formats, with some modifications. After cDNA amplification (22 cycles), cDNA concentrations were determined via capillary electrophoresis (96-well format) or the PicoGreen quantitation assay (384-well format) and wells were cherry-picked to improve quality and cost of sequencing. Cell selection was done through custom scripts and simultaneously normalizes cDNA concentrations to ~0.2 ng/μL per sample, using the TPPLabtech Mosquito HTS and Mantis (Formulatrix) robotic platforms. Libraries were prepared and pooled using the Illumina Nextera XT kits and in-house Tn5, following the manufacturer’s instructions. Libraries were then sequenced on the Nextseq or Novaseq (Illumina) platforms using 2 × 75bp paired-end reads and 2 × 8bp index reads with a 200-cycle kit (Illumina, 20012861). Samples were sequenced at an average of 1.5M reads per cell.
Immunofluorescence tissue staining
Brain tissue processing and immunofluorescence experiments were performed as described previously (Castellano et al., 2017; Villeda et al., 2014). Brains were isolated and immersion fixed in 4% (w/v) paraformaldehyde overnight at 4°C before preservation in 30% (w/v) sucrose in PBS for sectioning on a freezing-sliding microtome or kept in PBS for immediate vibratome sectioning. Coronally or sagittally cut 50 μm free-floating sections were incubated in blocking solution (5% Normal Donkey Serum, 0.3% Triton X-100 in PBS) before incubation at 4 °C with primary antibodies at the following titrations in antibody dilution buffer (1% BSA, 0.3% Triton X-100 in PBS): goat monoclonal anti-CD31 (1:100, AF3628, R&D), rabbit polyclonal anti-Collagen IV (1:200, AB756P, Millipore Sigma), goat anti-ALPL (1:100, AF2909, R&D), rabbit polyclonal anti-VWF (1:100, A008229, Dako/Agilent), and rabbit polyclonal anti-MFSD2A (1:300, generous gift from Chenghua Gu, Harvard University). Sections were washed, stained with Alexa Fluor-conjugated donkey secondary antibodies (1:250, Thermo) for 2 hours at room temperature, mounted, and coverslipped with ProLong Gold (Life Technologies) before imaging on a confocal laser-scanning microscope (Zeiss LSM880). ImageJ software (National Institutes of Health) was used to quantify the percentage of hippocampal vasculature (CD31 or Collagen IV) covered by VWF or ALPL, and to measure mean intensity values for MFSD2A, as described previously (Vanlandewijck et al., 2018; Yousef et al., 2019).
RNA In Situ Hybridization
Following perfusion, hemibrains were quickly embedded in optimal-cutting temperature compound (Tissue-Tek) and flash frozen with dry ice or 2-methylbutane. Hemibrains were cut into 10-14 μm coronal sections and mounted on SuperFrost Plus glass slides. After dehydration, slides were subjected to RNAscope Multiplex Fluorescent Assay (Advanced Cell Diagnostics), following the manufacturer’s protocol. After pretreatment, slides were hybridized with the following RNAscope probes: Mm-Vwf-No-XHs-C1, Mm-Acta2-C2, Mm-Cdh13-C3, and Mm-Ilr1r1-C3 to validate zonation markers; and Mm-B2m-C1, Mm-Itm2a-C1, Mm-Ifnar1-C1, Mm-Sod1-C1, Mm-Pecam1-C2, and Mm-Slc16a1-C3 to validate DEGs with age and AMP exposure. Fluorescent signals from RNA probes were captured on a confocal laser-scanning microscope (Zeiss LSM880) with consistent ~4 μm z stacks obtained from consistent regions across the hippocampus.
QUANTIFICATION AND STATISTICAL ANALYSIS
RNAscope image analysis
Images were analyzed using a custom pipeline was developed on CellProfiler. Nuclei (DAPI/Hoescht+) were first identified and segmented using the IdentifyPrimaryObjects function with a threshold smoothing scale of 1.34 and correction factor of 1.0. Images of Slc16a1, Pecam1 and DEGs of interest were filtered using EnhanceorSupressFeatures to enhance the foci puncta. The resulting images were masked using nuclei (MaskImage) to only obtain nuclei-associated puncta. For each channel, speckles were identified and counted using IdentifyPrimaryObjects, where the diameter range was 10 to 35 pixel units. This resulted in a puncta count table for each channel for every nuclei in the image, which was then analyzed in R. Cells were filtered to capillaries only by satisfying the criteria of Slc16a1 puncta > 1 and Pecam1 puncta > 1. Puncta for the marker gene in the remaining cells are then counted.
Mouse plasma proteome ligands
A total of 81 plasma samples from 1 to 30 months male and female C57BL/6JN mice were used for proteomics. Details of the groups and samples preparations have been described previously (Lehallier et al., 2019). Briefly, aliquots of 150 μL of plasma were sent on dry ice to SomaLogic Inc. (Boulder, Colorado, US). Data for 1,305 SOMAmer probes were obtained and RFUs (Relative Fluorescence Units) for each plasma protein were log10-transformed. To identify plasma ligands changing with age, we used linear modeling adjusted for sex and age. Type II sum of squares (SS) were calculated and Q-values were estimated using Benjamini–Hochberg approach. Ligands changes with p < 0.05 and q < 0.2 over the 1305 proteins measured were considered significant.
Bioinformatics and data analysis
Sequences from the Nextseq or Novaseq were demultiplexed using bcl2fastq, and reads were aligned to the mm10 genome augmented with ERCC sequences, using STAR version 2.5.2b. Gene counts were made using HTSEQ version 0.6.1p1. All packages were called and run through a custom Snakemake pipeline. We applied standard algorithms for cell filtration, feature selection, and dimensionality reduction. Briefly, genes appearing in fewer than 5 cells, cells with fewer than 500 genes, and cells with less than 50,000 reads were excluded from the analysis. Out of these cells, those with more than 30% of reads as ERCC, and more than 10% mitochondrial or 10% ribosomal were also excluded from analysis. Counts were log-normalized then scaled.
Next, the Canonical Correlation Analysis function from the Seurat package (Butler et al., 2018) was used to align raw data from multiple experiments, data from aged versus young mice, AMP versus YMP treated young mice, and LPS treated versus untreated mice. Only the first 10 Canonical Components (CCs) were used. After alignment, relevant features were selected by filtering expressed genes to a set of ~3000 with the highest positive and negative pairwise correlations. Genes were then projected into principal component space using the robust principal component analysis (rPCA). Single cell PC scores and genes loadings for the first 20 PCs were used as inputs into Seurat’s (v2) FindClusters and RunTsne functions to calculate 2-dimensional tSNE coordinates and search for distinct cell populations. Briefly, a shared-nearest-neighbor graph was constructed based on the Euclidean distance metric in PC space, and cells were clustered using the Louvain method. Cells and clusters were then visualized using 3-D t-distributed Stochastic Neighbor embedding on the same distance metric. Differential gene expression analysis was done by applying the Mann-Whitney U-test of the BEC clusters obtained using unsupervised clustering. Raw p values were adjusted via the false discovery rate (FDR). Permutation tests were then performed on all genes of interest. All graphs and analyses were generated and performed in R. GeneAnalytics and GeneCards- packages offered by Gene Set Enrichment Analysis (GSEA) tool was used for GO/KEGG/REACTOME pathway analysis and classification of enriched genes in each subpopulation.
Regulatory Motif analysis
Known and de novo motifs enrichment was found using HOMER by inputting the list of DEGs of interest and using the function findMotifs.pl and the criteria ‘–start −400 -end 100 -len 8,10 -p2’. Motif locations in specific DEGs were found using the -find < motif file > option of findMotifs.pl.
DATA AND CODE AVAILABILITY
The accession number for the scRNA-sequencing data reported in this paper is GSE:146395.
Supplementary Material
KEY RESOURCES TABLE
| REAGENT or RESOURCE | SOURCE | IDENTIFIER |
|---|---|---|
| Antibodies | ||
| anti-CD31-APC | BD | 551262; RRID:AB_398497 |
| anti-CD31-PE/CF594 | BD | 563616; RRID:AB_2738320 |
| anti-CD45-FITC | BD | 553080; RRID:AB_394610 |
| anti-CD45-APC/Cy7 | BioLegend | 103116; RRID:AB_312981 |
| anti-Cd11b-BV421 | BioLegend | 101236; RRID:AB_11203704 |
| anti-Cd11b-FITC | BioLegend | 101206; RRID:AB_312789 |
| DyLight 488 Antibody Labeling Kit | ThermoFisher Scientific | 53024 |
| InVivoMAb anti-mouse CD106 (VCAM-1) | BioXcell | BE0027; RRID:AB_1107572 |
| Rat IgG1 isotype control, anti-horseradish peroxidase | BioXcell | BE0088; RRID:AB_1107775 |
| Goat monoclonal anti-CD31 | R&D Systems | AF3628; RRID:AB_2161028 |
| Rabbit polyclonal anti-Collagen IV | Millipore Sigma | AB756P; RRID:AB_2276457 |
| Goat polyclonal anti-ALPL | R&D Systems | AF2910; RRID:AB_664062 |
| Rabbit polyclonal anti-VWF | Dako/ Agilent | A008229 |
| Rabbit polyclonal anti-MFSD2A | Prof. Chenghua Gu, Harvard University | N/A |
| Chemicals, Peptides, and Recombinant Proteins | ||
| Lipopolysaccharide (LPS) derived from Salmonella enterica serotype typhimurium | Millipore Sigma | L6511 |
| Ethylenediaminetetraacetic acid (EDTA) | Sigma Aldrich | 60-00-4 |
| Critical Commercial Assays | ||
| PicoGreen quantitation assay | ThermoFisher Scientific | P11496 |
| 200-cycle sequencing kit | Illumina | 20012861 |
| RNAscope Fluorescent Multiplex Reagent Kit | Advanced Cell Diagnostics | 320850 |
| Neural Dissociation Kit | Miltenyi Biotec | 130-092-628 |
| Deposited Data | ||
| scRNA-seq data | This paper | GSE146395 |
| Experimental Models: Organisms/Strains | ||
| Aged C57BL/6 mice (18-20 months old) | National Institute on Aging | N/A |
| Young male C57BL/6 mice (3 months old) – Charles River Strain Code: 027 | Charles River Laboratories | N/A |
| Software and Algorithms | ||
| ImageJ software | National Institutes of Health | https://imagej.nih.gov/ij/ |
| Seurat | Satija Lab | https://github.com/satijalab/seurat |
| CellProfiler | Broad Institute | https://cellprofiler.org/ |
| STAR version 2.5.2b | Alex Dobin | https://github.com/alexdobin/STAR |
| GeneAnalytics | LifeMap Sciences | https://geneanalytics.genecards.org/ |
| HOMER | UCSD | http://homer.ucsd.edu/homer/ |
| HTSEQ version 0.6.1p1. | https://htseq.readthedocs.io/en/release_0.11.1/ | |
Highlights.
Brain capillary, arterial, and venous cells age differently at the transcriptome level
Aged capillaries upregulate innate immunity and oxidative stress pathways
Capillary transcriptomes respond to inflammatory and age-related circulatory cues
Aged and young plasma mimics and reverses signatures of normal aging, respectively
ACKNOWLEDGMENTS
We thank S. Kolluru and D. Henderson for assistance in library preparation; N. Neff and J. Okamoto for assistance with sequencing; and W. Wang, D. Croote, F. Zanini, and R. Jones for helpful discussions and computational assistance. This work was funded by the Department of Veterans Affairs (T.W.-C.); the National Institute on Aging (F32-AG051330 to H.Y., T32-AG0047126 to A.C.Y., and R01-AG059694 and DP1-AG053015 to T.W.-C.); the D. H. Chen Foundation (T.W.-C.); The Glenn Foundation for Aging Research (T.W.-C.); a SPARK grant to H.Y. through the Stanford Clinical and Translational Science Award (CTSA) to Spectrum (UL1 TR001085); and the Big Idea Brain Rejuvenation Project from the Wu Tsai Neurosciences Institute (T.W.-C.). S.R.Q. is a Chan Zuckerberg Investigator. A.C.Y. is supported by a Siebel Scholarship.
Footnotes
DECLARATION OF INTERESTS
The authors declare no competing interests.
SUPPLEMENTAL INFORMATION
Supplemental Information can be found online at https://doi.org/10.1016/j.celrep.2020.03.012.
REFERENCES
- Abbott NJ, Rönnbäck L, and Hansson E (2006). Astrocyte-endothelial interactions at the blood-brain barrier. Nat. Rev. Neurosci 7, 41–53. [DOI] [PubMed] [Google Scholar]
- Aird WC (2007). Phenotypic heterogeneity of the endothelium: I. Structure, function, and mechanisms. Circ. Res 100, 158–173. [DOI] [PubMed] [Google Scholar]
- Andreone BJ, Chow BW, Tata A, Lacoste B, Ben-Zvi A, Bullock K, Deik AA, Ginty DD, Clish CB, and Gu C (2017). Blood-brain barrier permeability is regulated by lipid transport-dependent suppression of caveolae-mediated transcytosis. Neuron 94, 581–594.e5. [DOI] [PMC free article] [PubMed] [Google Scholar]
- Andrews-Hanna JR, Snyder AZ, Vincent JL, Lustig C, Head D, Raichle ME, and Buckner RL (2007). Disruption of large-scale brain systems in advanced aging. Neuron 56, 924–935. [DOI] [PMC free article] [PubMed] [Google Scholar]
- Armulik A, Genové G, Mäe M, Nisancioglu MH, Wallgard E, Niaudet C, He L, Norlin J, Lindblom P, Strittmatter K, et al. (2010). Pericytes regulate the blood-brain barrier. Nature 468, 557–561. [DOI] [PubMed] [Google Scholar]
- Balaban RS, Nemoto S, and Finkel T (2005). Mitochondria, oxidants, and aging. Cell 120, 483–495. [DOI] [PubMed] [Google Scholar]
- Banks WA, Gray AM, Erickson MA, Salameh TS, Damodarasamy M, Sheibani N, Meabon JS, Wing EE, Morofuji Y, Cook DG, and Reed MJ (2015). Lipopolysaccharide-induced blood-brain barrier disruption: roles of cyclooxygenase, oxidative stress, neuroinflammation, and elements of the neurovascular unit. J. Neuroinflammation 12, 223. [DOI] [PMC free article] [PubMed] [Google Scholar]
- Baruch K, Deczkowska A, David E, Castellano JM, Miller O, Kertser A, Berkutzki T, Barnett-Itzhaki Z, Bezalel D, Wyss-Coray T, et al. (2014). Aging. Aging-induced type I interferon response at the choroid plexus negatively affects brain function. Science 346, 89–93. [DOI] [PMC free article] [PubMed] [Google Scholar]
- Bell RD, Winkler EA, Singh I, Sagare AP, Deane R, Wu Z, Holtzman DM, Betsholtz C, Armulik A, Sallstrom J, et al. (2012). Apolipoprotein E controls cerebrovascular integrity via cyclophilin A. Nature 485, 512–516. [DOI] [PMC free article] [PubMed] [Google Scholar]
- Ben-Zvi A, Lacoste B, Kur E, Andreone BJ, Mayshar Y, Yan H, and Gu C (2014). Mfsd2a is critical for the formation and function of the blood-brain barrier. Nature 509, 507–511. [DOI] [PMC free article] [PubMed] [Google Scholar]
- Benz F, Wichitnaowarat V, Lehmann M, Germano RF, Mihova D, Macas J, Adams RH, Taketo MM, Plate KH, Guérit S, et al. (2019). Low Wnt/β-catenin signaling determines leaky vessels in the subfornical organ and affects water homeostasis in mice. Elife 8, e43818. [DOI] [PMC free article] [PubMed] [Google Scholar]
- Bien-Ly N, Boswell CA, Jeet S, Beach TG, Hoyte K, Luk W, Shihadeh V, Ulufatu S, Foreman O, Lu Y, et al. (2015). Lack of widespread BBB disruption in Alzheimer’s disease models: focus on therapeutic antibodies. Neuron 88, 289–297. [DOI] [PubMed] [Google Scholar]
- Bishop NA, Lu T, and Yankner BA (2010). Neural mechanisms of ageing and cognitive decline. Nature 464, 529–535. [DOI] [PMC free article] [PubMed] [Google Scholar]
- Bobinski M, De Leon MJ, Wegiel J, Desanti S, Convit A, Saint Louis LA, Rusinek H, and Wisniewski HM (2000). The histological validation of post mortem magnetic resonance imaging-determined hippocampal volume in Alzheimer’s disease. Neuroscience 95, 721–725. [DOI] [PubMed] [Google Scholar]
- Broadwell RD (1989). Transcytosis of macromolecules through the blood-brain barrier: a cell biological perspective and critical appraisal. Acta Neuropathol. 79, 117–128. [DOI] [PubMed] [Google Scholar]
- Buckwalter MS, Yamane M, Coleman BS, Ormerod BK, Chin JT, Palmer T, and Wyss-Coray T (2006). Chronically increased transforming growth factor-beta1 strongly inhibits hippocampal neurogenesis in aged mice. Am. J. Pathol 169, 154–164. [DOI] [PMC free article] [PubMed] [Google Scholar]
- Butler A, Hoffman P, Smibert P, Papalexi E, and Satija R (2018). Integrating single-cell transcriptomic data across different conditions, technologies, and species. Nat. Biotechnol 36, 411–420. [DOI] [PMC free article] [PubMed] [Google Scholar]
- Carrette O, Demalte I, Scherl A, Yalkinoglu O, Corthals G, Burkhard P, Hochstrasser DF, and Sanchez J-C (2003). A panel of cerebrospinal fluid potential biomarkers for the diagnosis of Alzheimer’s disease. Proteomics 3, 1486–1494. [DOI] [PubMed] [Google Scholar]
- Castellano JM, Mosher KI, Abbey RJ, McBride AA, James ML, Berdnik D, Shen JC, Zou B, Xie XS, Tingle M, et al. (2017). Human umbilical cord plasma proteins revitalize hippocampal function in aged mice. Nature 544, 488–492. [DOI] [PMC free article] [PubMed] [Google Scholar]
- Chow BW, and Gu C (2015). The molecular constituents of the blood-brain barrier. Trends Neurosci. 38, 598–608. [DOI] [PMC free article] [PubMed] [Google Scholar]
- Cuyvers E, van der Zee J, Bettens K, Engelborghs S, Vandenbulcke M, Robberecht C, Dillen L, Merlin C, Geerts N, Graff C, et al. ; BELNEU Consortium and of the EU EOD Consortium (2015). Genetic variability in SQSTM1 and risk of early-onset Alzheimer dementia: a European early-onset dementia consortium study. Neurobiol. Aging 36, 2005.e15–2005.e22. [DOI] [PubMed] [Google Scholar]
- Dahiyat M, Cumming A, Harrington C, Wischik C, Xuereb J, Corrigan F, Breen G, Shaw D, and St Clair D (1999). Association between Alzheimer’s disease and the NOS3 gene. Ann. Neurol 46, 664–667. [DOI] [PubMed] [Google Scholar]
- Daneman R, and Prat A (2014). The blood brain barrier. Cold Spring Harb. Perspect. Biol. 7, a020412. [DOI] [PMC free article] [PubMed] [Google Scholar]
- Daneman R, Zhou L, Kebede AA, and Barres BA (2010). Pericytes are required for blood-brain barrier integrity during embryogenesis. Nature 468, 562–566. [DOI] [PMC free article] [PubMed] [Google Scholar]
- Deane R, Du Yan S, Submamaryan RK, LaRue B, Jovanovic S, Hogg E, Welch D, Manness L, Lin C, Yu J, et al. (2003). RAGE mediates amyloid-β peptide transport across the blood-brain barrier and accumulation in brain. Nat. Med. 9, 907–913. [DOI] [PubMed] [Google Scholar]
- Förstermann U (2010). Nitric oxide and oxidative stress in vascular disease. Pflugers Arch. 459, 923–939. [DOI] [PubMed] [Google Scholar]
- Guerreiro R, Brás J, Wojtas A, Rademakers R, Hardy J, and Graff-Radford N (2014). Nonsense mutation in PRNP associated with clinical Alzheimer’s disease. Neurobiol. Aging 35, 2656.e13–2656.e16. [DOI] [PMC free article] [PubMed] [Google Scholar]
- Hu Z, Chen K, Xia Z, Chavez M, Pal S, Seol JH, Chen CC, Li W, and Tyler JK (2014). Nucleosome loss leads to global transcriptional up-regulation and genomic instability during yeast aging. Genes Dev. 28, 396–408. [DOI] [PMC free article] [PubMed] [Google Scholar]
- Iadecola C (2013). The pathobiology of vascular dementia. Neuron 80, 844–866. [DOI] [PMC free article] [PubMed] [Google Scholar]
- Jeong DW, Kim EH, Kim TS, Chung YW, Kim H, and Kim IY (2004). Different distributions of selenoprotein W and thioredoxin during postnatal brain development and embryogenesis. Mol. Cells 17, 156–159. [PubMed] [Google Scholar]
- Johnson KA, Fox NC, Sperling RA, and Klunk WE (2012). Brain imaging in Alzheimer disease. Cold Spring Harb. Perspect. Med 2, a006213. [DOI] [PMC free article] [PubMed] [Google Scholar]
- Katsimpardi L, Litterman NK, Schein PA, Miller CM, Loffredo FS, Wagers AJ, Lee RT, Chen JW, Wojtkiewicz GR, and Rubin LL (2014). Vascular and neurogenic rejuvenation of the aging mouse brain by young systemic factors. Science 344, 630–634. [DOI] [PMC free article] [PubMed] [Google Scholar]
- Khrimian L, Obri A, Ramos-Brossier M, Rousseaud A, Moriceau S, Nicot A-S, Mera P, Kosmidis S, Karnavas T, Saudou F, et al. (2017). Gpr158 mediates osteocalcin’s regulation of cognition. J. Exp. Med 214, 2859–2873. [DOI] [PMC free article] [PubMed] [Google Scholar]
- Kimura KD, Tissenbaum HA, Liu Y, and Ruvkun G (1997). Daf-2, an insulin receptor-like gene that regulates longevity and diapause in Caenorhabditis elegans. Science 277, 942–946. [DOI] [PubMed] [Google Scholar]
- Lehallier B, Gate D, Schaum N, Nanasi T, Lee SE, Yousef H, Moran Losada P, Berdnik D, Keller A, Verghese J, et al. (2019). Undulating changes in human plasma proteome profiles across the lifespan. Nat. Med 25, 1843–1850. [DOI] [PMC free article] [PubMed] [Google Scholar]
- Lengfeld JE, Lutz SE, Smith JR, Diaconu C, Scott C, Kofman SB, Choi C, Walsh CM, Raine CS, Agalliu I, and Agalliu D (2017). Endothelial Wnt/β-catenin signaling reduces immune cell infiltration in multiple sclerosis. Proc. Natl. Acad. Sci. USA 114, E1168–E1177. [DOI] [PMC free article] [PubMed] [Google Scholar]
- Liebner S, Corada M, Bangsow T, Babbage J, Taddei A, Czupalla CJ, Reis M, Felici A, Wolburg H, Fruttiger M, et al. (2008). Wnt/β-catenin signaling controls development of the blood-brain barrier 183, 409–417. [DOI] [PMC free article] [PubMed] [Google Scholar]
- Liguori I, Russo G, Curcio F, Bulli G, Aran L, Della-Morte D, Gargiulo G, Testa G, Cacciatore F, Bonaduce D, and Abete P (2018). Oxidative stress, aging, and diseases. Clin. Interv. Aging 13, 757–772. [DOI] [PMC free article] [PubMed] [Google Scholar]
- Liu C-C, Liu C-C, Kanekiyo T, Xu H, and Bu G (2013). Apolipoprotein E and Alzheimer disease: risk, mechanisms and therapy. Nat. Rev. Neurol 9, 106–118. [DOI] [PMC free article] [PubMed] [Google Scholar]
- Loffredo FS, Steinhauser ML, Jay SM, Gannon J, Pancoast JR, Yalamanchi P, Sinha M, Dall’Osso C, Khong D, Shadrach JL, et al. (2013). Growth differentiation factor 11 is a circulating factor that reverses age-related cardiac hypertrophy. Cell 153, 828–839. [DOI] [PMC free article] [PubMed] [Google Scholar]
- López-Otín C, Blasco MA, Partridge L, Serrano M, and Kroemer G (2013). The hallmarks of aging. Cell 153, 1194–1217. [DOI] [PMC free article] [PubMed] [Google Scholar]
- Lutz SE, Smith JR, Kim DH, Olson CVL, Ellefsen K, Bates JM, Gandhi SP, and Agalliu D (2017). Caveolin1 is required for Th1 cell infiltration, but not tight junction remodeling, at the blood-brain barrier in autoimmune neuroinflammation. Cell Rep. 21, 2104–2117. [DOI] [PMC free article] [PubMed] [Google Scholar]
- Marques F, Sousa JC, Sousa N, and Palha JA (2013). Blood-brain barriers in aging and in Alzheimer’s disease. Mol. Neurodegener 8, 38. [DOI] [PMC free article] [PubMed] [Google Scholar]
- Mattson MP, and Magnus T (2006). Ageing and neuronal vulnerability. Nat. Rev. Neurosci 7, 278–294. [DOI] [PMC free article] [PubMed] [Google Scholar]
- Milman S, Huffman DM, and Barzilai N (2016). The somatotropic axis in human aging: framework for the current state of knowledge and future research. Cell Metab. 23, 980–989. [DOI] [PMC free article] [PubMed] [Google Scholar]
- Montagne A, Barnes SR, Sweeney MD, Halliday MR, Sagare AP, Zhao Z, Toga AW, Jacobs RE, Liu CY, Amezcua L, et al. (2015). Blood-brain barrier breakdown in the aging human hippocampus. Neuron 85, 296–302. [DOI] [PMC free article] [PubMed] [Google Scholar]
- Mooradian AD (1988). Effect of aging on the blood-brain barrier. Neurobiol. Aging 9, 31–39. [DOI] [PubMed] [Google Scholar]
- Murakami K, Murata N, Noda Y, Tahara S, Kaneko T, Kinoshita N, Hatsuta H, Murayama S, Barnham KJ, Irie K, et al. (2011). SOD1 (copper/zinc superoxide dismutase) deficiency drives amyloid β protein oligomerization and memory loss in mouse model of Alzheimer disease. J. Biol. Chem 286, 44557–44568. [DOI] [PMC free article] [PubMed] [Google Scholar]
- Nguyen LN, Ma D, Shui G, Wong P, Cazenave-Gassiot A, Zhang X, Wenk MR, Goh ELK, and Silver DL (2014). Mfsd2a is a transporter for the essential omega-3 fatty acid docosahexaenoic acid. Nature 509, 503–506. [DOI] [PubMed] [Google Scholar]
- Pal S, and Tyler JK (2016). Epigenetics and aging. Sci. Adv 2, e1600584. [DOI] [PMC free article] [PubMed] [Google Scholar]
- Pennanen C, Kivipelto M, Tuomainen S, Hartikainen P, Hänninen T, Laakso MP, Hallikainen M, Vanhanen M, Nissinen A, Helkala EL, et al. (2004). Hippocampus and entorhinal cortex in mild cognitive impairment and early AD. Neurobiol. Aging 25, 303–310. [DOI] [PubMed] [Google Scholar]
- Peralta Ramos JM, Iribarren P, Bousset L, Melki R, Baekelandt V, and Van der Perren A (2019). Peripheral inflammation regulates CNS immune surveillance through the recruitment of inflammatory monocytes upon systemic α-synuclein administration. Front. Immunol 10, 80. [DOI] [PMC free article] [PubMed] [Google Scholar]
- Picelli S, Faridani OR, Björklund ÅK, Winberg G, Sagasser S, and Sandberg R (2014). Full-length RNA-seq from single cells using Smart-seq2. Nat. Protoc 9, 171–181. [DOI] [PubMed] [Google Scholar]
- Ramilowski JA, Goldberg T, Harshbarger J, Kloppmann E, Lizio M, Satagopam VP, Itoh M, Kawaji H, Carninci P, Rost B, and Forrest AR (2015). A draft network of ligand-receptor-mediated multicellular signalling in human. Nat. Commun 6, 7866. [DOI] [PMC free article] [PubMed] [Google Scholar]
- Reese TS, and Karnovsky MJ (1967). Fine structural localization of a blood-brain barrier to exogenous peroxidase. J. Cell Biol. 34, 207–217. [DOI] [PMC free article] [PubMed] [Google Scholar]
- Schaum N, Karkanias J, Neff NF, May AP, Quake SR, Wyss-Coray T, Darmanis S, Batson J, Botvinnik O, Chen MB, et al. ; Tabula Muris Consortium; Overall Coordination; Logistical Coordination; Organ Collection and Processing; Library Preparation and Sequencing; Computational Data Analysis; Cell Type Annotation; Writing Group; Supplemental Text Writing Group; Principal Investigators (2018). Single-cell transcriptomics of 20 mouse organs creates a Tabula Muris. Nature 562, 367–372. [DOI] [PMC free article] [PubMed] [Google Scholar]
- Sen P, Shah PP, Nativio R, and Berger SL (2016). Epigenetic mechanisms of longevity and aging. Cell 166, 822–839. [DOI] [PMC free article] [PubMed] [Google Scholar]
- Serra V, von Zglinicki T, Lorenz M, and Saretzki G (2003). Extracellular superoxide dismutase is a major antioxidant in human fibroblasts and slows telomere shortening. J. Biol. Chem. 278, 6824–6830. [DOI] [PubMed] [Google Scholar]
- Silva-Vargas V, Maldonado-Soto AR, Mizrak D, Codega P, and Doetsch F (2016). Age-dependent niche signals from the choroid plexus regulate adult neural stem cells. Cell Stem Cell 19, 643–652. [DOI] [PubMed] [Google Scholar]
- Smith LK, He Y, Park JS, Bieri G, Snethlage CE, Lin K, Gontier G, Wabl R, Plambeck KE, Udeochu J, et al. (2015). β2-microglobulin is a systemic pro-aging factor that impairs cognitive function and neurogenesis. Nat. Med 21, 932–937. [DOI] [PMC free article] [PubMed] [Google Scholar]
- Storck SE, Meister S, Nahrath J, Meißner JN, Schubert N, Di Spiezio A, Baches S, Vandenbroucke RE, Bouter Y, Prikulis I, et al. (2016). Endothelial LRP1 transports amyloid-β(1-42) across the blood-brain barrier. J. Clin. Invest 126, 123–136. [DOI] [PMC free article] [PubMed] [Google Scholar]
- Sun BB, Maranville JC, Peters JE, Stacey D, Staley JR, Blackshaw J, Burgess S, Jiang T, Paige E, Surendran P, et al. (2018). Genomic atlas of the human plasma proteome. Nature 558, 73–79. [DOI] [PMC free article] [PubMed] [Google Scholar]
- Sweeney MD, Kisler K, Montagne A, Toga AW, and Zlokovic BV (2018). The role of brain vasculature in neurodegenerative disorders. Nat. Neurosci 21, 1318–1331. [DOI] [PMC free article] [PubMed] [Google Scholar]
- Tanaka T, Biancotto A, Moaddel R, Moore AZ, Gonzalez-Freire M, Aon MA, Candia J, Zhang P, Cheung F, Fantoni G, et al. ; CHI Consortium (2018). Plasma proteomic signature of age in healthy humans. Aging Cell 17, e12799. [DOI] [PMC free article] [PubMed] [Google Scholar]
- Tatar M, Kopelman A, Epstein D, Tu M-P, Yin C-M, and Garofalo RS (2001). A mutant Drosophila insulin receptor homolog that extends life-span and impairs neuroendocrine function. Science 292, 107–110. [DOI] [PubMed] [Google Scholar]
- Tran KA, Zhang X, Predescu D, and Huang X (2015). Endothelial β-catenin signaling is required for maintaining adult blood-brain barrier integrity and central nervous system homeostasis. Circulation 133, 177–186. [DOI] [PMC free article] [PubMed] [Google Scholar]
- Vanlandewijck M, He L, Mäe MA, Andrae J, Ando K, Del Gaudio F, Nahar K, Lebouvier T, Laviña B, Gouveia L, et al. (2018). A molecular atlas of cell types and zonation in the brain vasculature. Nature 554, 475–480. [DOI] [PubMed] [Google Scholar]
- Varatharaj A, and Galea I (2017). The blood-brain barrier in systemic inflammation. Brain Behav. Immun 60, 1–12. [DOI] [PubMed] [Google Scholar]
- Vardy ERLC, Kellett KAB, Cocklin SL, and Hooper NM (2012). Alkaline phosphatase is increased in both brain and plasma in Alzheimer’s disease. Neurodegener. Dis 9, 31–37. [DOI] [PubMed] [Google Scholar]
- Villeda SA, Luo J, Mosher KI, Zou B, Britschgi M, Bieri G, Stan TM, Fainberg N, Ding Z, Eggel A, et al. (2011). The ageing systemic milieu negatively regulates neurogenesis and cognitive function. Nature 477, 90–94. [DOI] [PMC free article] [PubMed] [Google Scholar]
- Villeda SA, Plambeck KE, Middeldorp J, Castellano JM, Mosher KI, Luo J, Smith LK, Bieri G, Lin K, Berdnik D, et al. (2014). Young blood reverses age-related impairments in cognitive function and synaptic plasticity in mice. Nat. Med 20, 659–663. [DOI] [PMC free article] [PubMed] [Google Scholar]
- Wang Y, Sabbagh MF, Gu X, and Rattner A (2019). Beta-catenin signaling regulates barrier-specific gene expression in circumventricular organ and ocular vasculatures. Elife 8, e43257. [DOI] [PMC free article] [PubMed] [Google Scholar]
- Wilhelm I, Nyúl-Tóth Á, Suciu M, Hermenean A, and Krizbai IA (2016). Heterogeneity of the blood-brain barrier. Tissue Barriers 4, e1143544. [DOI] [PMC free article] [PubMed] [Google Scholar]
- Wolters FJ, Boender J, de Vries PS, Sonneveld MA, Koudstaal PJ, de Maat MP, Franco OH, Ikram MK, Leebeek FW, and Ikram MA (2018). Von Willebrand factor and ADAMTS13 activity in relation to risk of dementia: a population-based study. Sci. Rep 8, 5474. [DOI] [PMC free article] [PubMed] [Google Scholar]
- Wyss-Coray T (2016). Ageing, neurodegeneration and brain rejuvenation. Nature 539, 180–186. [DOI] [PMC free article] [PubMed] [Google Scholar]
- Wyss-Coray T, Masliah E, Mallory M, McConlogue L, Johnson-Wood K, Lin C, and Mucke L (1997). Amyloidogenic role of cytokine TGF-β1 in transgenic mice and in Alzheimer’s disease. Nature 389, 603–606. [DOI] [PubMed] [Google Scholar]
- Ximerakis M, Lipnick SL, Innes BT, Simmons SK, Adiconis X, Dionne D, Mayweather BA, Nguyen L, Niziolek Z, Ozek C, et al. (2019). Single-cell transcriptomic profiling of the aging mouse brain. Nature Neurosci. 22, 1696–1708. [DOI] [PubMed] [Google Scholar]
- Yousef H, Morgenthaler A, Schlesinger C, Bugaj L, Conboy IM, and Schaffer DV (2015a). Age-associated increase in BMP signaling inhibits hippocampal neurogenesis. Stem Cells 33, 1577–1588. [DOI] [PMC free article] [PubMed] [Google Scholar]
- Yousef H, Conboy MJ, Morgenthaler A, Schlesinger C, Bugaj L, Paliwal P, Greer C, Conboy IM, and Schaffer D (2015b). Systemic attenuation of the TGF-β pathway by a single drug simultaneously rejuvenates hippocampal neurogenesis and myogenesis in the same old mammal. Oncotarget 6, 11959–11978. [DOI] [PMC free article] [PubMed] [Google Scholar]
- Yousef H, Czupalla C, Wyss-Coray T, and Butcher E (2018). Papain-based single cell isolation of primary murine brain endothelial cells using flow cytometry. Biol. Protocol 8, 1–12. [DOI] [PMC free article] [PubMed] [Google Scholar]
- Yousef H, Czupalla CJ, Lee D, Chen MB, Burke AN, Zera KA, Zandstra J, Berber E, Lehallier B, Mathur V, et al. (2019). Aged blood impairs hippocampal neural precursor activity and activates microglia via brain endothelial cell VCAM1. Nat. Med. 25, 988–1000. [DOI] [PMC free article] [PubMed] [Google Scholar]
- Zhao Z, Nelson AR, Betsholtz C, and Zlokovic BV (2015). Establishment and dysfunction of the blood-brain barrier. Cell 163, 1064–1078. [DOI] [PMC free article] [PubMed] [Google Scholar]
- Zhao L, Li Z, Vong JSL, Chen X, Lai H-M, Yan C, Huang J, Sy SKH, Tian X, Huang Y, et al. (2019). Zonation-dependent single-endothelial cell transcriptomic changes in the aged brain. bioRxiv. 10.1101/800318. [DOI] [PMC free article] [PubMed] [Google Scholar]
- Zhong Z, Deane R, Ali Z, Parisi M, Shapovalov Y, O’Banion MK, Stojanovic K, Sagare A, Boillee S, Cleveland DW, and Zlokovic BV (2008). ALS-causing SOD1 mutants generate vascular changes prior to motor neuron degeneration. Nat. Neurosci 11, 420–422. [DOI] [PMC free article] [PubMed] [Google Scholar]
- Zhou Y, and Nathans J (2014). Gpr124 controls CNS angiogenesis and blood-brain barrier integrity by promoting ligand-specific canonical wnt signaling. Dev. Cell 31, 248–256. [DOI] [PMC free article] [PubMed] [Google Scholar]
- Zlokovic BV (2008). The blood-brain barrier in health and chronic neurodegenerative disorders. Neuron 57, 178–201. [DOI] [PubMed] [Google Scholar]
- Zuchero YJY, Chen X, Bien-Ly N, Bumbaca D, Tong RK, Gao X, Zhang S, Hoyte K, Luk W, Huntley MA, et al. (2016). Discovery of novel blood-brain barrier targets to enhance brain uptake of therapeutic antibodies. Neuron 89, 70–82. [DOI] [PubMed] [Google Scholar]
Associated Data
This section collects any data citations, data availability statements, or supplementary materials included in this article.
Supplementary Materials
Data Availability Statement
The accession number for the scRNA-sequencing data reported in this paper is GSE:146395.