Abstract
Epilepsy affects over 70 million people worldwide and 30% of patients’ seizures cannot be controlled with medications, motivating the development of alternative therapies such as electrical stimulation. Current stimulation strategies attempt to stop seizures after they start, but none aim to prevent seizures altogether. Preventing seizures requires knowing when the brain is entering a preictal state (i.e., approaching seizure onset). Here we show that such preictal activity can be detected by an informative neural signal that progressively and monotonically changes as the brain approaches a seizure event. Specifically, we use local field potentials (LFP) from a rat model of epilepsy to develop an innovative measure of signal novelty relative to nonseizure activity, that shows the presence of progressive neural dynamics in an ultra broad band (4 Hz – 5 kHz). The measure is extracted from functional connectivity features computed from the LFPs which are used as an input to a one-class Support Vector Machine (SVM). The SVM outputs a scalar signal which quantifies how novel the current activity looks relative to baseline (non-seizure) activity and shows a progression towards seizure onset minutes ahead of time. The use of ultra broad band multivariate features into the SVM results in a novelty signal that has a significantly higher slope in the progression to seizure onset when compared to using power in conventional frequency bands (4 – 500 Hz) on individual channels as input features to the SVM. Functional connectivity in conjunction with the SVM is a strategy that generates a new measurement of novelty that can be used by closed-loop systems for seizure forecasting and prevention.
I. INTRODUCTION
Epilepsy is a neurological condition that affects over 70 million worldwide. About a third of epilepsy patients are drug-resistant and must consider invasive alternatives such as vagal nerve stimulation, resective brain surgery, or deep brain stimulation therapy. Electrical stimulation is a powerful tool capable of altering neuronal activity with the potential to become a highly effective form of treatment for seizure therapy [1]. Closed-loop electrical stimulation therapy provides an attractive option that minimizes intervention by limiting the stimulation to times when the patient is in need [2]. Efforts have been made to develop closed-loop stimulation strategies using different protocols, yet none provide a highly effective and reliable solution. Previously proposed closedloop strategies act as “responsive switches” that wait until a seizure is detected (via an algorithm) and then stimulate with a fixed pattern to suppress the seizure. The performance of these strategies rely on the type of stimuli that is delivered, and detection of the adequate instance to deliver the electrical stimulus [3].
Ideally, a real closed-loop controller should be able to continuously steer the neural network away from seizure genesis using adaptive stimulation patterns that change with feedback from EEG measurements, to avoid seizures altogether. To build this feedback control paradigm there is a need for a neural signal that remains “steady” when seizures are not imminent, and that then changes in a progressive manner when a seizure is approaching. The complexity of seizure dynamics and the variability of seizure-onset patterns present a challenge to find a statistic that accurately captures changes in brain activity prior to and leading towards seizure onset. Time-frequency analysis is used extensively to characterize neurophysiological dynamics leading to seizure onset, and after seizure onset [4], [5], [6]. Consequently, spectral features extracted from local field potentials (LFPs) are widely used for designing seizure prediction and detection algorithms.
Univariate and multivariate approaches to analyze the LFP signal have shown evidence of changes in temporal properties preceding seizure onset [7], [8], [9]. This has made it feasible to classify sets of features into preictal and ictal states [10], [11]. The performance of these type of algorithms, depends largely on building a training set that accurately represents the feature space. This makes it particularly difficult to design patient-specific algorithms if no prior data is available. Other algorithms use spectral features from different frequency bands ranging between [4500] Hz [7], [8], [10]. However, there are no studies to our knowledge that analyze frequencies above 500 Hz for seizure prediction, even though single-unit recordings (whose activity is seen between 1kHz - 5 kHz), show that firing rate of neurons increases towards seizure onset [12]. Thus, it seems reasonable to hypothesize that there is information valuable for seizure prediction in the intermediate frequency range.
The one-class Support Vector Machine (SVM) is a powerful algorithm, designed for unbalanced datasets, where abnormal samples are rare. It outputs a measurement of novelty in accordance to its training data set. Gardner et al. [13] implemented the one-class SVM on humans with temporal lobe epilepsy for seizure onset detection. In this study they used univariate energy features from non-ictal data for training, proving this algorithm is able to detect seizure related activity as outliers. Furthermore, it is an attractive option to build a patient-specific algorithm when no prior ictal data is available, and it can be implemented in realtime as it isn’t computationally expensive.
The proposed framework uses network based spectral features extracted from the entire LFP power spectrum to train a one-class SVM that outputs a measure of novelty over time that is sensitive to neural activity leading to seizure initiation. To test our approach LFP recordings from N = 5 acute rat models of epilepsy were used to compute the Power Spectrum Density (PSD) in 23 different frequency bands ranging from 4 Hz to 5 kHz in a sliding window. From each frequency band, a power spectrum-based connectivity matrix among all LFP channels was computed. The singular values (σ) of this matrix are then used as feature vectors to train a one-class SVM over time. Finally, the outputs of the SVMs are summed across all 23 bands and compared to the sum of the bands used in previously proposed studies. This approach shows that analysis of the whole LFP spectrum can be used to derive an informative feature useful for closed-loop systems.
II. METHODS
A. Animal Model of Epilepsy
All procedures described here were approved by the Technion Institutional Animal Ethics Committee. Five adult male Wistar rats (200–300 g) were used for the experiments. Electrographical seizures were induced through local application of 4-aminopyridine (4-AP), a potassium channel blocker. The chemoconvulsant is applied onto the rat’s S1 barrel cortex (AP=1 mm, ML=3 mm). The model used, is described in greater detail in our prior work [14].
B. Electrophysiological Recordings
LFP were recorded using a linear-electrode array with 16 recording channels (A16 probe with inter-contact distance of 50 μm, NeuroNexus, Ann Arbor, MI). Recordings were acquired at a sampling rate of 25 kHz, filtered (0.1 Hz - 10 kHz) and digitalized with a ME-16 amplifier and MC-Rack software (Multichannel systems, Reutlingen, Germany). Preprocessing of LFP recordings was done using band-pass filtering from 0.5 Hz to 5 kHz, notch filtering at 50 Hz, and average referencing for noise reduction. Baseline activity was recorded for 10 min before 4-AP application, then paused while 4-AP was applied, and resumed shortly after until the end of the first seizure. The length of LFP recordings in average is 42.9 ± 18.5 min. The first seizure appeared in average 32.7 ± 18.8 min after 4-AP application. The seizure onsets were identified by a certified epileptologist (Y. S.).
C. Feature Extraction and Multivariate Analysis
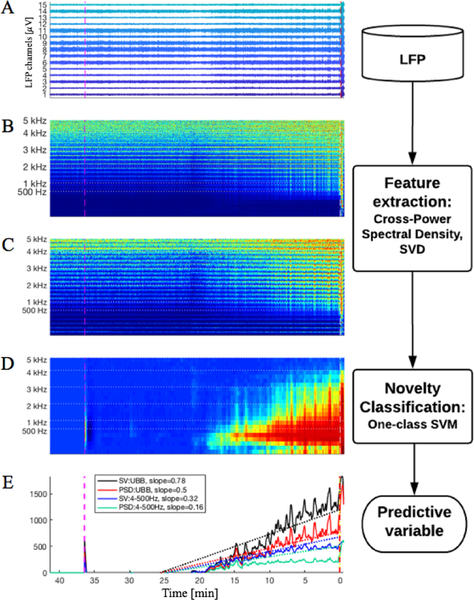
The proposed framework performs a sliding window analysis of the LFP to extract spectral features. This is done using a window size of 5 s with an overlap of 4 s. The flow diagram of the processes executed by the algorithm at each second are shown in Figure 1. For each window of LFP, the PSD is computed for all channels using Welch’s method. The PSD is then calculated over an ultra broad band comprised by 23 different frequency bands ranging from 4 Hz to 5 kHz. The selected bands include conventionally analyzed EEG bands (θ, α, β, γ, 80–250 Hz), then, bands are defined in intervals of 250 Hz, up to 5 kHz (i.e. {250–500 Hz, 500–750 Hz, ..., 4.75–5 kHz}).
Fig. 1.
Illustrates the process flow done by the algorithm. For all panels the pink line marks chemoconvulsant application, x-axis denotes time in minutes, the onset of the first seizure is marked at 0. A, shows the LFP recordings for all channels. B, illustrates the PSD across all frequencies. C, plots the Singular Values (SV) from the CSPD, for all frequency bands. D, shows the output of the one-class SVMs per frequency band. For D, the one-class SVM is trained using SV. In E, the sums of the SVM outputs are plotted in the four different configurations tested with their respective line fit. SV and PSD denote if the one-class SVM is trained using either the singular values or the PSD from each channel. UBB indicates if the sum is done over all 23 frequency bands, the ultra broad band (4 Hz – 5 kHz). Otherwise, the sum is done over the first 6 frequency bands (4 – 500 Hz).
To analyze the spectral content in all the recording channels simultaneously, a functional connectivity matrix is computed [15]. In this scheme each electrode is considered a node in a graph, any pair of electrodes is regarded as connected if there is dependent activity between these sites. In this study the connectivity matrix, A, is computed as the Cross-Power Spectral Density (CPSD) between all LFP channels for a particular frequency band, as done in [7]. The connectivity matrix A, is then computed for each of the 23 predefined frequency bands at each time second. This results in a sequence of matrices {A1(k),A2(k),...,A23(k)} at every instance k. Singular value decomposition of each connectivity matrix, A1,2,..,23(k) is performed. The singular values, σ, are an indicator of the time-varying connectivity in the epileptic network across all predefined frequency bands [7]. The closer all the singular values are to one another, the more disconnected the functional network is, and the larger the first few singular values are compared to the rest of the singular values, the more connected the network is. Finally, all singular values are used as the feature vector for the oneclass SVM.
D. Novelty Classification
A one-class SVM is implemented for novelty classification for each of the predefined frequency bands, in order to show which bands contain novel activity as compared to non-ictal baseline activity as the seizure onset approaches. The one-class SVM maps feature vectors to a higher dimensional space using a kernel function, to then provide an optimal separating boundary from the origin using a hyperplane. Thus, if a data point lies beyond the hyperplane it is considered a novel event. The output of the SVM is then the distance to the hyperplane, the greater the distance the more novel that feature vector is considered. The separating hyperplane is the solution to the following optimization problem:
| (2) |
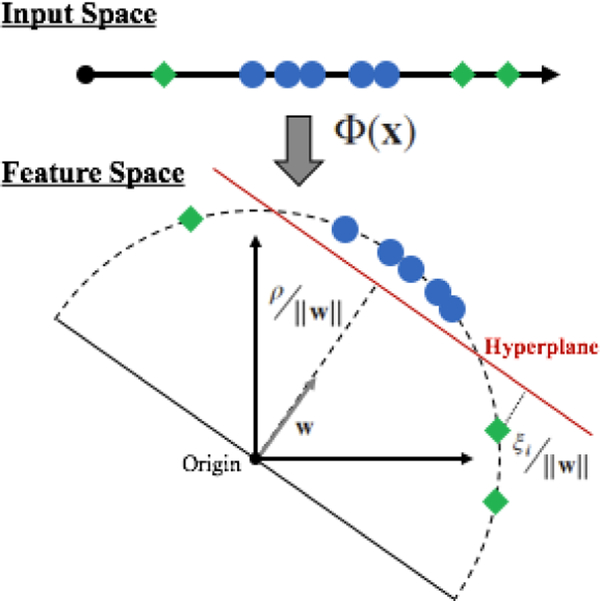
subject to the following constraints; . Where w is the normal vector to the hyperplane, ρ represents the margin, and ξ is the slack-variable. The hyperplane is then defined in feature space by w and ρ, as w·Φ(x) = 0. Which is mapped using a kernel function, k(xi,xj) = (Φ(xi), Φ(xj)). Throughout this study the Gaussian Radial Basis kernel function (RBF) is used since it can handle nonlinearities within the relation between feature vectors and its classification. Figure 2, illustrates an example of the one-class SVM using the RBF kernel.
Fig. 2.
Geometric representation of the one-class SVM using the RBF kernel. The distance between the hyperplane and the origin is given by , where w is the normal vector to the hyperplane. The distance between outliers and the hyperplane is given by the slack-variable .
For the one-class SVM the only control parameter is ν, which is an upper bound on the fraction of data points lying on the wrong side of the hyperplane, and a lower bound on the fraction of support vectors returned by the algorithm. Therefore, ν can be interpreted as the fraction of data points labeled as outliers. The control parameter was given a value of ν = 0.1, taking into consideration the length of the recordings and seizure duration.
For the one-class SVM the only control parameter is ν, which is an upper bound on the fraction of data points lying on the wrong side of the hyperplane, and a lower bound on the fraction of support vectors returned by the algorithm. Therefore, ν can be interpreted as the fraction of data points labeled as outliers. The control parameter was given a value of ν = 0.1, taking into consideration the length of the recordings and seizure duration.
Training of the one-class SVM is done with normalized feature vectors extracted from the 10 minutes of baseline activity. Then, the SVM is used as a novelty classifier at every instance after chemoconvulsant application until the end of the recording. A total of 23 one-class SVMs where used. One per predefined frequency band in order to output the novelty seen for the specified frequencies within each band. Finally, to reduce noisy behavior, the output of the SVM is smoothed using a Kalman filter as used in [16].
E. Performance Evaluation
To evaluate the performance of the proposed framework to derive a feature that continuously progresses towards seizure initiation, a simple novelty measure is computed from the output of the one-class SVMs. This novelty measure is obtained through the sum of SVM outputs across frequency bands. Four different novelty measures are evaluated to show which yields higher predictive power. Feature sets are given by: (i) the sum across all 23 bands of the predefined ultra broad band, (ii) the sum of only the first six bands (conventional frequency bands used for EEG analysis); and for each feature set, the SVM is trained using the network based spectral features (singular values of the CPSD) against using univariate features (PSD of each channel).
In order to evaluate which novelty measure yielded a better progression and linear increment trend towards seizure onset, a linear fit was applied to all four novelty traces. The linear fit is calculated using each novelty measure from time of chemoconvulsant application until 10 s after the seizure onset marking. The slope given by the linear fitting is averaged across subjects (N=5) and compared among configurations using a paired t-test in order to show statistical significance among the novelty measures dynamics.
III. RESULTS
For all experiments, the one-class SVMs outputs showed increasing activity well before the seizure onset in frequen-cies above 500 Hz, supporting the hypothesis that there is valuable information for seizure prediction between 500 Hz and 5 kHz. This was captured doing a multivariate analysis using network based features, where the functional connectivity matrix was computed using the CSPD for 23 different frequency bands across the UBB. The features were used to train a one-class SVM, a machine learning algorithm that computes a hyperplane to maximally separate training data from the origin in a higher dimensional space. The one-class SVM classifies feature vectors, its output is the distance of the datapoint to the hyperplane, the distance indicates the degree of novelty for that datapoint. Hence, when trained with non-ictal features it classifies preictal states as novel and seizure activity as extremely novel.
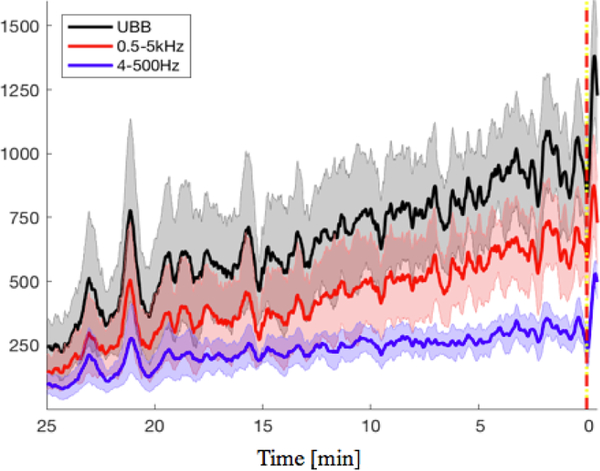
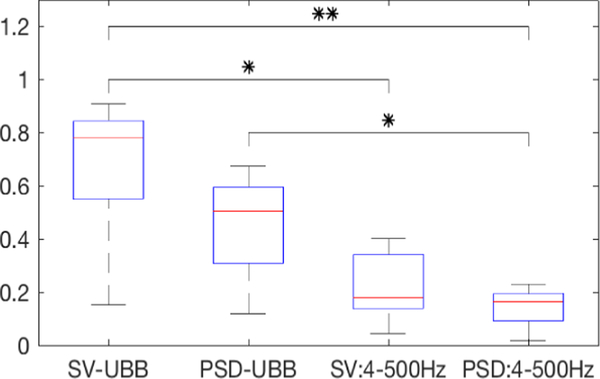
The sum of SVM outputs across frequency bands produced a novelty measure that shows a gradually increasing trend starting several minutes before the seizure onset until seizure termination. In Figure 3 the traces of the average of novelty measures across 4 experiments that had at least 25 min of preictal activity show how frequency bands above 500 Hz yield a novelty measure that monotonically increases towards seizure initiation. Figure 4 shows the distribution of the linear fit slopes applied to each of the novelty measures defined by input features. The novelty measure computed using singular values and SVM-output sum across all frequency bands in the UBB had the larger slopes overall. This input feature showed a statistically significant larger slope and faster increment trend over both novelty measures that only included the conventionally used frequency bands (4–500 Hz), with p = 0.005 and p = 0.016 respectively. Also, the use of PSD to train the one-class SVM, showed a statistically significant (p = 0.017) larger slope when using the sum of outputs across the UBB in comparison to when only the conventionally frequency bands.
Fig. 3.
Shows the traces of sums of the SVM outputs for four experiments. The trace starts 25 minutes before seizure onset, until 30 seconds after onset. The yellow/red line denotes the seizure onset at zero. In black, the sum of the SVM outputs across the whole UBB is shown. In red, the sum trace for frequency bands above 500 Hz, and in blue for frequency bands between 4 to 500 Hz. Shaded regions show the standard error mean of each trace.
Fig. 4.
Shows the slope distribution for the four different configurations tested. SV and PSD denote if the one-class SVM is trained using either the singular values from the CSPD or the PSD from each channel. UBB indicates if the sum is done over all 23 frequency bands, the ultra broad band (4 Hz – 5 kHz). Otherwise, the sum is done over the first 6 frequency bands (4 – 500 Hz).). For the paired t-test (N=5); *, ** denote statistical significance at p < 0.05 and p < 0.01 respectively.
IV. CONCLUSIONS
Singular values of the CPSD comprise an informative feature vector, that when used to train a one-class SVM, outputs a novelty measure of network behavior. This novelty measure shows a gradually increasing trend starting several minutes before the seizure onset until seizure termination.
The proposed framework still needs to be tested in chronic animal models and humans where spontaneous recurrent seizures appear in longer LFP recordings. However, it is clear that there is valuable neurophysiological information in the ultra broad band that can be used to derive a progressively increasing informative feature apt for designing closed-loop strategies for seizure control.
ACKNOWLEDGMENT
Daniel Ehrens is a Howard Hughes Medical Institute Gilliam Fellow. Sridevi V. Sarma is supported by NIH 1R21NS103113-01A1.
REFERENCES
- [1].Fisher RS, & Velasco AL (2014). Electrical brain stimulation for epilepsy. Nat Rev Neurol, 10(5):261–70. [DOI] [PubMed] [Google Scholar]
- [2].Ehrens D, Sritharan D, & Sarma SV (2015). Closed-loop control of a fragile network: application to seizure-like dynamics of an epilepsy model. Front Neurosci, 9, 58. [DOI] [PMC free article] [PubMed] [Google Scholar]
- [3].Nagaraj V, Lee ST, Krook-Magnuson E, Soltesz I, Benquet P, Irazoqui PP, & Netoff TI (2015). Future of seizure prediction and intervention: closing the loop. J Clin Neurophysiol, 32(3):194–206. [DOI] [PMC free article] [PubMed] [Google Scholar]
- [4].Schevon CA, Weiss SA, McKhann G, Goodman RR, Yuste R, Emerson RG, & Trevelyan AJ (2012). Evidence of an inhibitory restraint of seizure activity in humans. Nat Commun, 3(1):1060. [DOI] [PMC free article] [PubMed] [Google Scholar]
- [5].Jouny CC, & Bergey GK (2012). Characterization of early partial seizure onset: frequency, complexity and entropy. Clin Neurophysiol, 123(4):658–69. [DOI] [PMC free article] [PubMed] [Google Scholar]
- [6].Burns SP, Santaniello S, Yaffe RB, Jouny C, Crone N, Bergey G, Anderson WS, Sarma SV (2014). Network Dynamics of the Brain and Influence of the Epileptic Seizure Onset Zone. PNAS, 111(49):E5321–30. [DOI] [PMC free article] [PubMed] [Google Scholar]
- [7].Santaniello S, Burns SP, Golby AJ, Singer JM, Anderson WS, & Sarma SV (2011). Quickest detection of drug-resistant seizures: an optimal control approach. Epilepsy Behav, 22 Suppl 1, S49–60. [DOI] [PMC free article] [PubMed] [Google Scholar]
- [8].Ayoubian L, Lacoma H, & Gotman J. (2013). Automatic seizure detection in SEEG using high frequency activities in wavelet domain. Med Eng Phys, 35(3), 319–328. [DOI] [PMC free article] [PubMed] [Google Scholar]
- [9].Kramer MA, & Cash SS (2012). Epilepsy as a disorder of cortical network organization. Neuroscientist, 18(4):360–72. [DOI] [PMC free article] [PubMed] [Google Scholar]
- [10].Brinkmann BH, Wagenaar J, Abbot D, Adkins P, Bosshard SC, Chen M, Litt B, Worrell GA (2016). Crowdsourcing reproducible seizure forecasting in human and canine epilepsy. Brain, 139(6):1713–1722. [DOI] [PMC free article] [PubMed] [Google Scholar]
- [11].Kiral-Kornek I, Roy S, Nurse E, Mashford B, Karoly P, Carroll T, Payne D, Saha S, Baldassano S, O’Brien T, Grayden D, Cook M, Freestone D, Harrer S. (2018). Epileptic Seizure Prediction Using Big Data and Deep Learning: Toward a Mobile System. EBioMedicine, 27:103–11. [DOI] [PMC free article] [PubMed] [Google Scholar]
- [12].Cymerblit-Sabba A, & Schiller Y. (2010). Network dynamics during development of pharmacologically induced epileptic seizures in rats in vivo. J Neurosci, 30(5):1619–30. [DOI] [PMC free article] [PubMed] [Google Scholar]
- [13].Gardner AB, Krieger AM, Vachtsevanos G, Litt B. (2006). One-Class Novelty Detection for Seizure Analysis from Intracranial EEG. J Mach Learn Res, 7:1025–44. [Google Scholar]
- [14].Assaf F, & Schiller Y. (2016). The antiepileptic and ictogenic effects of optogenetic neurostimulation of PV-expressing interneurons. J Neurophysiol, 116(4):1694–1704. [DOI] [PMC free article] [PubMed] [Google Scholar]
- [15].Yaffe RB, Borger P, Megevand P, Groppe DM, Kramer MA, Chu CJ, Santaniello S, Meisel C, Mehta AD, Sarma SV (2015). Physiology of functional and effective networks in epilepsy. J Clin Neurophysiol, 126(2):227–36. [DOI] [PubMed] [Google Scholar]
- [16].Chisci L, Mavino A, Perferi G, Sciandrone M, Anile C, Colicchio G, & Fuggetta F. (2010). Real-Time Epileptic Seizure Prediction Using AR Models and Support Vector Machines. IEEE Trans Biomed Eng, 57(5):1124–32. [DOI] [PubMed] [Google Scholar]


