Abstract
Cancers develop as a result of driver mutations1,2 that lead to clonal outgrowth and disease evolution3,4. The discovery and functional characterization of individual driver mutations is a central aim of cancer research and has elucidated myriad phenotypes5 and therapeutic vulnerabilities6. Serial genetic evolution of mutant cancer genes7,8 and the allelic context in which they arise, however, is poorly understood in both common and rare cancer genes and tumor types. Here, we find that nearly 1 in 4 human tumors harbor a composite mutation of a cancer-associated gene, defined as two nonsynonymous somatic mutations in the same gene and tumor. Composite mutations are enriched in specific genes, have an elevated rate of utilization of less common hotspot mutations acquired in a chronology driven in part by oncogenic fitness, and arise in an allelic configuration that reflects context-specific selective pressures. Cis-acting composite mutations are hypermorphic in some genes, such as TERT, where dosage effects predominate, while they lead to selection of function in others such as TP53. Collectively, composite mutations are driver alterations that arise from context- and allele-specific selective pressures dependent in part on gene and mutation function leading to complex, often neomorphic functions of biological and therapeutic significance.
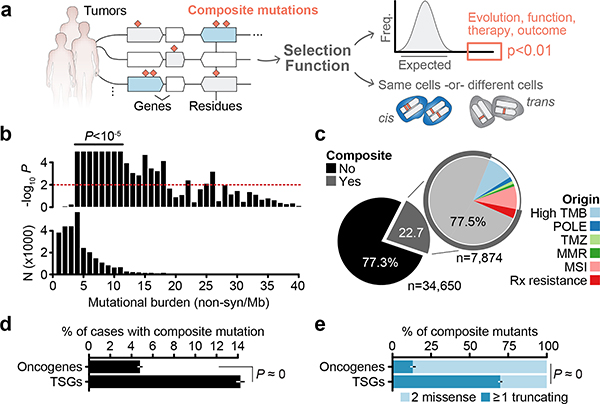
To study the pattern, prevalence, and function of composite mutations in cancer, hereafter defined as two or more distinct somatic mutations in the same gene and tumor specimen, we analyzed the germline blood and matched tumor tissue of 31,359 cancer patients in whom prospective clinical sequencing was performed to guide treatment decisions for advanced and metastatic disease (Fig. 1a, Extended Data Fig. 1a, Supplementary Table 1).
Fig. 1: Composite mutations in human cancers.
a) Schematic representation of composite mutation discovery and characterization. b) Top, statistically significant enrichment (P < 10−5) for composite mutations in tumors of increasing tumor mutational burden. Nominal P based on one-sided permutation tests for enrichment (100,000 permutations) applied independently to the subset of tumors with each indicated TMB (bottom, number of cases), n=30,505 biologically independent tumor samples with TMB ≤ 40. c) Proportion of composite mutations including the fraction ascribed to mutational processes associated with hypermutation (MSI, microsatellite instability; MMR, mismatch repair; TMZ, temozolomide-associated hypermutation; POLE, DNA polymerase epsilon-associated hypermutation; cases excluded from analysis unless otherwise noted). d) Percentage of cases with composite mutations by cancer gene function. P<10−308 (numeric limit, two-sided McNemar’s test; n=29,507 patients). e) Types of composite mutations by cancer gene function (P<10−308, numeric limit, two-sided Fisher’s exact test; n=5,954 composite mutations). Error bars in panels d-e are 95% binomial confidence intervals (CIs).
Selection for composite mutations
In total, 22.7% (n = 7,874) of tumors harbored at least one composite mutation, 56% more frequent than expected by chance when controlling for gene content and mutational burden (P < 10−5, see Methods; Extended Data Fig. 1b–c, Supplementary Table 2). Significantly more composite mutations arose than would be expected in cases of modest mutational burden (4–12 mutations/megabase, ~45% of all tumors, P < 10−5; Fig. 1b, Extended Data Fig. 1d), an enrichment that decreased in tumors of increasing mutational burden. As positive selection cannot be easily distinguished from the predominantly neutral impact of increasing mutational burden, high mutational burden tumors were considered biologically distinct and excluded from analysis (see Methods, Fig. 1c). Finally, we also found that known mechanisms of localized hypermutation explained few composite mutations overall (Extended Data Fig. 2).
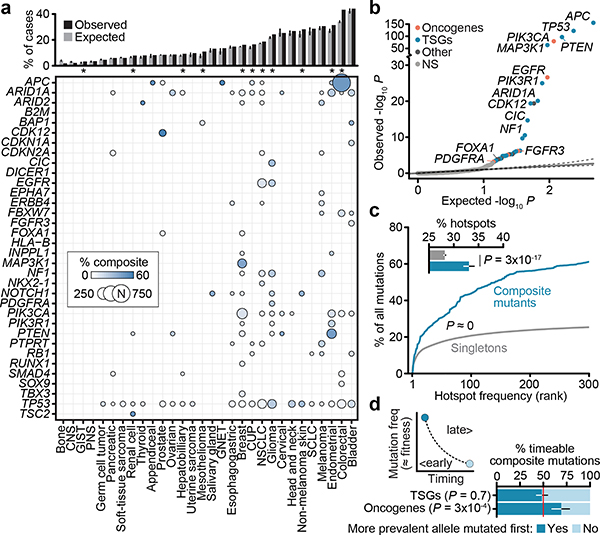
Composite mutations arose more frequently in tumor suppressor genes (TSGs) than in oncogenes (17.5 versus 6.7% of all mutations; P = 10−261, two-sample Z-test) (Fig. 1d). Furthermore, 70% of composite mutations in TSGs consisted of one or more truncating variants, compared to only 13% for oncogenes (Fig. 1e), suggesting biallelic loss drives the enrichment for composite mutations in TSGs. Lineage-specific patterns of driver mutations in individual cancers genes were, in part, reflected in the pattern of composite mutations pan-cancer (Fig. 2a and Extended Data Fig. 3a). This included a higher burden of composite mutations in PIK3CA in breast cancers, APC in colorectal cancers, CDK12 in prostate cancers, and EGFR in both lung cancers and gliomas among others. By contrast, not all significantly mutated genes had frequent composite mutations such as KRAS in multiple cancers or VHL in renal cell carcinomas, often reflecting serial genetic evolution by other means.
Fig. 2: Gene and residue-specific selective pressure for composite mutations.
a) Prevalence of composite mutations by affected gene and lineage (cancer types of >100 and ≥5 total and composite-mutant cases, n=31,563 samples). Top, percent of cases with composite mutations and the expected value based on cohort size and mutational burden. Expected values are the mean percentage of 10,000 random permutations for each lineage; bars, 95% CIs. b) The significance of enrichment for composite mutations in cancer genes (FDR-adjusted P values from one-sided binomial test for enrichment, n=26,997; light gray is not significant). c) Hotspot mutation utilization among composite and singleton mutations by decreasing population-level frequency (P<10−308, two-sided Mann–Whitney U test, n=93,616 and 2,920 singleton and composite missense mutations respectively in 25,037 patients). Inset, the percent of all missense mutations comprising composite and singleton mutants that were individually significant mutational hotspots. P, two-sided two-sample Z-test for equal proportions, n=105,297 total single-nucleotide variants, error bars are 95% binomial CIs. d) Right and left are the proposed and observed temporal order of acquisition of two functional variants in composite mutations in oncogenes (from mutation clonality). TSGs shown as a negative control. P, two-sided binomial test, error bars in all panels are 95% binomial CIs (n=336 evaluable composite mutations).
We next sought to determine whether individual cancer genes were enriched or depleted for composite mutations in individual genes, controlling for determinants of their background mutation rate (see Methods)9. In total, 34 genes were significantly enriched for composite mutations (Q < 0.01; Fig. 2b, Supplementary Table 3), including both TSGs such as APC, TP53, PTEN, and MAP3K1, and oncogenes, the most significant of which was PIK3CA (9.9% of all PIK3CA mutations were composite, 95% CI 9.0–10.9; Extended Data Fig. 3b). Other frequently mutated oncogenes were not enriched for composite mutations including IDH1, reflecting the requirement for heterozygosity in IDH-mutant cells to sustain adequate D-2HG production10 and KRAS, which may reflect selection against further detrimental oncogenic Ras activation8,11. Mutational recurrence alone cannot, therefore, predict whether a cancer gene is enriched for composite mutations.
Consistent with their selection, composite mutants were 2.5-fold more likely than individual mutations to include a hotspot—residues mutated in cancer more often than would be expected in the absence of selection12,13 (P ≈ 0, two-sample Z-test for equal proportion) (Fig. 2c). Composite mutations were notably absent of hotspots of greatest positive selection (e.g. KRAS G12, BRAF V600), but were instead prevalent among less common hotspots, suggesting selective pressure is greatest for weakly functional alleles. Based on differences in their clonality, in 69% of cases the more prevalent hotspot mutation (at the population level) preceded the less prevalent mutation in oncogenes (95% CI 59–78%, Fig. 2d), consistent with a model whereby the less prevalent allele synergizes with a more potent initial hotspot mutation. TSGs exhibited no such temporal ordering, reflecting how prevalence is poorly correlated with fitness for predominantly loss-of-function mutations. Together, these data indicate a strong mutant allele-specific selective pressure for composite mutations that evolve along a chronology driven in part by oncogenic fitness.
Phase and function
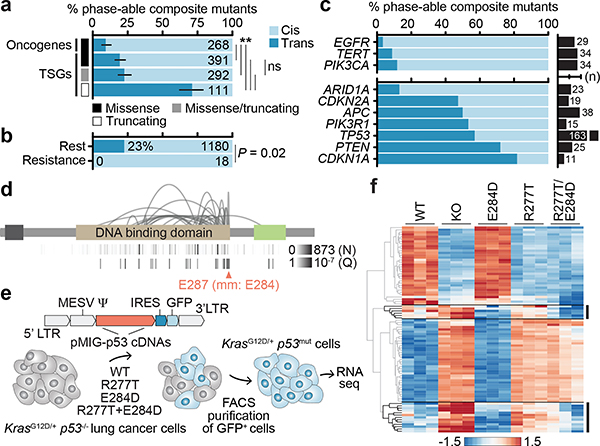
The elevated rate of likely driver mutations in composite mutants led us to investigate their allelic configuration. We combined sequencing read support with clonality to phase mutations, thereby ensuring composite mutations arose in the same tumor cell population. Among evaluable composite mutants, 67% and 19% arose in cis or trans respectively (n = 977 and 275), while 14% were indeterminate (n = 210). The higher rate of cis mutants reflected, in part, reduced sensitivity for detecting trans mutations from the short-read sequencing used here, an effect we controlled for in subsequent analyses (see Methods). TSGs were significantly more likely to harbor composite mutations in trans (71% in trans, n=79 of 111), especially those with two truncating mutations consistent with biallelic inactivation. By contrast, composite-mutant oncogenes with two missense mutations were largely cis-acting (91%, n=243 of 268; P = 3×10⁻³³, two-sided Fisher’s exact test) (Fig. 3a). Composite mutations involving silent mutations exhibited no such difference in phase among these genes, suggesting that cis mutant enrichment in oncogenes reflects selective pressure. Notably, while not precluding resistance in trans14, all identified secondary resistance mutations arose in cis15–17 (n=18; P = 0.02, two-sided Fisher’s test; Fig. 3b, Extended Data Fig. 4), suggesting exogenous selective pressures drive, in part, the phase of composite mutations.
Fig. 3: Cis- and trans-acting composite mutants.
The phase of composite mutations by their a) type and affected cancer gene (P for starred comparisons from left to right are 4×10⁻⁴, 2×10⁻⁵, 3×10⁻³³, 8×10⁻²⁴, 8×10⁻²⁴, and not significant was 0.3, two-sided Fisher’s exact test, n=1,062 evaluable composite mutations and error bars are 95% binomial CIs); b) association or not with acquired therapy resistance (P, two-sided Fisher’s exact test, n=1,198 evaluable composite mutations); c) affected individual oncogenes and TSGs (top and bottom, known or predicted functional mutations in ≥10 phase-able tumors, number of cases with phase-able composite mutations as indicated). d) The pattern of TP53 composite mutations with arcing lines indicating the position of pairs of mutations in ≥2 tumors; height corresponds to recurrence. At bottom, the number of mutated cases at each individual residue and the Q of significance (FDR-adjusted P value from one-sided binomial test) for each residue as arising in composite. TAD, transactivation domain; OD, oligomerization domain. e) Schematic of the experimental workflow for generating isogenic cells for phenotypic comparison of TP53 mutations. f) Heatmap of the top 30 differentially expressed genes between TP53R277T-, TP53E284D-, and TP53R277T-E284D-mutant cells.
Despite these patterns, extensive variability existed in the phase of composite mutations in individual cancer genes (Fig. 3c). EGFR, TERT, and PIK3CA had the highest percentage of cis composite mutations among oncogenes (88–97%). Remarkably, prevalent cis-acting composite mutations were observed even among canonical TSGs, comprising 77.1% of all composite mutations in these genes. Here, TP53 was notable as 43% of all phase-able composite mutations (n = 70 of 163) were cis-acting and enriched in a cluster of residues near the C-terminal end of the DNA binding domain (E287, E285, E271, and R280; Fig. 3d). While short-read sequencing technologies restricts phasing to variants within close physical proximity and potentially overestimates the prevalence of cis mutations, these data are nevertheless inconsistent with conventional loss-of-function via biallelic inactivation and may suggest a broader functional effect of composite mutations in TP53 and other TSGs.
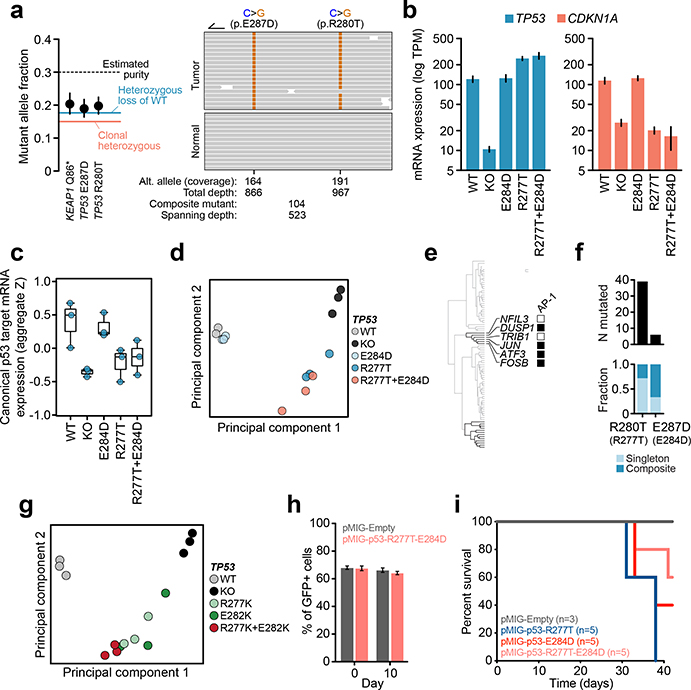
To assess the phenotypic consequence of cis-acting composite mutations in the DNA binding domain of TP53, we developed an isogenic system for acute TP53 reconstitution. As E287D was the most significant residue enriched for composite mutants, we focused on a representative TP53 R280T-E287D cis composite mutant. To model its impact in the lineage of affected tumors, we transduced KrasG12D p53−/− mouse lung cancer cells with GFP-labeled retroviral constructs encoding WT, R280T, E287D, or cis R280T-E287D p53 cDNAs (residues R277T and E284D in mice) after which GFP-expressing cells were selected and RNA sequencing was performed (Fig. 3e, Extended Data Fig. 5a, Supplementary Table 5). TP53 mRNA expression was stable and robust, while TP53−/−, TP53R277T, and TP53R277T-E284D led to a decrease in p21 (CDKN1A) induction, a surrogate marker of p53 functionality (Extended Data Fig. 5b–c). TP53E284D cells transcriptionally resembled TP53+/+, while TP53R277T cells resembled TP53−/− (Extended Data Fig. 5d). By contrast, TP53R277T-E284D cells had a mixed transcriptional phenotype, bearing a dominant differential expression signature equivalent to the one induced by either TP53R277T or TP53−/− while retaining a TP53E284D-like down-regulation of the AP-1 transcription factor program (Fig. 3f, Extended Data Fig. 5e). These data correlated with human tumor genomics, whereby null-like TP53 R280T was common, but TP53 E287D was rare and nearly always arose as a composite mutation (Extended Data Fig. 5f). A second cis-acting composite mutant (TP53R277K-E282K) similarly promoted a transcriptional program distinct from its constituent mutations (Extended Data Fig. 5g). Importantly, TP53R277T-E284D was not associated with increased growth in vitro or survival in vivo compared to the individual mutations (Extended Data Fig. 5h–i). Collectively, these data suggest that cis-acting TP53 composite mutations tune mutant p53 transcriptional phenotypes, leading to a selection of function absent from null-like single TP53 mutations.
Conditionally dependent mutant alleles
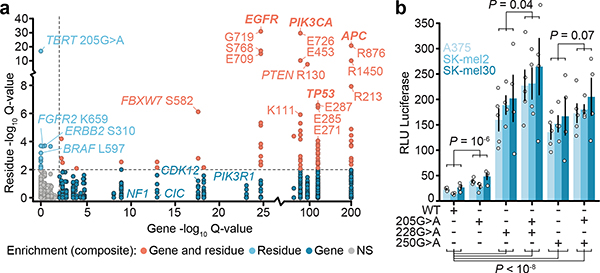
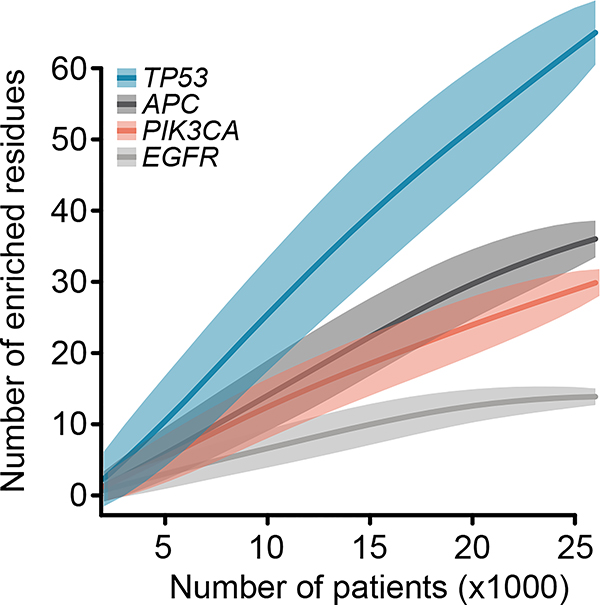
The residue-specific transcriptional phenotypes of TP53 composite mutants suggest broader allele-specific selection among composite mutations. We therefore identified individual alleles exhibiting an excess of composite mutations (see Methods). In total, 86 mutant residues in 24 cancer genes were enriched for arising as composite variants (Q < 0.01) (Fig. 4a, Supplementary Table 4). Nearly 70% of these mutations occurred in only four genes (TP53, PIK3CA, APC, and EGFR), with few reaching saturation for discovery at the current cohort size, and 56% also arising as individually significant hotspot mutations (Fig. 2b and Extended Data Fig. 6)13. As with TP53, several TSGs had mutant allele-specific enrichment that may suggest selection for something other than conventional loss-of-function. In PIK3CA, mutations enriched for composite mutants (E726, E453, K111, R108, R93) were nearly always in cis when phase-able and often arose through APOBEC-associated mutagenesis (Extended Data Fig. 7). Notably, composite PIK3CA mutations drive elevated PI3K activity, downstream signaling, cell proliferation, tumor growth, and may increase PI3K inhibitor sensitivity18, confirming that in addition to introducing passenger mutations, APOBEC and other mutational processes create numerous functional driver mutations.
Fig. 4: Mutant allele-specific enrichment for composite mutations.
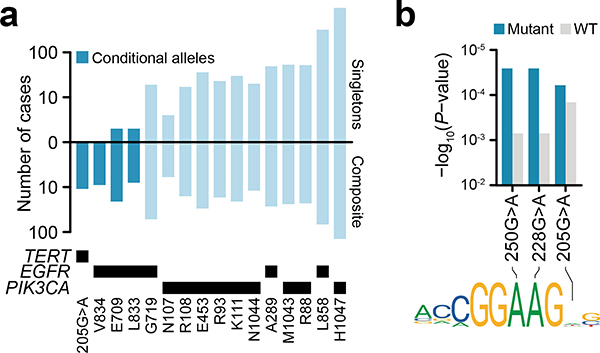
a) Enrichment significance of individual mutant residues arising in composite mutations (n=1,821 distinct mutant sites tested; n=155,241 variants overall) compared to significance of composite enrichment among genes (Q for mutant sites is FDR-adjusted one-sided Fisher’s exact test and Q for genes, refer to Fig. 2b). b) The degree of TERT expression induced by transient transfection of the indicated mutations individually or as cis composite in three melanoma cell lines. Shown is average and standard error (error bars) across n=4 or 5 replicates per allele. P, two-way ANOVA assessing expression as a function of genotype and baseline expression of each cell line (see Methods); at bottom, P<10−8 values from left to right are 3×10⁻⁹, 1×10⁻⁹, 2×10⁻⁹, and 2×10-11.
Multiple significant residues appeared to be conditional alleles, rarely arising without a second cis activating mutation (Extended Data Fig. 8a). Among these were EGFR-mutant residues (E709, V834, and L833)19 and the TERT promoter mutation 205G>A (Fig. 4a). TERT promoter mutations are common in human cancer20 and create novel GABPA binding sites that promote aberrant telomerase activity21. 205G>A was the sixth most common TERT promoter mutant and exclusively arose in cis (n = 13 of 13) with either the highly prevalent 228G>A or 250G>A hotspots which, despite their frequency, were never together in composite (Extended Data Fig. 8b). To test if 205G>A synergizes with existing promoter mutations to enhance TERT expression, we expressed constructs with a luciferase reporter engineered to contain various TERT promoter mutations alone or as cis composite mutants in three melanoma cell lines (A375, Sk-Mel2, and Sk-Mel30). TERT205G>A induced modest TERT expression compared to wildtype, but less than TERT228G>A or TERT250G>A alone. Consistently, TERT205G>A creates a novel motif that GAPBA binds with lower affinity than those created by canonical TERT hotspots (Extended Data Fig. 8c). The selective pressure for TERT205G>A is therefore likely based on the cooperativity of tandem motifs associated with it and canonical promoter hotspots bound by GABPA heterotetramer complexes21. When expressing TERT205G>A as a cis-composite with either TERT228G>A or TERT250G>A, thereby modeling the 205G>A-mutant human tumors, TERT expression increased relative to either mutation alone (Fig. 4b). These data suggest that 205G>A is hypermorphic, driving modestly elevated TERT expression that is weakly selected for and therefore does not arise as an individual hotspot mutation, but is instead a conditionally dependent composite allele.
Our results indicate that composite mutations are driver alterations whose selective advantage appears to be primarily determined by their allelic configuration and context. No single model explains the context-dependent phenotypic consequences of composite mutations. In some cancer genes whose function is dosage-dependent, cis-acting composite mutants are additive and arise predominantly in weakly oncogenic alleles and genes (e.g. PIK3CA22–24). This suggests an evolutionary model whereby the second mutation arises through selection for hypermorphic activity beyond the level sufficient for activation by the first allele. In other genes like TP53 whose phenotypic consequences are manifold, cis mutants seem to drive functional innovation. There, the evolutionary advantage consistent with our results is via tuning subtle phenotypic differences conferred by the asymmetric combination of the output of individual mutations. Mutant cancer genes must ultimately be considered, both biologically and clinically, in their allelic context, with implications for our understanding of cancer gene function, malignant phenotypes, and therapy.
Methods
Prospective sequencing cohort
Somatic mutation data consisted of 34,650 tumor and matched normal specimens from 31,359 patients with prospectively characterized solid cancers. All patients provided written informed consent and were prospectively sequenced as part of their active care at Memorial Sloan Kettering Cancer Center (MSKCC) between Jan. 2014 and Apr. 2019 as part of an Institutional Review Board-approved research protocol (NCT01775072). Details of patient consent, sample acquisition, sequencing and mutational analysis have been previously published25,26. Briefly, matched tumor and blood specimens for each patient were sequenced using MSK-IMPACT, a custom hybridization capture-based next-generation sequencing assay. All samples were sequenced with one of three incrementally larger versions of the assay encompassing 341, 410, and 468 cancer-associated genes, respectively. The study cohort consisted of tumors samples with one of 429 distinct cancer subtypes. For the purposes of grouping histological subtypes into primary cancer diagnosis, we utilized the OncoTree structured classification of disease (http://oncotree.mskcc.org). Histologic subtypes of fewer than 50 tumor samples were aggregated into a miscellaneous category and non-solid tumor types were excluded from the study cohort (as well as from analyses of The Cancer Genome Atlas data), resulting in a final cohort of 41 distinct tumor types.
Mutational data and annotation
Somatic nonsynonymous substitutions and small insertions and deletions (indels) were identified with a clinically validated pipeline as previously described26,27. Each mutation was classified as likely functional if it was previously reported as a mutational hotspot12,13 or was part of a cluster of spatially co-located residues that arose in physical proximity in the folded protein in three dimensions28. Truncating variants were considered likely functional if they arose in known tumor suppressor genes based on gene function curated by OncoKB29. Finally, any additional somatic mutations not satisfying the aforementioned criteria were similarly annotated as likely functional if previously curated via literature mining by OncoKB as oncogenic, likely oncogenic, or predicted oncogenic29.
For all composite mutants where one or both mutations were a known therapeutic target or known resistance mutation as defined by OncoKB levels 1–4, R1, or R2 alterations (annotation as of April 2019), each mutation was manually reviewed and classified as a likely resistance mutation based on the cancer type of the affected tumor sample, the existence of known resistance mutations to commonly-used targeted therapies indicated for the given cancer type, and if available, review of the clinical histories of affected patients. Composite mutations in which one mutation was an established second-site mutation (e.g. EGFR T790M in non-small cell lung cancer17 and AR mutations in prostate cancer mediating resistance to anti-androgen therapy) were always classified as resistance mutations. Notably, composite mutations in only 3.4% of cases in this advanced and post-treatment cohort have been associated with therapy resistance, indicating that prior therapy exposure alone cannot explain their prevalence. However, as detailed clinical histories including prior lines of treatment and response phenotypes were not available for all patients, a small number of composite mutations are likely misclassified as non-resistance-associated.
Mutational burden classification
Tumor samples were classified as hypermutated if they harbored either microsatellite instability/mismatch repair deficiency, DNA polymerase epsilon (POLE)-mediated ultra-mutation, or temozolomide (TMZ)-induced hypermutation30. Microsatellite instability (MSI) was considered present for any tumor with an MSISensor31 score of greater than or equal to 10 as previously clinically validated32. Tumor samples with POLE, MMR, and TMZ-induced hypermutation were identified by mutational signature decomposition analysis. Briefly, in each tumor specimen with 20 or more substitutions, the proportion of mutations attributable to each of 30 known somatic mutational signatures were calculated based on a basin-hopping algorithm (https://github.com/mskcc/mutation-signatures)33. This method uses the distribution of 96 unique trinucleotides generated by 6 possible C or T-normalized single-nucleotide substitutions (i.e. C>A, C>G, C>T, T>A, T>C, T>G) and their 5’ and 3’-adjacent bases to estimate the fraction of mutations attributed to each mutational signature in each specimen. Tumor specimens for which at least 20% of its substitutions were attributed to POLE (signatures 10 or 14), TMZ (signature 11), or MMR (signatures 6, 15, 20, 21, 26) were classified as hypermutated.
To classify tumor specimens with a high mutational burden compared to the majority of cancers of that type, but that otherwise lack one of these known mechanisms of hypermutation, we performed in each individual cancer type of greater than 50 tumor specimens 1-dimensional k-means clustering of the mutational burden of all tumors (nonsynonymous exonic mutations per Mb). Between 1 and 9 clusters were inferred to best describe the distribution of mutational burden per cancer type. The cluster of lowest mutational burden centered at 20+ mutations/Mb and accounting for <10% of the samples in tumor type established the threshold for high mutational burden, and all tumor specimens in this cluster or those clusters with higher mutational burden were considered high mutational burden.
Composite mutation identification and annotation
For the purposes of this analysis, a composite mutation was the occurrence of two or more somatic mutations to the same gene within a single sequenced tumor specimen. Carriers of pathogenic germline variants with a second somatic mutation were not considered here. We identified composite mutations as arising due to somatic hypermutation or high mutational burden of unknown etiology (as defined above), or a mechanism of resistance to targeted therapy per the aforementioned annotation in non-hypermutated tumors. Any composite mutation arising in a hypermutated tumor was considered separately and excluded from primary analyses unless otherwise noted. All composite mutations not meeting these criteria were analyzed further.
Population, gene, and residue-specific composite mutation enrichment testing
Multiple somatic mutations will accumulate in a gene in the absence of selection at a rate that correlates with the mutational burden and mutational mechanisms of a given tumor. Using a permutation-based framework, we simulated the burden of composite mutations for a given tumor mutation burden. Briefly, the true number of tumor specimens harboring a composite mutation was calculated (ntrue). We assembled an m x 2 matrix, where m is the total number of nonsynonymous somatic mutations in our cohort. Each row in the matrix identified the sample and the gene in which a particular mutation arose. We constructed a null distribution by randomly permuting the second column of this matrix 100,000 times, thereby preserving the mutation burden of each gene and each tumor specimen. Upon each iteration, the number of tumor specimens harboring a composite mutation was reassessed. An empirical p-value was calculated as the fraction of permutations satisfying ni ≥ ntrue. We used the same procedure for assessing the enrichment of composite mutations for tumor samples in ranges of specific mutational burdens.
To test for enrichment or depletion for composite mutations within cancer types (in cancer types with greater than 50 profiled tumors), we used a modified permutation analysis controlling for the underlying gene-specific tendency for mutated genes within each cancer type to harbor a composite. To do so, we defined a mutation event to be a tumor sample-mutated gene tuple. A mutation event (s,g) occurs when a tumor sample s was found to harbor one or more mutations to a gene g. Then, we implemented a permutation analysis that shuffles mutations across samples in a manner that preserves 1) gene mutation burden, 2) tumor sample mutation burden, and 3) the total number of mutation events that were observed in that cancer type using the permatswap function in the R package vegan34. This final constraint enforces that the number of non-zero entries in the mutation event matrix (the binary matrix of patients and genes) remains constant for each permutation. This constraint is particularly relevant in cancer types whose mutation burden is dominated by genes that are depleted of composite mutations (e.g. KRAS in pancreatic cancer, BRAF or KRAS in thyroid cancer).
We evaluated the enrichment of composite mutations in each gene by modeling composite mutation burden as a function of genomic covariates, testing the likelihood of the observed number of composite mutations (corresponding to the probability of observing this burden of composite mutations by chance) using a binomial test. To parametrize (the background rate of composite mutations in the absence of selection for each gene g), we estimated the expected number of composite mutated samples in a gene from the total number of samples with an observed mutation in the gene ns, such that . Dropping the superscript for clarity, was estimated for each gene using negative binomial regression to model the observed number of composite-mutant samples in a gene nc as a function of the global background rate of composite mutations across all genes, adjusted for multiple covariates per gene including its replication timing r, coding sequence length l, the percent of GC content g and the chromatin state of the gene h. Coding sequence length and percent of GC content were obtained from the Biomart community portal35 for Ensembl human reference genome GRCh37. For the purposes of statistical testing, the non-coding promoter region of TERT was added as a distinct unit (gene) for which we computed distinct values of percent GC content and length for the region targeted by the MSK-IMPACT assay design. Replication timing and chromatin state for each gene were obtained from previous estimates9. Additional covariates included the version of the MSK-IMPACT assay in which the gene was introduced i, and the average total DNA copy number of the gene across its mutated samples t. As the composite mutation rate for a gene depends on both the number of composite mutant tumors and the number of samples mutated (i.e. the exposure for the count of composite mutants), an offset term was added to the model that represents the log-number of tumor samples harboring mutations in the gene of interest. The observed number of composite mutant tumors for a gene was therefore modelled:
Using this model, we predicted the number of composite mutant tumors for each gene arising by chance , calculating the expected fraction of samples with a composite mutation (out of the total number of mutated samples) in each gene . We then used a binomial test to evaluate the null hypothesis that for each gene the observed number of composite mutations arose due to random chance. Here, we modeled the incidence of composite mutations per gene using a binomial distribution, and calculated the probability of ns tumor specimens harboring composite mutations in nc tumor specimens by chance given :
Our parameterization was estimated using nonsynonymous mutations, including those under positive selection in cancer (e.g. hotspots), which may reduce overall model sensitivity. We therefore evaluated one of multiple alternative parameterizations of , including using 1) nonsynonymous mutational data that excludes known hotspot mutations under selection, and 2) only synonymous mutations. Neither alternative parameterization produced a qualitatively distinct result for genes originally detected as significantly enriched but did increase the overall sensitivity of the test. To ensure appropriate control for potential false positive findings, we leveraged the parameterization from the complete dataset on nonsynonymous mutational data. Moreover, we observed no difference in the rate of synonymous mutations among genes that were either enriched for composite mutations or not (P = 0.2, Mann-Whitney U test), indicating there was little evidence for the accumulation of variants in the absence of selective pressure.
Finally, all unique individual mutant residues present in five or more non-hypermutated cases excluding known or likely resistance mutations were also assessed for the significance of their enrichment for arising as composite mutations. All missense, nonsense, splice-site, and translation start-site mutations at a given residue were included, as were unique mutant positions in the promoter of TERT and in-frame indels spanning known hotspots of clustered indels13. For each residue in a given gene, we assessed whether it arose as part of a composite mutation significantly more often than all other mutant residues in the same gene using a right-sided Fisher’s exact test. Mutant residues were considered significant at FDR-corrected Q < 0.01 (see below).
Attributing mutations to mutagenic processes
We attributed the individual variants that comprise composite mutations to a mutational origin using one of 30 established mutational signatures36,37. Mutational signature decomposition in each tumor was performed as described above and a signature was considered present if it accounted for five or more substitutions in the affected specimen (to ensure high confidence decompositions in targeted sequencing data with comparatively fewer mutations relative to broader-scale sequencing). Multiple signatures of the same etiology were merged by combining the frequency distribution of trinucleotide contexts (APOBEC signatures 2 and 13; MMR signatures 6, 15, 20, 21, and 26; Smoking-associated signatures 4, 18, 24, and 29). A substitution was attributed to a mutational signature present in a given case if the probability weight of the relevant trinucleotide exceeded 10%. For substitutions attributed to multiple signatures present in an affected tumor, it was attributed to the signature that was most frequently associated with the affected cancer type. To adjust for the non-specificity of trinucleotide context probabilities for smoking-associated signatures, C>A mutations regardless of trinucleotide context were considered smoking-associated in tumors for which mutational signature decomposition identified a smoking signature (in esophageal squamous and adenocarcinomas; head and neck squamous; hepatobiliary; hepatocellular; lung squamous, adenocarcinoma, and adeno-squamous, oral cavity, and renal cell carcinoma)38. Substitutions of a trinucleotide context of insufficient probability in any signature in an affected tumor was considered of ambiguous origin and not attributable while those mutations that could be attributed to aging and another signature present in a given tumor was considered non-separable and classified has being of multiple signatures.
Finally, we also considered several additional mechanisms that can drive site-specific mutation rates as potential sources of composite mutations39,40,41. First, we estimated the mutation rate within 1kb up- and downstream of all nucleosome dyads (obtained from https://bitbucket.org/bbglab/nucleosome-periodicity/src/master/) mapping to regions sequenced in the MSK-IMPACT panels. Having fit a spline to the mutation rate distribution, we calculated the full-width-half-maximum distances from the dyad and compared the rate of singleton and composite mutations within this region (Extended Data Fig. 2b). We conducted a similar analysis on the potential effect of active coding transcription factor binding sites (TFBSs) on composite mutations. We obtained the positions of active TFBS in coding regions of the genome via integration with DHS binding sites in human melanocytes following an established procedure40. The mutation rate within 1kb of these active TFBS were inferred using TCGA cutaneous melanoma samples from the TCGA MC3 dataset to increase the total number of mutations among melanoma samples. We then assessed the proximity of singleton and composite mutations to the elevated mutation rate at TFBS sites as described for nucleosome dyads (Extended. Data Fig. 2).
To investigate the effect of APOBEC3A-mediated mutagenesis, we obtained the position of the optimal stem-loop DNA structure favored by APOBEC3A from published sources41. We investigated the overlap of such optimal sites with those mutant alleles enriched for arising as a composite mutation. In total, only 1 of 86 significant residues enriched for arising as composite mutations was at the position of the optimal APOBEC3A substrate (ARID1A S2264). Finally, we compared the rate of composite mutations involving known hotspot mutations as described above with those derived from an orthogonal method optimized to reduce false positive mutations due to site-specific mutagenesis42. Controlling for overlapping gene content, there was no difference between the proportion of composite mutations involving hotspot mutations based on the origin of the hotspot mutations [percent and 95% CI are: 9.6 (9.2–10) versus 10 (9.6–10.5), P = 0.2, two-sample Z-test], indicating no excess of false positive hotspots due to site-specific mutagenesis are driving the results described here.
Phasing composite mutations
The allelic configuration of composite mutations (phase), in cis (arising on the same allele) or in trans (arising on different alleles), was inferred primarily from sequencing read support. Briefly, for each pair of somatic mutations in a composite mutant, all reads spanning the relevant loci were re-aligned to the reference genome (hg19) by pairwise sequence alignment using a Needleman-Wunsch algorithm43. The number of unique reads supporting both wildtype alleles (AB), both mutant alleles (ab), or a mixture of mutant and wildtype alleles (aB, Ab) were subsequently tabulated. For the purposes of the present study, composite mutations were classified in cis when: 1) three or more spanning reads supported both mutant alleles (ab ≥ 3), and 2) at least one of these variants was called by two or fewer spanning reads that called the other variant as wildtype (aB ≤ 2 | Ab ≤ 2). Composite mutations were classified in trans when: 1) each variant was supported by three or more reads that were simultaneously wildtype for its partner mutation (aB ≥ 3 and Ab ≥ 3), and 2) two or fewer reads called both mutant alleles (AB ≤ 2), and 3) the mutations arose in the same tumor cell population based on their cancer cell fractions (CCFs, see above). We note that there is an inherent difference in the sensitivity of detection for cis and trans variants, specifically that trans variants must satisfy at least two read-support positive criteria (aB ≥ 3 and Ab ≥ 3) and are required to be in the same cell, whereas cis variants require only a single positive criterion (ab ≥ 3) without any constraint of evidence for arising in the same cell. This difference in sensitivity for detection likely explains, to some extent, the increased number of cis relative to trans composite mutations. To determine the effect of this sensitivity bias, we also phased variants with at least one synonymous mutation. We observed no difference in the rate of synonymous composite mutations in oncogenes versus tumor suppressors (5% vs 7%, P = 0.2, Mann-Whitney U test), in contrast to the significant difference in nonsynonymous composite mutations (14% vs 35%, P <10−6). To control for differences in the sensitivity of detection of cis and trans mutations, analyses of the effects of allelic configuration on composite mutations compared the relative fraction of cis/trans mutations between two defined groups (e.g. oncogenes vs. TSGs).
We additionally inferred the phase of select composite mutants associated with therapeutic resistance mutations in regions of clonal loss of heterozygosity [(copy-neutral-) LOH]. Composite mutants spanned by LOH were assumed in cis if the spanning locus had a minor copy number of zero and a total copy number of one or more (LOH via heterozygous loss, copy-neutral LOH, or the latter combined with subsequent genomic gains) inferred from the aforementioned purity-corrected integer copy number data from FACETS. These must also have arisen in the same tumor cell population as estimated from CCFs (as described above) and their observed mutant allele frequencies (MAFs) were approximately equal to the expected MAFs for a given copy number state in a cis allelic configuration (95% CIs of the observed MAF overlap the expected MAF of the given copy number configuration, controlling for tumor purity). Composite mutations not satisfying any of the aforementioned conditions were not able to be unambiguously phased.
As with other short-read sequencing data, our phasing approach is limited by the requirement that any two mutations arise within sufficient physical proximity in the genome to be spanned by common aligned sequencing reads. While the higher depth of sequencing coverage in our targeted clinical sequencing platform (~700-fold median in the tumor samples) does increase the likelihood of sequencing a fragment of tumor DNA encompassing both somatic mutations, and improves the quantification of CCFs by reducing measurement error8, this limitation cannot be overcome with short-read sequencing.
Assessing cellular context and molecular timing
We estimated the clonality of all somatic mutations in each affected tumor specimen (the cancer cell fraction or CCF) as described previously using the FACETS framework8. To ensure conservative estimates, all somatic mutations were conservatively assumed to have arisen on the major (more common) allele, thus minimizing the possibility of overestimating the CCF. To determine if the constituents of a composite mutation arose in the same cell, we defined a criterion based on the confidence intervals (CIs) of the CCF. Specifically, if the sum of the lower 95% CIs for each mutation CCF summed to greater than 1, the two somatic mutations in the same gene and tumor specimen were considered to exist within the same cancer cell population. If either of the two somatic mutations were clonal (the upper 95% CI overlapped 1), then both mutations were considered to have arisen in the same tumor cell population.
We inferred the chronological order of two somatic mutations in each composite mutation based on their estimated CCFs. Any mutations previously associated with acquired resistance to targeted therapies were excluded, as these will arise after the originating sensitizing lesion and skew results. Only composite mutations determined to arise in the same tumor cell population (based on the sum of CCFs, described above) were considered and required previous evidence establishing both mutations as candidate functional driver mutations individually. The 95% CI of the CCFs of both mutations were inferred as previously described44. If the lower 95% CI was greater than the upper bound of the other variant, then the first mutation was determined to have a greater clonality, and therefore to have arisen first in the tumor. Similarly, if the upper 95% CI of a mutation was less than the lower bound of the other mutation in the composite, it was considered to have arisen second. If the 95% CIs of CCFs of the two mutations in the composite overlapped, or if there was not sufficient evidence that the two mutations existed in the same cancer cell population in the affected tumor specimen, we considered their chronology to be indeterminate.
TP53 composite mutation analysis and validation studies
For the generation of MSCV-p53-IRES-GFP constructs (pMIG-p53 cDNAs), methods were as follows. Fragments encoding wildtype, single, or composite mutant p53 cDNAs were obtained from IDT or SGI-DNA and cloned into pMIG (Addgene #9044) using standard restriction enzyme-based methods. Briefly, p53 cDNAs were amplified using primers that add BglII and EcoRI restriction sites on the 5’ and 3’ regions, respectively, and subsequently digested and cloned into linearized pMIG backbone harboring BglII and EcoRI cloning overhangs. All constructs were sequence-verified using Sanger sequencing. Primer sequences are available in Supplementary Table 5.
HEK293T (ATCC CRL-3216) cells were obtained from ATCC. Murine KrasG12D/+;Trp53−/− (KP) lung adenocarcinoma (LUAD) cells were provided by the Jacks laboratory 45. All cells were maintained in a humidified incubator at 37°C with 5% CO2 and grown in DMEM supplemented with 10% FBS and 100 IU/ml penicillin/streptomycin. For virus production, 7.5 million HEK293T cells were plated in 15cm plates the day before transfection. The following day cells were transfected with 10ug pMIG-p53 cDNA (or pMIG-Empty as control) and 10ug of pCL-Eco (Addgene #12371) using 50uL of lipofectamine 2000 (ThermoFisher). Twenty-four hours following transfection media was replaced with fresh DMEM. Two rounds of virus were harvested (at 48 and 72hrs post-transfection), pooled, and kept at 4°C until used for cell transduction. One million KP LUAD cells were seeded in 10cm plates and immediately transduced with retroviral supernatants and 8ug/mL polybrene. Cells were grown for 48hrs before purifying using fluorescence activated cell sorting (FACS). All transductions were done in triplicate. Following transduction, stable GFP+ populations were purified by FACS on a FACSAria (BD Biosciences). 120hrs post-transduction, total RNA was isolated using the RNeasy Mini Kit (Qiagen) following standard manufacturer protocols.
Purified polyA mRNA was subsequently fragmented and first and second strand cDNA synthesis performed using standard Illumina mRNA TruSeq library preparation protocols. Double-stranded cDNA was subsequently processed for TruSeq dual-index Illumina library generation. For sequencing, pooled multiplexed libraries were sequenced on NextSeq instrumentation in high-output mode, generating approximately 12 million 76bp single-end reads per replicate condition. The resulting RNA sequencing data was analyzed by first trimming adaptor sequences using Trimmomatic46. Sequencing reads were aligned to GRCm38.p5(mm10) using STAR47, and genome-wide transcript quantification was performed using featureCounts48. After removing transcripts with fewer than eight aligned reads (low undetected expression at given library size, n=9848 transcripts retained), differentially expressed genes were identified using DESeq2, with a cutoff of absolute log2FoldChange ≥ 1 and adjusted P < 0.01 between experimental conditions49. Mouse genes were mapping to human homologs using gene homologies provided by the Mouse Genome Database (MGD) Project50. Principal components analysis was performed with output from DESeq249. For fluorescent competition assays, FACS-purified KP LUAD cells stably transduced with either pMIG-Empty or pMIG-p53-R277T-E284D were mixed ~60:40 with untransduced parental cells and cultured in vitro for 10 days. The percentage of GFP+ cells was monitored over time using a Guava easyCyte HT flow cytometer (Millipore).
All mouse experiments were approved by the MSKCC Internal Animal Care and Use Committee. No pre-specified sample size was required, and 5 or 10 mice per condition were utilized. Mice were maintained under specific pathogen-free conditions and food and water were provided ad libitum. Mice (Hsd:Athymic Nude-Foxn1nu, abbreviated Nu/Nu) were purchased from Envigo (stock #069). For experiments involving orthotopic transplantation of KrasG12D/+;Trp53−/− lung adenocarcinoma (KP LUAD) cells, 100,000 cells stably transduced with either empty vector (pMIG-Empty) or p53 mutant cDNAs (pMIG-p53-R277T, pMIG-p53-E284D, or pMIG-p53-R277T-E284D) were resuspended in 200uL of PBS and tail vein injected into 6–8 week old Nu/Nu female mice. These stable cell populations were generated and FACS-purified as described above, and injected 120hrs post-transduction.
TERT promoter mutation analysis and validation
TERT promoter mutations present in five or more patients, accounting for multiple samples per patient, were assessed for co-occurrence and mutual exclusivity among composite mutations via two-sided Fisher’s exact test. A pair of somatic mutations with P < 0.01 were considered co-occurring (or mutually-exclusive) if their log odds ratio was greater (or less) than zero. To predict the affinity for GABPA to bind TERT promoter mutant alleles, 31-bp DNA sequences for wildtype or mutant TERT centered on each of 205G>A, 228G>A, and 250G>A (chr5:1295205G>A) mutations were extracted and generated by editing the appropriate base. The position frequency matrix for GABPA binding profiles in humans was acquired from JASPAR201851 (Matrix ID: MA0062.1), and scores quantifying the predicted affinity of GABPA for each TERT promoter sequence were calculated using TFBSTools52. Only binding site motifs overlapping the relevant locus in each of the wildtype and mutant sequence were retained. P-values quantifying the likelihood of a GABPA binding site in each sequence to arise by chance were calculated using TFMPvalue53.
To assess the effect of TERT promoter composite mutations on TERT expression, A375, Sk-Mel2, and Sk-Mel30 melanoma cell lines were obtained (kindly provided by Rosen and Merghoub laboratories). pGL4.0-TERT WT, G228A, and G250A plasmids were provided by the Costello laboratory (Addgene plasmids #84924, #84926, #84925)21. pGL4.0-TERT G205A, G205A/G228A, and G205A/G250A plasmids were generated using Q5 Site-Directed mutagenesis kit (NEB, E0554S). All plasmids were verified using Sanger sequencing. Thereafter, 1 × 10⁴ cells from A375, Sk-Mel2, and Sk-Mel30 were seeded into each well of 96-well plates. Cells were transiently transfected with pGL4.0-empty vector (Promega), TERT WT, or mutant plasmids (180ng/well) along with pGL4.74[hRluc/TK] Vector (18ng/well, Promega) as internal control using Lipofectamine 3000 (Thermo Fisher). Dual luciferase activity measurement was performed 48 hours after transfection using the Dual-Luciferase Reporter Assay System (Promega) following the manufacturer’s instructions. The firefly luciferase activity of individual wells was normalized relative to Renilla luciferase activity. Experiments were performed in biological tetraplicates or pentaplicates. To quantify the effect of a specific TERT variant, we compared individual genotypes (e.g. G205A to WT) using linear models of Luciferase expression, where we controlled for the baseline telomerase expression of each cell line, i.e. luc ~ variant + cell line + constant where variant is a binary term encoding the presence/absence of a genotype (relative to the chosen reference), and cell line is a factor introduced to control for the contribution of each cell line’s baseline expression. All cell lines utilized for either the TERT or TP53 functional validation experiments were authenticated by short tandem repeat analysis and confirmed negative for mycoplasma.
Statistical analyses and figures
All statistical analyses were performed using the R statistical programming environment (version 3.5.0). Figures were generated using either base R or the ggplot2 library. Error bars indicate the 95% binomial CIs calculated using the Pearson-Klopper method, unless otherwise noted. CIs for the down-sampling analysis were calculated using the loess.sd function from the msir library. P-values for the difference in proportions were calculated using Fisher’s exact test or two-sample Z-tests, unless otherwise noted. P-values were corrected for multiple comparisons using the Benjamini-Hochberg method and reported as Q-values when applicable.
Data and code availability
All mutational data from the prospective sequencing cohort is available at http://download.cbioportal.org/composite_mutations_maf.txt.gz. Mutational data from The Cancer Genome Atlas was acquired from https://gdc.cancer.gov/about-data/publications/pancanatlas. RNA sequencing data were deposited in the GEO with accession number GSE136295. All other genomic and clinical data accompanies the manuscript and is available as Extended Data and Supplementary Information. All other materials are available upon request from the authors. Source code for these analyses is available at https://github.com/taylor-lab/composite-mutations.
Extended Data
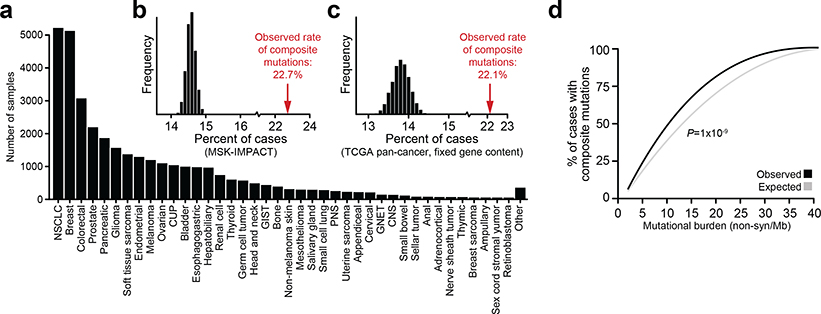
Extended Data Fig. 1: Study cohort and rates of composite mutations.
a) Distribution of cancer types in the study cohort. b) The rate of composite mutations (22.7% of all tumors) compared to a simulated background rate (black, P = 10−5 from one-sided permutation test for enrichment with 100,000 random permutation-based simulations (no permutation exceeded observed value). c) The observed rate of composite mutations in the primary untreated cancers of The Cancer Genome Atlas cohort (n=10,908 solid tumors) when controlling for gene content for consistency with the targeted sequencing panel of the prospective cohort studied here. In black, null distribution from sampling (see Methods). d) The observed and expected rate of composite mutations in tumors of the indicated tumor mutational burden (as in Fig. 1b, n=30,505 biologically independent tumor samples with TMB 40, P = 1×10⁻⁹ from two-sided Wilcoxon signed-rank test.
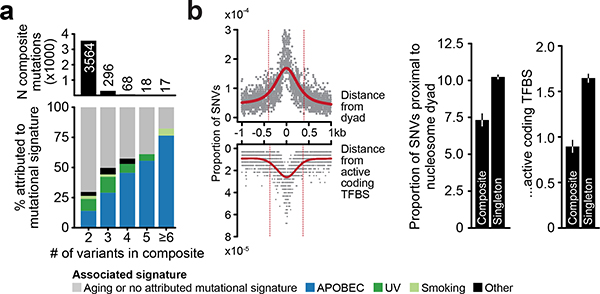
Extended Data Fig. 2: Sources of local hypermutation.
a) The number of composite mutations comprised of two or more constituent variants (top) and the distribution of likely causative mutational signatures among them (bottom, see legend). Composite mutants comprised of greater than three mutations were increasingly produced by APOBEC-associated mutagenesis indicative of localized hypermutation54,55, but accounted for a minority of events cohort-wide. b) Left, the somatic mutational data in the study cohort reflected the elevated mutation rates previously observed at both the positions closest to the nucleosome dyad as well as DNA bound to active transcription factor binding sites39,40. However, mutations arising in composite events were proportionally less often proximal to such sites (defined here as within the full width at half maximum of the peak of mutation rate (red) than were singleton mutations (right, P = 10−27 and 10−47, respectively; two-sided two-sample Z-test, n=323,883 single-nucleotide substitutions arising in 471 biologically distinct melanoma samples).
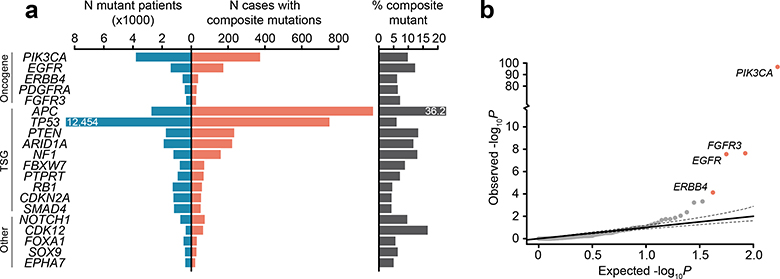
Extended Data Fig. 3: Number and distribution of composite events across genes.
a) The number and percent of cases in the study cohort harboring composite mutations in the indicated genes (right) juxtaposed to their overall mutation rate (left). Shown are the genes with a significant enrichment of composite mutations (Q < 0.01, FDR-adjusted P values from one-sided binomial test for enrichment, n=26,997, as in main text Fig. 2b), limited to the top 10 genes by significance in each category of gene function unless fewer. b) The significance of enrichment for composite mutations (n and statistical tests as described above and in main text Fig. 2b) limited to 168 oncogenes.
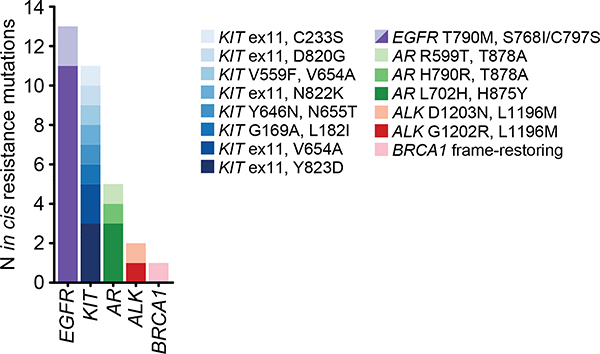
Extended Data Fig. 4: Cis composite secondary resistance mutations.
The cis composite mutations classified as arising in post-treatment specimens due to acquired resistance to one of several molecularly targeted therapies in the study cohort.
Extended Data Fig. 5: Phenotypic characterization of TP53 composite mutants.
a) TP53 R270T-E287D mutant lung adenocarcinoma. Left, mutant allele fractions of clonal TP53 mutations consistent with loss of WT TP53 (error bars, 95% binomial CIs). Expected mutant allele fractions of different copy number states are shown as horizontal lines. Mutant KEAP1 in the same tumor (with LOH) is shown for reference. Right, spanning reads indicating cis mutations. b) Right and left, TP53 and CDKN1A mRNA expression in KrasG12D/+ p53Mut mouse lung cancer cells expressing distinct p53 genotypes. Bars, average of three replicates, error bars are 95% confidence intervals. c) The aggregate Z-score per replicate for the mRNA expression of canonical p53 target genes [n=3 replicates per allele; box center is median, edges are 25 and 75% quartiles, whiskers are minima/maxima of the most extreme values]. d) Principal component analysis (PCA) of the transcriptomes of TP53 genotypes (n=3 replicates shown per condition). e) Dendrogram as in main text Fig. 3f indicating the genes of interest [effectors of the AP-1 transcription factor network (PID_AP1_PATHWAY; Q = 1.4e-7 based on mSigDB’s computed overlap with n=5,501 gene sets from the curated C2 collection)]. f) The prevalence of TP53 R280T and E287D mutations (top) and the fraction arising as composite mutants (bottom). In parentheses, corresponding mouse alleles. g) PCA of the transcriptomes of the TP53 R277K-E282K composite mutation genotypes (as in panel d, n=3 replicates per allele). h) The percentage of GFP+ FACS-purified KP LUAD cells stably transduced with pMIG-Empty or pMIG-p53-R277T-E284D and cultured in vitro for 10 days in a 60:40 mixture with untransduced parental cells (bar indicates mean, error bars are standard deviation, n=3 independent infections). i) Overall survival of the indicated genotypes stably transduced in FACS-purified KP LUAD cells (n=100,000 cells) and injected into the tail vein of immuno-compromised mice.
Extended Data Fig. 6: Saturation analysis of genes for composite mutation detection.
Down-sampling indicates the number of residues identified as enriched for arising in composite mutations in each of four genes (Q < 0.1, FDR-adjusted one-sided Fisher’s exact tests as in Fig. 4a; n=1,000 – 26,997 patients per down-sample) as a function of the number of tumors sequenced (loess fit is shown with 95% confidence interval). Four genes shown that accounted for the greatest proportion of all enriched residues detected (main text Fig. 4a). EGFR appears to reach saturation for discovery of residues enriched for arising in composite, whereas the other genes have not yet reached saturation for discovery at the current cohort size.
Extended Data Fig. 7: Mutational signature attribution among composite mutations.
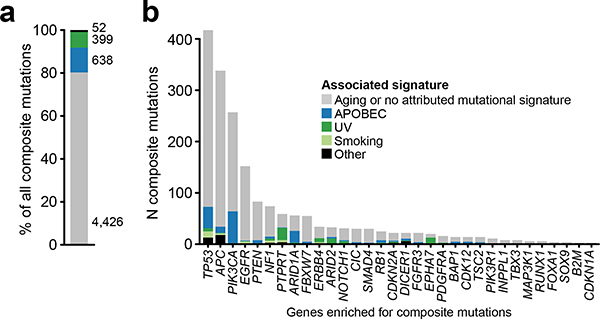
a) The fraction of all composite mutations identified here in which one or both individual mutations could be unambiguously attributed to an established mutational signature. The majority of composite variants could not be directly attributed to APOBEC, UV, smoking, or other known mutational signatures. b) The fraction of composite mutations per gene in which one or both variants could be attributed to an established mutational signature.
Extended Data Fig. 8: Conditional mutant alleles.
a) The number of affected cases harboring each of the indicated somatic mutations in TERT, EGFR, or PIK3CA as either individual mutations (top) or as part of composite mutants (bottom). Conditional mutations were defined as those statistically enriched for arising as part of composite mutations, but seldom as individual hotspot mutations in cancer (predominantly accompanied by a second somatic mutation). b) The incidence of TERT promoter mutations and the fraction arising as composite mutations (orange). Bottom, the co-occurrence and mutual exclusivity of composite mutations in the TERT promoter (Ps for annotated tiles are: five, 0.002; six, 3×10⁻⁷; zero, 1×10⁻²⁵; two-sided Fisher’s exact test, n=29,507 patients). c) Transcription factor GABPA binding affinity for mutant and wildtype TERT promoter sequences at the 228G>A, 250G>A and the conditional 205G>A allele.
Supplementary Material
Supplementary Table 1: The cancer types in the study cohort.
Supplementary Table 2: Composite mutations identified here.
Supplementary Table 3: Genes significantly enriched for composite mutations.
Supplementary Table 4: Mutant residues significantly enriched for composite mutations.
Supplementary Table 5: Primer and cDNA sequences for wildtype and mutant TP53.
Acknowledgements
We thank the members of the Reznik and Taylor laboratories for discussion and support. This work was supported by National Institutes of Health awards P30 CA008748, P01 CA087497 (S.W.L.), U54 OD020355 (S.W.L., B.S.T.), R01 CA207244 (B.S.T.), R01 CA204749 (B.S.T.), R01 CA245069 (B.S.T.); Brown Performance Group ICI Fund (N.V. and E.R.), Society of MSK (N.V. and E.R.). American Cancer Society, Anna Fuller Fund, and the Josie Robertson Foundation (B.S.T.). F.J.S.-R. is an HHMI Hanna Gray Fellow supported in party by an MSKCC Translational Research Oncology Training Fellowship (T32-CA160001). S.W.L. is an investigator of the Howard Hughes Medical Institute.
Competing Interests
N.V. reports advisory board activities for Novartis and consulting activities for Petra Pharmaceuticals. M.S. has received research funding from Puma Biotechnology, Daiichi-Sankio, Immunomedics, Targimmune, and Menarini Ricerche; is a cofounder of Medendi.org; and is on the advisory boards of the Bioscience Institute and Menarini Ricerche. S.W.L. is a founder and scientific advisory board member of Oric Pharmaceuticals, Mirimus, Inc., and Blueprint Medicines; and is on the scientific advisory boards of Constellation Pharmaceuticals, Petra Pharmaceuticals, and PMV Pharmaceuticals. B.S.T. reports receiving honoria and research funding from Genentech and Illumina and advisory board activities for Boehringer Ingelheim and Loxo Oncology, a wholly owned subsidiary of Eli Lilly, Inc. All stated activities were outside of the work described herein. The other authors declare no competing interests.
Footnotes
Additional information
Extended data is available online.
Supplementary information is available online.
References
- 1.Vogelstein B et al. Cancer genome landscapes. Science 339, 1546–1558 (2013). [DOI] [PMC free article] [PubMed] [Google Scholar]
- 2.Garraway LA & Lander ES Lessons from the cancer genome. Cell 153, 17–37 (2013). [DOI] [PubMed] [Google Scholar]
- 3.Cairns J Mutation selection and the natural history of cancer. Nature 255, 197–200 (1975). [DOI] [PubMed] [Google Scholar]
- 4.Nowell PC The clonal evolution of tumor cell populations. Science 194, 23–28 (1976). [DOI] [PubMed] [Google Scholar]
- 5.Hanahan D & Weinberg RA Hallmarks of cancer: the next generation. Cell 144, 646–674 (2011). [DOI] [PubMed] [Google Scholar]
- 6.Hyman DM, Taylor BS & Baselga J Implementing Genome-Driven Oncology. Cell 168, 584–599 (2017). [DOI] [PMC free article] [PubMed] [Google Scholar]
- 7.Knudson AG Mutation and cancer: statistical study of retinoblastoma. Proc. Natl. Acad. Sci. USA 68, 820–823 (1971). [DOI] [PMC free article] [PubMed] [Google Scholar]
- 8.Bielski CM et al. Widespread selection for oncogenic mutant allele imbalance in cancer. Cancer Cell 34, 852–862.e4 (2018). [DOI] [PMC free article] [PubMed] [Google Scholar]
- 9.Lawrence MS et al. Mutational heterogeneity in cancer and the search for new cancer-associated genes. Nature 499, 214–218 (2013). [DOI] [PMC free article] [PubMed] [Google Scholar]
- 10.Jin G et al. Disruption of wild-type IDH1 suppresses D-2-hydroxyglutarate production in IDH1-mutated gliomas. Cancer Res. 73, 496–501 (2013). [DOI] [PMC free article] [PubMed] [Google Scholar]
- 11.Mueller S et al. Evolutionary routes and KRAS dosage define pancreatic cancer phenotypes. Nature 554, 62–68 (2018). [DOI] [PMC free article] [PubMed] [Google Scholar]
- 12.Chang MT et al. Identifying recurrent mutations in cancer reveals widespread lineage diversity and mutational specificity. Nat. Biotechnol 34, 155–163 (2016). [DOI] [PMC free article] [PubMed] [Google Scholar]
- 13.Chang MT et al. Accelerating discovery of functional mutant alleles in cancer. Cancer Discov. 8, 174–183 (2018). [DOI] [PMC free article] [PubMed] [Google Scholar]
- 14.Intlekofer AM et al. Acquired resistance to IDH inhibition through trans or cis dimer-interface mutations. Nature 559, 125–129 (2018). [DOI] [PMC free article] [PubMed] [Google Scholar]
- 15.Hidaka N et al. Most T790M mutations are present on the same EGFR allele as activating mutations in patients with non-small cell lung cancer. Lung Cancer 108, 75–82 (2017). [DOI] [PubMed] [Google Scholar]
- 16.Gainor JF et al. Molecular Mechanisms of Resistance to First- and Second-Generation ALK Inhibitors in ALK-Rearranged Lung Cancer. Cancer Discov. 6, 1118–1133 (2016). [DOI] [PMC free article] [PubMed] [Google Scholar]
- 17.Kobayashi S et al. EGFR mutation and resistance of non-small-cell lung cancer to gefitinib. N. Engl. J. Med 352, 786–792 (2005). [DOI] [PubMed] [Google Scholar]
- 18.Vasan N et al. Double PIK3CA mutations in cis increase oncogenicity and sensitivity to PI3Kα inhibitors. Science 366, 714–723 (2019). [DOI] [PMC free article] [PubMed] [Google Scholar]
- 19.Chen Z et al. EGFR somatic doublets in lung cancer are frequent and generally arise from a pair of driver mutations uncommonly seen as singlet mutations: one-third of doublets occur at five pairs of amino acids. Oncogene 27, 4336–4343 (2008). [DOI] [PubMed] [Google Scholar]
- 20.Huang FW et al. Highly recurrent TERT promoter mutations in human melanoma. Science 339, 957–959 (2013). [DOI] [PMC free article] [PubMed] [Google Scholar]
- 21.Bell RJA et al. Cancer. The transcription factor GABP selectively binds and activates the mutant TERT promoter in cancer. Science 348, 1036–1039 (2015). [DOI] [PMC free article] [PubMed] [Google Scholar]
- 22.Berenjeno IM et al. Oncogenic PIK3CA induces centrosome amplification and tolerance to genome doubling. Nat. Commun 8, 1773 (2017). [DOI] [PMC free article] [PubMed] [Google Scholar]
- 23.Kinross KM et al. An activating Pik3ca mutation coupled with Pten loss is sufficient to initiate ovarian tumorigenesis in mice. J. Clin. Invest 122, 553–557 (2012). [DOI] [PMC free article] [PubMed] [Google Scholar]
- 24.Madsen RR et al. Oncogenic PIK3CA promotes cellular stemness in an allele dose-dependent manner. Proc. Natl. Acad. Sci. USA 116, 8380–8389 (2019). [DOI] [PMC free article] [PubMed] [Google Scholar]
Methods-only References
- 25.Hyman DM et al. Precision medicine at Memorial Sloan Kettering Cancer Center: clinical next-generation sequencing enabling next-generation targeted therapy trials. Drug Discov. Today 20, 1422–1428 (2015). [DOI] [PMC free article] [PubMed] [Google Scholar]
- 26.Cheng DT et al. Memorial Sloan Kettering-Integrated Mutation Profiling of Actionable Cancer Targets (MSK-IMPACT): A Hybridization Capture-Based Next-Generation Sequencing Clinical Assay for Solid Tumor Molecular Oncology. J Mol Diagn 17, 251–264 (2015). [DOI] [PMC free article] [PubMed] [Google Scholar]
- 27.Zehir A et al. Mutational landscape of metastatic cancer revealed from prospective clinical sequencing of 10,000 patients. Nat. Med 23, 703–713 (2017). [DOI] [PMC free article] [PubMed] [Google Scholar]
- 28.Gao J et al. 3D clusters of somatic mutations in cancer reveal numerous rare mutations as functional targets. Genome Med. 9, 4 (2017). [DOI] [PMC free article] [PubMed] [Google Scholar]
- 29.Chakravarty D et al. Oncokb: A precision oncology knowledge base. JCO Precis. Oncol 2017, (2017). [DOI] [PMC free article] [PubMed] [Google Scholar]
- 30.Campbell BB et al. Comprehensive analysis of hypermutation in human cancer. Cell 171, 1042–1056.e10 (2017). [DOI] [PMC free article] [PubMed] [Google Scholar]
- 31.Niu B et al. MSIsensor: microsatellite instability detection using paired tumor-normal sequence data. Bioinformatics 30, 1015–1016 (2014). [DOI] [PMC free article] [PubMed] [Google Scholar]
- 32.Middha S et al. Reliable Pan-Cancer Microsatellite Instability Assessment by Using Targeted Next-Generation Sequencing Data. JCO Precis. Oncol 2017, (2017). [DOI] [PMC free article] [PubMed] [Google Scholar]
- 33.Alexandrov LB, Nik-Zainal S, Wedge DC, Campbell PJ & Stratton MR Deciphering signatures of mutational processes operative in human cancer. Cell Rep. 3, 246–259 (2013). [DOI] [PMC free article] [PubMed] [Google Scholar]
- 34.Dixon P VEGAN, a package of R functions for community ecology. Journal of Vegetation Science 14, 927–930 (2003). [Google Scholar]
- 35.Smedley D et al. The BioMart community portal: an innovative alternative to large, centralized data repositories. Nucleic Acids Res. 43, W589–98 (2015). [DOI] [PMC free article] [PubMed] [Google Scholar]
- 36.Forbes SA et al. COSMIC: exploring the world’s knowledge of somatic mutations in human cancer. Nucleic Acids Res. 43, D805–11 (2015). [DOI] [PMC free article] [PubMed] [Google Scholar]
- 37.Alexandrov LB et al. Signatures of mutational processes in human cancer. Nature 500, 415–421 (2013). [DOI] [PMC free article] [PubMed] [Google Scholar]
- 38.Alexandrov L et al. The repertoire of mutational signatures in human cancer. BioRxiv (2018). doi: 10.1101/322859 [DOI] [Google Scholar]
- 39.Pich O et al. Somatic and Germline Mutation Periodicity Follow the Orientation of the DNA Minor Groove around Nucleosomes. Cell 175, 1074–1087.e18 (2018). [DOI] [PubMed] [Google Scholar]
- 40.Sabarinathan R, Mularoni L, Deu-Pons J, Gonzalez-Perez A & López-Bigas N Nucleotide excision repair is impaired by binding of transcription factors to DNA. Nature 532, 264–267 (2016). [DOI] [PubMed] [Google Scholar]
- 41.Buisson R et al. Passenger hotspot mutations in cancer driven by APOBEC3A and mesoscale genomic features. Science 364, (2019). [DOI] [PMC free article] [PubMed] [Google Scholar]
- 42.Hess JM et al. Passenger hotspot mutations in cancer. Cancer Cell 36, 288–301.e14 (2019). [DOI] [PMC free article] [PubMed] [Google Scholar]
- 43.Needleman SB & Wunsch CD A general method applicable to the search for similarities in the amino acid sequence of two proteins. J. Mol. Biol 48, 443–453 (1970). [DOI] [PubMed] [Google Scholar]
- 44.McGranahan N et al. Clonal status of actionable driver events and the timing of mutational processes in cancer evolution. Sci. Transl. Med 7, 283ra54 (2015). [DOI] [PMC free article] [PubMed] [Google Scholar]
- 45.Dimitrova N et al. Stromal Expression of miR-143/145 Promotes Neoangiogenesis in Lung Cancer Development. Cancer Discov. 6, 188–201 (2016). [DOI] [PMC free article] [PubMed] [Google Scholar]
- 46.Bolger AM, Lohse M & Usadel B Trimmomatic: a flexible trimmer for Illumina sequence data. Bioinformatics 30, 2114–2120 (2014). [DOI] [PMC free article] [PubMed] [Google Scholar]
- 47.Dobin A et al. STAR: ultrafast universal RNA-seq aligner. Bioinformatics 29, 15–21 (2013). [DOI] [PMC free article] [PubMed] [Google Scholar]
- 48.Liao Y, Smyth GK & Shi W featureCounts: an efficient general purpose program for assigning sequence reads to genomic features. Bioinformatics 30, 923–930 (2014). [DOI] [PubMed] [Google Scholar]
- 49.Love MI, Huber W & Anders S Moderated estimation of fold change and dispersion for RNA-seq data with DESeq2. Genome Biol. 15, 550 (2014). [DOI] [PMC free article] [PubMed] [Google Scholar]
- 50.Bult CJ et al. Mouse genome database (MGD) 2019. Nucleic Acids Res. 47, D801–D806 (2019). [DOI] [PMC free article] [PubMed] [Google Scholar]
- 51.Khan A et al. JASPAR 2018: update of the open-access database of transcription factor binding profiles and its web framework. Nucleic Acids Res. 46, D260–D266 (2018). [DOI] [PMC free article] [PubMed] [Google Scholar]
- 52.Tan G & Lenhard B TFBSTools: an R/bioconductor package for transcription factor binding site analysis. Bioinformatics 32, 1555–1556 (2016). [DOI] [PMC free article] [PubMed] [Google Scholar]
- 53.Touzet H & Varré J-S Efficient and accurate P-value computation for Position Weight Matrices. Algorithms Mol Biol 2, 15 (2007). [DOI] [PMC free article] [PubMed] [Google Scholar]
- 54.Supek F & Lehner B Clustered Mutation Signatures Reveal that Error-Prone DNA Repair Targets Mutations to Active Genes. Cell 170, 534–547.e23 (2017). [DOI] [PubMed] [Google Scholar]
- 55.Nik-Zainal S et al. Mutational processes molding the genomes of 21 breast cancers. Cell 149, 979–993 (2012). [DOI] [PMC free article] [PubMed] [Google Scholar]
Associated Data
This section collects any data citations, data availability statements, or supplementary materials included in this article.
Supplementary Materials
Supplementary Table 1: The cancer types in the study cohort.
Supplementary Table 2: Composite mutations identified here.
Supplementary Table 3: Genes significantly enriched for composite mutations.
Supplementary Table 4: Mutant residues significantly enriched for composite mutations.
Supplementary Table 5: Primer and cDNA sequences for wildtype and mutant TP53.
Data Availability Statement
All mutational data from the prospective sequencing cohort is available at http://download.cbioportal.org/composite_mutations_maf.txt.gz. Mutational data from The Cancer Genome Atlas was acquired from https://gdc.cancer.gov/about-data/publications/pancanatlas. RNA sequencing data were deposited in the GEO with accession number GSE136295. All other genomic and clinical data accompanies the manuscript and is available as Extended Data and Supplementary Information. All other materials are available upon request from the authors. Source code for these analyses is available at https://github.com/taylor-lab/composite-mutations.


