Abstract
RNA molecules play many pivotal roles in a cell that are still not fully understood. Any detailed understanding of RNA function requires knowledge of its three-dimensional structure, yet experimental RNA structure resolution remains demanding. Recent advances in sequencing provide unprecedented amounts of sequence data that can be statistically analyzed by methods such as direct coupling analysis (DCA) to determine spatial proximity or contacts of specific nucleic acid pairs, which improve the quality of structure prediction. To quantify this structure prediction improvement, we here present a well curated data set of about 70 RNA structures of high resolution and compare different nucleotide–nucleotide contact prediction methods available in the literature. We observe only minor differences between the performances of the different methods. Moreover, we discuss how robust these predictions are for different contact definitions and how strongly they depend on procedures used to curate and align the families of homologous RNA sequences.
Keywords: direct coupling analysis, multiple sequence alignment, RNA contact prediction, RNA structure prediction
INTRODUCTION
RNA molecules play fundamental roles in a large variety of processes within cells. For example, messenger RNAs (mRNAs) carry the genetic information akin to blueprint for protein synthesis, transfer RNA (tRNA) then carry specific amino acids during protein synthesis to the site of protein elongation (Elliott and Ladomery 2016). More recently other tasks of RNA were identified, such as non-coding RNAs (ncRNAs) fulfilling fundamental roles in the control of gene expression (Wilusz et al. 2009; Cech and Steitz 2014) or small interference RNAs (siRNAs) and micro RNAs (miRNAs) that can regulate and repress the expression of target genes by interfering with the transcriptional regulation (Fire et al. 1998; Bartel 2009).
Long noncoding RNAs (lncRNAs) also contribute to these modulation mechanisms even if they are less understood. Metabolite-binding RNA structures called riboswitches that belong to the 5′ untranslated regions (5′-UTR) of the mRNA bind selectively and with high affinity to small molecules, and this binding induces major conformation rearrangements of the three-dimensional structure of the riboswitches. The two competing conformations can inhibit or activate the expression of the target gene by interfering with the translation regulation. The study of lncRNAs is of particular high interest as they are frequently involved in pathogenic mechanisms and thus can be targeted for therapeutic strategies (DiStefano 2018).
To truly understand the molecular mechanisms of lncRNAs and their function, it is important to know their three-dimensional structure. Experimental techniques to determine the 3D structure include “classical” methods such as X-ray diffraction crystallography or nuclear magnetic resonance (NMR), which provide direct structural information. Other methods do not directly provide structural information but have first to be carefully interpreted (e.g., small-angle scattering [SAXS] [Weiel et al. 2019] or fluorescence resonance energy transfer [FRET] [Reinartz et al. 2018]). Yet in spite of considerable progress of experimental techniques, the number of structurally resolved RNA structures collected in public databases (Berman et al. 2000; Narayanan et al. 2013) is still small due to experimental limitations and considerably lags the number of known RNA sequences.
Computational methods contributed substantially to deciphering how RNA structure and dynamics determine its functions (Zuker and Stiegler 1981; Aigner et al. 2012; Pucci and Schug 2019). A series of computational tools have been developed to predict RNA structures from their sequences using different approaches that can be roughly divided into fragment-based, physics-based, and comparative modeling (Das and Baker 2007; Ding et al. 2008; Parisien and Major 2008; Flores and Altman 2010; Rother et al. 2011; Popenda et al. 2012; Zhao et al. 2012; Cheng et al. 2015; De Leonardis et al. 2015; Krokhotin et al. 2015; Biesiada et al. 2016; Boniecki et al. 2016; Zhao et al. 2017). Their performances are improving as one can see from the results of the three RNA-puzzle rounds (Cruz et al. 2012; Miao et al. 2015, 2017), where a set of experimentally resolved 3D structures has been blindly predicted.
Recent investigations (De Leonardis et al. 2015; Weinreb et al. 2016; Wang et al. 2017) have shown that the performances of these methods can be substantially improved by using information extracted from multiple sequence alignment (MSA) of families of homologous RNAs. Improvements are achieved by identifying top-ranked site-pairs with stronger coevolutionary signals and using them as distance constraints in modeling tools.
Thanks to the advancement of next-generation sequencing technologies, the huge and increasing amount of sequence data available can be fully exploited to study and model RNA structures. In this article, we set up a manually curated data set of about 70 RNA structures with a high resolution and evaluate the performances of different contact prediction methods on this set. Moreover, we analyze the impact on their performances of important features such as the effective number of homologous RNA sequences that are available, the nucleotide–nucleotide contact definition and the procedure used to construct, align and curate the MSA.
RESULTS
Assessing the performance of DCA-based methods
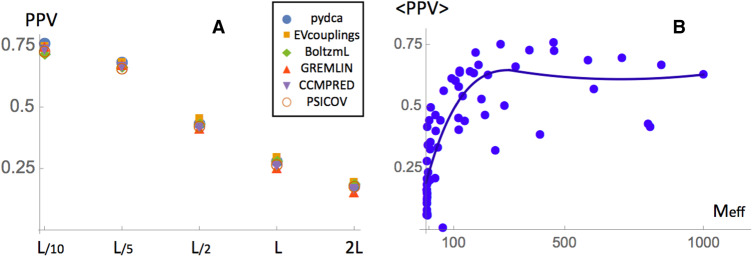
In this section we compare the performance of the prediction methods tested, namely the mean-field of pydca (Zerihun et al. 2020), EVcouplings (Weinreb et al. 2016), Boltzmann learning (Cuturello et al. 2020), GREMLIN (Kamisetty et al. 2013), CCMpred (Seemayer et al. 2014), and PSICOV (Jones et al. 2012). In Figure 1A we report the positive predicted values (PPVs) on the data set D as a function of the number of contacts. Here we are considering all contacts in the PDB structures that are distant from the sequence more than 4 nt.
FIGURE 1.
(A) Prediction performances of the different methods analyzed in this paper measured by PPV as a function of the number of top scoring contacts. All contacts that are separated along the sequence by at least 4 nt are considered. (B) Averaged PPV of all prediction methods as a function of the effective number of sequences Meff.
The performance based on PPV are generally quite good. We find a PPV of the order of 75% for the top L/10 contacts that goes smoothly down to 25% if one considers the top L contacts. Among all methods no statistically significant differences can be observed, as measured from the Kolmogorov–Smirnov test of the different prediction results. A slightly more accurate performance for a small number of contacts can be observed for pydca and GREMLIN for L/10 number of contacts, while at L/2 contacts the EVcouplings is a few percent more accurate than other predictors (see Table 1).
TABLE 1.
Performance of the DCA-based methods analyzed on the different data sets
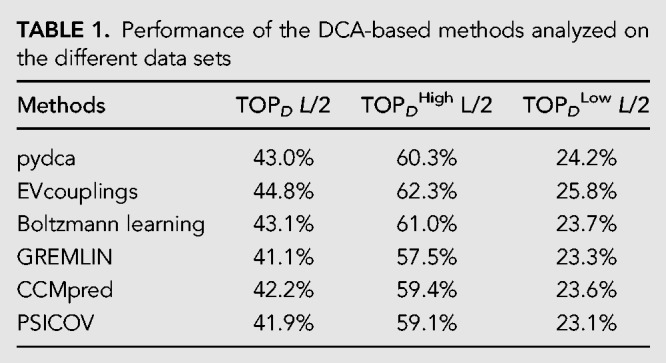
When performances are evaluated on DHigh, that is, the set of PDBs associated to RFAM families with Meff ≥ 70, we observe higher PPV equal to about 60% (at L/2) in contrast to a PPV of 26% in the DLow set in which only families with Meff < 70 are considered (see Table 1; Fig. 2).
FIGURE 2.
Prediction performances of the methods on the DHigh and DLow data sets. Only contacts that are separated along the sequence of at least 4 nt are considered here.
In Figure 1B we investigate how performances are related to Meff by plotting the average PPV rate of different methods versus the Meff of the given RFAM family. We observe a clear growth of the prediction accuracy up to Meff values equal to about 200 while above that threshold the performance only increases slightly. Typically around Meff ≈ 300, there is only minuscule or no further increase of accuracy for a larger number of effective sequences. For Meff > 300, both additional information and noise are added to the MSA canceling each other. As a check of this behavior we compare the performances of pydca on the full RFAM families and on a randomly chosen subset composed of 1/3 of their entries. The ratio of their PPVs as a function of the Meff of the reduced family subsets is plotted in Supplemental Figure S1. For subsets with a reduced Meff < 100, the addition of information improved the method's performance as expected; above that threshold it is not trivial to find a conclusive statement due to the limited amount of data: The addition of sequences has a minor effect on the performance and can improve or decrease them.
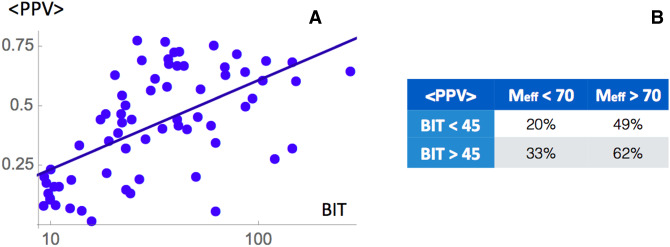
Performances are not only related to the Meff of RFAM families but also from how well the target sequences align to them. In order to check this dependence in Figure 3A we plotted the averaged PPV as a function of the BIT value computed from Infernal, a score measuring the probability of the query sequence to match the covariance model. We observe a linear relation between these two quantities. To check the effect of both Meff and the BIT score, we first divided each of DHigh and DLow into two subsets considering only the entries with BIT scores higher or lower than 45. Then we computed the performances in each of the four subsets and we found a stronger impact of the number of effective sequences with respect to the BIT score (Fig. 3B)
FIGURE 3.
(A) Averaged PPV of all prediction methods as a function of the BIT score value for the chosen RFAM family. (B) Table of comparison for PPV as influenced by different values of Meff and BIT score.
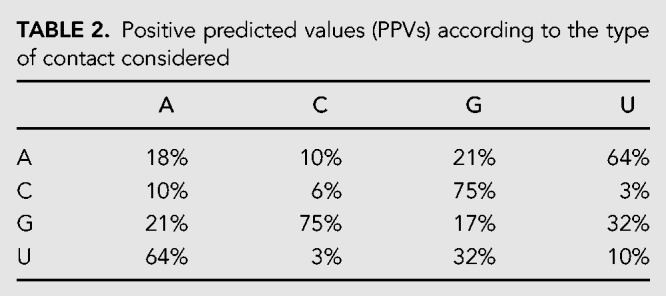
We also analyzed in detail which type of contacts are better predicted. In Table 2 we report the PPV for different nucleotide pairs and we can clearly see that C:G and A:U, which (mainly) correspond to canonical base pairs, are usually well predicted with a PPV of 75% and 65%, respectively. These larger fractions of true positives with respect to other contacts can be expected since the physical interaction between them is stronger and as a consequence also the coevolutionary signal. Note that the fact that C:G pair is more stable than A:T could be related to the slight difference between their prediction accuracy. There are, however, also noncanonical pairs that are relatively well predicted, even if to a much less extent, such as the G:U pairs with a PPV of 32%.
TABLE 2.
Positive predicted values (PPVs) according to the type of contact considered
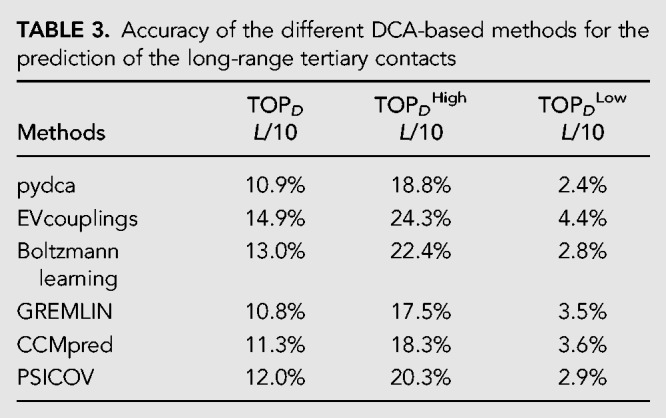
To assess more in depth the ability of the DCA methods to predict the more challenging non-WC long-range 3D contacts, which give important information regarding the three-dimensional structure of RNA molecules, we repeat the analysis shown above but exclude from the experimental RNA map all contacts that are in 5 × 5 windows centered at any WC base pairs.
In Table 3 we report the PPV for this type of contacts at L/10 numbers of contacts. We can immediately observe that the values are much smaller than in the case in which all residues are considered. There is essentially no signal in the DLow set while for DHigh the PPV is between 20% and 25% with the plmDCA method EVcouplings that reaches the best performance.
TABLE 3.
Accuracy of the different DCA-based methods for the prediction of the long-range tertiary contacts
Finally, we test the computational efficiency of different methods by assessing their runtime for the complete set of RNA structures. We ran all tests on an Intel i7-7700 four-core processor using all eight threads available.
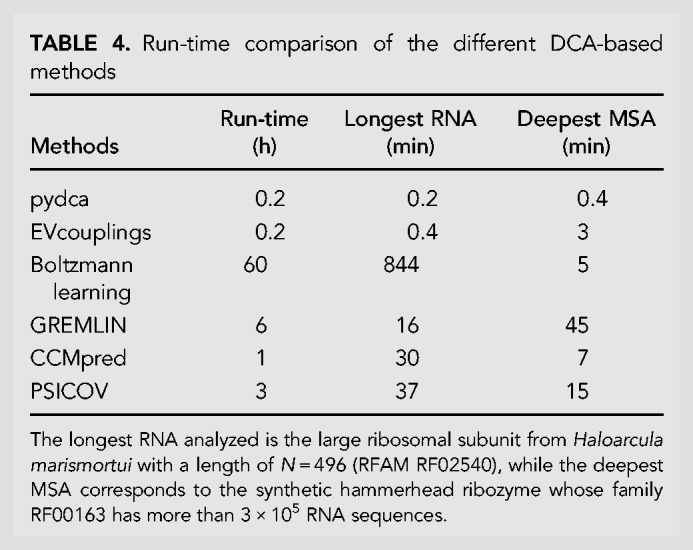
As we can see from Table 4, the mean-field DCA in pydca and EVcouplings are the fastest approaches with a global run-time for all structures of D of about 10/15 min. They are about five times faster than CCMpred, a pseudo-likelihood-based method known to be particularly performing when optimized on GPU-based architecture, and from 15 to 30 times faster than GREMLIN and PSICOV. The slowest method is the Boltzmann learning, which is about 300 times slower than mean-field DCA. Note that, as shown in Table 4, the methods tend to have two bottlenecks in terms of run-time, the first is for long RNA sequences such as the large ribosomal subunit from Haloarcula marismortui while the second one is for deep MSAs such as the family RF00163 with more than 3 × 10⁵ RNA sequences.
TABLE 4.
Run-time comparison of the different DCA-based methods
Contact type and prediction robustness
We test the robustness of the DCA-based contact predictions with respect to varying contact definitions. In Table 5, we compare the PPVs of mean-field DCA for the six different contact definitions that have been introduced in Materials and Methods.
TABLE 5.
Accuracy of the mean-field DCA for different contact definitions classified according to the distance threshold and the atoms used in the computation of the nucleotide pair distance
Regarding the type of contacts analyzed, we see that there is no substantial difference in considering different type of contact criteria N1–N9 (9.5 Å), all atoms (3.5 Å) and C1′–C1′ (9.5 Å) where the threshold distances have been taken from (Pietal et al. 2012). For this reason we took, as criteria throughout the paper, the distance between N1 atoms for purine and N9 atoms for pyrimidine that are the atoms that established the glicosylic bond with the C1′ atoms of the pentose sugar.
Not surprisingly, the PPV accuracy improves if the distance criteria are relaxed. For example, using all atoms distance from 3.5 to 9.5 we have a PPV that increases from about 40% to a value close to 60%.
RFAM family construction, sequence alignment and trimming
In this section we analyze how the preliminary steps of the computation, that is, the search for homologous sequences and the MSA curation, impact the DCA prediction of RNA contacts (Table 6). As a first step, since almost half of the RFAMs considered do not have a large enough Meff value, we modify the E-value cutoff used to constitute the RNA families in Rfam 14.1. We did it using the cmsearch option of Infernal without modifying the covariance models of the family but choosing a large E-value threshold equal to 0.99. On the other side, since the introduction of too many sequences in a given family can introduce noise, we also repeated the same analysis but with a more stringent cutoff of 0.0001.
TABLE 6.
Impact of the MSA construction, alignment and trimming on the performances of the mean-field DCA contact prediction method
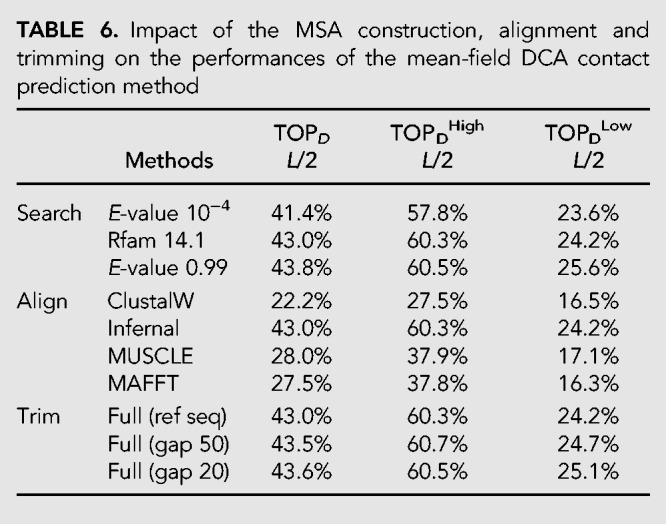
The results do not change significantly but we can observe a few trends: The enlarging of the thresholds slightly improves the contact prediction of families with Meff less then 70 while keeping constant the prediction of the other ones. A more severe cutoff makes instead the performance predictions lower by about 2%.
The way in which the alignment is performed impacts the prediction performances more substantially. Alignments obtained via ClustalW lead to less accurate PPV with a value of about 20%. MUSCLE and MAFFT perform better than ClustalW with more or less the same accuracy (PPV values of about 30%). Finally, alignments done using Infernal improve substantially the performance with a PPV score that is about 10% above those obtained using MUSCLE and MAFFT. The higher PPV values from Infernal are, however, not surprising, as the covariance models used in Infernal are constructed from seed alignments that in turn are constructed using available information and annotations about RNA sequences such as RNA 2D structure.
Finally, the way in which the alignment is trimmed also does not change the mean-field DCA performance and usually excludes the columns in MSA that have more than 50% of gaps, which results in more accurate contact predictions.
Example of contact predictions
In order to provide an example of RNA contact prediction we analyze the aptamer domain of the adenine riboswitch from Vibrio vulnificus. Its three-dimensional structure has been deposited in the Protein Data Bank with the code 4TZX (Zhang and Ferré-D'Amaré 2014). This type of ncRNA that resides in the 5′ untranslated region of the add adenosine deaminase mRNA is one of the smallest riboswitches (with an aptamer domain of 71 residues) and it controls the translation machinery. When adenine, to which it binds, is not present, the aptamer region has a fold that prevents translation initiation. In the presence of adenine, ligand-binding allosteric effects lead to the rearrangement of the secondary structure of the aptamer region and as a consequence to the initiation of translation.
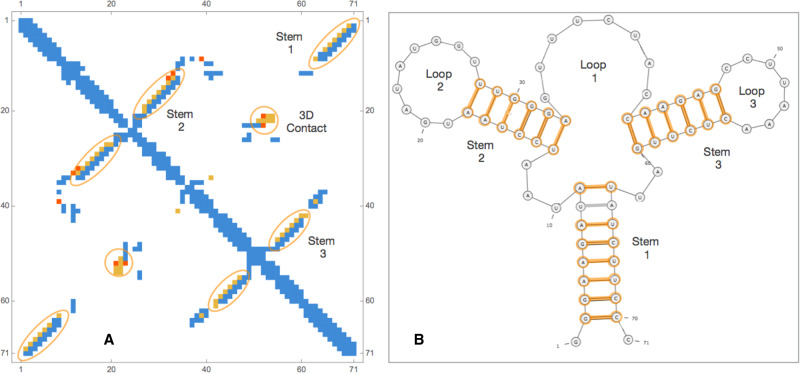
In these conditions, the structure is formed by three helices P1, P2, and P3 (see Fig. 4) and three loops. In physical space, three dimensional contacts occurring between stem–loop 2 and 3 stabilize the 3D structure.
FIGURE 4.
(A) Contact map of the adenine riboswitch from Vibrio vulnificus: in orange and red, the correctly and wrongly predicted contacts in the top 35 pairs, respectively, while in blue all other contacts from PDB structure 4TZX. In B we plot its secondary structure within orange all correctly predicted WC base pairs in the top 35 pairs.
In order to predict the contacts, we start from the RFAM RF00167 (BIT score 59.4) and realign all sequences in the family using the Infernal tool. We then applied mean-field DCA implemented in pydca and the results of contact prediction are shown in Table 7 and in Figure 4.
TABLE 7.
Predicted positive values for different number of contacts N and dfferent contact threshold definitions for the adenine riboswitch from Vibrio vulnificus
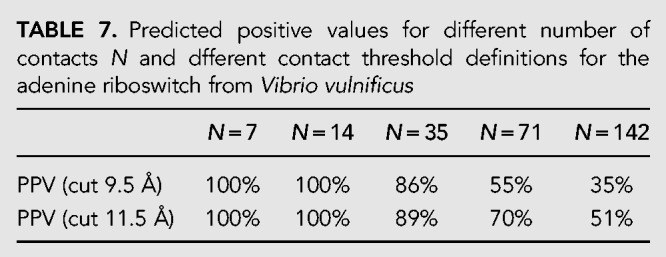
As we can see from Table 7 the PPVs are quite high as all 20 but one WC base pairs of the three stems are correctly identified in the first 35 contacts (=L/2). Moreover, there are also several 3D contacts, that is, long range contacts in the sequence that are away from any WC base pairs, predicted. For example, there are five contacts in the green circle of the contact map of Figure 4 that signal an interaction between the loops 2 and 3. In total, in the first seven 3D contacts, four of them (PPV3D = 57%) are correctly predicted (distance threshold at 9.5 Å), but this number rises to six (PPV3D = 86%) if the distance threshold is enlarged to 11.5 Å. As shown in a series of recent papers, the correct prediction of these 3D contacts and their use as constraints in molecular modeling tools can substantially improve the accuracy of the RNA 3D structure prediction (De Leonardis et al. 2015; Weinreb et al. 2016; Wang et al. 2017; Pucci and Schug 2019).
DISCUSSION
Coevolution between pairs of nucleotides in MSA of homologous RNAs can provide important information about the three-dimensional structure of RNA. As RNA structure and function are closely interlinked, coevolutionary methods promise to play an important role in the understanding of a wide series of RNA-based biological mechanisms.
In order to assess the accuracy of six different widely known DCA methods more precisely, we first constructed a well curated data set of about 70 RNA structures with good resolution. We then perform MSA alignment of their corresponding RFAM families and run six contact prediction tools: mean-field pydca, EVcouplings, Boltzmann Learning, GREMLIN, PSICOV and CCMpred. These tools use different DCA-approaches: mean-field DCA (pydca), pseudo-likelihood (EVcouplings, GREMLIN and CCMpred), Boltzmann learning and the sparse inverse covariance estimation (PSICOV).
We find that there are no statistically significant differences between their performances as measured by PPV. The prediction performance strongly depends on two factors: the first one is the number of effective sequences Meff of the given RFAM family. Indeed, we show that only families that have at least Meff of the order of about 100 lead to reliable prediction's performances.
The second is the procedure used to perform the alignment. In this regard alignments done using Infernal give much better results than those obtained with other methods, with the caveat that the Infernal covariance model is based on additional information.
We also noticed that the prediction of 3D contacts that are far in the sequence and from any WC base pairs, does not yet reach a satisfactory performance for the majority of the entries. While expected (these contacts should exhibit weaker coevolutionary signals when compared with the WC base pairs) this is also unfortunate as prediction of such long-ranged contacts can considerably boost the 3D structure prediction. Machine-learning methods could be used in this more difficult identification since these methods are constructed and optimized to detect weak signals from noisy background.
Finally, both the resolution of RNA 3D structures and the definition of contact considered do not impact significantly the methods’ performance.
In summary, improving RNA contact predictions remains a challenge. The analysis done in this paper, with the construction of a new data set of RNA structures and all tests done, provides new insights on DCA-based approaches highlighting their strong and weak points and could be a starting point for future improvements in the field.
MATERIALS AND METHODS
Data set curation
We manually curated a data set of three-dimensional RNA structures starting our analysis from the whole Protein Data Bank (Berman et al. 2000) and selecting all RNA structures that satisfied the following criteria:
The RNA structures are not in a complex with proteins or DNAs
Only monomeric structures are considered
The lengths of RNA sequences are greater than 40 nucleotides
In cases of structures with similar sequences (sequence identity (SI) between pairs of sequences ≥50%) we choose only the structures with higher resolution
Only structures resolved via X-ray crystallography with resolution below 3.6 Å are taken into account
We associated one RNA family from the Rfam database (Kalvari et al. 2017) to each entry in the data set by choosing the family with the highest match to the sequence. This search has been done using INFERence of RNA ALignment tool (Infernal) using the BIT value as a match score (Nawrocki and Eddy 2013).
For each family we then computed the number of effective sequences Meff via the pydca software package (Zerihun et al. 2020). This value is computed from the alignment of the given RFAM family as Meff = , where ωk is the weight of the kth entry in the given cluster of similar sequences that is identified using a cutoff on the SI equal to 0.8 (Morcos et al. 2011).
We further split the final set D comprised by 69 RNA structures into two subsets: DHigh containing 36 structures associated to RNA families with a Meff larger than or equal to 70. The 33 remaining entries belong to DLow set and have a MSA with Meff < 70. The list of all entries in D with their characteristics is reported in the Supplemental Information, Table S1. The generated alignments and the PDB files for all RNA families can be found at https://github.com/KIT-MBS/RNA-dataset.
Contact definition
In order to study how the nucleotide–nucleotide contact definition influences the performance of DCA methods, we computed and compared positive predicted values (PPVs) using different criteria to construct the contact maps from PDB structures. We chose and tested six distance-based criteria to classify if a pair of nucleotides is in direct physical interaction or not:
Two nucleotides are in contact if the distance between the N9 atoms of a purine or the N1 of a pyrimidine is smaller than 9.5 Å.
Two nucleotides are in contact if the distance between their C1′ atoms is smaller than 12.0 Å.
Two nucleotides are in contact if the distance between two of any of their heavy atoms is smaller than 3.5, 5.5, 7.5, and 9.5 Å.
Multiple sequence alignment and curation
As the quality of the multiple sequence alignment critically impacts the accuracy of the subsequent contact prediction, we tested different methods to perform and curate such alignments. Specifically, we studied how the mean-field DCA performances change according to the method used.
Search. We started to verify if the construction of the RFAM families can influence the prediction performance. To do that we used either the RFAM families as given in RFAM v14.1, but we also reconstruct them using both less and more stringent E-value cutoffs equal to 0.0001 and 0.99, respectively. This search is done using the Infernal software (cmsearch) and the precomputed covariance model (CM) of the given family.
Align. The first methods used to perform the MSA of the RFAM families is the Infernal software (Nawrocki and Eddy 2013). Specifically, all entries of the RFAM family considered are aligned using the corresponding covariance model (CM) that is a specific profile stochastic context-free grammar that scores a combination of sequences and RNA secondary structure consensus. We also tested three other commonly used tools for the multiple sequence alignment of RNAs that are CLUSTALW (Thompson et al. 1994), MUSCLE (Edgar 2004) and MAFFT (Katoh and Standley 2013).
Trim. From the MSA of the given family we tested three different possibilities: in the first one only positions corresponding to the target sequence were considered for the DCA computations; in the second and the third ones, before the DCA computation we trimmed the MSA by selecting only columns that have less than 50% and 20% of gaps, respectively.
Coevolution-based methods
Different methods have been developed for the implementation of the direct coupling analysis (DCA) of RNAs. Given a family of homologous RNA sequences, these statistical models assign probabilities P(S) to each sequence S = a1 a2… aL of length L using the the Boltzmann law as
| (1) |
where β is the inverse of the temperature usually fixed to one without loss of generality, Z the partition function and H the Hamiltonian taken of the form
| (2) |
that contains single site terms hi (ai), and nucleotide pair interactions Jij (ai, aj). In DCA these parameters are inferred from the input MSA using different approaches that are briefly shown here. See also Zerihun and Schug (2017) and Cocco et al. (2018) for recent reviews on the topic.
Mean-field DCA. A mean-field approximation of the partition function is used to obtain the couplings and the single-site fields in a computationally efficient way. Within this approximation the two-body couplings Jij (ai, aj) are obtained from
| (3) |
where C is the matrix of correlations whose elements are given by Cij (ai, aj) = fij (ai, aj) − fi (ai)fj (aj) with fij (ai, aj) and fi (ai) the empirical frequency counts obtained from the MSA columns. The single-site fields hi (ai) are obtained self-consistently from the frequencies fi (ai) and the couplings in Equation 3. We used the mean-field implementation in pydca (Zerihun et al. 2020).
Boltzmann learning. In this statistical approach the parameters Jij (ai, aj) and hi (ai) are obtained from the minimization of the negative log-likelihood
| (4) |
where P(Sb) with (b = 1…B) is a set of independent equilibrium configurations of the model, that is, RNA sequences that belong to a MSA. A direct way to solve the problem is to do a “brute-force” minimization starting from an initial guess for the values of the couplings and fields and using a gradient descent algorithm that uses a Markov chain Monte Carlo method for the gradient evaluation. For more details on the method and the implementation that we used, see Cuturello et al. (2020).
We use the EVcouplings (Weinreb et al. 2016) implementation that uses a pseudo-likelihood maximization direct couplings analysis (plmDCA) (Ekeberg et al. 2013). In this method the probability in Equation 4 is substituted with the conditional probability of observing one variable ar given the observation of the others . Given the MSA, one has then to minimize the conditional log-likelihood
| (5) |
with regularization to estimate the couplings and the fields. This strategy, while retaining the accuracy of the full likelihood approach, greatly increases its computational efficiency.
GREMLIN (Kamisetty et al. 2013) uses a learning procedure that is based on the pseudo-likelihood optimization. It can incorporate prior information on predicted secondary structure and on sequence separation when it is applied on proteins. For RNA contact prediction, GREMLIN does not use any additional information with respect to MSA.
CCMpred (Seemayer et al. 2014) is an implementation based on plmDCA similar to EVcouplings. CCMpred is computationally optimized for GPU architectures even if in this study is run on a CPU system.
PSICOV (Jones et al. 2012) computes the elements of the so-called partial correlation coefficient matrix defined as
| (6) |
in terms of the inverse of the covariance matrix (Eq. 3). ρij encodes the correlation between any pair of amino acids or nucleotides at two sites, in terms of the frequencies at all other sites, and identifies which pairs are likely to be in direct physical contact in the native structure. The estimation of the inverse covariance matrix is done using a graphical LASSO approach and the final PSICOV score is given by followed by an average product correction (APC) (Dunn et al. 2008).
SUPPLEMENTAL MATERIAL
Supplemental material is available for this article.
Supplementary Material
ACKNOWLEDGMENTS
We recognize support by the Impuls- und Vernetzungfond and an ERC recognition award of the Helmholtz Association. The authors gratefully acknowledge the Gauss Centre for Supercomputing e.V. (www.gauss-centre.eu) for funding this project by providing computing time through the John von Neumann Institute for Computing (NIC) on the GCS Supercomputer JUWELS at Jülich Supercomputing Centre (J.S.C.).
Footnotes
Article is online at http://www.rnajournal.org/cgi/doi/10.1261/rna.073809.119.
REFERENCES
- Aigner K, Dressen F, Stege G. 2012. Methods for predicting RNA secondary structure. In RNA 3D structure analysis and prediction, pp. 19–41. Springer-Verlag, Berlin/Heidelberg. [Google Scholar]
- Bartel DP. 2009. MicroRNAs: target recognition and regulatory function. Cell 136: 215–233. 10.1016/j.cell.2009.01.002 [DOI] [PMC free article] [PubMed] [Google Scholar]
- Berman HM, Westbrook J, Feng Z, Gilliland G, Bhat TN, Weissig H, Shindyalov IN, Bourne PE. 2000. The Protein Data Bank. Nucleic Acids Res 28: 235–242. 10.1093/nar/28.1.235 [DOI] [PMC free article] [PubMed] [Google Scholar]
- Biesiada M, Purzycka KJ, Szachniuk M, Blazewicz J, Adamiak RW. 2016. Automated RNA 3D structure prediction with RNAcomposer. Methods Mol Biol 1490: 199–215. 10.1007/978-1-4939-6433-8_13 [DOI] [PubMed] [Google Scholar]
- Boniecki MJ, Lach G, Dawson WK, Tomala K, Lukasz P, Soltysinski T, Rother KM, Bujnicki JM. 2016. SimRNA: a coarse-grained method for RNA folding simulations and 3D structure prediction. Nucleic Acids Res 44: e63 10.1093/nar/gkv1479 [DOI] [PMC free article] [PubMed] [Google Scholar]
- Cech TR, Steitz JA. 2014. The noncoding RNA revolution—trashing old rules to forge new ones. Cell 157: 77–94. 10.1016/j.cell.2014.03.008 [DOI] [PubMed] [Google Scholar]
- Cheng CY, Chou FC, Das R. 2015. Modeling complex RNA tertiary folds with Rosetta. Methods Enzymol 553: 35–64. 10.1016/bs.mie.2014.10.051 [DOI] [PubMed] [Google Scholar]
- Cocco S, Feinauer C, Figliuzzi M, Monasson R, Weigt M. 2018. Inverse statistical physics of protein sequences: a key issues review. Rep Prog Phys 81: 032601 10.1088/1361-6633/aa9965 [DOI] [PubMed] [Google Scholar]
- Cruz JA, Blanchet MF, Boniecki M, Bujnicki JM, Chen SJ, Cao S, Das R, Ding F, Dokholyan NV, Flores SC, et al. 2012. RNA-Puzzles: a CASP-like evaluation of RNA three-dimensional structure prediction. RNA 18: 610–625. 10.1261/rna.031054.111 [DOI] [PMC free article] [PubMed] [Google Scholar]
- Cuturello F, Tiana G, Bussi G. 2020. Assessing the accuracy of direct coupling analysis for RNA contact prediction. RNA 10.1261/rna.074179.119. [DOI] [PMC free article] [PubMed] [Google Scholar]
- Das R, Baker D. 2007. Automated de novo prediction of native-like RNA tertiary structures. Proc Natl Acad Sci 11: 104 10.1073/pnas.0703836104 [DOI] [PMC free article] [PubMed] [Google Scholar]
- De Leonardis E, Lutz B, Ratz S, Cocco S, Monasson R, Schug A, Weigt M. 2015. Direct-coupling analysis of nucleotide coevolution facilitates RNA secondary and tertiary structure prediction. Nucleic Acids Res 43: 10444–10455. 10.1093/nar/gkv932 [DOI] [PMC free article] [PubMed] [Google Scholar]
- Ding F, Sharma S, Chalasani P, Demidov VV, Broude NE, Dokholyan NE. 2008. Ab initio RNA folding by discrete molecular dynamics: from structure prediction to folding mechanisms. RNA 14: 1164–1173. 10.1261/rna.894608 [DOI] [PMC free article] [PubMed] [Google Scholar]
- DiStefano JK. 2018. The emerging role of long noncoding RNAs in human disease. Methods Mol Biol 1706: 91–110. 10.1007/978-1-4939-7471-9_6 [DOI] [PubMed] [Google Scholar]
- Dunn SD, Wahl LM, Gloor GB. 2008. Mutual information without the influence of phylogeny or entropy dramatically improves residue contact prediction. Bioinformatics 24: 333–340. 10.1093/bioinformatics/btm604 [DOI] [PubMed] [Google Scholar]
- Edgar RC. 2004. MUSCLE: multiple sequence alignment with high accuracy and high throughput. Nucleic Acids Res 32: 1792–1797. 10.1093/nar/gkh340 [DOI] [PMC free article] [PubMed] [Google Scholar]
- Ekeberg M, Lovkvis C, La Y, Weig M, Aurell E. 2013. Improved contact prediction in proteins: using pseudolikelihoods to infer Potts models. Phys Rev E 87: 012707 10.1103/PhysRevE.87.012707 [DOI] [PubMed] [Google Scholar]
- Elliott D, Ladomery M. 2016. Molecular biology of RNA. Oxford University Press. [Google Scholar]
- Fire A, Xu S, Montgomery MK, Kostas SA, Driver SE, Mello CC. 1998. Potent and specific genetic interference by double-stranded RNA in Caenorhabditis elegans. Nature 391: 806–811. 10.1038/35888 [DOI] [PubMed] [Google Scholar]
- Flores C, Altman RB. 2010. Coarse-grained modeling of large RNA molecules with knowledge-based potentials and structural filters. RNA 15: 1769–1778. 10.1261/rna.2112110 [DOI] [PMC free article] [PubMed] [Google Scholar]
- Jones DT, Buchan DW, Cozzetto D, Pontil M. 2012. PSICOV: precise structural contact prediction using sparse inverse covariance estimation on large multiple sequence alignments. Bioinformatics 28: 184–190. 10.1093/bioinformatics/btr638 [DOI] [PubMed] [Google Scholar]
- Kalvari I, Argasinska J, Quinones-Olvera N, Nawrocki EP, Rivas E, Eddy SR, Bateman A, Finn RD, Petrov AI. 2017. Rfam 13.0: shifting to a genome-centric resource for non-coding RNA families. Nucleic Acids Res 46: D335–D342. 10.1093/nar/gkx1038 [DOI] [PMC free article] [PubMed] [Google Scholar]
- Kamisetty H, Ovchinnikov S, Baker D. 2013. Assessing the utility of coevolution-based residue-residue contact predictions in a sequence- and structure-rich era. Proc Natl Acad Sci 110: 15674–15679. 10.1073/pnas.1314045110 [DOI] [PMC free article] [PubMed] [Google Scholar]
- Katoh K, Standley DM. 2013. MAFFT multiple sequence alignment software version 7: improvements in performance and usability. Mol Biol Evol 30: 772–780. 10.1093/molbev/mst010 [DOI] [PMC free article] [PubMed] [Google Scholar]
- Krokhotin A, Houlihan K, Dokholyan NV. 2015. iFoldRNA v2: folding RNA with constraints. Bioinformatics 31: 2891–2893. 10.1093/bioinformatics/btv221 [DOI] [PMC free article] [PubMed] [Google Scholar]
- Miao Z, Adamiak RW, Blanchet MF, Boniecki M, Bujnicki JM, Chen SJ, Cheng C, Chojnowski G, Chou FC, Cordero P, et al. 2015. RNA-puzzles round II: assessment of RNA structure prediction programs applied to three large RNA structures. RNA 21: 1066–1084. 10.1261/rna.049502.114 [DOI] [PMC free article] [PubMed] [Google Scholar]
- Miao Z, Adamiak RW, Antczak M, Batey RT, Becka AJ, Biesiada M, Boniecki MJ, Bujnicki JM, Chen SJ, Cheng CY, et al. 2017. RNA-puzzles round III: 3D RNA structure prediction of five riboswitches and one ribozyme. RNA 23: 655–672. 10.1261/rna.060368.116 [DOI] [PMC free article] [PubMed] [Google Scholar]
- Morcos F, Pagnani A, Lunt B, Bertolino A, Marks DS, Sander C, Zecchina R, Onuchic JN, Hwa T, Weigt M. 2011. Direct-coupling analysis of residue coevolution captures native contacts across many protein families. Proc Natl Acad Sci 108: E1293–E1301. 10.1073/pnas.1111471108 [DOI] [PMC free article] [PubMed] [Google Scholar]
- Narayanan BC, Westbrook J, Ghosh S, Petrov AI, Sweeney B, Zirbel CL, Leontis NB, Berman HM. 2013. The Nucleic Acid Database: new features and capabilities. Nucleic Acids Res 42: D114–D122. 10.1093/nar/gkt980 [DOI] [PMC free article] [PubMed] [Google Scholar]
- Nawrocki EP, Eddy SR. 2013. Infernal 1.1: 100-fold faster RNA homology searches. Bioinformatics 29: 2933–2935. 10.1093/bioinformatics/btt509 [DOI] [PMC free article] [PubMed] [Google Scholar]
- Parisien M, Major F. 2008. The MC-Fold and MC-Sym pipeline infers RNA structure from sequence data. Nature 452: 51–55. 10.1038/nature06684 [DOI] [PubMed] [Google Scholar]
- Pietal MJ, Szostak N, Rother KM, Bujnicki MJ. 2012. RNAmap2D - calculation, visualization and analysis of contact and distance maps for RNA and protein-RNA complex structures. BMC Bioinformatics 13: 333 10.1186/1471-2105-13-333 [DOI] [PMC free article] [PubMed] [Google Scholar]
- Popenda M, Szachniuk M, Antczak M, Purzycka KJ, Lukasiak P, Bartol N, Blazewicz J, Adamiak RW. 2012. Automated 3D structure composition for large RNAs. Nucleic Acids Res 40: e112 10.1093/nar/gks339 [DOI] [PMC free article] [PubMed] [Google Scholar]
- Pucci F, Schug A. 2019. Shedding light on the dark matter of the biomolecular structural universe: progress in RNA 3D structure prediction. Methods 162–163: 68–73. 10.1016/j.ymeth.2019.04.012 [DOI] [PubMed] [Google Scholar]
- Reinartz I, Sinner C, Nettels D, Stucki-Buchli B, Stockmar F, Panek PT, Jacob CR, Nienhaus GU, Schuler B, Schug A. 2018. Simulation of FRET dyes allows quantitative comparison against experimental data. J Chem Phys 148: 123321 10.1063/1.5010434 [DOI] [PubMed] [Google Scholar]
- Rother M, Rother K, Puton T, Bujnicki JM. 2011. ModeRNA: a tool for comparative modeling of RNA 3D structure. Nucleic Acids Res 39: 4007–4022. 10.1093/nar/gkq1320 [DOI] [PMC free article] [PubMed] [Google Scholar]
- Seemayer S, Gruber M, Soding J. 2014. CCMpred—fast and precise prediction of protein residue-residue contacts from correlated mutations. Bioinformatics 30: 3128–3130. 10.1093/bioinformatics/btu500 [DOI] [PMC free article] [PubMed] [Google Scholar]
- Thompson JD, Higgins DG, Gibson TJ. 1994. CLUSTAL W: improving the sensitivity of progressive multiple sequence alignment through sequence weighting, position-specific gap penalties and weight matrix choice. Nucleic Acids Res 22: 4673–4680. 10.1093/nar/22.22.4673 [DOI] [PMC free article] [PubMed] [Google Scholar]
- Wang J, Mao K, Zhao Y, Zeng C, Xiang J, Zhang Y, Xiao Y. 2017. Optimization of RNA 3D structure prediction using evolutionary restraints of nucleotide-nucleotide interactions from direct coupling analysis. Nucleic Acids Res 45: 6299–6309. 10.1093/nar/gkx386 [DOI] [PMC free article] [PubMed] [Google Scholar]
- Weiel M, Reinartz I, Schug A. 2019. Rapid interpretation of small-angle X-ray scattering data. PLoS Compt Biol 15: e1006900 10.1371/journal.pcbi.1006900 [DOI] [PMC free article] [PubMed] [Google Scholar]
- Weinreb C, Riesselman A, Ingraham JB, Gross T, Sander C, Marks DS. 2016. 3D RNA and functional interactions from evolutionary couplings. Cell 165: 963–975. 10.1016/j.cell.2016.03.030 [DOI] [PMC free article] [PubMed] [Google Scholar]
- Wilusz JE, Sunwoo H, Spector DL. 2009. Long noncoding RNAs: functional surprises from the RNA world. Genes Dev 23: 1494–1504. 10.1101/gad.1800909 [DOI] [PMC free article] [PubMed] [Google Scholar]
- Zerihun MB, Schug A. 2017. Biomolecular coevolution and its applications: going from structure prediction toward signaling, epistasis, and function. Biochem Soc Trans 45: 1253–1261. 10.1042/BST20170063 [DOI] [PubMed] [Google Scholar]
- Zerihun MB, Pucci F, Peter EK, Schug A. 2020. pydca v1.0: a comprehensive software for direct coupling analysis of RNA and protein sequences. Bioinformatics 36: 2264–2265. 10.1093/bioinformatics/btz892 [DOI] [PubMed] [Google Scholar]
- Zhang J, Ferré-D'Amaré AR. 2014. Dramatic improvement of crystals of large RNAs by cation replacement and dehydration. Structure 22: 1363–1371. 10.1016/j.str.2014.07.011 [DOI] [PMC free article] [PubMed] [Google Scholar]
- Zhao Y, Huang Y, Gong Z, Wang Y, Man J, Xiao Y. 2012. Automated and fast building of three-dimensional RNA structures. Sci Rep 2: 734 10.1038/srep00734 [DOI] [PMC free article] [PubMed] [Google Scholar]
- Zhao C, Xu X, Chen SJ. 2017. Predicting RNA structure with Vfold. Methods Mol Biol 1654: 3–15. 10.1007/978-1-4939-7231-9_1 [DOI] [PMC free article] [PubMed] [Google Scholar]
- Zuker M, Stiegler PO. 1981. Optimal computer folding of large RNA sequences using thermodynamics and auxiliary information. Nucleic Acids Res 9: 133–148. 10.1093/nar/9.1.133 [DOI] [PMC free article] [PubMed] [Google Scholar]
Associated Data
This section collects any data citations, data availability statements, or supplementary materials included in this article.


