

Abstract
Cyclin B:CDK1 is the master kinase regulator of mitosis. We show here that, in addition to its kinase functions, mammalian Cyclin B also scaffolds a localised signalling pathway to help preserve genome stability. Cyclin B1 localises to an expanded region of the outer kinetochore, known as the corona, where it scaffolds the spindle assembly checkpoint (SAC) machinery by binding directly to MAD1. In vitro reconstitutions map the key binding interface to a few acidic residues in the N‐terminal region of MAD1, and point mutations in this sequence abolish MAD1 corona localisation and weaken the SAC. Therefore, Cyclin B1 is the long‐sought‐after scaffold that links MAD1 to the corona, and this specific pool of MAD1 is needed to generate a robust SAC response. Robustness arises because Cyclin B1:MAD1 localisation loses dependence on MPS1 kinase after the corona has been established, ensuring that corona‐localised MAD1 can still be phosphorylated when MPS1 activity is low. Therefore, this study explains how corona‐MAD1 generates a robust SAC signal, and it reveals a scaffolding role for the key mitotic kinase, Cyclin B1:CDK1, which ultimately helps to inhibit its own degradation.
Keywords: Cyclin B1, kinetochore corona, MAD, RZZ complex, spindle assembly checkpoint
Subject Categories: Cell Cycle
The key mitotic kinase Cyclin B‐CDK1 has a surprising structural role in the pathway that keeps its own degradation in check.
Introduction
During mitosis, all duplicated chromosomes must attach correctly to microtubules so they can segregate properly when the cell divides. This attachment is mediated via the kinetochore, which is a giant molecular complex assembled on chromosomes at the centromere (Musacchio & Desai, 2017). As well as attaching to microtubules, the kinetochore must also regulate this process to ensure it occurs correctly. One aspect of this regulation involves the activation of the mitotic checkpoint, otherwise known as the spindle assembly checkpoint (SAC), which blocks mitotic exit until all kinetochores have attached to microtubules. The principle of the SAC is that each unattached kinetochore acts as a factory to produce an inhibitor of mitotic exit, known as the mitotic checkpoint complex or MCC (for further molecular details, see Corbett, 2017). The generation of MCC is so efficient that every single kinetochore signalling centre must eventually be extinguished by microtubule attachment to allow the cell to exit mitosis (Rieder et al, 1995; Dick & Gerlich, 2013).
This complicated inactivation process, known as SAC silencing, requires the removal of catalysts that are needed at unattached kinetochores to generate the MCC (Etemad & Kops, 2016). Two key catalysts in this regard are MAD1, which drives the first step in MCC assembly, and MPS1, the kinase responsible for recruiting and phosphorylating MAD1 as well as other components needed for MCC assembly. Kinetochore–microtubule attachment extinguishes these activities because microtubules displace MPS1 from its binding site on NDC80 (Hiruma et al, 2015; Ji et al, 2015) and at the same time they provide a highway onto which dynein motors can travel to strip MAD1 away from kinetochores (Howell et al, 2001; Wojcik et al, 2001; Mische et al, 2008; Sivaram et al, 2009). Removal of both MPS1 and MAD1 is essential for SAC silencing because if either one is artificially tethered to kinetochores, then the SAC fails to switch off and mitotic exit is blocked (Jelluma et al, 2010; Maldonado & Kapoor, 2011).
One key unexplained aspect of the SAC concerns the kinetochore binding sites for MAD1. MAD1 is recruited to kinetochores via an established KNL1‐BUB1 pathway and, in human cells, by an additional pathway involving the ROD/ZW10/Zwilch (RZZ) complex at the kinetochore's corona (a fibrous crescent that forms around kinetochores to aid the capture of microtubules) (Luo et al, 2018). How exactly MAD1 is recruited to the corona and whether this pool of MAD1 can signal to the SAC are unknown. It is crucial to resolve these issues because it is ultimately the RZZ complex that is stripped by dynein to shut down the SAC, implying that this pool of MAD1 is important for MCC generation (Howell et al, 2001; Wojcik et al, 2001; Mische et al, 2008; Sivaram et al, 2009). However, the corona is positioned some distance away from MPS1 and the proposed catalytic centre for MCC generation at the KNL1/MIS12/NDC80 (KMN) network. Therefore, it remains unclear how MAD1 could signal to the SAC from the corona and it is difficult to resolve this issue without knowledge of how MAD1 binds to this region.
We show here that the key mitotic kinase complex—Cyclin B1:CDK1—acts as the physical adaptor that links MAD1 to the corona. MAD1 was recently shown to recruit Cyclin B1 to kinetochores (Alfonso‐Perez et al, 2019), and although we do see a partial reduction in kinetochore Cyclin B1 when MAD1 interaction is inhibited, the most penetrant phenotype we observe is the complete loss of corona MAD1. This unanticipated scaffolding function of Cyclin B1 is crucial for a robust SAC response, because it allows corona‐tethered MAD1 to respond to low level of kinetochore MPS1 activity. This study therefore reveals how the corona pool of MAD1 signals to the SAC and it explains why MPS1 inhibition and dynein‐mediated stripping of the corona are both essential for SAC silencing.
Results
Cyclin B1:MAD1 interaction facilitates Cyclin B1 and MAD1 localisation to unattached kinetochores
The Cyclin B:CDK1 kinase complex is a master regulator of mitosis that is activated during G2 phase of the cell cycle to initiate mitotic entry and degraded after chromosome alignment to induce mitotic exit. Analysis of endogenously tagged Cyclin B1‐EYFP localisation in RPE1 cells suggested that its localisation was specifically regulated during mitosis. In particular, Cyclin B1‐positive foci appeared after nuclear envelope breakdown and disappeared as mitosis progressed (Fig 1A and Movie EV1). Immunofluorescence analysis demonstrated that this localisation pattern reflects specific binding to unattached kinetochores, which is reminiscent of the checkpoint protein MAD1 (Fig 1B and C). In particular, Cyclin B1 depends on MPS1 activity to be established at this location, but thereafter it became largely insensitive to MPS1 inhibition (Fig 1D and E), as also shown previously for MAD1 (Hewitt et al, 2010; Etemad et al, 2019). Please note that in these and all subsequent quantifications, the vertical bars in the graphs represent the 95% confidence intervals, which can be used for statistical inference by eye (see Materials and Methods for full details; Cumming, 2009). To probe for MAD1 and Cyclin B1 association in cells, we recruited LacI‐MAD1 to a LacO array on chromosome 1 in U2OS cells (Janicki et al, 2004). This was sufficient to co‐recruit Cyclin B1 in a manner that was dependent on a region between amino acids 41–92 of MAD1 (Fig 1F and G). Therefore, these data are consistent with earlier reports that Cyclin B1 localises to unattached kinetochores (Bentley et al, 2007; Chen et al, 2008) in a manner that is dependent on the N‐terminus of MAD1 (Alfonso‐Perez et al, 2019; Jackman et al, 2020).
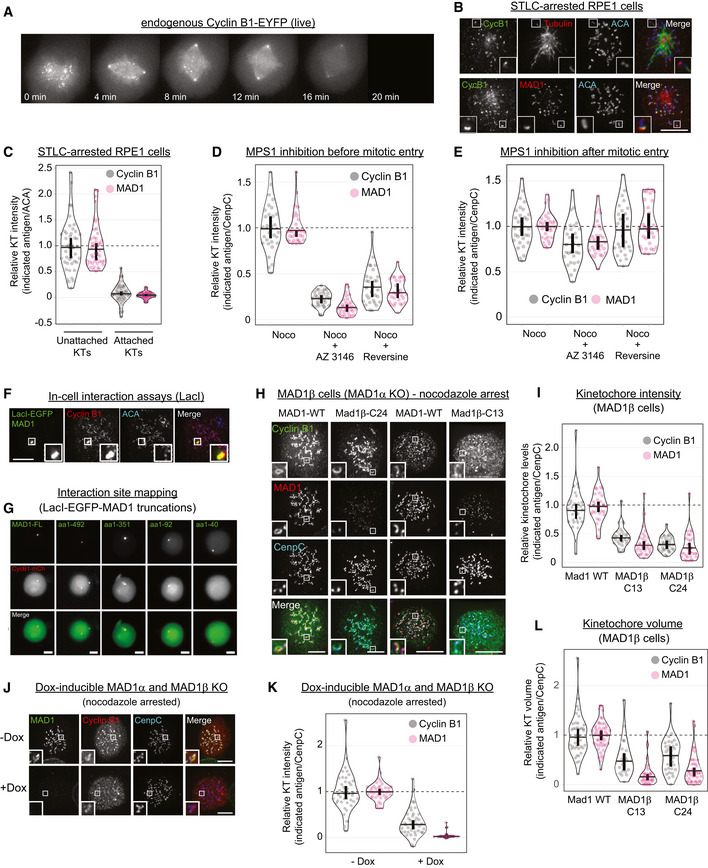
Figure 1. Cyclin B1:MAD1 interaction helps both proteins to localise to unattached kinetochores.
-
AEndogenous Cyclin B1‐YFP localisation during mitosis live in RPE1 cells (still from Movie EV1).
-
B, CImmunofluorescence images (B) and quantifications (C) of relative Cyclin B1 and MAD1 levels at unattached and attached kinetochores in cells arrested in STLC. Each dot represents a kinetochore, and data are from 40 kinetochore pairs (13 cells, max 5 kinetochore pairs/cell).
-
D, EQuantification of relative kinetochore intensities of Cyclin B1 and MAD1 in nocodazole‐arrested cells (noco) treated with the MPS1 inhibitors, AZ‐3146 (5 μM) or reversine (500 nM), either before (D) or after (E) mitotic entry.
-
FImmunofluorescence images of LacI‐MAD1 and Cyclin B1 in U2OS cells containing a LacO arrays on chromosome 1.
-
GLive imaging of Cyclin B1‐mCherry (CycB1‐mCh) in LacO‐U2OS cells transfected with LacI‐MAD1‐FL (full length: aa 1–718) or various LacI‐MAD1 truncations (amino acid numbers indicated).
-
H, IImmunofluorescence images (H) and quantifications (I) of Cyclin B1 and MAD1 kinetochore levels in control (MAD1‐WT) or MAD1β HeLa cells (two independent clones: C13 and C24) treated with nocodazole.
-
J, KImmunofluorescence images (J) and quantification (K) of Cyclin B1 and MAD1 kinetochore localisation in doxycycline‐inducible MAD1α and MAD1β knockouts treated with or without dox for 10 days and then arrested in nocodazole. Cells were selected that had full MAD1 knockout in the doxycycline treatment (this constituted approximately 30% of cells).
-
LRelative kinetochore volumes occupied by Cyclin B1 and MAD1 (relative to CENP‐C) in nocodazole‐arrested MAD1α and MAD1β cells (calculated from experiments shown in (H, I).
To determine the function of Cyclin B1 at kinetochores, we attempted to remove it from this location by knocking down endogenous MAD1 and replacing it with a Cyclin B1‐binding defective mutant. However, all of the siRNAs tested only mildly reduced MAD1 protein (results not shown). This may be due to the fact that MAD1 is a very stable protein in cells because it takes over a week to fully deplete MAD1 following genetic deletion (see Rodriguez‐Bravo et al, 2014). Therefore, to attempt to fully remove Cyclin B1 from kinetochores, we generated a MAD1α knockout cell line that retains only a MAD1β splice variant lacking exon 4 which encodes the Cyclin B1 binding region (hereafter referred to as MAD1β cells; Appendix Fig S1; Sze et al, 2008). Surprisingly, Cyclin B1 was reduced but still present at unattached kinetochores in MAD1β cells (Fig 1H and I). This was not due to residual interaction with MAD1β because doxycycline‐inducible knockout of both MAD1α and MAD1β (McKinley & Cheeseman, 2017) completely removed MAD1 from unattached kinetochores but did not further reduce kinetochore Cyclin B1 (Fig 1J and K; note, the data shown are from 10 days of doxycycline treatment which is the minimum time it takes to fully deplete endogenous MAD1 in this system). Therefore, in contrast to a recent report (Alfonso‐Perez et al, 2019), these data demonstrate that MAD1 contributes to Cyclin B1 kinetochore localisation, but it is not the only binding partner for Cyclin B1 at kinetochores. At least one other receptor exists that is sufficient to maintain substantial levels of Cyclin B1 on kinetochores in the absence of MAD1.
Although inhibiting MAD1‐Cyclin B1 interaction did not abolish Cyclin B1 recruitment to kinetochores, it did cause a dramatic effect on MAD1 localisation itself. As discussed earlier, MAD1 localises to the kinetochores via two separate pathways in human cells: the KNL1‐BUB1 pathway at the outer kinetochore and the RZZ pathway at the corona. Figure 1H shows that Cyclin B1 and MAD1 both bind to the corona in wild‐type cells, which is present as an expanded region outside of CENP‐C. However, when their interaction is prevented in MAD1β cells, it is primarily MAD1 that is lost from the corona, as evidenced by a large reduction in its kinetochore volume (Fig 1L). Therefore, this suggested that Cyclin B1 may act as a scaffold to recruit MAD1 to this region. Although MAD1 is well known to bind the corona (Buffin et al, 2005; Kops et al, 2005; Caldas et al, 2015; Silio et al, 2015; Wynne & Funabiki, 2015; Qian et al, 2017; Luo et al, 2018; Pereira et al, 2018; Rodriguez‐Rodriguez et al, 2018; Sacristan et al, 2018; Zhang et al, 2019), an interaction with a corona component has never been mapped in vitro. In fact, the only established way to remove MAD1 from the corona is to deplete RZZ subunits, which simply abolishes corona formation altogether (Pereira et al, 2018; Rodriguez‐Rodriguez et al, 2018; Sacristan et al, 2018). Therefore, we next sought to explore whether Cyclin B1 might be the receptor that directly recruits MAD1 to the corona.
Cyclin B1 directly scaffolds MAD1 at the corona
We first assayed for direct MAD1 and Cyclin B1 interaction by obtaining homogeneously purified recombinant full‐length MBP‐MAD1:MAD2 (MBP stands for maltose‐binding protein, an affinity and stabilisation tag) and Cyclin B1:CDK1 complexes and testing their interaction by size‐exclusion chromatography (SEC), which separates proteins based on size and shape. When combined stoichiometrically with MBP‐MAD1:MAD2, Cyclin B1:CDK1 underwent a prominent shift in elution volume and co‐eluted with MAD1:MAD2, indicative of a binding interaction (Fig 2A). Early elution of MAD1:MAD2 from the SEC column reflects its high hydrodynamic radius, typical of highly elongated structures rich in coiled coil. As expected, the elution volume of MBP‐MAD1:MAD2 was not affected by the interaction with Cyclin B1:CDK1.
Figure 2. Cyclin B1 and MAD1 interact directly through an N‐terminal acidic patch on MAD1.
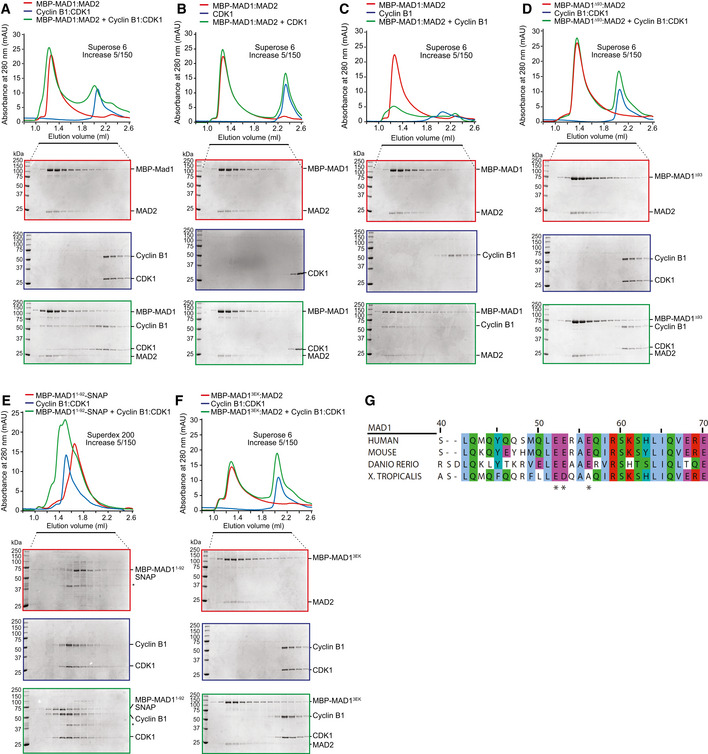
- Elution profiles and SDS–PAGE for SEC runs on the indicated column of the Cyclin B1:CDK1 complex (blue profile), MBP‐MAD1:MAD2 (red) and their combination (green). Note that the same Cyclin B1:CDK1 elution profile and SDS–PAGE are also displayed as reference in panels (D and F) to improve clarity. For the same reason, the MBP‐MAD1:MAD2 elution profile and SDS–PAGE are also displayed in panels (A–C).
- Elution profiles and SDS–PAGE for SEC runs on the indicated column of CDK1 (blue), MBP‐MAD1:MAD2 (red) and their combination (green).
- Elution profiles and SDS–PAGE for SEC runs on the indicated column of Cyclin B1 (blue), MBP‐MAD1:MAD2 (red) and their combination (green).
- Elution profiles and SDS–PAGE for SEC runs of the Cyclin B1:CDK1 complex (blue), MBP‐MAD1∆93:MAD2 (green) and their combination (red).
- Elution profiles and SDS–PAGE for SEC runs of the Cyclin B1:CDK1 complex (blue), MBP‐MAD11–92‐SNAP (red) and their combination (green).
- Elution profiles and SDS–PAGE for SEC runs of Cyclin B1:CDK1 (blue), MBP‐MAD13EK:MAD2 (E52K, E53K and E56K mutations; red) and their combination (green). In (A‐D), individual potential binding partners were combined at a concentration of 5 μM.
- Alignment of the N‐terminal region of Cyclin B1 that contains the MAD1‐binding region. Numbering refers to the human MAD1 sequence. *conserved, negatively charged residues in MAD1 (E52K, E53K and E56K) required for MAD1:Cyclin B1 interaction.
In the absence of Cyclin B1, CDK1 did not interact directly with MAD1:MAD2 (Fig 2B). However, Cyclin B1 on its own did interact with MAD1:MAD2 (Fig 2C). Removal of residues 1–93 from MAD1 (MAD1Δ93:MAD2), which are outside of the predicted coiled‐coil domain of MAD1, abolished the interaction with Cyclin B1 (Fig 2D), indicating that residues 1–93 of MAD1 are necessary for the interaction. Importantly, the N‐terminal region of MAD1 alone was also sufficient to bind Cyclin B1:CDK1, as revealed by SEC experiments with MBP‐MAD11–92‐SNAP and Cyclin B1:CDK1 (Fig 2E). Like the full‐length MAD1:MAD2 complex, MBP‐MAD11–92‐SNAP bound to isolated Cyclin B1 but not to CDK1 (Fig EV1A and B). Therefore, MAD1 binds directly to Cyclin B1:CDK1 through a region located in the first 92 residues of MAD1.
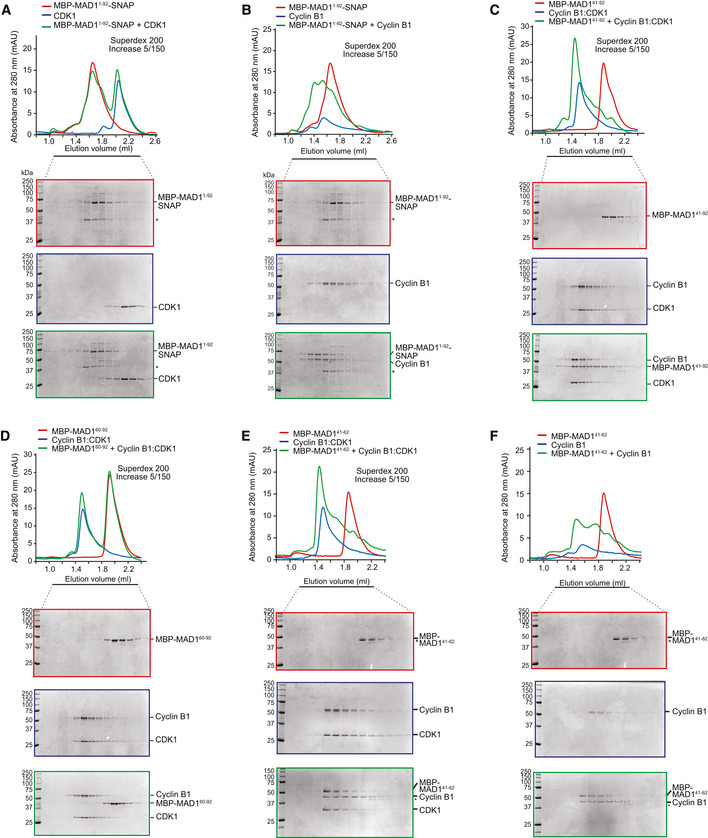
Figure EV1. Cyclin B1, not CDK1, interacts with the MAD1:MAD2 complex via the MAD1 N‐terminus.
-
A–FElution profiles and SDS–PAGE for SEC runs on the indicated columns of (A) CDK1 (blue), MBP‐MAD11–92‐SNAP (red; note that the same elution profile and SDS–PAGE are also displayed as reference in panel (B) and in Fig 2E to improve clarity) and their combination (green); (B) Cyclin B1 (blue), MBP‐MAD11–92‐SNAP (red) and their combination (green). Asterisks in (A and B) indicate free MBP, a byproduct of the MBP‐MAD11–92‐SNAP purification; (C) Cyclin B1:CDK1 (blue; note that the same elution profile and SDS–PAGE are also displayed as reference in panel (D) and in Fig 2E to improve clarity), MBP‐MAD141–92 (red) and their combination (green); (D) Cyclin B1:CDK1 (blue), MBP‐MAD160–92 (red) and their combination (green); (E) Cyclin B1:CDK1 (blue), MBP‐MAD141–62 (red; note that the same elution profile and SDS–PAGE are also displayed as reference in panel F to improve clarity) and their combination (green). (F) Cyclin B1 (blue), MBP‐MAD141–62 (red) and their combination (green). In all experiments, proteins were combined at 5 μM concentration.
To narrow this region down further, we performed additional truncations of MAD11–92, which led to the identification of a minimal Cyclin B1:CDK1 binding site in residues 41–62 of MAD1 (Fig EV1C–F). To identify determinants of the interaction between MAD141–62 and Cyclin B1:CDK1, we extensively mutagenised residues in the MAD141–62 segment and on Cyclin B1. Charge reversals at three conserved negatively charged residues in MAD141–62 (E52K, E53K and E56K) abolished binding to Cyclin B1 (preprint: Allan et al, 2019). When introduced into the full‐length MAD1:MAD2 construct, the 3EK mutation was sufficient to severely impair binding to Cyclin B1:CDK1 (Fig 2F). To identify potential binding partners on Cyclin B1 for the MAD1 residues E52, E53 and E56, we mutagenised various clusters of positively charged residues on the surface of Cyclin B1, without however identifying a sufficiently penetrant mutant (preprint: Allan et al, 2019). Collectively, these results indicate that MAD1 and Cyclin B1:CDK1 interact directly, and that the interaction is mediated primarily or exclusively by residues 41–62 of MAD1 and by Cyclin B1. In addition, a conserved acidic patch in this N‐terminal region of MAD1 is essential for Cyclin B1 interaction (Fig 2G).
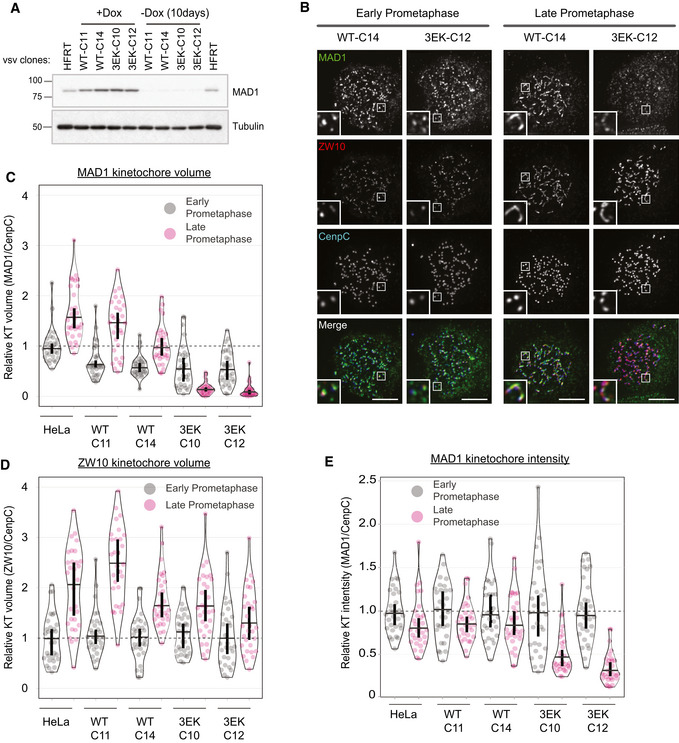
To assess the effect of inhibiting Cyclin B1:MAD1 interaction in cells, we generated doxycycline‐inducible vsv‐tagged MAD1‐WT or MAD1‐3EK HeLa cells and used these to create MAD1 knockouts via CRISPR/Cas9 (with a gRNA targeting exon 3 to knockout MAD1α and MAD1β; Fig 3A). MAD1 localisation was then assessed in nocodazole‐arrested cells, which demonstrated that MAD1‐WT and MAD1‐3EK displayed a similar localisation pattern in early prometaphase, but only the MAD1‐WT was able to localise to the corona when it formed in late prometaphase (Fig 3B). This can be seen in the kinetochore volume analysis which demonstrates that MAD1 and ZW10 kinetochore volumes increase in late prometaphase as the corona forms in MAD1‐WT cells (Fig 3C and D). However, in MAD1‐3EK cells, although ZW10 expands in late prometaphase, MAD1 volumes actually decrease. This represents a total drop in kinetochore MAD1‐3EK levels (Fig 3B and E), which is consistent with the fact that the BUB1‐dependent pool of MAD1 is reduced by PP2A as mitosis progresses (Qian et al, 2017). Therefore, a MAD1‐3EK mutant, which is unable to bind directly to Cyclin B1, is also unable to localise to the corona in nocodazole‐arrested cells. This confirms that Cyclin B1 is the scaffold that recruits MAD1 to this region of the kinetochore in human cells. When the corona pool is removed in MAD1‐3EK cells, MAD1 kinetochore recruitment is reduced soon after nuclear envelope breakdown (mirroring the localisation and phosphorylation of its other kinetochore receptor, BUB1) (Nijenhuis et al, 2014; Qian et al, 2017). Note that we also generated YFP‐tagged MAD1 cells to visualise its localisation live. However, YFP‐MAD1‐WT and YFP‐MAD1‐3EK were both absent from the corona, which suggests that a large N‐terminal tag affects MAD1 localisation to this region (Fig EV2). This may be why removing the N‐terminus of MAD1 was not reported to affect GFP/mCherry‐MAD1 kinetochore localisation in previous studies (Rodriguez‐Bravo et al, 2014; Alfonso‐Perez et al, 2019) and why removal of the RZZ complex does not affect the kinetochore turnover of venus‐MAD1 (Zhang et al, 2019). It is also important to note that the N‐terminal vsv‐tag on MAD1 is not detected at the corona by immunofluorescence (results not shown), suggesting that this region may be buried in an interaction interface.
Figure 3. Cyclin B scaffolds MAD1 at the corona.
-
AWestern blot analysis of indicated vsv‐MAD1‐WT or 3EK HeLa clones treated with or without doxycycline for 10 days.
-
BImmunofluorescence images showing MAD1 and ZW10 kinetochore levels in nocodazole‐arrested MAD1‐WT‐C13 and 3EK‐C14 just after nuclear envelope breakdown (early prometaphase) or later in mitosis when the chromatin is condensed (late prometaphase). Note that early and late prometaphase was defined based on the level of chromatin condensation.
-
C, DRelative kinetochore volumes occupied by MAD1 (C) and ZW10 (D) (relative to CENP‐C) in MAD1‐WT and MAD1‐3EK cells in early and late prometaphase.
-
EQuantification of MAD1 kinetochore intensity from indicated MAD1‐WT and 3EK clones treated as in (B).
Figure EV2. YFP‐MAD1‐WT and YFP‐MAD1‐3EK do not localise to the corona.
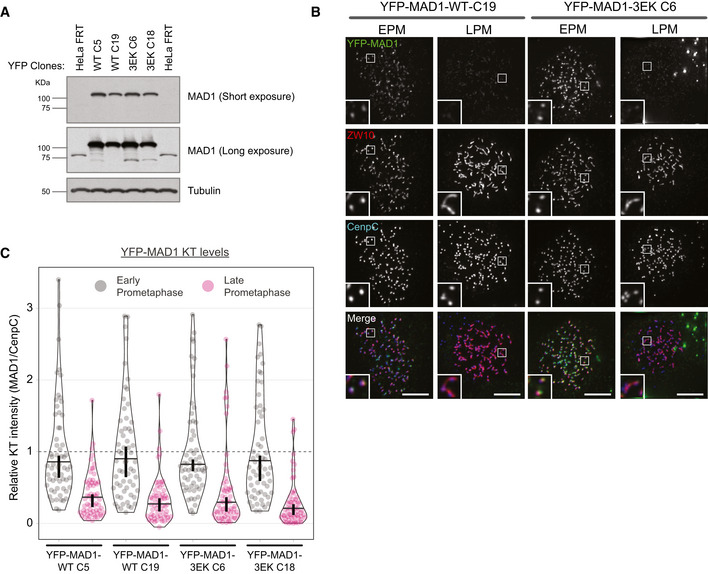
- Western blot analysis of indicated YFP‐MAD1‐WT and YFP‐MAD1‐3EK clones treated with doxycycline.
- Immunofluorescence images showing MAD1 and ZW10 kinetochore levels in nocodazole‐arrested YFP‐MAD1‐WT‐C19 and 3EK‐C6 cells just after nuclear envelope breakdown (early prometaphase—EPM) or later in mitosis when the chromatin is condensed (late prometaphase—LPM). Scale bars = 5 μM.
- Quantification of MAD1 kinetochore localisation from cells treated as in (B). In all kinetochore intensity graphs, each dot represents a cell, horizontal lines indicate the median, and vertical bars show the 95% confidence interval. Note, when these vertical bars do not overlap, the difference is considered statistically significant at a level of at least P < 0.05 (see Materials and Methods). The graph displays data that are relative to the early prometaphase controls, which are normalised to 1. The mean level of the normalised controls is indicated by the dotted lines. Sixty cells from 3 experiments.
Corona‐localised MAD1 generates a robust SAC response
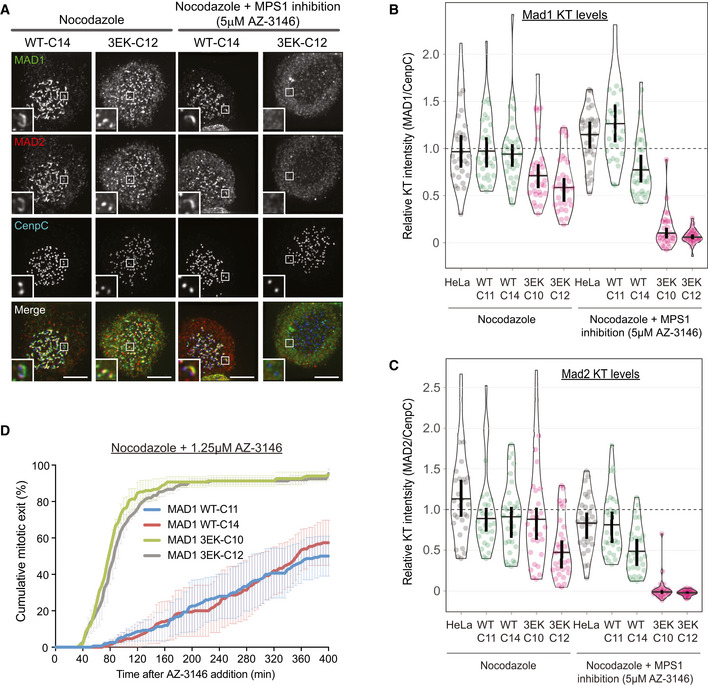
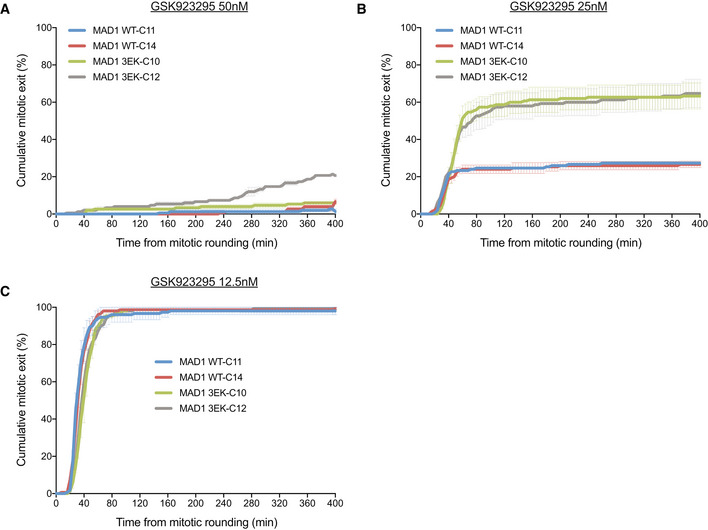
The ability of Cyclin B1 to recruit MAD1 to the corona could allow Cyclin B1 to generate the signal that inhibits its own degradation. However, it is unclear whether corona‐localised MAD1 can signal directly to the SAC and, if it can, how this differs from the conventional KNL1‐BUB1‐MAD1 pathway at the outer kinetochore. One major difference is that Cyclin B1:MAD1 localisation to the corona is insensitive to MPS1 inhibition after mitotic entry (Fig 1E), whereas MPS1 activity is continually required to phosphorylate KNL1 (London et al, 2012; Shepperd et al, 2012; Yamagishi et al, 2012; Vleugel et al, 2015b) and BUB1 (London & Biggins, 2014; Mora‐Santos et al, 2016; Faesen et al, 2017; Ji et al, 2017; Qian et al, 2017; Zhang et al, 2017) to recruit MAD1 to the outer kinetochore. To investigate this major difference between the two pathways, we tested the response of MAD1‐WT and MAD1‐3EK cells to MPS1 inhibition. As expected (Hewitt et al, 2010; Etemad et al, 2019), MAD1 was preserved on kinetochores following MPS1 inhibition with AZ‐3146 after mitotic entry in MAD1‐WT cells (Fig 4A and B). However, in stark contrast, a MAD1‐3EK mutant that cannot bind the corona was completely lost from kinetochores under identical conditions (Fig 4A and B). This sensitivity to MPS1 inhibition was also mirrored by the MAD1‐binding partner MAD2, a key downstream component of the MCC (Fig 4A and C). This has considerable impact on the SAC, because MAD1‐3EK cells are exquisitely sensitive to MPS1 inhibition in nocodazole, as demonstrated by the fact that these cells immediately exit mitosis at a dose of AZ‐3146 that can be tolerated for several hours in MAD1‐WT cells (Fig 4D). These data demonstrate that Cyclin B1:MAD1 recruitment becomes insensitive to MPS1 inhibition once the corona has been established, and this subsequently allows the SAC to tolerate substantial reductions in MPS1 activity. Corona MAD1 likely also enhances SAC strength when MPS1 is not inhibited, because MAD1‐3EK cells are unable to arrest as efficiently as WT cells in the presence of a CENP‐E inhibitor (Fig EV3), which induces a partial checkpoint response by producing a few unattached kinetochores (Wood et al, 2010; Bennett et al, 2015).
Figure 4. Inhibiting Cyclin B1:MAD1 interaction weakens the SAC .
-
A–CImmunofluorescence images (A) and quantifications (B, C) of relative MAD1 and MAD2 kinetochore levels in indicated cells lines arrested in nocodazole and treated with/without AZ‐3146 for 30 min to inhibit MPS1. In all kinetochore intensity graphs, each dot represents a cell, horizontal lines indicate the median, and vertical bars show the 95% confidence interval. Note, when these vertical bars do not overlap, the difference is considered statistically significant at a level of at least P < 0.05 (see Materials and Methods). All kinetochore intensity graphs display data that is relative to WT C11 controls in nocodazole, which are normalised to 1. The mean level of the normalised controls is indicated by the dotted lines. Thirty cells from 3 experiments. Scale bars = 5 μM.
-
DDuration of mitotic arrest in indicated cell lines arrested in nocodazole and then treated with 1.25 μM AZ‐3146. Graph shows cumulative mean (±SEM) of 3 experiments, 50 cells per condition per experiment.
Figure EV3. MAD1‐3EK cells arrest less efficiently following CENP‐E inhibition.
-
A–CDuration of mitotic arrest in MAD1‐WT and MAD1‐3EK clones treated with 50 nM (A), 25 nM (B) or 12.5 nM (C) GSK923295 to inhibit CENP‐E. Graph shows cumulative mean (±SEM) of 3 experiments, 50 cells per condition per experiment.
Cyclin B1 scaffolds MAD1 at the corona to allow the SAC to tolerate MPS1 inhibition
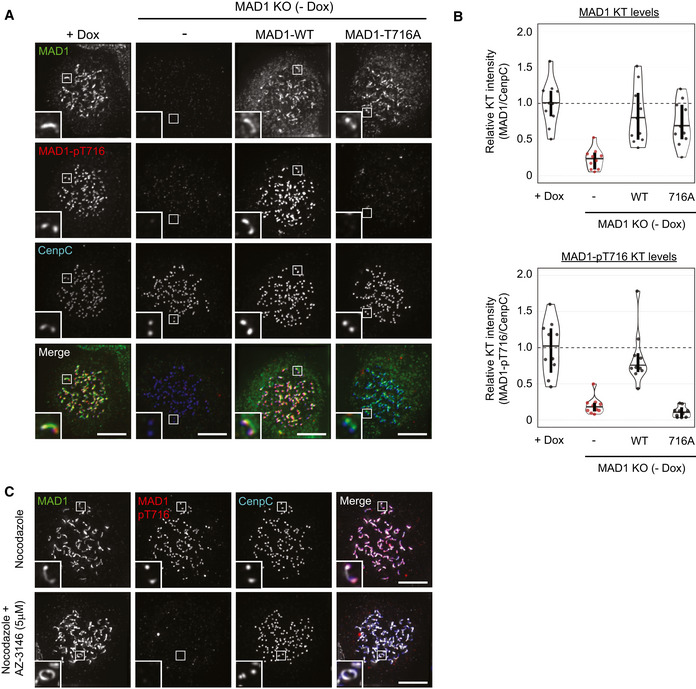
As well as regulating MAD1 recruitment to the outer kinetochore, MPS1 activity is also needed to phosphorylate the C‐terminal domain (CTD) of MAD1 and catalyse MCC assembly (Faesen et al, 2017; Ji et al, 2017, 2018). Therefore, we reasoned that MAD1 may still need to be phosphorylated by MPS1 to catalyse MCC assembly from the corona. Therefore, to probe this further, we raised a phospho‐specific antibody to Thr716, a key MPS1‐phosphorylation site on MAD1, and confirmed its specificity in cells (Fig EV4). This antibody detects a strong signal at unattached kinetochores in RPE1 and HeLa cells, and this signal is rapidly lost upon MPS1 inhibition (Figs 5A and EV4C). Importantly, in nocodazole‐arrested cells, although MAD1 decorates the whole corona, the MAD1‐pT716 signal is restricted primarily to the outer kinetochore around the KMN network (Figs 5A and EV4C). This suggests that either MPS1 has a limited zone of activity that is relatively confined to its anchor point on NDC80 (Hiruma et al, 2015; Ji et al, 2015) or that KMN‐localised MAD1 is more resistant to dephosphorylation. How then can the corona MAD1 support the SAC following MPS1 inhibition? We hypothesised that this MAD1, which is tethered to the corona via Cyclin B1 at its N‐terminus, may be able to use its predicted coiled coil to allow the CTD to reach the zone of MPS1 activity at NDC80 (Luo et al, 2018).
Figure EV4. Validating the MAD1‐pT716 antibody in cells.
-
A, BImmunofluorescence images (A) and quantification (B) of relative MAD1 and MAD1‐pT716 kinetochore levels in dox‐inducible vsv‐MAD1‐WT cells with doxycycline removed (‐Dox) and vsv‐MAD1‐WT or vsv‐MAD1‐T716A. Vsv‐MAD1‐WT cells were cultured without Dox for 11d prior to transient transfection with vsv‐MAD1‐WT or vsv‐MAD1‐T716A plasmids. After 43 h, nocodazole was added for 8 h prior to fixation. In all kinetochore intensity graphs, each dot represents a cell, horizontal lines indicate the median, and vertical bars show the 95% confidence interval. Note, when these vertical bars do not overlap, the difference is considered statistically significant at a level of at least P < 0.05 (see Materials and Methods). The graphs display data that are relative to doxycycline(dox)‐treated controls, which are normalised to 1. The mean level of the normalised controls is indicated by the dotted lines.
-
CImmunofluorescence images of MAD1 and MAD1‐pT716 kinetochore levels in nocodazole‐arrested HeLa FRT cells.
Figure 5. Cyclin B1 scaffolds MAD1 at the corona to allow the SAC to tolerate MPS1 inhibition.
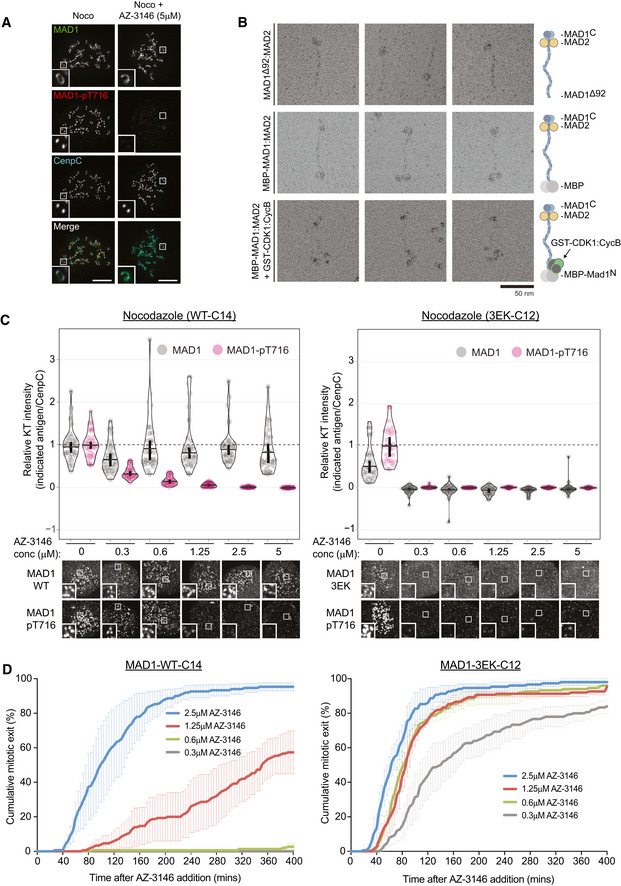
- Immunofluorescence images of MAD1 and MAD1‐pT716 kinetochore levels in nocodazole‐arrested RPE1 cells treated with or without AZ‐3146. Scale bars = 5 μM.
- Electron micrographs of rotary‐shadowed MAD193–718:MAD2 (top row), MBP‐MAD1:MAD2 (middle row) and MBP‐MAD1:MAD2 in complex with GST‐CDK1:Cyclin B1 (bottom row). Scale bar = 50 nm.
- Quantifications (top) and corresponding immunofluorescence images (underneath) of relative kinetochore MAD1 and MAD1‐pT716 levels in nocodazole‐arrested of MAD1‐WT‐C14 and MAD1‐3EK‐C12 cells treated with different doses of AZ‐3146 for 30 min. MG132 was included at the time of AZ‐3146 addition to prevent mitotic exit. Each dot represents a cell, horizontal lines indicate the median and error bars show the 95% confidence interval. Note, when these vertical bars do not overlap, the difference is considered statistically significant at a level of at least P < 0.05 (see Materials and Methods). Thirty cells from 3 experiments. Both kinetochore intensity graphs display data that is relative to the WT‐C14 untreated controls, which are normalised to 1. The mean level of the normalised controls is indicated by the dotted lines.
- Duration of mitotic arrest in MAD1‐WT‐C14 or MAD1‐3EK‐C12 cells arrested in nocodazole and then treated with indicated concentrations of AZ‐3146. Note, the 1.25 μM AZ‐3146 data are displayed in Fig 4D, but also included here to allow comparison with other drug doses. Graph shows cumulative mean (±SEM) of 3 experiments, 50 cells per condition per experiment.
Therefore, we next set out to visualise the stable complex between MAD1:MAD2 and Cyclin B1:CDK1 by electron microscopy after low‐angle metal shadowing. This highlighted the position of MAD2 near the C‐terminal end of MAD1 and demonstrated that MAD1 adopted a thin elongated structure with an apparent length of ~ 66 nm (Fig 5B). Addition of the globular MBP (43 kDa) allowed the N‐terminal end of full‐length MAD1 to be recognised within MAD1:MAD2 complexes (Fig 5B). We then inspected a SEC fraction containing Cyclin B1:CDK1 bound to MBP‐MAD1:MAD2 and identified an additional density near the N‐terminal MBP in a number of complexes (Fig 5B). Thus, Cyclin B1:CDK1 binds the very end of an elongated MAD1:MAD2 complex and the opposite end, which is a substrate for MPS1 (Faesen et al, 2017; Ji et al, 2017, 2018), lies approximately 66 nm away. This observation suggests that corona‐localised MAD1 can still be phosphorylated by MPS1 at the KMN network as long as the anchor point for Cyclin B1 is within ~ 66 nm of NDC80.
We hypothesised that corona‐localised MAD1 could therefore help the SAC to tolerate MPS1 inhibition because, despite the fact the KNL1‐MELT and BUB1 are dephosphorylated, corona‐MAD1 is still preserved at kinetochores to respond to low levels of MPS1 activity. To test this hypothesis, we stained for MAD1 and MAD1‐pT716 in nocodazole‐arrested MAD1‐WT or MAD1‐3EK cells treated with a range of doses of the MPS1 inhibitor AZ‐3146. Figures 5C and EV5A show that total MAD1 protein and MAD1‐pT716 are removed together from kinetochores at very low doses of MPS1 inhibitor in MAD1‐3EK cells. However, MAD1 is preserved at kinetochores following MPS1 inhibition in WT cells, which allows MAD1 phosphorylation to persist until much higher doses of AZ‐3146. This has downstream consequence for the SAC, because the duration of mitotic arrest correlates very well with the total amount of MAD1‐pT716 at kinetochores (Figs 5D and EV5B). Therefore, corona‐MAD1 provides a robust SAC signal by allowing MAD1 to respond to low level of MPS1 activity and generate a prolonged mitotic arrest.
Figure EV5. Corona MAD1 allows the SAC to tolerate MPS1 inhibition by preserving MAD1 at kinetochores and enhancing MAD1‐pT716 levels.
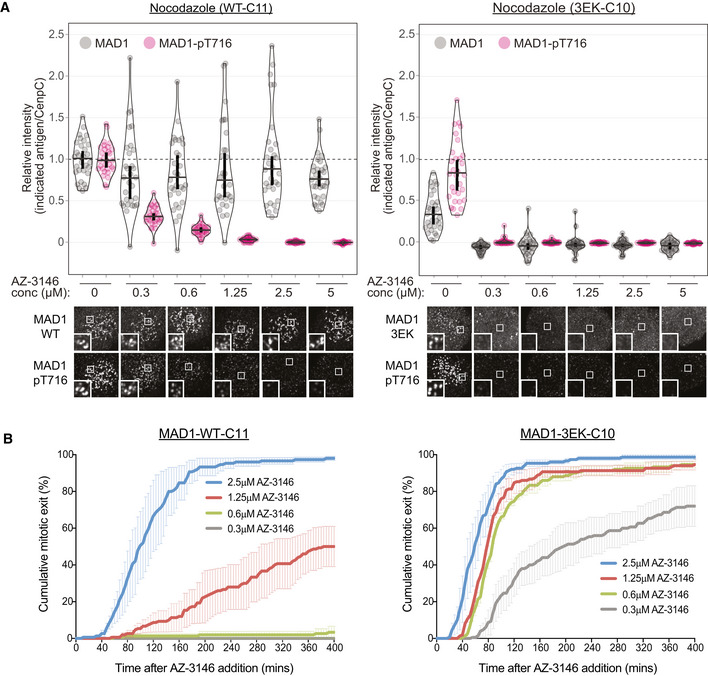
- Quantifications (top) and corresponding immunofluorescence images (underneath) of kinetochore MAD1 and MAD1‐pT716 levels in nocodazole‐arrested MAD1‐WT‐C11 and 3EK‐C10 treated with different doses of AZ‐3146 for 30 min. MG132 was included at the time of AZ‐3146 addition to prevent mitotic exit. Each dot represents a cell, horizontal lines indicate the median and error bars show 95% confidence interval. Note, when these vertical bars do not overlap, the difference is considered statistically significant at a level of at least P < 0.05 (see Materials and Methods). Both kinetochore intensity graphs display data that are relative to the WT‐C11 untreated controls, which are normalised to 1. The mean level of the normalised controls is indicated by the dotted lines. Thirty cells from 3 experiments.
- Duration of mitotic arrest in MAD1‐WT‐C11 or MAD1‐3EK‐C10 cells arrested in nocodazole and then treated with indicated concentrations of AZ‐3146. Graph shows cumulative mean (±SEM) of 3 experiments, 50 cells per condition per experiment. Note, the 1.25 μM AZ‐3146 data are displayed in Fig 4D, but also included here to allow comparison with other drug doses.
Discussion
We show here that Cyclin B1 anchors MAD1 at the corona by binding directly to its N‐terminus. This enables MAD1 to persist at this region when MPS1 activity falls, thereby allowing phosphorylation to be maintained on a key C‐terminal residue in MAD1 needed for SAC catalysis (MAD1‐pT716) (Faesen et al, 2017; Ji et al, 2017, 2018). We speculate that the thin elongated structure of MAD1 facilitates this process by providing the necessary reach to orient MAD2 and the MAD1 CTD towards MPS1 at the KMN network. This would explain why MAD1‐pT716 is primarily restricted to the vicinity of the KMN network even though MAD1 protein is localised all over the corona (Figs 5A and EV4C).
So how exactly does corona MAD1 support the SAC and does this pool of MAD1 function differently from the canonical MAD1 pool that localises in a phospho‐dependent manner to BUB1 (London & Biggins, 2014; Moyle et al, 2014; Mora‐Santos et al, 2016; Qian et al, 2017; Zhang et al, 2017)? Although these two pools have previously been suggested to function independently (Silio et al, 2015), we favour a more integrated model whereby corona‐MAD1 supports the SAC by contributing to the pool of MAD1 on the KMN network, as suggested previously by others (Zhang et al, 2019). We favour this hypothesis for a number of reasons: (i) corona MAD1 has been shown to facilitate MAD1‐BUB1 interaction (Zhang et al, 2019), (ii) BUB1 is critical for cells to mount a prolonged and efficient checkpoint response (Meraldi & Sorger, 2005; Rodriguez‐Rodriguez et al, 2018; Raaijmakers & Medema, 2019; Zhang et al, 2019), (iii) BUB1 is the likely catalytic centre of MCC production since it can co‐localise MAD1/MAD2 together with CDC20 (Di Fiore et al, 2015; Vleugel et al, 2015a; Faesen et al, 2017; Ji et al, 2017), and (iv) the corona MAD1‐pT716 that can catalyse MCC production is present in the vicinity of the KMN network where BUB1 is localised (Figs 5A and EV4C).
We can envisage two ways in which the corona and BUB1 pools of MAD1 could be inter‐dependent. Firstly, their close proximity could allow MAD1 to dynamically exchange between the two locations. For example, MAD1 may release from Cyclin B1 and bind to BUB1 that is localised at KNL1. Alternatively, corona‐localised MAD1, tethered via Cyclin B1 at its N‐terminus, could use its elongated structure to bind directly to KNL1‐localised BUB1, thereby positioning the catalytic C‐terminus of MAD1 (and MAD2) towards the likely site of MCC production. In this arrangement, MAD1 would form the bridge in a tripartite Cyclin B1:MAD1:BUB1 complex that connects the corona with the KMN network. We currently favour this latter model because very recent spatial positioning data on MAD1‐pT716 and MAD2 demonstrates that these signals move slightly outwards towards the RZZ complex after BUB1 depletion (preprint: Roscioli et al, 2019). It will be important in future to determine whether MAD1 bridges the corona and KMN network, because if it does, then this would have important implications for both SAC signalling and corona formation.
Regardless of whether corona‐MAD1 contributes directly or indirectly to the KMN‐localised SAC signal, its ability to be phosphorylated by low levels of MPS1 activity (Figs 5C and EV5A) explains why it must be stripped away by dynein motors following kinetochore–microtubule attachment (Howell et al, 2001; Wojcik et al, 2001; Mische et al, 2008; Sivaram et al, 2009). Otherwise, residual MPS1 activity upon bioriented kinetochores would be able to phosphorylate this pool of MAD1 and allow it to activate the SAC, possibly together with the BUB1 that remains on KNL1 (Etemad et al, 2019). This may explain why tethering MAD1 to kinetochores gives a prolonged mitotic arrest that is nevertheless still bypassed upon inhibition of residual MPS1 activity (Jelluma et al, 2010; Maldonado & Kapoor, 2011). The final model is presented in Fig 6.
Figure 6. Model for how Cyclin B1:MAD1 at the corona contributes to SAC signalling.
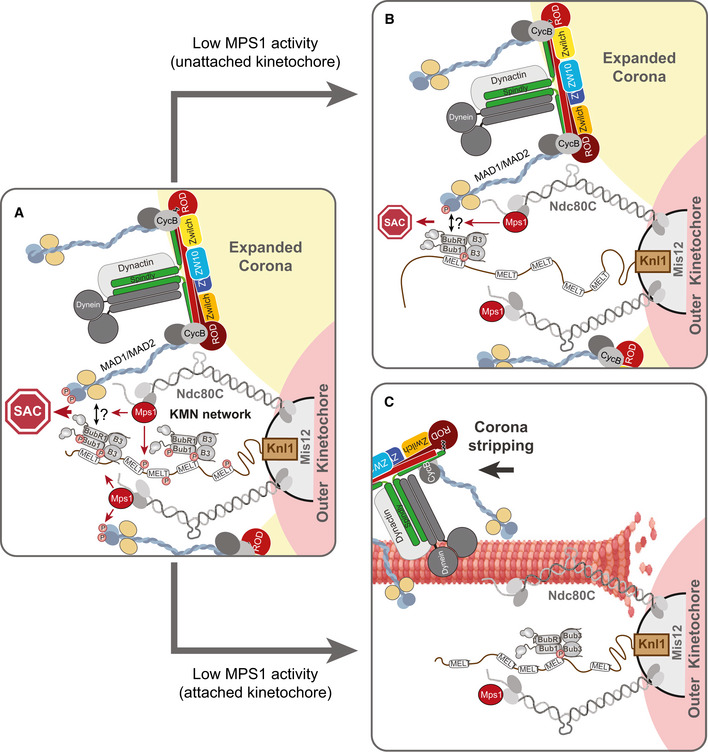
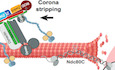
- On unattached kinetochores, Cyclin B1 tethers MAD1 to the corona: note that Cyclin B (CycB) is placed next to ROD for illustrative purposes only, since the actual Cyclin B1 binding site at the corona is unknown. Corona‐localised MAD1 can be phosphorylated by MPS1 on a key C‐terminal residue needed for MCC catalysis (pT716), although this phosphorylation occurs mainly in the vicinity of the KMN network. MAD1 is also known to bind in a phospho‐dependent manner to BUB1, but this is not illustrated because it is possible that corona‐tethered MAD1 can simultaneously bind to phospho‐BUB1 and drive MCC production (this is illustrated by a question mark and a double arrow).
- If MPS1 activity is reduced without microtubule attachment, then Cyclin B1:MAD1 is maintained at the corona where it can still be phosphorylated by low‐level MPS1 activity. This is sufficient to drive a SAC response, perhaps together with the residual BUB1 that remains bound to KNL1.
- When microtubules attach, then MPS1 activity is lowered and the corona is stripped to remove all MAD1. These combined events lead to rapid silencing of the localised SAC signal.
There are two other recent studies that also demonstrate that MAD1‐Cyclin B1 interaction is important during mitosis, but for different reasons. Alfonso‐Perez et al (2019) demonstrated that knockdown of MAD1, or removal of its first 100 amino acids, causes a partial SAC defect in nocodazole and reduces the amount of Cyclin B1 and MPS1 on kinetochores (by approximately 75 and 50%, respectively). It should be noted, however, that the concentration of nocodazole used in these studies (0.3 μM) may be insufficient to fully depolymerise microtubules (Yang et al, 2009), which complicates interpretations about direct effects on the SAC and on MAD1/Cyclin B1/MPS1 localisation to unattached kinetochores. Furthermore, removal of the N‐terminal region of MAD1 has previously been shown to affect MCC assembly from the nuclear pore (Rodriguez‐Bravo et al, 2014), which may also have contributed to the observed SAC defects. Nevertheless, the authors put forward an important hypothesis by proposing that kinetochore Cyclin B1/CDK1 may drive localised CDK1 activity to support the SAC, for example by increasing CDK1‐mediated phosphorylation of MPS1 on Ser281 to enhance MPS1 localisation [see also (Hayward et al, 2019)]. Although kinetochore localised Cyclin B1 has not thus far been demonstrated to drive CDK1 substrate phosphorylation at kinetochores, it will be important to test this hypothesis in future. If it does regulate local CDK1 activity, then this has the potential to impact on many different processes, including the SAC. As well as MPS1 localisation, CDK1 positively and negatively regulates a number of other key enzymes at the kinetochore (for review, see Saurin, 2018), and therefore, these substrates may change dramatically upon kinetochore–microtubule attachment when Cyclin B1/MAD1 is stripped away along microtubules. Furthermore, the removal of the corona itself may depend on localised CDK1 inactivation because acute inhibition of CDK1 is known to cause premature corona detachment (Pereira et al, 2018; Sacristan et al, 2018). To address the potential importance of localised kinetochore CDK1 regulation, however, we believe it will be crucial to first identify the other receptor(s) for Cyclin B1 at the corona so that this pool can then be fully removed from unattached kinetochores.
Very recent data from Jackman et al (2020) has also demonstrated the importance of Cyclin B1:MAD1 interaction during mitosis, but this time in the release of MAD1 from the nuclear pore. In this study, preventing the interaction delays MAD1 accumulation at kinetochores until nuclear envelope breakdown (or just before), as well as weakening the SAC and enhancing the level of chromosomal instability (CIN). The authors use an elegant approach to mutate two key acidic residues in MAD1 (E53K/E56K) at the endogenous locus of RPE cells by CRISPR/Cas9. Although this reduces the amount of Cyclin B1 that co‐precipitates with MAD1, it is possible that the additional E52K mutation included in our 3EK mutant may produce a more penetrant phenotype, since all three glutamates lie on the same face of the predicted helix in MAD1 (Jackman et al, 2020). Nevertheless, the subsequent results on MAD1 dissociation from the nuclear pore are entirely consistent with our data, since these focus on an earlier stage of mitosis and the authors do not examine the effects later in prometaphase at unattached kinetochores. It is likely, therefore, that Cyclin B1:MAD1 functions at the nuclear pore in early mitosis and then again at the corona following nuclear envelope breakdown to safeguard chromosome segregation and prevent CIN. It will be interesting to determine whether this interaction is commonly perturbed in cancer cells that frequently missegregate their chromosomes to become chromosomally unstable.
In summary, this study reveals how the main mitotic kinase, Cyclin B1/CDK1, plays a key role in scaffolding the SAC machinery to the corona. Considering that Cyclin B1 is ultimately degraded by the APC/C once the SAC has been silenced, this important scaffolding function most likely helps to ensure the SAC cannot be re‐established following anaphase onset.
Materials and Methods
Cell culture and reagents
RPE1 cells were purchased from ATCC, and HeLa Flp‐in cells were a gift from S Taylor (University of Manchester, UK) (Tighe et al, 2008). The RPE1 Cyclin B1‐EYFP cells have been published previously (Shaltiel et al, 2014), as have the U2OS with LacO array on chromosome 1 (Janicki et al, 2004). All cells were authenticated by STR profiling (Eurofins) and screened every 4–8 weeks to ensure they were mycoplasma‐free. Cells were cultured in DMEM supplemented with 9% FBS and 50 μg/ml penicillin/streptomycin, except during fluorescence time‐lapse analysis, when they were cultured in Leibovitz's L‐15 media (900 mg/l D+ Galactose, 5 mM Sodium Pyruvate, no phenol red). Doxycycline (1 μg/ml), STLC (S‐Trityl‐l‐cysteine: 10 μM) and thymidine (2 mM) were purchased from Sigma‐Aldrich, nocodazole (3.3 μM) from Millipore, puromycin and hygromycin B from Santa Cruz Biotechnology, MG132 (10 μM) from SelleckBio, AZ‐3146 (at indicated concentrations) from Axon, rapamycin (100 nM) from LC Laboratories and reversine (at indicated concentrations) from Cayman Chemicals.
Generation of knockout cells lines by CRISPR/Cas9 gene editing
The Cyclin B1‐EYFP knockin RPE1 cell line was generated previously (Shaltiel et al, 2014). To generate MAD1α knockout cells (i.e. MAD1β cells), a guide RNA targeting exon 4 of MAD1 (CCGCTCCACCTGGATGAGGTGGG) was cloned into a lentiviral vector that co‐expresses Cas9 and a puromycin resistance marker (pLentiCRISPRv2; Addgene #52961) to create pLentiCas9‐g4‐MAD1. Cyclin B1‐YFP‐FKBP HeLa Flp‐in cells (generated by CRISPR/Cas9‐mediated homologous recombination) were transfected with pLentiCas9‐g4 plasmid and selected in puromycin to obtain single cell clones. These were screened for the absence of nuclear MAD1 by immunofluorescence, since only MAD1α, and not MAD1β, is localised to the nucleus in interphase (Sze et al, 2008), and 2 clones were subsequently validated (C13 and C24: Appendix Fig S1). Note, the original aim was to target endogenous MAD1 and replace exon 4 with an FRB cassette to lose Cyclin B1 interaction and regain it upon rapamycin addition (to induce Cyclin B1‐YFP‐FKBP interaction). The knockin gene editing was however unsuccessful; therefore, MAD1α knockouts were used instead. To generate doxycycline‐inducible vsv‐ or YFP‐MAD1‐WT and ‐3EK cell lines, HeLa Flp‐in cells were transfected with MAD1 in pCDNA5/FRT/TO vector (Invitrogen) together with the FLP recombinase, pOG44 (Invitrogen) using Fugene HD (Promega) according to the manufacturer's protocol. Stable transfectants were selected in media containing 200 μg/ml hygromycin B. Subsequently, to knockout endogenous MAD1, these cells were transfected with a guide RNA targeting exon 3 of MAD1 (CTTCATCTCTCAGCGTGTGGAGG) in pLentiCRISPRv2 for 24 h and thereafter selected in puromycin for a further 24 h. Cells were then cultured continually in the presence of Dox to maintain viability after knockout of endogenous MAD1 by inducing expression of vsv‐ or YFP‐MAD1 WT or 3EK. Individual clones were isolated and screened for loss of endogenous MAD1 by western analysis for YFP‐tagged MAD1 (Fig EV2) and 10 days after removal of Dox for vsv‐tagged MAD1 (Fig 3A). Two clones for each construct were validated and used subsequently (vsv‐MAD1‐WT: C11 & 14; vsv‐MAD1‐3EK: C10 & C12; YFP‐MAD1‐WT: C5 & C19; YFP‐MAD1‐3EK: C6 & C18).
Antibodies
The following primary antibodies were used for immunofluorescence imaging (at the indicated final concentration diluted in 3% BSA in PBS): chicken α‐GFP (ab13970 from Abcam, 1:5,000), guinea pig α‐CENP‐C (BT20278 from Caltag + Medsystems, 1:5,000), human ACA (90C‐CS1058 from Fitzgerald, 1:2,000), rabbit Cyclin B1 (#12231S from Cell signalling technology, 1:1,000), mouse MAD1 (clone BB3‐8, MABE867 from Millipore, 1:1,000), mouse tubulin (clone B‐5‐1‐2 from Sigma, 1:5,000), rabbit ZW10 (ab21582 from abcam, 1:1,000) and MAD2 (A300‐301A‐T from Bethyl, 1:1,000). The MAD1‐pT716 used in this study (MAD1‐pT716‐p1) was a custom rabbit polyclonal phospho‐specific antibody generated by Biomatik. Secondary antibodies used for immunofluorescence were highly cross‐adsorbed goat, α‐chicken, α‐rabbit, α‐mouse or a‐guinea pig coupled to Alexa Fluor 488, Alexa Fluor 568 or Alexa Fluor 647 (Thermo Fisher). The primary antibodies used for Western blotting were actin (A2066 from Sigma, 1:5,000), FKBP12 (clone H‐5 from Santa Cruz, 1:250), mouse MAD1 (clone BB3‐8, MABE867 from Millipore, 1:5,000), tubulin (clone 5‐B‐1‐2 from Sigma, 1:5,000), GST (clone 8‐326, MA4‐004 from Thermo Fisher, 1:1,000) and Cyclin B1 (C8831 from Sigma, 1:1,000). The secondary antibodies used for Western blotting were goat α‐mouse IgG HRP conjugate (170–6,516 from Bio‐Rad; 1:2,000) and goat α‐rabbit IgG HRP conjugate (170–6,515 from Bio‐Rad; 1:5,000).
Time‐lapse analyses
For fluorescence imaging, cells were imaged in 8‐well chamber slides (ibidi), on either a Zeiss Axio Observer 7 with a CMOS Orca flash 4.0 camera or a DeltaVision Elite equipped with Photometrics CascadeII:1024 EMCCD or CoolSNAP HQ (Photometrics) camera. The objectives used for fluorescent imaging were either 20×/0.8 NA or 40×/1.3NA. For brightfield imaging, cells were imaged in a 24‐well plate in DMEM on a Zeiss Axiovert 200M using Hamamatsu ORCA‐ER camera and controlled by Micro‐manager software (open source: http://micro-manager.org), or a Zeiss Axio Observer 7 as detailed above. The air objectives used for brightfield imaging were either 10×/0.5 NA or a 20×/0.4 NA. Mitotic exit was defined by cells flattening down in the presence of nocodazole and MPS1 inhibitor.
Immunofluorescence
This was done essentially as described previously (Smith et al, 2019). Cells, plated on High Precision 1.5H 12‐mm coverslips (Marienfeld), were treated and then pre‐extracted with 0.1% Triton X‐100 in PEM (100 mM Pipes, pH 6.8, 1 mM MgCl2 and 5 mM EGTA) for 1 min before addition of 4% paraformaldehyde (PFA) in PBS for 10 min. Experiments involving MAD1‐pT716 were not pre‐extracted and fixed directly in 4% PFA. Coverslips were washed with PBS and blocked with 3% BSA in PBS + 0.5% Triton X‐100 for at least 30 min. Thereafter, coverslips were incubated with primary antibodies overnight at 4°C, washed with PBS and incubated with secondary antibodies plus DAPI (4,6‐diamidino2‐phenylindole, Thermo Fisher) for an additional 2–4 h at room temperature in the dark. Coverslips were then washed with PBS and mounted on glass slides using ProLong antifade reagent (Molecular Probes). All images were acquired on a DeltaVision Core or Elite system equipped with a heated 37°C chamber, with a 100×/1.40 NA U Plan S Apochromat objective using softWoRx software (Applied precision). Images were acquired at 1 × 1 binning using a CoolSNAP HQ or HQ2 camera (Photometrics) and processed using softWorx software and ImageJ (National Institutes of Health). All immunofluorescence images displayed are maximum intensity projections of deconvolved stacks and were chosen to most closely represent the mean quantified data.
Image quantification
This was done essentially as described previously (Smith et al, 2019). For quantification of kinetochore intensities, all images to be compared directly were acquired with identical illumination settings. An ImageJ macro was used to threshold and select all kinetochores and all chromosome areas (excluding kinetochores) using the DAPI and anti‐kinetochore antibody channels, as previously (Saurin et al, 2011). This was used to calculate the relative mean kinetochore intensity of various proteins ([kinetochores‐chromosome arm intensity (test protein)]/[kinetochores‐chromosome arm intensity (CENP‐C)]. For the quantification of kinetochore localisation on attached vs. unattached kinetochore, cells were arrested in STLC and MAD1 intensity used to define attached (MAD1 negative) or unattached (MAD1 positive) kinetochores. The signal in the MAD1 and Cyclin B1 channel was then expressed as a percentage of CENP‐C on these individual kinetochores (after normalising for surrounding background intensities). Kinetochore volumes were measured for the deconvolved stacks using the 3D object counter macro of Fiji. Threshold intensities from each channel were determined manually by opening deconvolved projections of all images to be compared (i.e. from the same experiment), equalising the channel intensities and then determining the minimum threshold that is needed to fully select all visible kinetochore staining. This threshold value was then applied to the deconvolved stacks using the 3D object counter, after cropping the image to remove any non‐specific (i.e. non‐kinetochore) signals (typically outside of the chromatin). The mean kinetochore volume/cell was calculated as [sum of kinetochore volume (test protein)/sum of kinetochore volume (CENP‐C)]. This was then expressed as a fraction of the average value of the control sample to give the relative mean kinetochore volume per cell. Graphs were generated using either GraphPad or PlotsOfData (Postma & Goedhart, 2019).
DNA cloning, protein expression and purification
CDK1 and CyclinB1 cDNAs from GeneArt (Thermo Fisher) were cloned in pLIB‐GST and pLIB‐His8 vectors, respectively, modified versions of the pLIB vector (Weissmann et al, 2016). Proteins were independently expressed in Tnao38 cells. In the case of CDK1, this was co‐infected with the virus of the activator kinase CDC7. DNA sequences encoding MAD1 constructs were amplified by polymerase chain reaction (PCR) from a previously described constructs (Faesen et al, 2017). All the mutant versions of recombinant proteins were produced by QuikChange Mutagenesis Kit (Agilent Technologies). MAD1 full‐length wild‐type and 3EK mutant, as well as MAD1Δ93 (i.e. containing amino acids 94–718), constructs were sub‐cloned in a pLIB‐MBP vector, a modified version of the pLIB vector for expression in insect cells (Weissmann et al, 2016). The MBP‐MAD1:MAD2, MBP‐MAD1:MAD23EK and MBP‐MAD1Δ93:MAD2 complexes were expressed in Tnao38 cells by co‐infection of the respective MAD1 baculoviruses with that of MAD2 (Faesen et al, 2017). MAD1 N‐terminal fragments were sub‐cloned into the previously generated pETDuet‐MBP8His or pETDuet‐MBP‐SNAP‐8His vectors (Liu et al, 2016) and were transformed into BL21(DE3) Rosetta 2 competent cells. Cells were grown in Terrific broth at 37°C to an OD600 of about 1. Protein expression was induced by addition of 0.1 mM IPTG at 25°C, and cells were further allowed to grow overnight. All insect and bacteria cell pellets were resuspended in binding buffer (50 mM Hepes pH 7.4, 500 mM NaCl, 10% (v/v) glycerol, 2 mM TCEP), lysed by sonication and cleared by centrifugation at 10,000 × g for 45 min. The cleared supernatants were purified through affinity chromatography followed by gel‐filtration chromatography carried out in 50 mM Hepes pH 7.4, 250 mM NaCl, 5% (v/v) glycerol and 2 mM TCEP. CDK1 was purified on glutathione sepharose (GE Healthcare) followed by GST tag removal with PreScission protease and gel‐filtration chromatography on a HiLoad Superdex 200 16/60 column (GE Healthcare). Cyclin B1 was purified on HiTrap Nickel column (GE Healthcare) followed by Histidine tag removal with TEV protease and gel‐filtration chromatography on a HiLoad Superdex 200 16/60 column (GE Healthcare). Cyclin B1:CDK1 complex was assembled from independently purified CDK1 and Cyclin B1 proteins mixed at 1:1.5 molar ratio and purified again on a HiLoad Superdex 200 16/60 column (GE Healthcare). MBP‐MAD1 proteins were purified first on a MBP‐Trap HP column (GE Healthcare) and then gel‐filtered on a Superose 6 prep grade XK 16/70 or on an HiLoad Superdex 200 16/60 column (GE Healthcare). SNAP‐His8 tag removal was achieved by PreScission protease cleavage and affinity chromatography on HisTrap column (GE Healthcare), before the size‐exclusion chromatography step. The LacI‐GFP‐MAD1 fragments were generated by PCR amplification of MAD1 and insertion into the LacI‐GFP vector (Vleugel et al, 2013). To create the guide RNA‐resistant MAD1‐WT and 3EK plasmids, gene blocks were synthesised that encode for amino acids 1–97 of MAD1, with or without mutations to change E52K, E53K and E56K (denoted as 3EK), and containing additional silent mutations in the gRNA sequences. These gene blocks were inserted into full‐length MAD1 by Gibson assembly to replace the region encoding for amino acids 1–97.
Analytical size‐exclusion chromatography
All samples were eluted under isocratic conditions at 4°C in SEC buffer (50 mM Hepes pH 8.0, 150 mM NaCl, 2 mM TCEP) at a flow rate of 0.12 ml/min. The elution profiles of proteins were monitored at 280 nm. To form the complex, proteins were mixed at 1:1 molar ratio and a typical concentration of 5 μM, and incubated for 30 min on ice. The loading volume for each injection was 50 μl. SDS–PAGE, followed by Coomassie staining, was used to detect proteins.
Low‐angle metal shadowing and electron microscopy
Low‐angle metal shadowing and electron microscopy were essentially performed as described (Huis In ‘t Veld et al, 2016). Fractions from size‐exclusion chromatography containing protein complexes of interest were diluted 1:1 with spraying buffer (200 mM ammonium acetate and 60% glycerol) and air‐sprayed onto freshly cleaved mica pieces (V1 quality, Plano GmbH). Specimens were mounted and dried in a MED020 high‐vacuum metal coater (Bal‐tec). A platinum layer of approximately 1 nm and a 7 nm carbon support layer were evaporated subsequently onto the rotating specimen at angles of 6–7° and 45°, respectively. Pt/C replicas were released from the mica on water, captured by freshly glow‐discharged 400‐mesh Pd/Cu grids (Plano GmbH) and visualised using a LaB6 equipped JEM‐1400 transmission electron microscope (JEOL) operated at 120 kV. Images were recorded at a nominal magnification of 60,000× on a 4k × 4k CCD camera F416 (TVIPS), resulting in 0.18 nm per pixel. Representative particles were manually selected using EMAN2 (Tang et al, 2007).
Statistical analysis
As highlighted previously by others (Cumming, 2014; Goodman, 2016) and discussed in a statement by the American Statistical Association (Wasserstein & Lazar, 2016), there are various problems surrounding the use of P‐values from traditional null hypothesis significance testing. We have elected instead to display 95% confidence intervals which can be used for statistical inference by eye, thus allowing the reader to easily compare any groups present on a graph (Cumming & Finch, 2005; Cumming, 2009). In this case, when the vertical bar of one condition does not overlap with the vertical bar of another condition, then the difference between the medians is statistically significant [at the level of P < 0.05, but often considerably smaller (Cumming, 2009)]. Therefore, the extent of overlap/separation between the vertical bars allows the reader to estimate the statistical difference between the effect sizes.
Author contributions
ATS discovered the MAD1‐Cyclin B1 connection whilst working in the laboratory of GJPLK (Fig 1A–C and F, G). LAA performed the majority of the cell biology experiments, with important contributions from MR. The EM of MAD1 was performed by PJH, and the in vitro biochemistry was performed by GC with the support of SW, under the supervision of AM. ATS wrote the manuscript with comments from all authors.
Conflict of interest
The authors declare that they have no conflict of interest.
Supporting information
Appendix
Expanded View Figures PDF
Dataset EV1
Movie EV1
Review Process File
Acknowledgements
This study was funded by Cancer Research UK (C47320 to A.T.S. which also funds L.A), a Leng Charitable Trust PhD studentship to M.R., and by the Max Planck Society and the European Research Council (ERC) Advanced Investigator Grant RECEPIANCE (proposal 669686) to A.M. Microscopy was carried out at the Dundee Imaging Facility. We are grateful to Iain Cheeseman for providing the inducible MAD1α and MAD1β knockout line, Stephen Taylor for the HeLa Flp‐in line and Joachim Goedhart for help and advice on using PlotsOfData. We also thank Yahui Liu for contributing to an earlier version of this manuscript and to Nadja Harhoff for help with sub‐cloning of constructs.
EMBO Journal (2020) 39: e103180
See also: C Conde & R Gassmann (June 2020)
Data availability
Source data for the quantifications displayed in graphs are provided as Expanded View Dataset EV1.
References
- Alfonso‐Perez T, Hayward D, Holder J, Gruneberg U, Barr FA (2019) MAD1‐dependent recruitment of CDK1‐CCNB1 to kinetochores promotes spindle checkpoint signaling. J Cell Biol 218: 1108–1117 [DOI] [PMC free article] [PubMed] [Google Scholar]
- Allan LA, Reis M, Liu Y, Huis In ‘t Veld P, Kops GJPL, Musacchio A, Saurin AT (2019) Cyclin B1 scaffolds MAD1 at the corona to activate the spindle assembly checkpoint. bioRxiv 10.1101/726224 [PREPRINT] [DOI] [PMC free article] [PubMed] [Google Scholar]
- Bennett A, Bechi B, Tighe A, Thompson S, Procter DJ, Taylor SS (2015) Cenp‐E inhibitor GSK923295: novel synthetic route and use as a tool to generate aneuploidy. Oncotarget 6: 20921–20932 [DOI] [PMC free article] [PubMed] [Google Scholar]
- Bentley AM, Normand G, Hoyt J, King RW (2007) Distinct sequence elements of cyclin B1 promote localization to chromatin, centrosomes, and kinetochores during mitosis. Mol Biol Cell 18: 4847–4858 [DOI] [PMC free article] [PubMed] [Google Scholar]
- Buffin E, Lefebvre C, Huang J, Gagou ME, Karess RE (2005) Recruitment of Mad2 to the kinetochore requires the Rod/Zw10 complex. Curr Biol 15: 856–861 [DOI] [PubMed] [Google Scholar]
- Caldas GV, Lynch TR, Anderson R, Afreen S, Varma D, DeLuca JG (2015) The RZZ complex requires the N‐terminus of KNL1 to mediate optimal Mad1 kinetochore localization in human cells. Open Biol 5: 150160 [DOI] [PMC free article] [PubMed] [Google Scholar]
- Chen Q, Zhang X, Jiang Q, Clarke PR, Zhang C (2008) Cyclin B1 is localized to unattached kinetochores and contributes to efficient microtubule attachment and proper chromosome alignment during mitosis. Cell Res 18: 268–280 [DOI] [PubMed] [Google Scholar]
- Corbett KD (2017) Molecular mechanisms of spindle assembly checkpoint activation and silencing. Prog Mol Subcell Biol 56: 429–455 [DOI] [PubMed] [Google Scholar]
- Cumming G, Finch S (2005) Inference by eye: confidence intervals and how to read pictures of data. Am Psychol 60: 170–180 [DOI] [PubMed] [Google Scholar]
- Cumming G (2009) Inference by eye: reading the overlap of independent confidence intervals. Stat Med 28: 205–220 [DOI] [PubMed] [Google Scholar]
- Cumming G (2014) The new statistics: why and how. Psychol Sci 25: 7–29 [DOI] [PubMed] [Google Scholar]
- Di Fiore B, Davey NE, Hagting A, Izawa D, Mansfeld J, Gibson TJ, Pines J (2015) The ABBA motif binds APC/C activators and is shared by APC/C substrates and regulators. Dev Cell 32: 358–372 [DOI] [PMC free article] [PubMed] [Google Scholar]
- Dick AE, Gerlich DW (2013) Kinetic framework of spindle assembly checkpoint signalling. Nat Cell Biol 15: 1370–1377 [DOI] [PMC free article] [PubMed] [Google Scholar]
- Etemad B, Kops GJ (2016) Attachment issues: kinetochore transformations and spindle checkpoint silencing. Curr Opin Cell Biol 39: 101–108 [DOI] [PubMed] [Google Scholar]
- Etemad B, Vertesy A, Kuijt TEF, Sacristan C, van Oudenaarden A, Kops G (2019) Spindle checkpoint silencing at kinetochores with submaximal microtubule occupancy. J Cell Sci 132: jcs231589 [DOI] [PubMed] [Google Scholar]
- Faesen AC, Thanasoula M, Maffini S, Breit C, Muller F, van Gerwen S, Bange T, Musacchio A (2017) Basis of catalytic assembly of the mitotic checkpoint complex. Nature 542: 498–502 [DOI] [PMC free article] [PubMed] [Google Scholar]
- Goodman SN (2016) STATISTICS. Aligning statistical and scientific reasoning. Science 352: 1180–1181 [DOI] [PubMed] [Google Scholar]
- Hayward D, Alfonso‐Perez T, Cundell MJ, Hopkins M, Holder J, Bancroft J, Hutter LH, Novak B, Barr FA, Gruneberg U (2019) CDK1‐CCNB1 creates a spindle checkpoint‐permissive state by enabling MPS1 kinetochore localization. J Cell Biol 218: 1182–1199 [DOI] [PMC free article] [PubMed] [Google Scholar]
- Hewitt L, Tighe A, Santaguida S, White AM, Jones CD, Musacchio A, Green S, Taylor SS (2010) Sustained Mps1 activity is required in mitosis to recruit O‐Mad2 to the Mad1‐C‐Mad2 core complex. J Cell Biol 190: 25–34 [DOI] [PMC free article] [PubMed] [Google Scholar]
- Hiruma Y, Sacristan C, Pachis ST, Adamopoulos A, Kuijt T, Ubbink M, von Castelmur E, Perrakis A, Kops GJ (2015) CELL DIVISION CYCLE. Competition between MPS1 and microtubules at kinetochores regulates spindle checkpoint signaling. Science 348: 1264–1267 [DOI] [PubMed] [Google Scholar]
- Howell BJ, McEwen BF, Canman JC, Hoffman DB, Farrar EM, Rieder CL, Salmon ED (2001) Cytoplasmic dynein/dynactin drives kinetochore protein transport to the spindle poles and has a role in mitotic spindle checkpoint inactivation. J Cell Biol 155: 1159–1172 [DOI] [PMC free article] [PubMed] [Google Scholar]
- Huis In ‘t Veld PJ, Jeganathan S, Petrovic A, Singh P, John J, Krenn V, Weissmann F, Bange T, Musacchio A (2016) Molecular basis of outer kinetochore assembly on CENP‐T. Elife 5: e21007 [DOI] [PMC free article] [PubMed] [Google Scholar]
- Jackman M, Marcozzi C, Barbiero M, Pardo M, Yu L, Tyson A, Choudhary J, Pines J (2020) Cyclin B1‐Cdk1 facilitates MAD1 release from the nuclear pore to ensure a robust Spindle Checkpoint. J Cell Biol, In press. 10.1083/jcb.201907082 [DOI] [PMC free article] [PubMed] [Google Scholar]
- Janicki SM, Tsukamoto T, Salghetti SE, Tansey WP, Sachidanandam R, Prasanth KV, Ried T, Shav‐Tal Y, Bertrand E, Singer RH et al (2004) From silencing to gene expression: real‐time analysis in single cells. Cell 116: 683–698 [DOI] [PMC free article] [PubMed] [Google Scholar]
- Jelluma N, Dansen TB, Sliedrecht T, Kwiatkowski NP, Kops GJ (2010) Release of Mps1 from kinetochores is crucial for timely anaphase onset. J Cell Biol 191: 281–290 [DOI] [PMC free article] [PubMed] [Google Scholar]
- Ji Z, Gao H, Yu H (2015) CELL DIVISION CYCLE. Kinetochore attachment sensed by competitive Mps1 and microtubule binding to Ndc80C. Science 348: 1260–1264 [DOI] [PubMed] [Google Scholar]
- Ji Z, Gao H, Jia L, Li B, Yu H (2017) A sequential multi‐target Mps1 phosphorylation cascade promotes spindle checkpoint signaling. Elife 6: e22513 [DOI] [PMC free article] [PubMed] [Google Scholar]
- Ji W, Luo Y, Ahmad E, Liu ST (2018) Direct interactions of mitotic arrest deficient 1 (MAD1) domains with each other and MAD2 conformers are required for mitotic checkpoint signaling. J Biol Chem 293: 484–496 [DOI] [PMC free article] [PubMed] [Google Scholar]
- Kops GJ, Kim Y, Weaver BA, Mao Y, McLeod I, Yates JR III, Tagaya M, Cleveland DW (2005) ZW10 links mitotic checkpoint signaling to the structural kinetochore. J Cell Biol 169: 49–60 [DOI] [PMC free article] [PubMed] [Google Scholar]
- Liu Y, Petrovic A, Rombaut P, Mosalaganti S, Keller J, Raunser S, Herzog F, Musacchio A (2016) Insights from the reconstitution of the divergent outer kinetochore of Drosophila melanogaster. Open Biol 6: 150236 [DOI] [PMC free article] [PubMed] [Google Scholar]
- London N, Ceto S, Ranish JA, Biggins S (2012) Phosphoregulation of Spc105 by Mps1 and PP1 regulates Bub1 localization to kinetochores. Curr Biol 22: 900–906 [DOI] [PMC free article] [PubMed] [Google Scholar]
- London N, Biggins S (2014) Mad1 kinetochore recruitment by Mps1‐mediated phosphorylation of Bub1 signals the spindle checkpoint. Genes Dev 28: 140–152 [DOI] [PMC free article] [PubMed] [Google Scholar]
- Luo Y, Ahmad E, Liu ST (2018) MAD1: kinetochore receptors and catalytic mechanisms. Front Cell Dev Biol 6: 51 [DOI] [PMC free article] [PubMed] [Google Scholar]
- Maldonado M, Kapoor TM (2011) Constitutive Mad1 targeting to kinetochores uncouples checkpoint signalling from chromosome biorientation. Nat Cell Biol 13: 475–482 [DOI] [PMC free article] [PubMed] [Google Scholar]
- McKinley KL, Cheeseman IM (2017) Large‐scale analysis of CRISPR/Cas9 cell‐cycle knockouts reveals the diversity of p53‐dependent responses to cell‐cycle defects. Dev Cell 40: 405–420 e2 [DOI] [PMC free article] [PubMed] [Google Scholar]
- Meraldi P, Sorger PK (2005) A dual role for Bub1 in the spindle checkpoint and chromosome congression. EMBO J 24: 1621–1633 [DOI] [PMC free article] [PubMed] [Google Scholar]
- Mische S, He Y, Ma L, Li M, Serr M, Hays TS (2008) Dynein light intermediate chain: an essential subunit that contributes to spindle checkpoint inactivation. Mol Biol Cell 19: 4918–4929 [DOI] [PMC free article] [PubMed] [Google Scholar]
- Mora‐Santos MD, Hervas‐Aguilar A, Sewart K, Lancaster TC, Meadows JC, Millar JB (2016) Bub3‐Bub1 binding to Spc7/KNL1 toggles the spindle checkpoint switch by licensing the interaction of Bub1 with Mad1‐Mad2. Curr Biol 26: 2642–2650 [DOI] [PubMed] [Google Scholar]
- Moyle MW, Kim T, Hattersley N, Espeut J, Cheerambathur DK, Oegema K, Desai A (2014) A Bub1‐Mad1 interaction targets the Mad1‐Mad2 complex to unattached kinetochores to initiate the spindle checkpoint. J Cell Biol 204: 647–657 [DOI] [PMC free article] [PubMed] [Google Scholar]
- Musacchio A, Desai A (2017) A molecular view of kinetochore assembly and function. Biology (Basel) 6: E5 [DOI] [PMC free article] [PubMed] [Google Scholar]
- Nijenhuis W, Vallardi G, Teixeira A, Kops GJ, Saurin AT (2014) Negative feedback at kinetochores underlies a responsive spindle checkpoint signal. Nat Cell Biol 16: 1257–1264 [DOI] [PMC free article] [PubMed] [Google Scholar]
- Pereira C, Reis RM, Gama JB, Celestino R, Cheerambathur DK, Carvalho AX, Gassmann R (2018) Self‐assembly of the RZZ complex into filaments drives kinetochore expansion in the absence of microtubule attachment. Curr Biol 28: 3408–3421 e8 [DOI] [PMC free article] [PubMed] [Google Scholar]
- Postma M, Goedhart J (2019) PlotsOfData‐A web app for visualizing data together with their summaries. PLoS Biol 17: e3000202 [DOI] [PMC free article] [PubMed] [Google Scholar]
- Qian J, Garcia‐Gimeno MA, Beullens M, Manzione MG, Van der Hoeven G, Igual JC, Heredia M, Sanz P, Gelens L, Bollen M (2017) An attachment‐independent biochemical timer of the spindle assembly checkpoint. Mol Cell 68: 715–730 e5 [DOI] [PubMed] [Google Scholar]
- Raaijmakers JA, Medema RH (2019) Killing a zombie: a full deletion of the BUB1 gene in HAP1 cells. EMBO J 38: e102423 [DOI] [PMC free article] [PubMed] [Google Scholar]
- Rieder CL, Cole RW, Khodjakov A, Sluder G (1995) The checkpoint delaying anaphase in response to chromosome monoorientation is mediated by an inhibitory signal produced by unattached kinetochores. J Cell Biol 130: 941–948 [DOI] [PMC free article] [PubMed] [Google Scholar]
- Rodriguez‐Bravo V, Maciejowski J, Corona J, Buch HK, Collin P, Kanemaki MT, Shah JV, Jallepalli PV (2014) Nuclear pores protect genome integrity by assembling a premitotic and Mad1‐dependent anaphase inhibitor. Cell 156: 1017–1031 [DOI] [PMC free article] [PubMed] [Google Scholar]
- Rodriguez‐Rodriguez JA, Lewis C, McKinley KL, Sikirzhytski V, Corona J, Maciejowski J, Khodjakov A, Cheeseman IM, Jallepalli PV (2018) Distinct roles of RZZ and Bub1‐KNL1 in mitotic checkpoint signaling and kinetochore expansion. Curr Biol 28: 3422–3429 e5 [DOI] [PMC free article] [PubMed] [Google Scholar]
- Roscioli E, Germanova TE, Smith CA, Embacher PA, Erent M, Thompson AI, Burroughs NJ, McAinsh AD (2019) Ensemble‐level organization of human kinetochores and evidence for distinct tension and attachment sensors. bioRxiv: 685248 10.1101/685248 [PREPRINT] [DOI] [PMC free article] [PubMed] [Google Scholar]
- Sacristan C, Ahmad MUD, Keller J, Fermie J, Groenewold V, Tromer E, Fish A, Melero R, Carazo JM, Klumperman J et al (2018) Dynamic kinetochore size regulation promotes microtubule capture and chromosome biorientation in mitosis. Nat Cell Biol 20: 800–810 [DOI] [PMC free article] [PubMed] [Google Scholar]
- Saurin AT, van der Waal MS, Medema RH, Lens SM, Kops GJ (2011) Aurora B potentiates Mps1 activation to ensure rapid checkpoint establishment at the onset of mitosis. Nat Commun 2: 316 [DOI] [PMC free article] [PubMed] [Google Scholar]
- Saurin AT (2018) Kinase and phosphatase cross‐talk at the kinetochore. Front Cell Dev Biol 6: 62 [DOI] [PMC free article] [PubMed] [Google Scholar]
- Shaltiel IA, Aprelia M, Saurin AT, Chowdhury D, Kops GJ, Voest EE, Medema RH (2014) Distinct phosphatases antagonize the p53 response in different phases of the cell cycle. Proc Natl Acad Sci USA 111: 7313–7318 [DOI] [PMC free article] [PubMed] [Google Scholar]
- Shepperd LA, Meadows JC, Sochaj AM, Lancaster TC, Zou J, Buttrick GJ, Rappsilber J, Hardwick KG, Millar JB (2012) Phosphodependent recruitment of Bub1 and Bub3 to Spc7/KNL1 by Mph1 kinase maintains the spindle checkpoint. Curr Biol 22: 891–899 [DOI] [PMC free article] [PubMed] [Google Scholar]
- Silio V, McAinsh AD, Millar JB (2015) KNL1‐Bubs and RZZ provide two separable pathways for checkpoint activation at human kinetochores. Dev Cell 35: 600–613 [DOI] [PubMed] [Google Scholar]
- Sivaram MV, Wadzinski TL, Redick SD, Manna T, Doxsey SJ (2009) Dynein light intermediate chain 1 is required for progress through the spindle assembly checkpoint. EMBO J 28: 902–914 [DOI] [PMC free article] [PubMed] [Google Scholar]
- Smith RJ, Cordeiro MH, Davey NE, Vallardi G, Ciliberto A, Gross F, Saurin AT (2019) PP1 and PP2A use opposite phospho‐dependencies to control distinct processes at the kinetochore. Cell Rep 28: 2206–2219 e8 [DOI] [PMC free article] [PubMed] [Google Scholar]
- Sze KM, Ching YP, Jin DY, Ng IO (2008) Role of a novel splice variant of mitotic arrest deficient 1 (MAD1), MAD1beta, in mitotic checkpoint control in liver cancer. Cancer Res 68: 9194–9201 [DOI] [PubMed] [Google Scholar]
- Tang G, Peng L, Baldwin PR, Mann DS, Jiang W, Rees I, Ludtke SJ (2007) EMAN2: an extensible image processing suite for electron microscopy. J Struct Biol 157: 38–46 [DOI] [PubMed] [Google Scholar]
- Tighe A, Staples O, Taylor S (2008) Mps1 kinase activity restrains anaphase during an unperturbed mitosis and targets Mad2 to kinetochores. J Cell Biol 181: 893–901 [DOI] [PMC free article] [PubMed] [Google Scholar]
- Vleugel M, Tromer E, Omerzu M, Groenewold V, Nijenhuis W, Snel B, Kops GJ (2013) Arrayed BUB recruitment modules in the kinetochore scaffold KNL1 promote accurate chromosome segregation. J Cell Biol 203: 943–955 [DOI] [PMC free article] [PubMed] [Google Scholar]
- Vleugel M, Hoek TA, Tromer E, Sliedrecht T, Groenewold V, Omerzu M, Kops GJ (2015a) Dissecting the roles of human BUB1 in the spindle assembly checkpoint. J Cell Sci 128: 2975–2982 [DOI] [PubMed] [Google Scholar]
- Vleugel M, Omerzu M, Groenewold V, Hadders MA, Lens SM, Kops GJ (2015b) Sequential multisite phospho‐regulation of KNL1‐BUB3 interfaces at mitotic kinetochores. Mol Cell 57: 824–835 [DOI] [PubMed] [Google Scholar]
- Wasserstein RL, Lazar NA (2016) The ASA statement on p‐values: context, process, and purpose. The American Statistician 70: 129–133 [Google Scholar]
- Weissmann F, Petzold G, VanderLinden R, Huis In ‘t Veld PJ, Brown NG, Lampert F, Westermann S, Stark H, Schulman BA, Peters JM (2016) biGBac enables rapid gene assembly for the expression of large multisubunit protein complexes. Proc Natl Acad Sci USA 113: E2564–E2569 [DOI] [PMC free article] [PubMed] [Google Scholar]
- Wojcik E, Basto R, Serr M, Scaerou F, Karess R, Hays T (2001) Kinetochore dynein: its dynamics and role in the transport of the Rough deal checkpoint protein. Nat Cell Biol 3: 1001–1007 [DOI] [PubMed] [Google Scholar]
- Wood KW, Lad L, Luo L, Qian X, Knight SD, Nevins N, Brejc K, Sutton D, Gilmartin AG, Chua PR et al (2010) Antitumor activity of an allosteric inhibitor of centromere‐associated protein‐E. Proc Natl Acad Sci USA 107: 5839–5844 [DOI] [PMC free article] [PubMed] [Google Scholar]
- Wynne DJ, Funabiki H (2015) Kinetochore function is controlled by a phospho‐dependent coexpansion of inner and outer components. J Cell Biol 210: 899–916 [DOI] [PMC free article] [PubMed] [Google Scholar]
- Yamagishi Y, Yang CH, Tanno Y, Watanabe Y (2012) MPS1/Mph1 phosphorylates the kinetochore protein KNL1/Spc7 to recruit SAC components. Nat Cell Biol 14: 746–752 [DOI] [PubMed] [Google Scholar]
- Yang Z, Kenny AE, Brito DA, Rieder CL (2009) Cells satisfy the mitotic checkpoint in Taxol, and do so faster in concentrations that stabilize syntelic attachments. J Cell Biol 186: 675–684 [DOI] [PMC free article] [PubMed] [Google Scholar]
- Zhang G, Kruse T, Lopez‐Mendez B, Sylvestersen KB, Garvanska DH, Schopper S, Nielsen ML, Nilsson J (2017) Bub1 positions Mad1 close to KNL1 MELT repeats to promote checkpoint signalling. Nat Commun 8: 15822 [DOI] [PMC free article] [PubMed] [Google Scholar]
- Zhang G, Kruse T, Guasch Boldu C, Garvanska DH, Coscia F, Mann M, Barisic M, Nilsson J (2019) Efficient mitotic checkpoint signaling depends on integrated activities of Bub1 and the RZZ complex. EMBO J 38: e100977 [DOI] [PMC free article] [PubMed] [Google Scholar]
Associated Data
This section collects any data citations, data availability statements, or supplementary materials included in this article.
Supplementary Materials
Appendix
Expanded View Figures PDF
Dataset EV1
Movie EV1
Review Process File
Data Availability Statement
Source data for the quantifications displayed in graphs are provided as Expanded View Dataset EV1.