Abstract
Objectives
Bone-marrow mesenchymal stem cells (MSCs) and chondrocytes are currently used for cell-based therapy in cartilage repair. Chondroprogenitors (CPs), resident cells of articular cartilage, demonstrate likeness to stem cells. Reports suggest that chondrocytes phenotype is altered in culture, thus making differentiation between the two cell populations difficult. Our objectives were to electrophysiologically assess chondrocytes and CPs, compare their mRNA expression with that of ionic channels already reported in MSCs, and to observe the effect of time in culture and osteoarthritic damage on cells.
Design and Results
Chondrocytes and CPs at passages 0 (p0) and 5 (p5) derived from normal and osteoarthritic (OA) knee joints were used. Ionic currents were recorded by subjecting cells to depolarizing voltage pulses, and reverse transcriptase-polymerase chain reaction (RT-PCR) was used for studying ion channel expression. Our results demonstrated that both chondrocytes and CPs showed the presence of similar currents belonging to voltage-gated potassium channel subfamily, with RT-PCR confirming high mRNA expression of Maxi K, HKv1.1, HKv1.4, HKv4.2, and hEAG1 channels. Our finding also suggested that CPs were comparatively more sensitive to increased time in culture and inflammatory processes as observed in OA, as was evidenced by the significant decrease in mean current density (p0 normal CP: 183.171 ± 50.80 pA/pF; p5 normal CP: 50.225 ± 17.63 pA/pF; P = 0.0280) and significant increase in cellular size (p0 normal CP: 21.564 ± 2.98 pF; p0 OA CP: 37.939 ± 3.55 pF; P = 0.0057).
Conclusion
Both cell types appear to be optimal candidates for cell-based therapy although initial seeding density, cell source (normal vs. OA), and time in culture are matters of concern, prior to cell-type selection.
Keywords: chondrocytes, chondroprogenitors, electrophysiology, RT-PCR, osteoarthritis
Introduction
Articular cartilage manages a herculean task of stabilizing weight-bearing joints and reducing friction, thus making movements precise. Its ability to heal is impaired due to avascularity and hypocellularity.1 Any insult hinders regeneration and results in healing primarily by fibrocartilage formation.2 Cell-based cartilage repair, marrow stimulation, and grafting are currently in use to compensate for the inferiority of the natural healing process.3 Cartilage architecture is composed of chondrocytes and sparse chondroprogenitors (CPs) seen embedded in abundant extracellular matrix.4 Since chondrocytes and CPs are resident cells of the cartilage, interest in using them as treatment modalities for cartilage-related pathologies is understandable. At present, cell-based therapy mainly includes the use of chondrocytes and bone marrow–derived mesenchymal stem cells (BM-MSCs) for cartilage regeneration.3,5 Although the proliferative capacity of BM-MSCs cannot be questioned, certain studies suggest a higher osteogenic potential, thereby making them a less than ideal cell source.6,7 Autologous chondrocyte implantation, an alternative therapy, requires in vitro expansion prior to implantation due to low cell yield. There are reports where post implantation, a high expression of hypertrophic markers and fibrocartilage formation suggest phenotype loss in chondrocytes.8 The conflict arises since certain studies have shown that chondrocytes in culture acquire stem cell–like properties.7 This begs the question, whether chondrocytes need preconditioning to make them more suitable as a contender for cell-based therapy in cartilage repair.
Articular cartilage–derived CPs are a subpopulation of stem cells isolated mainly from the superficial zone of cartilage. These clonally derived tissue-specific stem cells have been classified as MSCs exhibiting hypo-immunogenicity and positive immunomodulatory properties.9,10 In recent years, progress has been made in identifying, understanding, and characterizing these progenitors, believed to possess the biological repository to be ideal for cell-based cartilage repair. Since chondrocytes and CPs coexist in cartilage and chondrocytes have been shown to acquire stemness in cultures, the ability to define and provide a clear-cut differentiation between the two cell populations has been obscured.11 Since chondrocytes have been profiled extensively, our first attempt was to differentiate this cell population from CPs based on electrophysiology by performing patch clamp analysis.
Furthermore, the growing interest in CPs is due to their MSC-like properties, and therefore, our second objective was to look at mRNA expression of ionic channels already reported in MSCs as per literature.12,13 Reverse transcriptase-polymerase chain reaction (RT-PCR) analysis used for assessing molecular evidence of channels was also extended to chondrocytes for comparison. We also inspected changes in cells retrieved from early and late cultures. This was done to verify whether repeated passaging alters chondrocyte or CP phenotype. Another dimension studied was whether cells obtained from normal and osteoarthritic (OA) knee joints showed any difference when the said analysis was performed. Our interest was to see whether the disease altered cell biology enough so as to render the OA cartilage as a less than suitable cell source.
Materials and Methods
Study Design
The study protocol was approved and carried out according to the institutional ethics committee guidelines. Human articular cartilage from 3 normal (N) (mean age = 22 ± 4 years) and OA (mean age = 63 ± 7 years) knee joints were harvested. The patients were admitted for posttrauma above-knee amputations or for knee replacement as a part of treatment for osteoarthritis. The cartilage samples were collected after obtaining informed consent as per ethical guidelines.
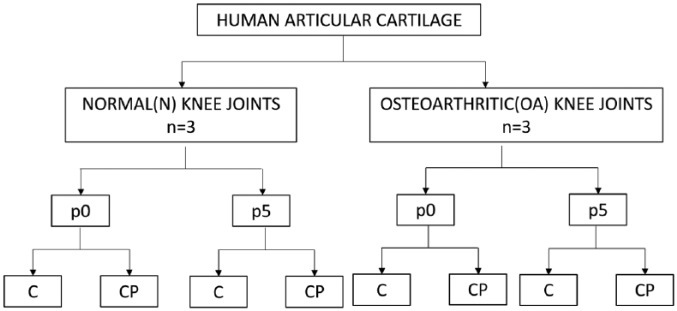
In the present study, CPs and chondrocytes were isolated from superficial layer/full depth of the articular cartilage from N or OA knee joints. Following this both cell types were cultured up to passage 5 (p5). Cells at different time points in culture, namely, passage 0 (p0) and p5 were characterized using flow cytometric analysis for classical and chondroprogenitor-specific markers. Normal and osteoarthritic cartilage–derived CPs and chondrocytes from p0 and p5 were compared, by subjecting them to patch clamp and RT-PCR analysis. This yielded 8 cell groups for comparison (Fig. 1).
Figure 1.
Algorithm of the study design depicting the 8 study groups used for comparison. p0 = passage 0; p5 = passage 5; C = chondrocytes; CP = chondroprogenitors.
Isolation and Culture of Chondrocytes
Cartilage was harvested from N and OA knee joints. The shavings were washed in phosphate-buffered saline medium to remove traces of synovial fluid. Cellular dissociation was done using Dulbecco’s modified Eagles medium (DMEM-F12-Himedia) containing 0.15% of collagenase type II (Worthington) for a period of 16 hours under standard culture conditions (37°C, 5% CO2, 85% humidity). Following digestion, the cells were resuspended in a known volume of medium and cell count was performed. Chondrocytes were loaded at a concentration of 10,000 cells/cm2 and expanded to p5 with DMEM/F12 containing 10% fetal calf serum (FCS; Gibco), ascorbic acid 62 µg/mL (Sigma), L-glutamine 2.5 mM/L (Sigma), penicillin-streptomycin 100 IU/mL (Gibco), and amphotericin-B 2 µg/mL (Gibco). Medium was changed once in every 3 days and trypsinized using 0.25%Trypsin-EDTA (Gibco).
Isolation and Culture of Articular Cartilage–Derived Chondroprogenitors
CP isolation was done using superficial zone cartilage slices (the same as used for chondrocyte isolation). The cartilage shavings were subjected to overnight sequential enzymatic digestion with 0.2% pronase (Roche) and 0.04% collagenase type II (Worthington) to obtain individual cells. The cells were subjected to differential adhesion on precoated fibronectin (Sigma; 10 µg/mL in phosphate-buffer solution containing 1 mM CaCl2 and 1 mM MgCl2) plates for 20 minutes in DMEM containing 10% FCS at a concentration of 700 cells/mL. After incubation, media and nonadherent cells were removed and replaced with standard growth media (DMEM-F12-Glutamax [Himedia] plus ascorbic acid 62 µg/mL [Sigma], L-glutamine 2.5 mM/L [Sigma], penicillin-streptomycin 100 IU/mL [Gibco], and amphotericin-B 2 µg/mL [Gibco]). Adherent cells were maintained at standard culture conditions (5% CO2; 37°C) for 10 to 12 days to obtain colonies of >32 cells (chondroprogenitor clones). The clones were isolated and replated on T-75 culture flasks and further expanded to p5 using Glutamax DMEM-F12 containing 10% FCS supplemented with antibiotics, transforming growth factor-β2 (TGFβ2) (1 ng/mL; human-recombinant; Biovision), and fibroblastic growth factor (FGF2) (5 ng/mL; human-recombinant; Biovision).
Population Doubling
The population doubling (PD) for all the groups was calculated using the following formula:
where N0 is the initial number of cells seeded, which was day 0, and N is the number of cells obtained at 90% confluence. The cumulative PD was compared between chondrocytes and CP at p0 and p5 (Table 1).
Table 1.
Data Representing Cumulative Population Doubling (CPD) Values of All the Subgroups Used for Analysesa.
| CPD | Chondrocytes | CP | ||||||
|---|---|---|---|---|---|---|---|---|
| N | OA | N | OA | |||||
| p0 | p5 | P0 | p5 | p0 | p5 | p0 | p5 | |
| Mean ± SD | 1.0 ± 11.1 | 76.0 ± 62 | −21.0 ± 25.6 | 19.7 ± 3.5 | 1.5 ± 0.3 | 17.6 ± 0.5 | 2.5 ± 0.9 | 28.3 ± 1.7 |
CP = chondroprogenitor; N = normal; OA = osteoarthritic; p0 = passage 0; p5 = passage 5.
Data expressed as mean ± SD.
Phenotyping: Flow Cytometric Analysis (FACS)
Chondrocytes and CPs from p0 and p5 were characterized by flow cytometric analysis. The studied antibodies against human surface antigen were CD105, CD73, CD90, CD34, CD45, CD106, CD54, CD44, CD151, CD49e, and CD146 (Table 2). The staining method followed was in accordance with the instruction manual provided with the individual antibodies. The harvested human chondrocytes and CPs were directly incubated with phycoerythrin (PE) and fluorescein isothiocyanate (FITC) labelled antihuman antibody specific for the above-mentioned antibodies. BD FACS Calibur or BD FACS Celesta flow cytometers were used for data acquisition. Gating and compensation was applied using BD FACS Diva v 5.0.2 software, and isotype controls were run for the specific antibodies. Flow cytometric analysis results are reported as mean ± SD (Table 3).
Table 2.
List of Antibodies Used for Characterization of Chondrocytes and Chondroprogenitors by Flow Cytometric Analysis.
| Groups | Surface Markers | Fluorochrome Conjugate | Source | |
|---|---|---|---|---|
| Group I: Classical MSC markers | CD105 | Endoglin glycoprotein | FITC | BD Bioscience |
| CD73 | Ecto-5′- nucleotidase | PE | BD Bioscience | |
| CD90 | Thymus cell antigen-1 | PE | BD Bioscience | |
| Group II: Negative MSC markers | CD34 | Hematopoietic stem cell markers | PE | BD Bioscience |
| CD45 | FITC | BD Bioscience | ||
| Group III: Stem cell and chondrocyte markers | CD106 | Vascular cell adhesion molecule-1 (VCAM-1) | PE | Miltenyi Biotec |
| CD54 | Intracellular adhesion molecule-1 (ICAM-1); hylaluronan receptor | PE | Miltenyi Biotec | |
| CD44 | PE | Miltenyi Biotec | ||
| Group IV: Chondroprogenitor-specific markers | CD29 | Integrin beta-1 (Iβ1) | PE | Miltenyi Biotec |
| CD151 | Tetraspanin family | PE | Miltenyi Biotec | |
| CD166 | Activated leucocyte adhesion molecule | PE | Miltenyi Biotec | |
| CD49e | Integrin alpha-5 (Iα5); fibronectin receptor | PE | Miltenyi Biotec | |
| CD146 | Melanoma cell adhesion molecule | PE | Miltenyi Biotec | |
MSC = mesenchymal stem cell; CD = cluster of differentiation; FITC = fluorescein isothiocyanate; PE = phycoerythrin.
Table 3.
Results of Flow Cytometric Analysis (percentage expression) performed for Chondrocytes and Chondroprogenitorsa.
| CD Markers | Chondrocytes | CP | ||||||
|---|---|---|---|---|---|---|---|---|
| N | OA | N | OA | |||||
| p0 | p5 | P0 | p5 | p0 | p5 | p0 | p5 | |
| CD105 | 29.3 ± 21.8 | 8.2 ± 2.9 | 43.5 ± 39.0 | 41.2 ± 31.2 | 17.7 ± 12.4 | 53.0 ± 18.2 | 51.5 ± 41.2 | 49.6 ± 9.8 |
| CD73 | 86.9 ± 10.5 | 64.4 ± 55.3 | 99.5 ± 0.4 | 99.4 ± 0.6 | 97.8 ± 1.1 | 95.3 ± 4 | 92.2 ± 8.8 | 97.9 ± 1 |
| CD90 | 97.2 ± 3.8 | 98.9 ± 1.2 | 96.8 ± 0.7 | 100.0 | 100.0 | 99.9 ± 0.2 | 99.7 ± 0.2 | 100.0 ± 0.1 |
| CD34 | 22.4 ± 9.8 | 47.7 ± 45.7 | 2.2 ± 1.4 | 16.0 ± 12.8 | 1.6 ± 2.2 | 0.2 ± 0.2 | 0.6 ± 0.8 | 1.2 ± 1.30 |
| CD45 | 1.0 ± 1 | 6.0 ± 8.5 | 1.7 ± 1.5 | 0.5 ± 0.4 | 0.4 ± 8.0.3 | 0.3 ± 0.3 | 1.1 ± 1.1 | 0.6 ± 0.4 |
| CD106 | 20.4 ± 27.3 | 13.3 ± 12.2 | 44.1 ± 10.3 | 17.5 ± 15.2 | 10.5 ± 8.2 | 3.1 ± 2.8 | 15.6 ± 8.1 | 22.4 ± 30.5 |
| CD54 | 92.6 ± 10.1 | 88.2 ± 14.1 | 94.2 ± 3.1 | 94.4 ± 5.5 | 97.8 ± 3.1 | 94.5 ± 4.5 | 78.6 ± 26.8 | 94.2 ± 5.4 |
| CD44 | 99.8 ± 0.1 | 98.9 ± 0.7 | 99.6 ± 0.5 | 99.9 ± 0.1 | 100.0 | 100.0 ± 0.1 | 99.6 ± 0.6 | 100.0 ± 0.6 |
| CD29 | 99.8 ± 0.1 | 99.6 ± 0.3 | 99.6 ± 0.5 | 100.0 | 100.0 | 99.7 ± 0.3 | 100.0 ± 0.1 | 100.0 ± 0.1 |
| CD151 | 98.5 ± 1.4 | 99.6 ± 0.4 | 99.5 ± 0.8 | 99.9 ± 0.2 | 99.9 ± 0.1 | 100.0 | 98.2 ± 2.6 | 100.0 ± 2.6 |
| CD166 | 58.0 ± 17.7 | 77.9 ± 13.5 | 85.3 ± 2.8 | 96.4 ± 0.15.6 | 98.7 ± 2 | 99.9 ± 0.2 | 99.6 ± 0.5 | 100.0 ± 0.5 |
| CD 49e | 95.7 ± 6.1 | 97.2 ± 4.5 | 93.6 ± 10 | 99.9 ± 0.1 | 99.8 ± 0.4 | 99.9 ± 0.1 | 94.8 ± 8.5 | 100.0 ± 8.5 |
| CD146 | 20.6 ± 10.7 | 26.5 ± 21.1 | 23.1 ± 8.1 | 13.4 ± 7.3 | 18.4 ± 4.6 | 76.4 ± 15 | 26.7 ± 28.0 | 58.1 ± 28.0 |
CP = chondroprogenitor; N = normal; OA = osteoarthritic; p0 = passage 0; p5 = passage 5.
Data expressed as mean ± SD.
Electrophysiology
Borosilicate glass capillaries (Kimax Borosilicate Capillaries, Fischer Scientific) were used for patch pipette fabrication. Pipettes were pulled using a 2-step gravity assisted Narishige PP-830 vertical pipette puller. Pipettes used for experiments had a resistance of 1.5 to 3.0 MΩ. Bath solution used for resuspending cells had the following composition (in mM): NaCl 140, KCl 5, MgCl2 1, CaCl2 1, HEPES 10, glucose 10, pH 7.4 (using 1 M NaOH). The pipette solution used had the following composition (in mM): KC1 140, MgCl2 2, HEPES 10, glucose 10, pH 7.35 (using 1 M KOH). The osmolarity (in mOsm/L) for bath and pipette solutions ranged from 290 to 310 and 280 to 290, respectively. Data were acquired using Axopatch 200B patch clamp amplifier and digitized using Axon Instruments Digidata 1322A analogue-digital converter (Molecular Devices). All recordings were made in whole-cell configuration, and capacitance was measured for each cell using the Membrane test function provided by Clampex 9.2 software (Molecular Devices). Data were filtered at 10 kHz (low-pass Bessel filter) and sampled at 50 kHz. Potentials ranging from −120 mV to +70 mV (increment of 10 mV) were used to record leak (at hyperpolarizing potentials) as well as ionic currents (VHold −80 mV). Tetra-ethyl-ammonium chloride (10 mM; TEACl) was used to block potassium currents. TEACl was added to the bath using focal perfusion (OCTAFLOW II perfusion set up, ALA Scientific Instruments).
Reverse Transcription-Polymerase Chain Reaction
Total RNA was isolated with TRIzol reagent (Sigma) as per the manufacturer’s instructions. The nucleic acid concentration was quantified using Nanodrop 2000c spectrophotometer (ThermoScientific). Total RNA was visually assessed by Image Quant 400 Gel Doc system (GB) for 28 seconds–18 seconds ratio using 1% agarose gel containing ethidium bromide. A total of 200 ng of RNA (in 10 µL reaction volume) was reverse transcribed to cDNA using RT-RTCK-03 kit (Eurogenetec). The RT cycle conditions using Gene Amp PCR System 9700 were as follows: 25°C for 10 minutes, 48°C for 30 minutes, and 95°C for 5 minutes. Quantitative RT-PCR was performed with Takyon Rox SYBR Master Mix dTTP Blue (Eurogenetec) by QuantStudio 6K Flex (Applied Biosystem). Fluorescence was acquired using the following cycling conditions: 95°C for 3 minutes Takyon activation, 40 amplification cycles (95°C for 3 seconds and annealing at 60°C). Each sample was run in triplicate, and the threshold cycle (Ct) value was defined as the cycle number at which the curve crosses the threshold set at the midpoint of the log fluorescence expansion. The relative expression level for each gene was normalized to the GAPDH expression levels. Sequences of the primers used for this study are listed in Table 4.
Table 4.
Sequence of the Primers Used for RT-PCR.
| Gene of Interest | Primers (5′-3′) | Product Size (bp) | |
|---|---|---|---|
| Forward Primer | Reverse Primer | ||
| MaxiK | CGGTTAGTGGAAGAAAGCACA | GAGGACGGAACCCTGATAAAA | 42 |
| HKv1.1 | CCATCATTCCTTATTTCATCAC | CTCTTCCCCCTCAGTTTCTC | 42 |
| hKv1.4 | ACGAGGGCTTTGTGAGAGA | TAAGATGACCAGGACGGACA | 39 |
| hKv4.2 | GCCTTCTTCTGCTTGGACAC | TCATCACCAGCCCAATGTAA | 40 |
| hEAG1 | TGGTCCTGCTGGTGTGTG | ACAACGAGGAGATGTAGACAG | 39 |
| hEAG2 | AGGTCCTACAGTGTTTGTGTATC | GAGCTGGAATATGGCGAGAA | 43 |
| hNE-Na | GCTCCGAGTCTTCAAGTTGG | GGTTGTTTGCATCAGGGTCT | 40 |
| SCN5A | CCTAATCATCTTCCGCATCC | TGTTCATCTCTCTGTCCTCATC | 42 |
| CACNA1C | AAGGCTACCTGGATTGGATCAC | GCCACGTTTTCGGTGTTGAC | 42 |
| CACNA1G | CTTTGCCGAAGGTAGCGCCGAAT | GGCACATCTGGTGGGCTCTA | 43 |
| GAPDH | TCAGCAATGCCTCCTGCAC | TCTGGGTGGCAGTGATGGC | 117 |
RT-PCR = reverse transcription-polymerase chain reaction; Maxi K = human large-conductance calcium activated K+ channel; HKv1.1 = voltage gated K+ channel (subfamily A member 1); hKv1.4 = human voltage gated K+ channel (subfamily A member 4); hKv4.2 = human voltage gated K+ channel (subfamily D member 2); hEAG1 = K+ voltage gated channel (subfamily H member 1); hEAG2 = K+ voltage gated channel (subfamily H member 2); hNE-Na = human neuroendocrine tetrodotoxin-sensitive voltage-activated Na+ channel; SCN5A = human cardiac tetrodotoxin-insensitive voltage-dependent Na+ channel; CACNA1C = human voltage-dependent L-type Ca2+ channel; CACNA1G = human voltage-dependent T-type; GAPDH = glyceraldehyde 3-phosphate dehydrogenase.
Statistical Analysis
pClamp (for patch clamp data), Microsoft Excel, and IGOR Pro Version 5.0.4.8 (Wavemetrics Inc.) were used for offline analysis and pictographical representation of data. Results were reported as mean ± standard error mean. SPSS software (version 17.0) was used for statistical analysis. Wilcoxon rank-sum (Mann-Whitney) test was used to compare mean current densities at +60 mV, mean cell capacitance, and the relative expression level for each gene (normalized to the GAPDH) across different cell types (chondrocytes vs. CP) and cell source (N vs. OA). Wilcoxon signed rank test was used to compare mean current densities at +60 mV, cell capacitance, and the relative expression level for each gene (normalized to the GAPDH) across time in culture (p0 vs. p5). A P value of ⩽0.05 was considered as significant.
Results
Electrophysiology
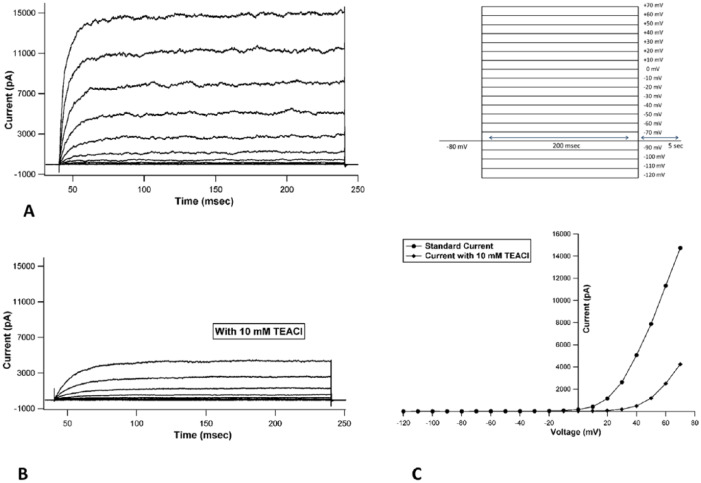
When currents recorded in chondrocytes were analyzed, they revealed the presence of voltage-activated outward currents that were non-inactivating in nature (Fig. 2A). When current-voltage (I-V) curves were generated from the raw tracings, they showed outward rectification, collectively suggestive of voltage gated potassium current (Fig. 2C). Focal perfusion with 10 mM TEACl produced a substantial inhibition of current amplitude (Fig. 2B) in all cells patched, identifying the current as originating from a voltage gated potassium channel subfamily.
Figure 2.
Representative current tracings from passage 0 normal chondrocyte: (A) recorded under control conditions, (B) after exposure to 10 mM TEACl, (C) representative I-V curve before and after addition of 10 mM TEACl showing drop in peak magnitude at every voltage step seen after addition of 10 mM TEACl (inset: protocol used: VHold = −80 mV, depolarizing steps ranging from −120 mV to+70 mV with an increment of 10 mV).
Intergroup Comparison
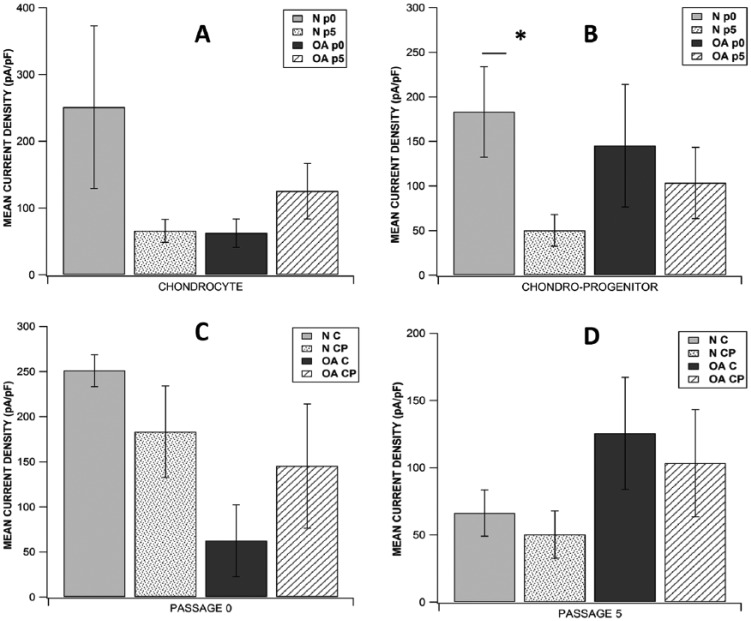
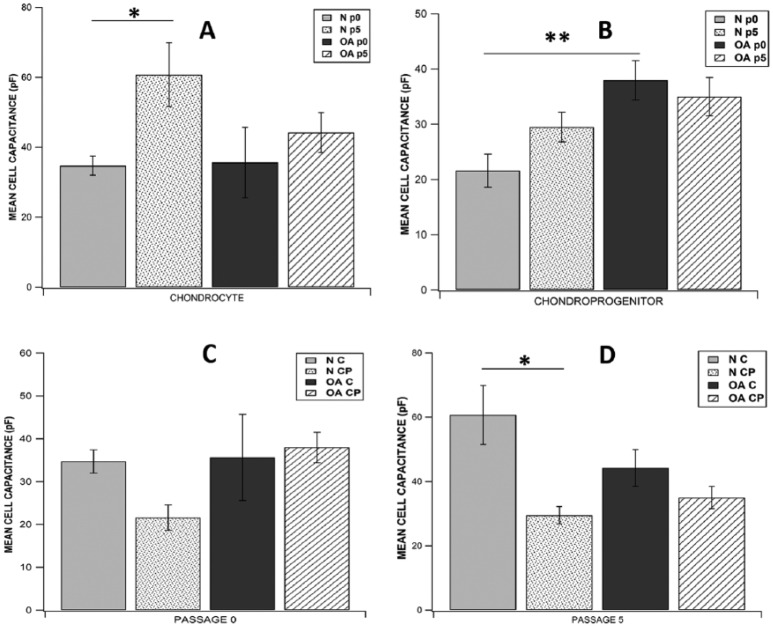
Analysis of the current tracings revealed similar current profile in chondrocytes and CP acquired from N/OA cartilage taken either from p0 or p5. Focal perfusion with 10 mM TEACl also had a similar effect on current magnitude of cells from all study groups. Of all the 8 subgroups studied, highest mean current density was observed in p0 normal chondrocytes (251.033 ± 121.83 pA/pF, n = 8) and lowest was seen in p5 normal CPs (50.226 ± 17.63 pA/pF, n = 7) (Fig. 3). When mean current density (at +60 mV) was compared across p0 and p5, there was no significant difference between chondrocytes (C) and CPs derived from either N or OA cartilage (p0 N C: n = 8, p0 OA C: n = 7, p5 N C: n = 6, p5 OA C: n = 6, p0 N CP: n = 7, p0 OA CP: n = 8, p5 N CP: n = 7, p5 OA CP: n = 8; P > 0.05; Fig. 3). While studying the effect of time in culture for individual cell populations from normal or OA cartilage, we did not see significant difference in mean current density (at +60mV) in various chondrocyte subgroups, but in the CP group, p0 normal CPs had significantly higher current density than p5 normal CPs (p0 N CP: 183.171 ± 50.80 pA/pF, p5 N CP: 50.225 ± 17.63 pA/pF; P = 0.0280; Fig. 3B). In the 8 subgroups studied, highest mean cell capacitance was observed in p5 normal chondrocytes (60.742 ± 9.15 pA/pF, n = 6) and lowest was seen in p0 normal CPs (21.564 ± 2.98 pA/pF, n = 7). While comparing mean cell capacitance across p0 and p5, there was no significant difference between chondrocytes and CPs derived from either normal or OA cartilage except that p0 OA CPs had significantly higher mean capacitance than p0 normal CPs (p0 OA CP: 37.939 ± 3.55 pF, p0 N CP: 21.564 ± 2.98 pF; P = 0.0057; Fig. 4), and p5 normal chondrocytes had significantly higher mean capacitance than p5 normal CPs (p5 N C: 60.742 ± 9.155 pF, p5 N CP: 29.494 ± 2.701 pF; P = 0.0170; Fig. 4). While studying the effect of time in culture on mean cell capacitance, it was seen that only p5 normal chondrocytes showed a significantly higher value than p0 normal chondrocytes (p5 N C: 60.742 ± 9.155 pF, p0 N C: 34.719 ± 2.70 pF; P = 0.0464; Fig. 4A) while all other cell sub groups showed no significant difference.
Figure 3.
Comparison of current densities between (A) all chondrocytes subgroups, (B) all chondroprogenitor subgroups, (C) all subgroups at passage 0, and (D) all subgroups at passage 5. Data expressed as mean ± SEM (*P < 0.05 using Wilcoxon rank-sum test for A and B; Wilcoxon signed rank test for C and D). N = normal; OA = osteoarthritic; C = chondrocytes; CP = chondroprogenitors; p0 = passage 0; p5 = passage 5.
Figure 4.
Comparison of cell capacitance between (A) all chondrocytes subgroups, (B) all chondroprogenitor subgroups, (C) all subgroups at passage 0, and (D) all subgroups at passage 5. Data expressed as mean ± SEM (*P < 0.05, **P < 0.01, using Wilcoxon rank-sum test for A and B; Wilcoxon signed rank test for C and D). N = normal; OA = osteoarthritic; C = chondrocytes; CP = chondroprogenitors; p0 = passage 0; p5 = passage 5.
mRNA Expression of Ionic Channels
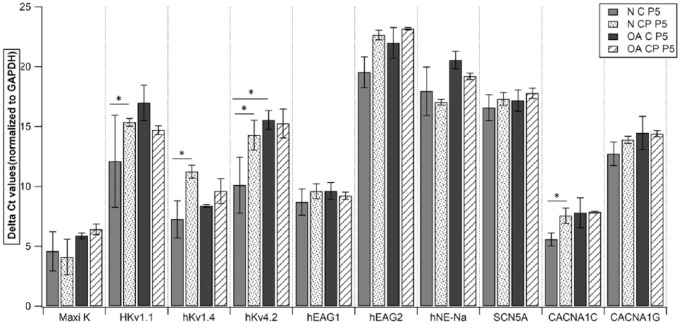
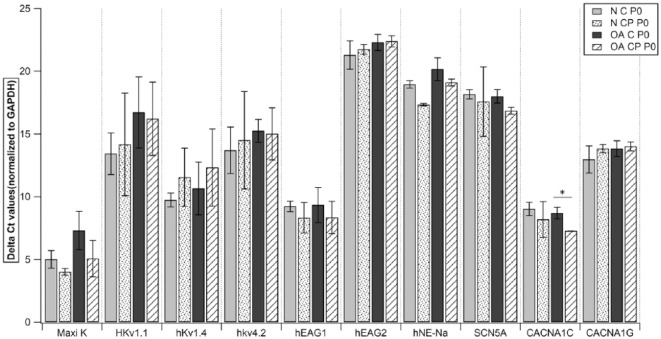
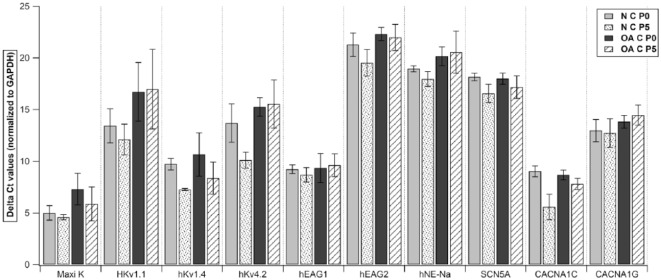
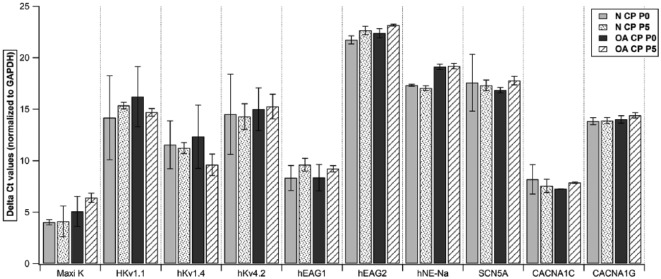
To study the expression of ionic channels, we examined gene expression of specific primers in both chondrocytes and CPs from normal and OA cartilage at p0 and p5. Quantitative RT-PCR analysis of both cell populations showed a high expression of Maxi K (human large-conductance calcium activated K+ channel), hKv1.4 (human voltage gated K+ channel: subfamily A member 4), hKv4.2 (human voltage gated K+ channel: subfamily D member 2), hEAG1(K+ voltage gated channel: subfamily H member 1), CACNA1C (human voltage-dependent L-type Ca2+ channel), and a moderate expression of HKv1.1 (voltage gated K+ channel: subfamily A member 1) and CACNA1G (human voltage-dependent T-type). However, both the populations showed a very low expression of hEAG2 (K+ voltage gated channel: subfamily H member 2), hNE-Na (human neuroendocrine tetrodotoxin-sensitive voltage-activated Na+ channel), and SCN5A (human cardiac tetrodotoxin-insensitive voltage-dependent Na+ channel) (Figs. 5-8). Intergroup comparison was done only for genes that showed high and moderate expression. When relative expression of these genes was compared across p0 and p5, there was no significant difference between chondrocytes and CPs derived from normal or OA cartilage except for in (a) HKv1.1, p5 normal CPs (mean ΔCt: 15.35) showed a lower expression than normal chondrocytes (mean ΔCt: 12.11, P = 0.0495; Fig. 5); (b) HKv1.4, p5 normal CPs (mean ΔCt: 11.23) showed lower expression than normal chondrocytes (mean ΔCt: 7.25, P = 0.0495; Fig. 5); (c) HKv4.2, p5 normal CPs (mean ΔCt: 14.28) showed lower expression than normal chondrocytes (mean ΔCt: 10.11, P = 0.0495; Fig. 5) and p5 OA chondrocytes (mean ΔCt: 8.37) showed lower expression than normal CPs (mean ΔCt: 7.25, P = 0.0495; Fig. 5); (d) CACNA1C, p0 OA chondrocytes (mean ΔCt: 8.69) showed lower expression than normal CPs (mean ΔCt: 7.26, P = 0.0495; Fig. 6) and p5 normal CPs (mean ΔCt: 7.55) showed lower expression than normal chondrocytes (mean ΔCt: 5.57, P = 0.0495; Fig. 5). When the expressions were compared to study the effect of time in culture for both cell populations, we did not see significant difference in their relative expression in various chondrocyte as well as CP subgroups (Figs. 7 and 8).
Figure 5.
Quantitative RT-PCR analysis of Maxi K, HKv1.1, hKv1.4, hKv4.2, hEAG1, hEAG2, hNE-Na, SCN5A, CACNA1C, and CACNA1G in all subgroups at passage 5. Data expressed as mean ± SEM (*P < 0.05 using Wilcoxon signed rank test). N = normal; OA = osteoarthritic; C = chondrocytes; CP = chondroprogenitors; p5 = passage 5. Samples taken from n = 3 donors, each sample was run in triplicate.
Figure 6.
Quantitative RT-PCR analysis of Maxi K, HKv1.1, hKv1.4, hKv4.2, hEAG1, hEAG2, hNE-Na, SCN5A, CACNA1C, and CACNA1G in all subgroups at passage 0. Data expressed as mean ± SEM (*P < 0.05 using Wilcoxon signed rank test). N = normal; OA = osteoarthritic; C = chondrocytes; CP = chondroprogenitors; p0 = passage 0. Samples taken from n = 3 donors, each sample was run in triplicate.
Figure 7.
Quantitative RT-PCR analysis of Maxi K, HKv1.1, hKv1.4, hKv4.2, hEAG1, hEAG2, hNE-Na, SCN5A, CACNA1C, and CACNA1G in all chondrocyte subgroups. Data expressed as mean ± SEM (*P < 0.05 using Wilcoxon rank sum test). N = normal; OA = osteoarthritic; C = chondrocytes; p0 = passage 0; p5 = passage 5. Samples taken from n = 3 donors, each sample was run in triplicate.
Figure 8.
Quantitative RT-PCR analysis of Maxi K, HKv1.1, hKv1.4, hKv4.2, hEAG1, hEAG2, hNE-Na, SCN5A, CACNA1C, and CACNA1G in all chondroprogenitor subgroups. Data expressed as mean ± SEM (*P < 0.05 using Wilcoxon rank sum test). N = normal; OA = osteoarthritic; CP = chondroprogenitor; p0 = passage 0; p5 = passage 5. Samples taken from n = 3 donors, each sample was run in triplicate.
Discussion
At present cell-based therapeutics form the cornerstone of articular cartilage repair and primarily employ the use of chondrocytes and MSCs. Human MSCs have been reported to show functional presence and mRNA expression of certain channels such as Maxi K, hKv1.4, hKv4.2, hEAG1, hNE-Na, CACNA1C, and CACNA1G.12-14 Also, abundant knowledge exists about the chondrocyte channelome since these are resident cells of articular cartilage.5 Since CPs have been classified as MSCs conforming to the minimal criteria of International Society for Cellular Therapy, but are also native to the articular cartilage along with chondrocytes, it was imperative to assess their usefulness as an ideal cell source for cartilage healing.9,15 There is long-standing evidence that demonstrates that chondrocyte phenotype is altered when expanded in monolayer culture, a phenomenon that has come to be known as de-differentiation.8,16-18 One of the objectives, therefore, was to compare passaged chondrocytes and CPs and look at the effect of time in culture on both cell populations. The characteristics used to assess CPs were also extended to chondrocytes so as to achieve a standard, unbiased comparison protocol. Our results demonstrated that both chondrocytes and CPs showed the presence of voltage activated outward, TEA-sensitive currents, which were non-inactivating in nature suggestive of the current originating from a voltage gated K+ channel subfamily. Quantitative RT-PCR analysis showed high expression of Maxi K, HKv1.1, hKv1.4, hKv4.2, and hEAG1. Since aforementioned ion channels belong to voltage gated K+ channel subfamilies, functional presence of the TEA-sensitive current could be attributed to either of these channels or a combination of them.
It has been reported that K+ channels in articular cartilage have myriad roles including, but not limited to, maintenance of resting membrane potential, mechano-transduction, cell volume regulation, chondrogenesis, and cell proliferation. Suggestions have been made that even subtle changes in channel expression or usage of potassium channel blockers can hinder cell proliferation and enhance cell hypertrophy.8,12,13 Our results indicated that with time in culture both cell populations derived from normal cartilage demonstrated a decrease in mean current density with a significant decrease observed in CPs (Fig. 3; P = 0.028). However, the mRNA expression of Maxi K, HKv1.1, hKv1.4, hKv4.2, and hEAG1 channels decreased in CPs but showed an increase in chondrocytes when comparison was made across p0 and p5 (P > 0.05). Since both functional presence and mRNA expression decreased in CPs with culture, it would be prudent to utilize CPs from earlier passages as they seem to exhibit lower adaptability to repeated passaging. The trend observed also supports reports that suggest that chondrocytes may acquire increased chondrogenic and proliferative properties with increased time in culture11 but may also experience loss of volume regulation as evidenced by a significant increase in their size with repeated passaging (Fig. 4A; P = 0.0469).
Since none of the study arms exhibited the presence of inward currents, we turned to RT-PCR data for corroboration of the same. While checking for mRNA expression of voltage gated sodium channels, as reported to be seen in human MSCs,14 we observed nil expression of hNE-Na (tetrodotoxin sensitive sodium channel) and SCN5A (tetrodotoxin insensitive sodium channel) channels in both chondrocytes and CPs. Published data have shown that L-type Ca2+ channels play a role in chondrocyte health as is evidenced by its overexpression in chondrocytes experiencing osteoarthritic insult.19 Our RT-PCR results also support this finding as both cell populations displayed mRNA expression of CACNA1C. Furthermore, normal chondrocytes and CPs exhibited a lower expression than their OA counterparts.
When chondrocytes and CPs derived from OA cartilage were compared, p0 OA CPs showed a significantly higher expression than p0 OA chondrocytes. It may be suggested that CPs are more sensitive to inflammatory processes occurring at the cellular level as seen in OA. This supposition is also supported by our finding that p0 CPs from OA cartilage have a larger cell size (higher capacitance) than p0 CPs from normal cartilage (Fig. 4; P = 0.0057). This may be due to disrupted regulatory activity as a consequence of osteoarthritis in CPs, which results in decreased osmotic potential and cellular swelling.20,21
In summary, our results indicate that chondrocytes and CPs (fibronectin adhesion assay) displayed similar characteristics when subjected to patch clamp and RT-PCR analysis. Both the cell populations did not show the presence of voltage gated sodium channels as have been evidenced in human MSCs. An interesting finding from this study was the differential cellular response to time in culture and OA activity. Our results indicate that utilization of CPs from early passages may be beneficial as they are sensitive to time in culture; therefore, repeated passaging may not be required as these cells possess high replicative potential even when seeding density is low. On the other hand, chondrocytes, which in comparison have lower replicative capacity, may show enhanced potential for chondrogenesis and cell proliferation after serial passaging, although an in-depth analysis is required to confirm this hypothesis. In conclusion, both chondrocytes and CPs appear to be optimal candidates for cell-based therapy although due consideration should be given when initial seeding density, cell source (normal vs. OA cartilage), and expansion in culture are matters of concern, prior to cell-type selection.
Footnotes
Acknowledgments and Funding: The authors would like to acknowledge the Center for Stem Cell Research and the Department of Physiology, Christian Medical College, Vellore, for infrastructural support. This project (Ref: AOTAP 17-14) was supported by AO Trauma Asia Pacific of the AO Foundation.
Declaration of Conflicting Interests: The author(s) declared no potential conflicts of interest with respect to the research, authorship, and/or publication of this article.
Ethical Approval: Ethical approval for this study was obtained from the Institutional Review Board (Christian Medical College, IRB Min No:10652).
Informed Consent: Written informed consent was obtained from all subjects before the study.
ORCID iD: Upasana Kachroo  https://orcid.org/0000-0002-9552-8312
Elizabeth Vinod  https://orcid.org/0000-0001-7340-8320
References
- 1. Sophia Fox AJ, Bedi A, Rodeo SA. The basic science of articular cartilage: structure, composition, and function. Sports Health. 2009;1:461-8. [DOI] [PMC free article] [PubMed] [Google Scholar]
- 2. Silver FH, Glasgold AI. Cartilage wound healing. An overview. Otolaryngol Clin North Am. 1995;28:847-64. [PubMed] [Google Scholar]
- 3. Madeira C, Santhagunam A, Salgueiro JB, Cabral JM. Advanced cell therapies for articular cartilage regeneration. Trends Biotechnol. 2015;33:35-42. [DOI] [PubMed] [Google Scholar]
- 4. Jayasuriya CT, Chen Q. Potential benefits and limitations of utilizing chondroprogenitors in cell-based cartilage therapy. Connect Tissue Res. 2015;56:265-71. [DOI] [PMC free article] [PubMed] [Google Scholar]
- 5. Mobasheri A, Kalamegam G, Musumeci G, Batt ME. Chondrocyte and mesenchymal stem cell-based therapies for cartilage repair in osteoarthritis and related orthopaedic conditions. Maturitas. 2014;78:188-98. [DOI] [PubMed] [Google Scholar]
- 6. Alves EG, Serakides R, Boeloni JN, Rosado IR, Ocarino NM, Oliveria HP, et al. Comparison of the osteogenic potential of mesenchymal stem cells from the bone marrow and adipose tissue of young dogs. BMC Vet Res. 2014;10:190. [DOI] [PMC free article] [PubMed] [Google Scholar]
- 7. Akgun I, Unlu MC, Erdal OA, Oqut T, Erturk M, Ovali E, et al. Matrix-induced autologous mesenchymal stem cell implantation versus matrix-induced autologous chondrocyte implantation in the treatment of chondral defects of the knee: a 2-year randomized study. Arch Orthop Trauma Surg. 2015;135:251-63. [DOI] [PubMed] [Google Scholar]
- 8. Schulze-Tanzil G. Activation and dedifferentiation of chondrocytes: implications in cartilage injury and repair. Ann Anat. 2009;191:325-38. [DOI] [PubMed] [Google Scholar]
- 9. Williams R, Khan IM, Richardson K, Nelson L, McCarthy HE, Analbelsi T, et al. Identification and clonal characterisation of a progenitor cell sub-population in normal human articular cartilage. PloS One. 2010;5:e13246. [DOI] [PMC free article] [PubMed] [Google Scholar]
- 10. Nelson L, McCarthy HE, Fairclough J, Williams R, Archer CW. Evidence of a viable pool of stem cells within human osteoarthritic cartilage. Cartilage. 2014;5:203-14. [DOI] [PMC free article] [PubMed] [Google Scholar]
- 11. Vinod E, Boopalan PRJVC, Sathishkumar S. Reserve or resident progenitors in cartilage? Comparative analysis of chondrocytes versus chondroprogenitors and their role in cartilage repair. Cartilage. 2018;9(2):171-82. [DOI] [PMC free article] [PubMed] [Google Scholar]
- 12. Heubach JF, Graf EM, Leutheuser J, Bock M, Zahanich I, Christ T, et al. Electrophysiological properties of human mesenchymal stem cells. J Physiol. 2004;554(Pt 3):659-72. [DOI] [PMC free article] [PubMed] [Google Scholar]
- 13. Li GR, Deng XL, Sun H, Chung SS, Tse HF, Lau CP. Ion channels in mesenchymal stem cells from rat bone marrow. Stem Cells. 2006;24:1519-28. [DOI] [PubMed] [Google Scholar]
- 14. Li GR, Sun H, Deng X, Lau CP. Characterization of ionic currents in human mesenchymal stem cells from bone marrow. Stem Cells. 2005;23:371-82. [DOI] [PubMed] [Google Scholar]
- 15. Dominici M, Le Blanc K, Mueller I, Slaper-Cortenbach I, Marini F, Krause D, et al. Minimal criteria for defining multipotent mesenchymal stromal cells. The International Society for Cellular Therapy position statement. Cytotherapy. 2006;8:315-7. [DOI] [PubMed] [Google Scholar]
- 16. Lemare F, Steimberg N, Le Griel C, Demignot S, Adolphe M. Dedifferentiated chondrocytes cultured in alginate beads: restoration of the differentiated phenotype and of the metabolic responses to interleukin-1beta. J Cell Physiol. 1998;176:303-13. [DOI] [PubMed] [Google Scholar]
- 17. Benya PD, Padilla SR, Nimni ME. Independent regulation of collagen types by chondrocytes during the loss of differentiated function in culture. Cell. 1978;15:1313-21. [DOI] [PubMed] [Google Scholar]
- 18. Pietschmann MF, Niethammer TR, Horng A, Gülecyüz MF, Feist-Pagenstert I, Jansson V, et al. The incidence and clinical relevance of graft hypertrophy after matrix-based autologous chondrocyte implantation. Am J Sports Med. 2012;40:68-74. [DOI] [PubMed] [Google Scholar]
- 19. Matta C, Zakany R, Mobasheri A. Voltage-dependent calcium channels in chondrocytes: roles in health and disease. Curr Rheumatol Rep. 2015;17:43. [DOI] [PubMed] [Google Scholar]
- 20. Bush PG, Hall AC. The volume and morphology of chondrocytes within non-degenerate and degenerate human articular cartilage. Osteoarthritis Cartilage. 2003;11:242-51. [DOI] [PubMed] [Google Scholar]
- 21. Stockwell R. Cartilage failure in osteoarthritis: relevance of normal structure and function. A review. Clin Anat. 1991;4:161-91. [Google Scholar]


