Abstract
Phospholipids content in cellular and mitochondrial membranes is essential for maintaining normal function. Previous studies have found a lower polyunsaturated fatty acid (PUFA) content in mitochondria than whole tissue, theorizing decreased PUFA protects against oxidative injury. However, phospholipids (PPLs) are uniquely difficult to quantify without class separation and, as prior approaches have predominately used reverse-phase HPLC or shotgun analysis, quantitation of PPL classes may have been complicated due to the existence of numerous isobaric and isomeric species. We apply normal-phase HPLC with class separation to compare whole tissue and mitochondrial PPL profiles in rat brain, heart, kidney, and liver. In addition, we establish a novel method to ascertain PPL origin, using cardiolipin as a comparator to establish relative cardiolipin /PPL ratios. We report a higher PUFA content in tissue mitochondria driven by increased phosphatidylcholine unsaturation, suggesting mitochondria purposefully incorporate higher PUFA PPLs.
Keywords: HPLC-MS, normal phase, cardiolipin, quantitation
1. Introduction
The phospholipid (PPL) content of cellular and mitochondrial membranes directly influences the physiologic properties of their signaling, transport, and metabolism [1–3]. Abnormal PPL composition can both cause pathology and arise as a direct effect of diseases including cardiac failure [4], diabetes [5, 6], Barth syndrome [7], and Parkinson’s disease [8]. In particular, the importance of maintaining proper amounts of polyunsaturated fatty acids (PUFAs) has been shown in a variety of pathological conditions [4, 9, 10]. However, the establishment of a relationship between normal and abnormal PPL composition is complicated by the unique membrane composition found in various tissue types, whether it is the cell or mitochondrial membrane, and by the fact that the composition of PPL changes depending on the fatty acid content in diets [11].
PPL composition is a tightly controlled parameter with direct consequences on mitochondrial function and stability. Maintenance of the mitochondrial membrane requires the synthesis of cardiolipin (CL), a unique mitochondrial PPL synthesized from phosphatidylglycerol (PG) which, if improperly synthesized, can lead to conditions such as cardiomyopathy and Barth syndrome [7]. However, while CL is unique to the mitochondria, a majority of the mitochondrial membrane is composed of phosphatidylcholine (PC) and phosphatidylethanolamine (PE), comprising ~40% and ~30% of the mitochondrial membrane respectively, alongside phosphatidylinositol (PI) (~10–15%) and phosphatidylserine (PS) (~5%) [12, 13].
Some PPLs such as CL, PE, and PG can be synthesized directly or imported to the mitochondria while PC and PS must be synthesized in the endoplasmic reticulum and transported to the mitochondria. Finally, modification to the acyl chains contained in the PPLs alters membrane functionality increasing or decreasing the content of PUFAs versus monounsaturated fatty acids (MUFAs), a factor which has been theorized to drastically alter mitochondrial functionality and contribute to disease processes and aging [14].
Previous studies have demonstrated that mitochondria hold unique PPL profiles compared to whole tissue [15–17]. However, the degree of fatty acids saturation in whole tissue and mitochondrial PPLs can vary significantly based on tissue type, with unique profiles [18]. In this setting the careful analysis of PPL class composition and membrane origin is essential to establish normal PPL profiles prior to their contextualization in the setting of disease. Quantification of cellular and mitochondrial PPLs has; however, been associated with significant limitations. Previous studies have predominately used reverse-phase high performance lipid chromatography (HPLC) [19] or shotgun analysis [5]. However, the wide variety of PPL class composition and content of individual species fosters ion suppression [20] which, alongside the nearly identical weight and charge of common PPL classes, fosters errors in automated selection of class peaks, raising the capacity for false positives [21]. While more technically challenging to replicate, normal-phase HPLC can effectively separate PPL classes based on retention time, significantly reducing errors in analysis based on molecular weight and MS/MS [22]. In the present work, we apply normal-phase HPLC to compare whole tissue and mitochondrial PPL profiles in rat brain, heart, kidney, and liver. Furthermore, we establish the use of relative CL content as a foundation for comparing relative PPL content in whole tissue and mitochondrial membranes. This is achieved by separating mitochondrial and whole tissue components and using normal-phase HPLC-MS to establish PPL/CL mole ratios in mitochondrial and whole tissue extracts. In this way we establish a new means of differentiating the origin of phospholipid derivatives from mitochondrial and non-mitochondrial sources in multiple tissue types essential to homeostasis. Finally, we found that the content of PUFAs is higher in mitochondrial membranes than whole tissue membranes in all four tissues, and PC is the major contributor for the higher content of PUFAs in mitochondria.
2. Experimental
2.1. Animals
The experimental protocol was approved by the Institutional Animal Care and Use Committee. Adult male Sprague-Dawley rats (440–530 g) were anaesthetized with 2% isoflurane. Once the rats were unable to respond to pain stimuli, the animals were sacrificed by decapitation to harvest the brain, heart, liver and kidney tissues. The tissues were processed for mitochondria isolation or immediately pulverized without washing blood to store at −80 °C. An adult rat holds about 30 mL of blood and 10 –15% of this blood volume is in the liver, which weighs 8–10 g. Therefore, 1 mg of liver tissue contains 0.3–0.6 μL blood. In our analysis, 25 μL of blood and 1 mg of liver tissue contain a similar amount of phospholipids. Therefore, the contribution of blood phospholipids to liver phospholipids will be approximately 2% in liver tissue. Since the liver is the most congestive tissue of the four tissues analyzed, the interference of blood phospholipid will be lower in the other tissues
2.2. Mitochondrial isolation
Mitochondrial isolation techniques have been reported previously [23]. Briefly, brain, heart, kidney and liver tissues were placed in an ice-cold mitochondria isolation buffer (MESH) composed of 210 mM mannitol, 70mM sucrose, 10 mM Hepes, and 0.2 mM EGTA, at 7.3 pH, blot-dried using a paper towel and weighed. The tissues were minced in MESH containing 0.2% BSA and homogenized at using tissue-specific number of strokes through the homogenizer (8, 12, 3, and 3 strokes respectively). Homogenates were centrifuged at low speeds (5600 xg for 1 min). Liver and kidney supernatants were immediately centrifuged at higher speeds (10000 xg for 6 min) while brain and heart pellets underwent an additional 2 cycles of homogenization and centrifugation before being added to the original supernatant. Pooled supernatant was centrifuged at high speeds beside kidney and liver supernatant. Brain supernatant was poured gently until synaptosomes were maintained at the top and was re-suspended in 20 ml of 12.5% Percoll in MESH and centrifuged at high speed. Concurrently, Heart, Kidney, and Liver pellets were resuspended in 20 mL of MESH buffer and centrifuged at high speeds. Mitochondrial pellets from Brain, Heart, Kidney and Liver samples were suspending in MESH to yield approximately 20 mg/mL, 25 mg/mL, 30 mg/mL and 45 mg/mL protein concentration by BCA assay respectively.
2.3. Phospholipid extraction
PPL extraction and separation was performed as reported previously [24, 25], wherein a solution of 950 μL of chloroform:methanol (2:1, v:v) alongside butylated hydroxytoluene (2mM) and 50 μL of potassium phosphate buffer (100mM, pH 7.4) was used to treat 0.5 mg of homogenized tissue or 60 μg of isolated mitochondria. As PPL hydrolysis is a rapid and dynamic process, the organic solution was added first to frozen samples, inactivating any potential enzymatic reactions. Solid-phase extraction was used to separate the PPL mixtures [25] before it was reconstituted in 200 μL of isopropanol (IPA):t-butyl methyl ether (TBME):aqueous ammonium formate (34:17:5, v:v:v).
2.4. Normal-phase HPLC-MS analysis
PPLs were separated by their class as per the previously developed normal-phase HPLC system [25]. Eluent A was created using IPA:TBME:aqueous ammonium (340:170:50) (pH ~2.5) with eluent B containing methanol. Ammonium formate (295 mg) was dissolved in 2 mL of formic acid in 50 mL of water to prepare the aqueous ammonium formate solution. Gradients used for 45 min chromatogram were: 100% A for 20 min, 100% A to 20% A over 10 min, 20% A for 6 min, 20% A to 100% A over 1 min and hold 100% for 6 min. MS and MS/MS data were obtained with an LTQ-XL mass spectrometer (Thermo Scientific, San Jose, CA) operated in the negative ion mode, collecting full scan MS data from 350–1700 m/z. The source parameters were: sheath gas flow (8 U), spray voltage (4 kV), capillary temperature (300 ° C), and capillary voltage (−9 V).
2.5. Data analysis
Data was processed using X-calibur software (version 2.2). Individual MS and MS/MS peaks were used to identify and compare PPL peaks against standard PPLs [25]. PPL concentration was ascertained by using standard curves generated using standard PPL. For quantification, the mass ranges for each class of PPL in m/z were 690–800 for PE, 855–915 for PI, 1420–1520 for heart, kidney, and liver CL, 1420–1610 for brain CL, and 740–900 for PC. For PS, 786–862 was used for tissues and brain mitochondria. The range for PG was 721–780. The concentration of PC includes both diacyl PE and plasmenyl PE (PEP). For low abundant PPL classes, significant background peaks were subtracted from the ranges. Quantitation of individual species in a class was based on the intensities of M0 and M1 peaks as previously reported [26]. The relative abundance of PPLs in mitochondrial and whole tissue extract were compared against each extract’s determined concentration of CL. The data are presented as means +/− standard deviation.
3. Results
3.1. Ion chromatogram
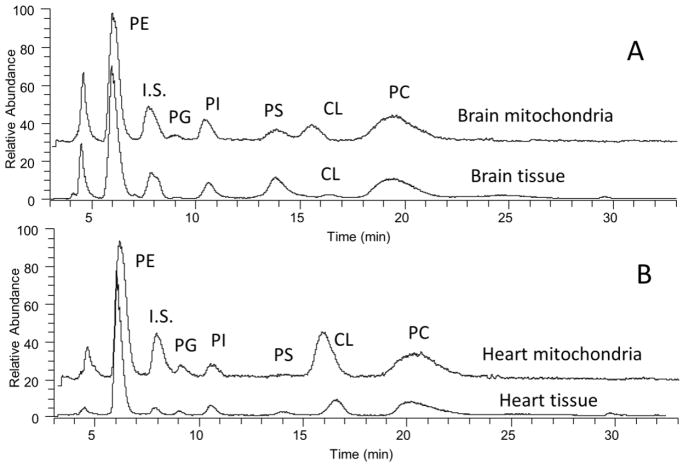
Normal phase HPLC was used to differentiate major and minor PPL classes in mitochondrial and whole tissues. Total ion chromatogram of individual classes of PPL in the brain and heart are shown as an example (Fig. 1A and 1B). The brain contains the least amount of mitochondria and the heart contains the greatest amount of mitochondria of the four tissues. Notably, the peak corresponding to CL is barely detectable in the total ion chromatogram from whole brain tissue, denoting the relative scarcity of mitochondria in whole brain tissue extract. The retention time of each class of PPL is comparable to our previous reports. The determined concentrations of individual classes of PPLs extracted from whole tissues and mitochondria are shown in Table 1. The results from the brain and heart tissues are similar to those previously reported [27]. In general, PPL contents are higher in the brain per mg tissue or per mg mitochondria protein.
Fig. 1.
Total ion chromatograms of phospholipids in the brain and heart.
Table 1.
Concentration of phospholipids in whole tissue (nmol/mg wet wt.) and isolated mitochondria (nmol/mg protein).
| PE | PG | PI | PS | CL | PC | |
|---|---|---|---|---|---|---|
| Brain | ||||||
| Whole tissue | 52.6(±6.7) | 0.02(±4.7^−3) | 4.3(±0.3) | 6.5(±0.6) | 0.2(±0.08) | 25.9(±1.9) |
| Mitochondria | 415.8(±84.7) | 1.5(±0.2) | 44.0(±5.3) | 27.2(±7.3) | 29.4(±3.1) | 282.3(±36.3) |
| Heart | ||||||
| Whole tissue | 24.4(±4.9) | 0.2(±0.1) | 4.1(±1.5) | 0.6(±0.2) | 4.0(±1.2) | 21.0(±5.4) |
| Mitochondria | 230.6(±12.3) | 3.2(±0.3) | 26.9(±1.9) | 1.2(±0.3) | 56.9(±2.8) | 183.6(±13.0) |
| Kidney | ||||||
| Whole tissue | 21.5(±2.4) | 0.02 (±0.003) | 5.8(±3.0) | 1.2(±0.5) | 0.9(±0.08) | 20.5(±10.4) |
| Mitochondria | 251.2(±31.0) | 0.6(±0.07) | 40.2(±5.7) | 5.8(±0.5) | 24.0(±2.2) | 175.5(±21.5) |
| Liver | ||||||
| Whole tissue | 25.7(±2.5) | 0.03(±0.009) | 7.3(±1.5) | 0.7(±0.1) | 0.9(±0.4) | 28.9(±5.3) |
| Mitochondria | 244.6(±28.1) | 0.4(±0.1) | 52.3(±7.1) | 2.0(±0.3) | 25.4(±2.9) | 203.4(±28.6) |
3.2. The use of cardiolipin as a comparator to discriminate mitochondrial origin
CL is exclusively found in mitochondrial membranes, as such any CL found in whole tissue PPL analysis must originate from the tissue’s mitochondria. However, the origin of other PPLs is less clear. To delineate mitochondrial versus extra-mitochondrial contribution to whole tissue PPL profiles, the mole ratio of PPL/CL was compared within each tissue’s whole tissue and isolated mitochondrial samples. The ratio of PPL/CL in isolated mitochondria was then used to extrapolate the mitochondrial contribution to whole tissue PPLs based on whole tissue CL content. Restated, the concentration of cardiolipin in the whole tissue was used to ascertain the portion of whole tissue PE, PC, PI, PG, and PS which originated from a mitochondrial source. This calculation was based on the determined concentrations of individual classes of PPL shown in Table 1.
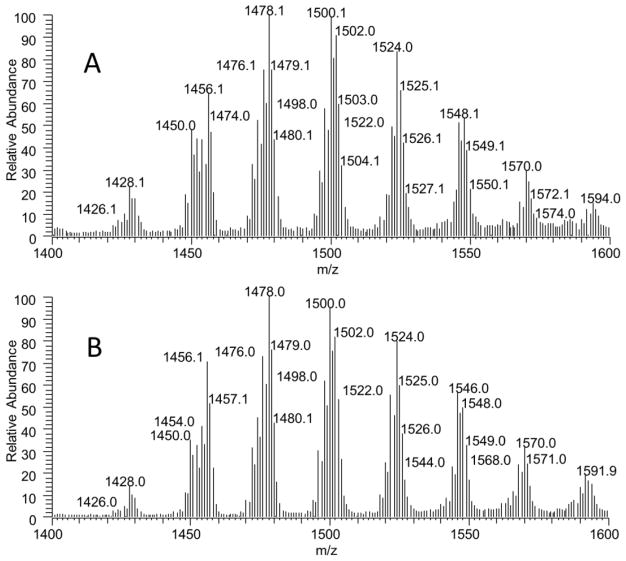
First, we tested if there were any changes in the content of CL composition during mitochondrial isolation procedure. Since tissue samples are frozen after harvest, mitochondria were kept on ice during the isolation procedure for approximately 1h. To assess the potential for PPL degradation during isolation, we measured the content of monolysocardiolipin (MLCL) and compared MLCL to CL in the whole tissues. This ratio represents the hydrolysis of CL during the isolation. The amount of MLCL was quantifiable only in the heart tissue. We found the ratio of MLCL/CL to be 0.005 in fresh-frozen heart tissue and 0.007 in isolated heart mitochondria. As such, while the hydrolysis of CL into MLCL was present during isolation, it does not significantly alter the content of CL. We also measured CL content in the supernatant during mitochondria isolation, which represents the loss of CL during mitochondria isolation. The amount of CL calculated in the whole supernatant is less than 0.002% of CL measured in the whole tissue, confirming there is no selective loss of CL during mitochondria isolation. In addition, we compared CL composition between whole tissue and isolated mitochondria. As an example, the mass spectra of CL in whole brain tissue and brain mitochondria are shown in Fig. 2 to demonstrate no changes in the PPL peak composition. The composition of brain CL is the most diverse, and thus represents a sensitive marker to test any changes in CL composition during isolation. No change in CL composition between whole tissue and isolated mitochondria was also observed in the heart, kidney, and liver. Collectively, we found minimal changes in CL during mitochondrial isolation. CL, the only unique mitochondrial PPL, serves as a valid comparator to establish the origin of PPL between mitochondria and whole tissue.
Fig. 2.
CL profiles in whole brain (A) and isolated mitochondria (B).
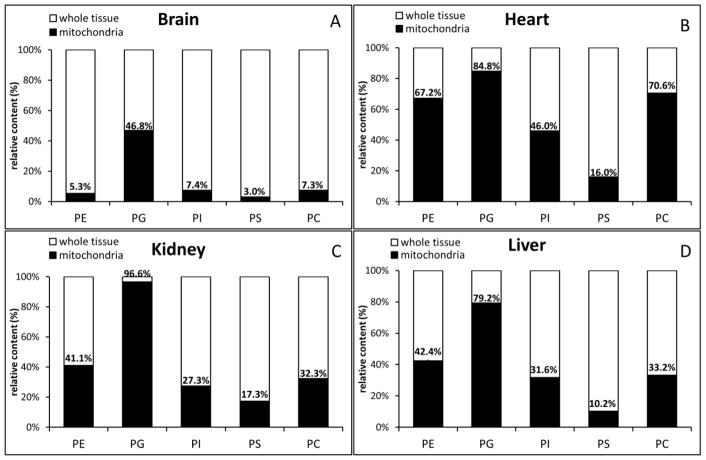
As expected, mitochondria in the brain contributed a minority of most PPL classes including PE (5.3%), PI (7.4%), PS (3.0%), and PC (7.3%). However; mitochondria contributed close to half of the brain tissue’s PG (46.8%) (Fig. 3A). By contrast, in heart tissue, mitochondria contributed the majority of PE (67.2%), PG (84.8%), and PC (70.6%) (Fig. 3B). Heart mitochondria still contributed nearly half of the tissue’s PI (46.0%), while contributing a minority of PS (16.0%). Kidney and Liver tissues held similar PPL profiles, with mitochondria contributing the clear majority of PG (90.5% Kidney, 79.2% Liver), and a significant portion of PE (39.1% Kidney, 42.4% Liver), PI (26.1% Kidney and 31.6% Liver), and PC (30.4% Kidney and 33.2% Liver). Kidney and Liver mitochondria contributed a minority of PS (17.3% Kidney, 10.2% liver) (Fig. 3C and E). In general, PS is found mostly in external mitochondrial membrane whereas PG in mitochndrial membrane.
Fig. 3.
Relative contents of mitochondrial and whole tissue phospholipids in the brain, heart, kidney, and liver. The relative contents were calculated by comparing the mole ratio of PPL/CL within each tissue’s whole tissue and isolated mitochondrial samples.
3.3. Brain
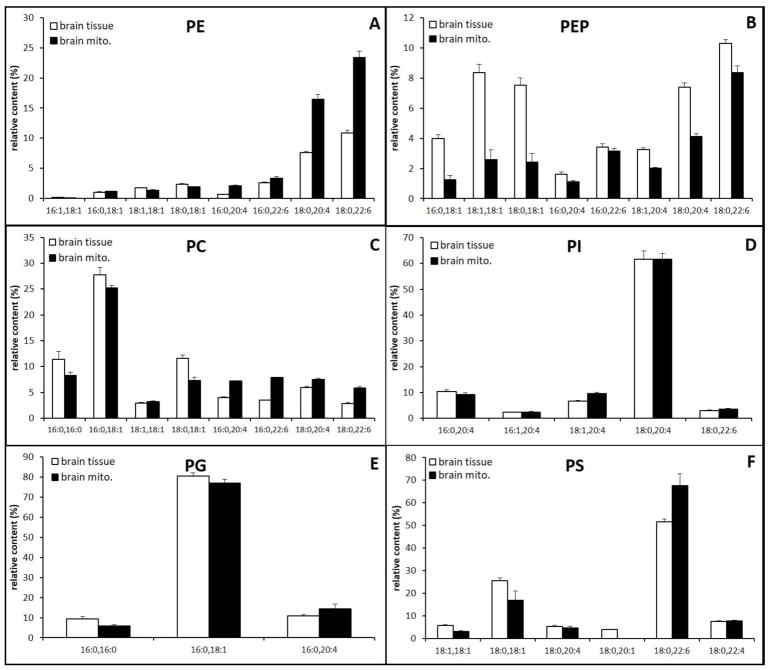
Relative content of major and minor PPL classes in brain mitochondria and tissue extracts are shown in Fig. 4. The MS spectra of PE and PC are shown in Fig. 5 and the MS spectra of PS, PG, and PI are shown in supplementary data. As expected, a majority of diacyl PE species in whole tissue and mitochondria extracts contain polyunsaturated fatty acids, arachidonic acid (AA), PE (18:0/20:4), and docosahexaenoic acid (DHA) PE(18:0/22:6). Species containing 18:1, PE(16:0/18:1), PE(18:1/18:1), and PE(18:0/18:1), are also abundant as reported previously [27]. The major PEP species are also made of these fatty acids. Overall the relative content of diacyl PE and PEP species containing PUFA is 65% in the whole tissue and 86% in mitochondria, demonstrating that mitochondria PE, a major contributor to total mitochondrial membrane, is more enriched with PUFA than whole tissue (Fig. 4A and 4B). There was no major difference in the relative content of AA and DHA between mitochondria and whole tissue, showing no preference in selecting a specific PUFA in mitochondrial PE and PEP.
Fig. 4.
Relative content of major phospholipid species in brain whole tissue and mitochondria extracts.
Fig. 5.
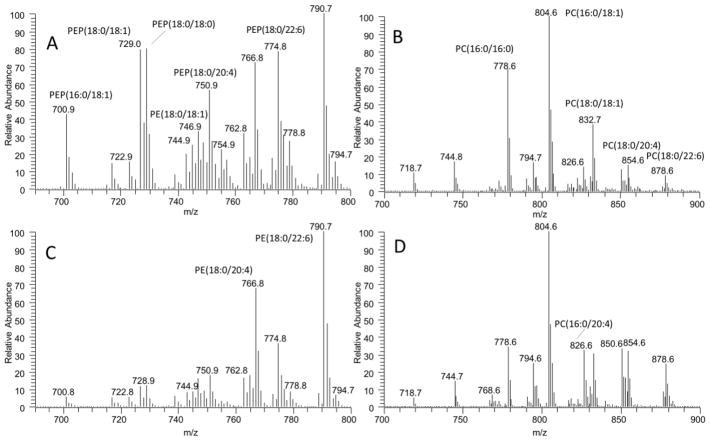
Representative mass spectra of PE (A) and PC (B) in brain tissue and PE (C) and PC (D) in brain mitochondria. The peaks at m/z 700.9, 729.0, and 746.9 corresponding to PEP(16:0/18:1), PEP(18:0/18:1), and PE(18:0/18:1) are higher in brain tissue than mitochondria (A and C). Similarly, the peaks at m/z 778.6 and 832.7 corresponding to PC(16:0/16:0) and PC(18:0/18:1) are higher in brain tissue than mitochondria (C and D).
The molecular composition of PC species in brain whole tissue and mitochondria were comparable, with both demonstrating PC(16:0/18:1) as a major species (Fig. 4C and Fig. 5). As shown in PE, the relative content of PC species containing PUFA are higher in mitochondria. Mitochondria established a higher PUFA PC content through increased AA and DHA as the contents of PC(16:0/20:4), PC(16:0/22:6), PC(18:0/20:4), and PC(18:0/22:6) were higher in mitochonria (Fig, 4C). Of the major PC species, the content of PC species containing PUFAs is 27% in whole tissue and 44% in isolated mitochondria. PS also has more PUFA in isolated mitochondria; the content of PUFA-containing PS increased from 65% in whole tissue to 78% in mitochondria.
Unlike PC and PE, PS containing only DHA, PS(18:0/22:6), which was increased at the expense of PS(18:1/18:1), PS(18:0/18:1), and PS(18:0/20:1) (Fig, 4 F). Relative contents of PG and PI in brain whole tissue and mitochondria were comparable, with both demonstrating PI(18:0/20:4) and PG(16:0/18:1) as a major species, respectively (Fig. 4D and 4E). Interestingly, the relative content of PC and PS species containing PUFA are higher in mitochondria than whole tissue (Fig. 4C and F). A similar trend was found in PG. These data show that mitochondrial PPL contain more PUFAs than whole tissue.
3.4. Heart
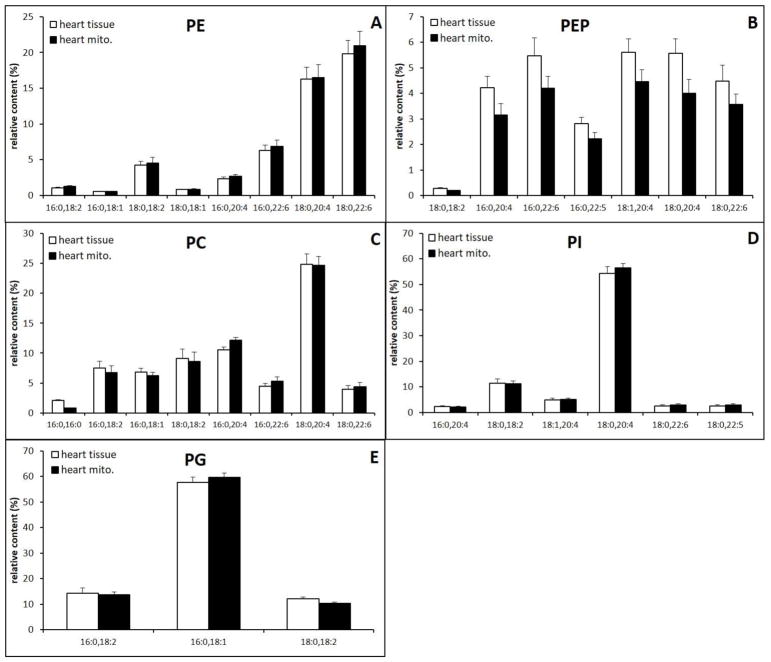
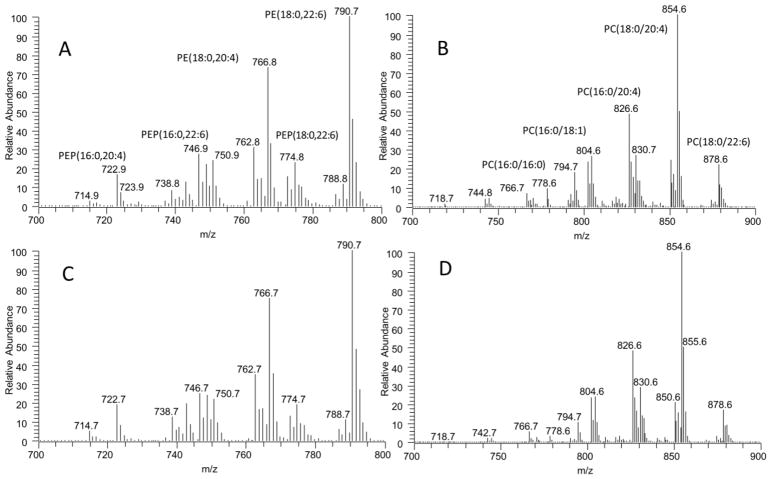
Relative content of major and minor PPL classes in heart mitochondria and tissue extracts are shown (Fig. 6 A–E). Consistent with the high content of mitochondria in the heart, the compositions of PPLs are similar between mitochondria and whole tissue. As a comparison to the brain, we show the MS spectra of PE and PC in Fig. 7 and the MS spectra of the remaining PPLs are shown in supplementary data. The major difference observed is the slightly higher concentration of PEP in whole tissue. Mitochondrial and whole tissue extracts held similar diacyl PE profiles with the majority of contributing PE species composed of AA and DHA, (PE(18:0/20:4), PE(18:0/22:6)) (Fig. 6A). The major PEP species also contain these fatty acids, PEP(16:0/20:4), PEP(16:0/22:6), PEP(16:0/22:5), PEP(18:1/20:4), (PEP(18:0/20:4), PEP(18:0/22:6) (Fig. 6B).
Fig. 6.
Relative content of major phospholipid species in heart whole tissue and mitochondria extracts.
Fig. 7.
Representative mass spectra of PE (A) and PC (B) in heart tissue and PE (C) and PC (D) in mitochondria. The molecular profiles of PE and PC are similar between whole heart tissue and mitochondria, however the peak at m/z 778.6 corresponding to PC(16:0/16:0) is decreased in mitochondria.
The major PC species for both mitochondrial and whole tissue PC was polyunsaturated and primarily composed of AA, PC(18:0/20:4) (Fig. 6C and 7). Not as clear as in the brain, there is an decrease in PC(16:0/16:0) with concomitant increase in PC(16:0/20:4) and PC(16:0/22:6). PI and PG were similar in whole tissue and mitochondria, and were both predominately composed of a single species, PI(18:0/20:4) and PG(16:0/18:1), respectively (Fig. 6E and Fig. 6G). Quantitation of individual PS species in mitochondria is not achievable due to the minor species of PS is under quantitation limit. However, the composition of PS seems to be similar between mitochondria and whole tissue (Supplementary data).
3.5. Kidney
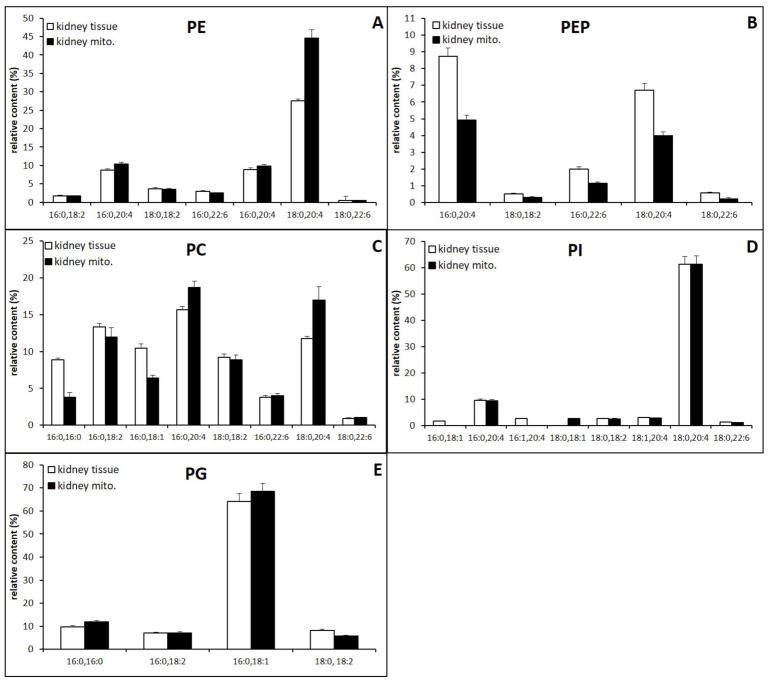
Relative content of major and minor PPL classes in kidney mitochondria and tissue extracts are shown (Fig. 8A–E). The MS spectra are shown in supplementary data. All major species of diacyl PE in Mitochondrial and whole tissue extracts contain PUFA with AA as a major species, including a variety of forms such as PE(16:0/20:4), PE(18:1/20:4), PE(18:0/20:4) (Fig. 8A). Whole tissue contains less PE(18:0/20:4), due to the higher PEP content. Interestingly, the lower quantity of PE AA in whole kidney tissue compared to mitochondria is compensated by PEP species containing AA, PEP(16:0/20:4), PEP(18:0/20:4) (Fig. 8B). The overall AA content in PE is not different between tissue and mitochondria.
Fig. 8.
Relative content of major phospholipid species in kidney whole tissue and mitochondria extracts.
As was found in the brain, kidney mitochondria were composed of PC with relatively more polyunsaturated fatty acids; the relative content of PC(16:0/20:4) and PC(18:0/20:4) increased from 27% in whole tissue to 36% in mitochondria. This increase is at the expense of the saturated species PC(16:0/16:0) and PC(16:0/18:1). However, the relative content of PC species containing DHA or linoleic acid does not change significantly (Fig. 8C). PI and PG were similar between whole tissue and mitochondria, and were both predominately composed of a single dominant species, PI(18:0/20:4) and PG(16:0/18:1) respectively (Fig. 8E and Fig. 8G). The comparison of PS is not achievable due to the low concentration of PS in kidney mitochondria; however, the composition of PS appears to be similar between mitochondria and whole tissue (Supplementary data).
3.6. Liver
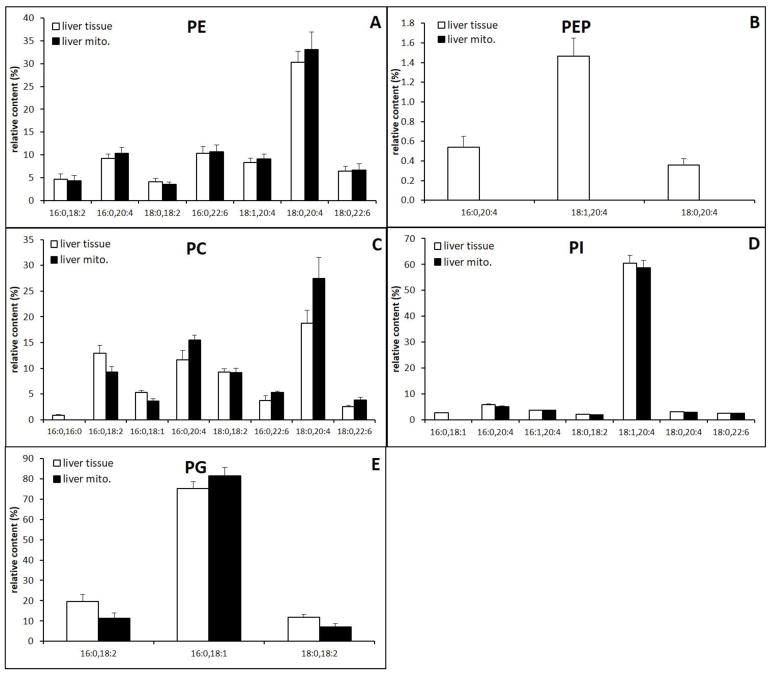
Relative content of major and minor PPL classes in liver mitochondria and tissue extracts are shown (Fig. 9A–E). The MS spectra are shown in supplementary data. All major species of PE in mitochondrial and whole tissue extracts contain PUFA, with a single major species, (PE(18:0/20:4), comprising the majority of diacyl PE with additional minor species composed of linoleic acid, AA and DHA (PE(16:0/18:2), PE(16:0/20:4), PE(16:0/22:6), PE(18:1/20:4), PE(18:0/22:6)) (Fig. 9A). As shown in the kidney, the PEP species containing AA in whole tissue makes the overall AA content of PE similar between tissue and mitochondria in the liver (Fig. 9B).
Fig. 9.
Relative content of major phospholipid species in liver whole tissue and mitochondria extracts.
Mitochondria and whole tissue extracts held a variety of PC species containing both PUFA and non-PUFA. As was seen in other tissues, PC species containing AA and DHA, PC(16:0/20:4), PC(18:0/20:4), PC(16:0/22:6), and PC(18:0/22:6), are lower in whole tissue (37%) than mitochondria (51%). This increase in mitochondrial PUFA content was accompanied with a decrease in the content of PC(16:0/16:0) and PC(18:0/18:1) (Fig. 9C). Again, PI was predominately composed of a single AA species PI(18:0/20:4) (Fig. 9D) and PG was predominately composed of a single non-PUFA species PG(16:0/18:1) (Fig. 9E). There was no significant difference in the composition of PI and PG between whole tissue and mitochondrial extracts. The comparison of PS is not achievable due to the low concentration of PS in liver mitochondria, however, we did not observe significant compositional differences in MS data (Supplementary data).
4. Discussion
Our results demonstrate that the careful use of normal phase LCMS is of great advantage in distinguishing the mitochondrial and extra-mitochondrial contributions to whole tissue PPL content by assuring class separation of PPL species. PPLs are one of the most challenging metabolites for mass spectrometry analysis as they are interrelated and changes in one species or class can causes changes in others. Therefore, PPLs, with different chemical and physical properties as well as different mass responses, should be analyzed together. This challenge becomes more complicated by the existence of numerous isomeric and isobaric species. There is no single method that is capable of complete quantitative and qualitative analysis of PPLs. In this study, we take advantage of class separation using normal-phase for quantitation of PPLs. Easy peaks selection and reduced quantity of false positives significantly enhance the accuracy of quantitation. Moreover, we previously show that there is minimal inference on mass response from different acyl chain or ion suppression with the conditions used for this analysis. This should significantly reduce potential variables when comparing the contents of PPLs comprised of different species from different biological origin.
Class separation is particularly useful for quantitation of brain CL, which carries a highly diverse PPL profile without a single dominant species as shown in Fig. 2. Furthermore, most MS peaks are comprised of multiple isomeric species; therefore, the total number of species is much more than the number of peaks shown in the MS spectra as reported previously [26]. Without class separation, identification of the numerous non-abundant peaks corresponding to brain CL species may be highly challenging. Furthermore, ion suppression of each peak may be more prominent in tissue where the relative content of CL is much lower than mitochondria. These limitations will significantly interfere with quantitation of CL, which can serve as a comparator to delineate PPL origin.
Using the fact that CL is exclusively found in mitochondria, we compared CL concentration in tissue whole tissue and isolated mitochondria to establish a comparator and ascertain the relative contribution of mitochondria to whole tissue PPL content. We did not find any evidence that the content or composition of CL was changed during mitochondria isolation, which otherwise could negatively impact the use of CL as a comparator. As such, normalizing PPL to CL in mitochondria and whole tissue allows for the assessment of mitochondrial contribution to PPL from whole tissue.
Using CL as a comparator, we clearly show that mitochondria contribute the greatest portion of PPL content in heart tissue (Fig. 3). In contrast, whole brain tissue PPL content received the least contribution from its mitochondria. This difference is expected as heart and brain tissues respectively contain the greatest and least concentration of mitochondria of the four tissues analyzed. As such, while the large quantity of heart mitochondria overwhelm the unique membrane PPL profile in heart tissue samples, the low concentration of mitochondria in brain tissue allows the distinction between whole tissue and mitochondrial PPL content to be easily observed. The quantity of mitochondria in the kidney and liver is in between that of the brain and the heart.
Interestingly, we found the relative content of PUFA is higher in mitochondria than whole tissues in the brain, kidney, and liver and likely in the heart. Furthermore, this phenomenon is most prominent in PC, one of the largest contributors to the mitochondrial membrane which is exclusively synthesized in the endoplasmic reticulum and transported into mitochondria. This finding suggests that for optimal cellular function, mitochondrial membranes require higher concentrations of PUFAs than non-mitochondrial membranes. There are two potential mechanisms to increase unsaturation in mitochondrial PC. Mitochondria may preferentially select PUFA containing PC to incorporate into their membranes, alternatively the increase in PUFAs may be accomplished within the mitochondria through a remodeling process called the Lands cycle. Either way, mitochondria are actively involved in the process of changing its PC composition, suggesting that the original extra-mitochondrial composition of lower PUFA content PC may not be optimal for mitochondrial function.
To increase the content of PUFAs, mitochondria uses PPLs with a diverse species composition containing both PUFAs and non-PUFAs. While PG, PI, and PS have one common dominant species regardless the tissue type, PC is comprised of a variety of species containing both PUFA and non-PUFAs. The ratio of species containing PUFA and non-PUFA varies depending on tissue types. This diversity may provide room for PC to change its composition based on the cell type the mitochondria inhabits. The same argument may apply to brain PE and PS. While PE in the heart, kidney and liver is mostly comprised of PUFAs, brain whole tissue PE is uniquely comprised of significant amount of PE and PEP species containing non-PUFAs, and the content of the species containing non-PUFAs are significantly reduced in mitochondria.
It is clear that mitochondria require higher PUFA content than whole tissue. However, each tissue has a slightly different means to achieve this. Brain mitochondria appear to use PE, PC, and PS to increase both DHA and AA. It is interesting that while the brain tissue maintains significantly lower PPL content of PUFAs than other tissues, their compositions are also altered for the use of brain mitochondria. For PC and PE, no selective increase of DHA and AA were observed, while PS selectively increase DHA. Kidney mitochondria only use PC to increase its PUFA content and only increases AA. Liver mitochondria also only uses PC to increase mitochondrial PUFA content but increases both DHA and AA. No tissue analyzed used another major PUFA, linoleic acid, to increase their unsaturation index. PC/lyso-PC system plays a major role for the delivery of PUFAs to the brain [28, 29]. Our results add another noble role of PC, which is to maintain PUFA contents in mitochondria.
It is not clear why mitochondria maintain higher content of PUFAs. Previous studies comparing phospholipid profiles in fish showed that mitochondrial membranes contain more PUFA than whole tissue membranes in the muscle [15], whereas later analysis found the opposite in kidney samples [16]. Using a rodent model, Tsalouhidou et al reported that mitochondrial membranes contain less PUFAs than whole tissue membranes [17.] This was theorized by the authors to be a mechanism to protect against ROS generation. Since the bisallylic positions of PUFAs are highly prone to peroxidation by ROS and mitochondria are the major site of ROS generation, it may be reasonable for mitochondria to keep the level of PUFAs low. Indeed, it has been frequently theorized that a lower mitochondrial PUFA content may be preferred to limit peroxyl radial propagation which could result in mitochondrial membrane and protein degradation [30–32]. However, our study, using an established HPLC-MS approach, clearly shows that in multiple tissue types, mitochondria hold a greater relative quantity of polyunsaturated fatty acids, opposing the proposed hypothesis. Rather, our finding suggests that mitochondria require higher PUFA content. These results suggest that oxidative modification is not the only consideration when determining mitochondria membrane composition. Other factors, such as membrane fluidity or the role of their metabolites [33], may need to be balanced with the increased risk of oxidative stress due to the increased content of PUFAs.
We also found that mitochondria contribute the majority of whole tissue PG in all four tissue types studied. Since PG is the precursor to CL [34], an essential PPL for maintaining proper mitochondrial function, it may be necessary to have a large store of PG ready for the synthesis of CL. While PG was most commonly found in mitochondrial isolates, the mitochondrial portion of PS was the lowest of the classes of PPL. In addition, PEP consistently contributed to a greater percentage of PE content in whole tissue versus mitochondria. While the composition of PE, PC, and PS varies depending on tissues and mitochondria, the profiles of PI and PG are highly conserved, with dominant species, PI(18:0/20:4) and PG(16:0/18:1), respectively.
This study carries several limitations which must be considered when evaluating the results. Firstly, brain tissue was not separated by its composing regions. The brain is a heterogeneous organ with markedly different mitochondrial concentrations based on the cell type and region of the brain. Further differences in mitochondria and whole tissue PPL profile may emerge if variables such as cell type and brain region are controlled for. Secondly, we did not isolate sub-cellular organelles. As such, this analysis utilizes a simple approach to compare mitochondria vs whole tissue PPL profiles. Although whole tissue PPL contain significant amounts of mitochondrial PPL, this comparison clearly shows that mitochondria hold higher content of PUFAs and that PC is an important mediator to increase the content of PUFAs in mitochondria.
5. Conclusion
We report the novel use of normal phase LCMS to establish a PPL profile, differentiating mitochondrial and whole tissue PPL content in the brain, heart, kidney and liver. Our results demonstrate that mitochondria in these tissue types hold a greater PUFA content than whole tissue PPLs and that this difference is predominately achieved by increased PUFA content of PC. Furthermore, we report the novel use of LCMS quantitation of cardiolipin to establish PPL origin in whole tissue and mitochondria. These approaches, which distinguish the relative abundance of major and minor PPL classes as well as their origin in mitochondrial and whole tissue, show promise as a novel means to track changes to the PPL profile of mitochondria during cellular dysfunction.
Supplementary Material
Highlights.
Normal-phase LCMS is used to compare PPLs between whole tissue and mitochondria.
Cardiolipin is used as a comparator to delineate PPLs with mitochondrial origin.
Brain, liver, and kidney mitochondria carry greater PUFA content than whole tissue.
Greater PUFA content in mitochondria is driven by phosphatidylcholine unsaturation.
Acknowledgments
Funding: This work was supported by the National Institutes of Health [grant number, HL067630].
Abbreviation
- PPL
phospholipid
- PUFA
polyunsaturated fatty acid
- CL, MUFA
monounsaturated fatty acid; cardiolipin
- MLCL
monolysocardiolipin
- PG
phosphatidylglycerol
- PC
phosphatidylcholine
- PE
phosphatidylethanolamine
- PI
phosphatidylinositol
- PS
phosphatidylserine
- PEP
plasmenyl phosphatidylethanolamine
Footnotes
Declarations of interest: none.
Publisher's Disclaimer: This is a PDF file of an unedited manuscript that has been accepted for publication. As a service to our customers we are providing this early version of the manuscript. The manuscript will undergo copyediting, typesetting, and review of the resulting proof before it is published in its final citable form. Please note that during the production process errors may be discovered which could affect the content, and all legal disclaimers that apply to the journal pertain.
References
- 1.McIntosh TJ, Simon SA. Roles of bilayer material properties in function and distribution of membrane proteins. Annu Rev Biophys Biomol Struct. 2006;35:177–198. doi: 10.1146/annurev.biophys.35.040405.102022. [DOI] [PubMed] [Google Scholar]
- 2.Hulbert AJ, Turner N, Storlien LH, Else PL. Dietary fats and membrane function: implications for metabolism and disease. Biol Rev Camb Philos Soc. 2005;80:155–169. doi: 10.1017/s1464793104006578. [DOI] [PubMed] [Google Scholar]
- 3.Balla T. Phosphoinositides: tiny lipids with giant impact on cell regulation. Physiol Rev. 2013;93:1019–1137. doi: 10.1152/physrev.00028.2012. [DOI] [PMC free article] [PubMed] [Google Scholar]
- 4.Sparagna GC, Chicco AJ, Murphy RC, Bristow MR, Johnson CA, Rees ML, Maxey ML, McCune SA, Moore RL. Loss of cardiac tetralinoleoyl cardiolipin in human and experimental heart failure. J Lipid Res. 2007;48:1559–1570. doi: 10.1194/jlr.M600551-JLR200. [DOI] [PubMed] [Google Scholar]
- 5.Han X, Yang J, Cheng H, Yang K, Abendschein DR, Gross RW. Shotgun lipidomics identifies cardiolipin depletion in diabetic myocardium linking altered substrate utilization with mitochondrial dysfunction. Biochemistry. 2005;44:16684–16694. doi: 10.1021/bi051908a. [DOI] [PubMed] [Google Scholar]
- 6.Simoes C, Domingues P, Ferreira R, Amado F, Duarte JA, Vitorino R, Neuparth MJ, Nunes C, Rocha C, Duarte I, Domingues MR. Remodeling of liver phospholipidomic profile in streptozotocin-induced diabetic rats. Arch Biochem Biophys. 2013;538:95–102. doi: 10.1016/j.abb.2013.07.029. [DOI] [PubMed] [Google Scholar]
- 7.Schlame M, Ren M. Barth syndrome, a human disorder of cardiolipin metabolism. FEBS Lett. 2006;580:5450–5455. doi: 10.1016/j.febslet.2006.07.022. [DOI] [PubMed] [Google Scholar]
- 8.Tyurina YY, Winnica DE, Kapralova VI, Kapralov AA, Tyurin VA, Kagan VE. LC/MS characterization of rotenone induced cardiolipin oxidation in human lymphocytes: implications for mitochondrial dysfunction associated with Parkinson’s disease. Mol Nutr Food Res. 2013;57:1410–1422. doi: 10.1002/mnfr.201200801. [DOI] [PMC free article] [PubMed] [Google Scholar]
- 9.Gillies D, Sinn J, Lad SS, Leach MJ, Ross MJ. Polyunsaturated fatty acids (PUFA) for attention deficit hyperactivity disorder (ADHD) in children and adolescents. Cochrane Database Syst Rev. :CD007986. doi: 10.1002/14651858.CD007986.pub2(2012). [DOI] [PMC free article] [PubMed] [Google Scholar]
- 10.Cunnane SC, Schneider JA, Tangney C, Tremblay-Mercier J, Fortier M, Bennett DA, Morris MC. Plasma and brain fatty acid profiles in mild cognitive impairment and Alzheimer’s disease. J Alzheimers Dis. 2012;29:691–697. doi: 10.3233/JAD-2012-110629. [DOI] [PMC free article] [PubMed] [Google Scholar]
- 11.Abbott SK, Else PL, Atkins TA, Hulbert AJ. Fatty acid composition of membrane bilayers: importance of diet polyunsaturated fat balance. Biochim Biophys Acta. 2012;1818:1309–1317. doi: 10.1016/j.bbamem.2012.01.011. [DOI] [PubMed] [Google Scholar]
- 12.Horvath SE, Daum G. Lipids of mitochondria. Prog Lipid Res. 2013;52:590–614. doi: 10.1016/j.plipres.2013.07.002. [DOI] [PubMed] [Google Scholar]
- 13.Colbeau A, Nachbaur J, Vignais PM. Enzymic characterization and lipid composition of rat liver subcellular membranes. Biochim Biophys Acta. 1971;249:462–492. doi: 10.1016/0005-2736(71)90123-4. [DOI] [PubMed] [Google Scholar]
- 14.Pamplona R. Membrane phospholipids, lipoxidative damage and molecular integrity: a causal role in aging and longevity. Biochim Biophys Acta. 2008;1777:1249–1262. doi: 10.1016/j.bbabio.2008.07.003. [DOI] [PubMed] [Google Scholar]
- 15.ØSTBYE TK, KJÆR MA, RØRÅ AMB, TORSTENSEN B, RUYTER B. High n-3 HUFA levels in the diet of Atlantic salmon affect muscle and mitochondrial membrane lipids and their susceptibility to oxidative stress. Aquaculture Nutrition. 2011;17:177–190. [Google Scholar]
- 16.Almaida-Pagan PF, de Costa J, Mendiola P, Tocher DR. Changes in tissue and mitochondrial membrane composition during rapid growth, maturation and aging in rainbow trout, Oncorhynchus mykiss. Comp Biochem Physiol B Biochem Mol Biol. 2012;161:404–412. doi: 10.1016/j.cbpb.2012.01.006. [DOI] [PubMed] [Google Scholar]
- 17.Tsalouhidou S, Argyrou C, Theofilidis G, Karaoglanidis D, Orfanidou E, Nikolaidis MG, Petridou A, Mougios V. Mitochondrial phospholipids of rat skeletal muscle are less polyunsaturated than whole tissue phospholipids: Implications for protection against oxidative stress1. J Anim Sci. 2006;84:2818–2825. doi: 10.2527/jas.2006-031. [DOI] [PubMed] [Google Scholar]
- 18.Stefanyk LE, Coverdale N, Roy BD, Peters SJ, LeBlanc PJ. Skeletal muscle type comparison of subsarcolemmal mitochondrial membrane phospholipid fatty acid composition in rat. J Membr Biol. 2010;234:207–215. doi: 10.1007/s00232-010-9247-4. [DOI] [PubMed] [Google Scholar]
- 19.Cajka T, Fiehn O. Comprehensive analysis of lipids in biological systems by liquid chromatography-mass spectrometry. Trends Analyt Chem. 2014;61:192–206. doi: 10.1016/j.trac.2014.04.017. [DOI] [PMC free article] [PubMed] [Google Scholar]
- 20.Gross RW, Han X. Lipidomics at the interface of structure and function in systems biology. Chem Biol. 2011;18:284–291. doi: 10.1016/j.chembiol.2011.01.014. [DOI] [PMC free article] [PubMed] [Google Scholar]
- 21.Xu L, Wang X, Jiao Y, Liu X. Assessment of potential false positives via orbitrap-based untargeted lipidomics from rat tissues. Talanta. 2018;178:287–293. doi: 10.1016/j.talanta.2017.09.046. [DOI] [PubMed] [Google Scholar]
- 22.Sommer U, Herscovitz H, Welty FK, Costello CE. LC-MS-based method for the qualitative and quantitative analysis of complex lipid mixtures. J Lipid Res. 2006;47:804–814. doi: 10.1194/jlr.M500506-JLR200. [DOI] [PubMed] [Google Scholar]
- 23.Kim J, Villarroel JP, Zhang W, Yin T, Shinozaki K, Hong A, Lampe JW, Becker LB. The Responses of Tissues from the Brain, Heart, Kidney, and Liver to Resuscitation following Prolonged Cardiac Arrest by Examining Mitochondrial Respiration in Rats Oxid. Med Cell Longev. 2016;2016:7463407. doi: 10.1155/2016/7463407. [DOI] [PMC free article] [PubMed] [Google Scholar]
- 24.Christiansen K. Lipid extraction procedure for in vitro studies of glyceride synthesis with labeled fatty acids. Anal Biochem. 1975;66:93–99. doi: 10.1016/0003-2697(75)90728-9. [DOI] [PubMed] [Google Scholar]
- 25.Kim J, Hoppel CL. Comprehensive approach to the quantitative analysis of mitochondrial phospholipids by HPLC-MS J Chromatogr B Analyt Technol. Biomed Life Sci. 2013;912:105–114. doi: 10.1016/j.jchromb.2012.10.036. [DOI] [PMC free article] [PubMed] [Google Scholar]
- 26.Kim J, Lampe JW, Yin T, Shinozaki K, Becker LB. Phospholipid alterations in the brain and heart in a rat model of asphyxia-induced cardiac arrest and cardiopulmonary bypass resuscitation. Mol Cell Biochem. 2015;408:273–281. doi: 10.1007/s11010-015-2505-0. [DOI] [PMC free article] [PubMed] [Google Scholar]
- 27.Choi J, Yin T, Shinozaki K, Lampe JW, Stevens JF, Becker LB, Kim J. Comprehensive analysis of phospholipids in the brain, heart, kidney, and liver: brain phospholipids are least enriched with polyunsaturated fatty acids. Mol Cell Biochem. 2017 doi: 10.1007/s11010-017-3203-x. [DOI] [PMC free article] [PubMed] [Google Scholar]
- 28.Sugasini D, Thomas R, Yalagala PCR, Tai LM, Subbaiah PV. Dietary docosahexaenoic acid (DHA) as lysophosphatidylcholine, but not as free acid, enriches brain DHA and improves memory in adult mice. Sci Rep. 2017;7:11263. doi: 10.1038/s41598-017-11766-0. [DOI] [PMC free article] [PubMed] [Google Scholar]
- 29.Kitson AP, Metherel AH, Chen CT, Domenichiello AF, Trepanier MO, Berger A, Bazinet RP. Effect of dietary docosahexaenoic acid (DHA) in phospholipids or triglycerides on brain DHA uptake and accretion. J Nutr Biochem. 2016;33:91–102. doi: 10.1016/j.jnutbio.2016.02.009. [DOI] [PubMed] [Google Scholar]
- 30.Pamplona R, Prat J, Cadenas S, Rojas C, Perez-Campo R, Lopez Torres M, Barja G. Low fatty acid unsaturation protects against lipid peroxidation in liver mitochondria from long-lived species: the pigeon and human case. Mech Ageing Dev. 1996;86:53–66. doi: 10.1016/0047-6374(95)01673-2. [DOI] [PubMed] [Google Scholar]
- 31.Pamplona R, Portero-Otin M, Ruiz C, Gredilla R, Herrero A, Barja G. Double bond content of phospholipids and lipid peroxidation negatively correlate with maximum longevity in the heart of mammals. Mech Ageing Dev. 2000;112:169–183. doi: 10.1016/s0047-6374(99)00045-7. [DOI] [PubMed] [Google Scholar]
- 32.Winczura A, Zdzalik D, Tudek B. Damage of DNA and proteins by major lipid peroxidation products in genome stability. Free Radic Res. 2012;46:442–459. doi: 10.3109/10715762.2012.658516. [DOI] [PubMed] [Google Scholar]
- 33.Yang X, Sheng W, Sun GY, Lee JC. Effects of fatty acid unsaturation numbers on membrane fluidity and alpha-secretase-dependent amyloid precursor protein processing. Neurochem Int. 2011;58:321–329. doi: 10.1016/j.neuint.2010.12.004. [DOI] [PMC free article] [PubMed] [Google Scholar]
- 34.Hatch GM. Regulation of cardiolipin biosynthesis in the heart. Mol Cell Biochem. 1996;159:139–148. doi: 10.1007/BF00420916. [DOI] [PubMed] [Google Scholar]
Associated Data
This section collects any data citations, data availability statements, or supplementary materials included in this article.


