

Abstract
We report detailed peptide‐binding affinities between 438 HLA Class I and Class II proteins and complete proteomes of seven pandemic human viruses, including coronaviruses, influenza viruses and HIV‐1. We contrast these affinities with HLA allele frequencies across hundreds of human populations worldwide. Statistical modelling shows that peptide‐binding affinities classified into four distinct categories depend on the HLA locus but that the type of virus is only a weak predictor, except in the case of HIV‐1. Among the strong HLA binders (IC50 ≤ 50), we uncovered 16 alleles (the top ones being A*02:02, B*15:03 and DRB1*01:02) binding more than 1% of peptides derived from all viruses, 9 (top ones including HLA‐A*68:01, B*15:25, C*03:02 and DRB1*07:01) binding all viruses except HIV‐1, and 15 (top ones A*02:01 and C*14:02) only binding coronaviruses. The frequencies of strongest and weakest HLA peptide binders differ significantly among populations from different geographic regions. In particular, Indigenous peoples of America show both higher frequencies of strongest and lower frequencies of weakest HLA binders. As many HLA proteins are found to be strong binders of peptides derived from distinct viral families, and are hence promiscuous (or generalist), we discuss this result in relation to possible signatures of natural selection on HLA promiscuous alleles due to past pathogenic infections. Our findings are highly relevant for both evolutionary genetics and the development of vaccine therapies. However they should not lead to forget that individual resistance and vulnerability to diseases go beyond the sole HLA allelic affinity and depend on multiple, complex and often unknown biological, environmental and other variables.
Keywords: coronavirus, COVID‐19, HIV, HLA population genetics, Indigenous Americans, influenza, natural selection, peptide‐binding predictions, SARS‐CoV‐2
1. INTRODUCTION
The pandemic of the new severe acute respiratory syndrome coronavirus SARS‐Cov‐2 emerged in East Asia at the end of 2019 and spread across the world in a couple of months, totalizing more than 6.5 million confirmed cases and almost 400 000 deaths as of 5 June 2020 (https://covid19.who.int/). In this context, it has become crucial to get a better understanding of the mechanisms that govern our immune defences against SARS‐Cov‐2, a highly contagious and dangerous pathogen. The HLA classical molecules play a crucial role in our adaptive immunity 1 , 2 , 3 by presenting small pathogen‐derived peptides at the surface of infected cells (in addition to self‐peptides that are continuously displayed at the cell surface). The HLA‐peptide complex is then recognised by CD8+ or CD4+ T lymphocytes (a mechanism called T‐cell restriction), which triggers an immune response. Pathogenic peptides are bound to a specific peptide‐binding region (PBR), which forms a beta‐pleated sheet floor bordered by two α‐helices at the extracellular distal end of the HLA proteins, and is characterised by a very high level of amino acid variation due to the huge polymorphism of the DNA exons that encode this part of the molecule, that is, exons 2 and 3 for HLA Class I molecules restricted by CD8+ cytotoxic T lymphocytes (CTLs), and exon 2 for HLA Class II molecules restricted by CD4+ helper T‐cells. Actually, both Class I and Class II molecules are encoded by several genes, the genomic variation of which represents altogether several thousands of different HLA alleles most often differing from each other at many single nucleotide sites (SNPs). 4 , 5
Because of this remarkable genetic variation, which is unique in the human genome and thought to represent signatures of long‐term balancing selection maintaining advantageous functional diversity, 6 , 7 , 8 , 9 the molecules encoded by different HLA alleles display distinct physico‐chemical properties that motivated tentative alleles classification into supertypes. 10 , 11 , 12 These properties determine unequal levels of affinity to different pathogenic peptides and make them present such peptides efficiently or not. The HLA genetic profile of an individual may thus partly influence the strength of the immune response to an invading pathogen because the encoded HLA molecules may exhibit distinct peptide‐binding properties. Moreover, as HLA alleles exhibit variable regional frequencies worldwide, 8 , 9 , 13 the proportion of HLA molecules displaying different peptide affinities for a given pathogen may also vary between populations. To address this issue, it is not only necessary to understand putative differences between populations in terms of immune protection, but also to have a better functional characterisation of the whole HLA polymorphism spectrum for the benefit of future vaccine developments.
Recently developed computational tools that integrate data from in vitro or mass spectrometry assays allow the prediction of peptide‐binding affinities of HLA molecules, as reviewed in. 14 Such methods are mostly used to identify viral epitopes that could be considered as good candidates for peptide‐based vaccines, for example, against HIV‐1, 15 Ebola virus 16 and SARS‐CoV‐2. 17 , 18 In addition to epitope identification, HLA peptide‐binding predictions may be useful for population and evolutionary genetics research to understand the behaviour of specific HLA alleles in pathogen‐rich environments and investigate whether such alleles might be submitted to pathogen‐driven selective pressures in human evolution. 19 , 20 , 21 In this context, the analysis of infectious agents belonging to distinct families is expected to bring significant working hypotheses.
In this study, we used a bioinformatic approach to characterise binding affinities between 438 HLA proteins (311 Class I and 127 Class II) and the full set of 9‐mer (for Class I) and 13‐mer (for Class II) peptides than can be derived from the complete SARS‐CoV‐2 proteome. We then explored the global allele frequency distributions of the strongest and weakest HLA binders of these viral peptides through statistical modelling to identify putative differences among populations. We performed the same analyses and compared the results with SARS‐CoV‐2 for six other viruses: SARS‐CoV‐1 and MERS‐CoV, which belong to the same beta‐coronavirus family as SARS‐CoV‐2; H1N1, H3N2 and H7N9, which represent three different influenza A virus subtypes also responsible for a highly contagious respiratory illness (flu); and the lentivirus HIV‐1 of the acquired immune deficiency syndrome (AIDS).
Our results showed significant differences among Class I and Class II HLA molecules in their capacity to present SARS‐CoV‐2 peptides at distinct affinities levels (strong, regular, weak and non‐binder), a greater proportion of strongest binders being found among HLA‐A proteins. However, the binding affinity profiles predicted for SARS‐CoV‐2 are not unique as they are very similar to those predicted for all other viruses, to the exception of HIV‐1. Most interestingly, the frequencies of strongest and weakest HLA binders differ among populations from different geographic regions. In particular, Indigenous Americans show unique peptide‐binding patterns that might represent past signatures of selection acting on several promiscuous HLA alleles due to ancient pathogenic infections.
2. MATERIAL AND METHODS
2.1. Population samples
We used a large database of HLA allele frequencies in world populations (with alleles defined at the second‐field level of resolution, third and fourth‐field levels being recoded to second‐field) including data from both the literature (1992‐2017) and reports of the 11th to 16th International HLA and Immunogenetics Workshops (IHIWs). For each of the different loci (HLA‐A, ‐B, ‐C, ‐DRB1, ‐DQA1 and ‐DQB1), the dataset comprises between 158 and 374 typed samples, classified according to the hla‐net.eu guidelines, 22 into 10 sub‐continental regions, that is, Sub‐Saharan Africa (SAF), North Africa (NAF), Europe (EUR), South‐West Asia (SWA), North‐East Asia (NEA), South‐East Asia (SEA), Australia (AUS), Oceania (OCE), North America (NAM) and South America (SAM). The number of populations per locus and region and the detailed list of populations are provided in Tables S1 and S2. Note that to avoid terms with possible negative connotations, we will use the most generally accepted term Indigeneous peoples to name the descendants of the earliest known inhabitants of a region, hence Indigeneous Australians and Indigeneous Americans will replace the commonly used Australian Aborigines and Amerindians (and other trivial names), respectively.
2.2. HLA alleles and proteins
All HLA‐A, ‐B, ‐C, and ‐DRB1 alleles that were observed in at least five populations worldwide (according to our database of allele frequencies), that is 92 HLA‐A, 164 HLA‐B, 55 HLA‐C and 94 HLA‐DRB1 were selected to assess the peptide‐binding affinity of their corresponding proteins HLA‐A, HLA‐B, HLA‐C and HLA‐DR, respectively, the latter representing the HLA‐DRA/DRB1 dimer as HLA‐DRA is here considered monomorphic. For HLA‐DQA1 and ‐DQB1, we selected all possible allele combinations represented in the NetMHCIIpan 23 method, that is, 33 HLA‐DQA1/DQB1 proteins, hereafter named HLA‐DQ. Therefore, a total of 438 different HLA proteins were analysed (Table S3).
2.3. Viral proteins
To assess the HLA‐peptide‐binding affinity predictions, we used the whole proteome of six respiratory viruses, including three coronaviruses important for public health (severe acute respiratory syndrome coronaviruses 1 [SARS‐CoV‐1] and 2 [SARS‐CoV‐2] and Middle East respiratory syndrome‐related coronavirus [MERS‐CoV]) and three Influenza A viruses with pandemic behaviour (Influenza A virus subtypes H1N1, H3N2 and H7N9, reported to have a high pandemic potential 24 ). We further included the human immunodeficiency virus type 1 (HIV‐1) as an outlier for respiratory viruses to contrast our results. For each virus we used the following proteins and strains (all these correspond to complete proteomes of the corresponding viruses) 25 :
2.3.1. SARS‐CoV‐1
Replicase polyprotein 1ab of isolates BJ01, BJ02, BJ03, BJ04, CUHK‐Su10, CUHK‐W1, Frankfurt 1, GD01, GZ50, HKU‐39849, HSR 1, Shanghai LY, Shanghai QXC, Sin2500, Sin2677, Sin2679, SZ16, SZ3, Taiwan, Taiwan TC1, Taiwan TC2, Taiwan TC3, Tor2, TW1, TWC, TWH, TWJ, TWK, TWS, Urbani, Vietnam and ZJ‐HZ01 (Uniprot Protein knowledgebase ID [UniprotKB]: P0C6X7).
2.3.2. SARS‐CoV‐2
The translation of the complete genome of the isolate Wuhan‐Hu‐1 (as reported in the NCBI Reference Sequence: NC_045512.2).
2.3.3. MERS‐CoV
The replicase polyprotein 1ab of isolate United Kingdom/H123990006/2012 (UniprotKB: K9N7C7).
2.3.4. A/H1N1
The hemagglutinin (HA) and neuraminidase (NA) of the strain A/Mexico/InDRE4114/2009 (UniprotKB: C5MQJ6 and C5MQL2, respectively), the nucleoprotein (NP) of strain A/New York/1682/2009 (UniprotKB: C5E522), the matrix protein (M1) of strain A/Nagano/RC1/2009 (UniprotKB: D4QF89), the Matrix protein 2 (M2) and the nuclear export protein (NEP) of strain A/USA:Albany/12/1951 (UniprotKB: A4U7A7 and A4U7B1, respectively), the non‐structural protein 1 (NS) of strain A/Hickox/1940 (UniprotKB: Q0HD54), the polymerase acidic protein (PA), the RNA‐directed RNA polymerase (RDRP) and the polymerase basic protein 2 (PB2) of strain A/Puerto Rico/8/1934 (UniprotKB: P03433, P03431 and P03428, respectively) and the Protein PB1‐F2 (PB1‐F2) of strain A/USA:Phila/1935 (UniprotKB: A4GCM8).
2.3.5. A/H3N2
The entire proteome (HA [UniprotKB: P03435], NA [UniprotKB: P03482], NP [UniprotKB: H9XII9], M1 [UniprotKB: H9XII6], M2 [UniprotKB: H9XII7], NEP [UniprotKB: H9XIJ1], NS [UniprotKB: H9XIJ0], PA [UniprotKB: P31343], RDRP [UniprotKB: P31341], PB2 [UniprotKB: P31345] and PB1‐F2 [UniprotKB: H9XIJ4]) of the strain A/Victoria/3/1975.
2.3.6. A/H7N9
The HA and PB2 of strain A/Shanghai/02/2013 (UniprotKB: R4NN21 and R4NN18, respectively), the NA of strain A/Shanghai/JS01/2013 (UniprotKB: A0A067Y7N7), the NP, M1, NEP and RDRP of strain A/Shanghai/PD‐01/2014 (UniprotKB: A0A0C4K0D4, A0A0C4K0Q1, A0A0C4K471 and A0A0C4K0Q0, respectively), the MP2 of strain A/Shanghai/5190 T/2013 (UniprotKB: W5U0H8), the NS of strain A/Shanghai/Mix1/2014 (UniprotKB: A0A0A1CFP7), the PA and PB1‐F2 of strain A/Shanghai/01/2014 (UniprotKB: A0A059T4A8 and A0A059T4Z4, respectively) and PB2 of strain A/Shanghai/02/2013 (UniprotKB: R4NN18).
2.3.7. HIV‐1
The Envelope glycoprotein gp160 (gp160) and Protein Tat (Tat) of the group M (UniprotKB: Q0H600 and Q76PP9, respectively), the Gag‐Pol polyprotein (Gag‐Pol) of isolate BH10 (group M, subtype B) (UniprotKB: P03366), the Protein Rev (Rev) of isolate HXB3 (group M, subtype B) (UniprotKB: P69718), the Virion infectivity factor (VIF), Protein Vpu (Vpu) and Protein Vpr (Vpr) of isolate HXB2 (group M, subtype B) (UniprotKB: P69723, P05919 and P69726, respectively).
2.4. HLA peptide‐binding affinity predictions
We predicted the peptide‐binding affinity of each HLA protein to all possible overlapping 9‐mer (for HLA Class I) and 13‐mer (for HLA Class II) peptides (the most commonly bound by these proteins, respectively) derived from all viral proteins and strains listed above. The total number of viral peptides considered in this study for HLA Class I/Class II‐binding predictions were 7065/7061 for SARS‐CoV‐1, 7089/7084 for SARS‐CoV‐2, 7070/7066 for MERS‐Cov, 4471/4430 for H1N1, 4472/4431 for H3N2, 4451/4407 for H7N9 and 2803/2778 for HIV‐1.
The peptide‐HLA‐binding affinity predictions were run using the Immune Epitope Database (IEDB) and Analysis Resource virtual machine image. 26 , 27 We used the prediction algorithm from NetMHCpan v. 4.0 28 for Class I alleles and NetMHCIIpan v. 3.2 23 for Class II alleles, since these methods include all alleles described in the Table S3. We classified the binding predictions, or binding kind, as strong (IC50 ≤ 50 nM), regular (50 nM < IC50 ≤ 500 nM) and weak (500 nM < IC50 ≤ 5000 nM) binders for Class I, and strong (IC50 ≤ 50 nM), regular (50 nM < IC50 ≤ 1000 nM) and weak (1000 nM < IC50 ≤ 5000 nM) binders for Class II, following the recommendations by the authors. 26 , 27 Any peptide‐binding prediction affinity above 5000 nM was considered as a non‐binder. We validated our results against those obtained using the ANN method 29 and the NN‐align‐2.3 (netMHCII‐2.3) method 23 for smaller subsets of Class I and Class II alleles respectively. These methods yield prediction affinites with higher accuracy, 30 but were not used for this study as they only include a fraction of the alleles analysed (data not shown).
3. STATISTICAL ANALYSES
3.1. HLA strongest and weakest binders of SARS‐CoV‐2 peptides in populations worldwide
Allele frequencies of population samples were added and collapsed into the four binding kinds (strong, regular, weak and non‐binder). The variation of these frequencies was graphed by locus and region to identify putative patterns. Statistical modelling was used to confirm and formalise the patterns identified. Linear modelling was used to obtain estimates of the associations between the regions and the loci for each of two extreme binding kinds retained, that is, strongest (strong binder for at least 100 SARS‐CoV‐2‐derived peptides) and weakest (weak or non‐binder for more than 99% of the total set of SARS‐CoV‐2 derived peptides). Potential heteroscedasticity issues due to uneven sample distributions among geographic regions were addressed using mixed models 31 and the results were consistent with those of the linear model. A single model including binding kind as a third predictor was considered and provided similar results but, because three‐way interactions were necessary to report the model, we preferred splitting the data set according to binding kind to simplify the presentation of results.
3.2. HLA strongest and weakest binders of peptides derived from the seven viruses
In order to analyse the binding repertoires for all viruses, we recoded the absolute counts of bound peptides into proportions to obtain comparable quantities. Strongest binders were thus defined as strong binders for at least 1% of the total set of peptides per virus, and weakest binders (as was performed for SARS‐CoV‐2 alone) as weak or non‐binders for 99% (or greater) of them. Patterns were sought through graphical representations and formalised by means of linear modelling. Issues with heteroscedasticity were handled by rank transforming the proportions. The model was further confirmed using robust regression, a procedure that iteratively reweighted the observations in inverse proportion of its residuals, 32 to tame the impact of outliers.
All the reported statistical analyses were performed using R version 3.4.4 33 in a ×86_64‐pc‐linux‐gnu (64‐bit) platform.
4. RESULTS
4.1. Binding affinities of HLA‐A, ‐B, ‐C, ‐DR and ‐DQ molecules to SARS‐CoV‐2
The 438 HLA molecules analysed in this study bind different numbers of SARS‐CoV‐2 peptides with each of the four kinds of binding affinities (strong, regular, weak or non‐binding) (Data S1), with the proportions of bound peptides also varying among loci (Table 1 and Figure 1).
TABLE 1.
Number of SARS‐CoV‐2 peptides binding at different affinity levels or not binding HLA proteins
| HLA loci | ||||||
|---|---|---|---|---|---|---|
| Affinity levels | # peptides | A | B | C | DRB1 | DQA1/DQB1 |
| Strong binding (IC50 ≤ 50 nM) | Min (%) | 0 (0) | 0 (0) | 0 (0) | 0 (0) | 0 (0) |
| Max (%) | 272 (3.8) | 203 (2.9) | 99 (1.4) | 719 (10.1) | 9 (0.13) | |
| Average (%) | 50.6 (0.7) | 17.8 (0.25) | 17.7 (0.25) | 35.2 (0.5) | 0.5 (0.01) | |
| Regular binding (50 nM < IC50 ≤ 500 nM for Class I) (50 nM < IC50 ≤ 1000 nM for Class II) | Min (%) | 16 (0.2) | 0 (0) | 0 (0) | 2 (0.03) | 0 (0) |
| Max (%) | 329 (4.6) | 478 (6.7) | 448 (6.3) | 3855 (54.4) | 1536 (21.7) | |
| Average (%) | 136.3 (1.9) | 79.9 (1.1) | 125.9 (1.8) | 1507.2 (21.3) | 436.3 (6.1) | |
| Weak binding (500 nM < IC50 ≤ 5000 nM for Class II) (1000 nM < IC50 ≤ 5000 nM for Class II) | Min (%) | 130 (1.9) | 45 (0.6) | 18 (0.25) | 197 (2.8) | 50 (0.7) |
| Max (%) | 1123 (15.8) | 1162 (16.4) | 1206 (17) | 3917 (55.3) | 4572 (64.5) | |
| Average (%) | 433 (6.1) | 354.1 (5) | 560 (7.9) | 2841 (40.1) | 2701.3 (38.1) | |
| No binding (IC50 > 5000 nM) | Min (%) | 5605 (79.1) | 5246 (74) | 5404 (76.2) | 683 (9.6) | 976 (13.8) |
| Max (%) | 6939 (97.9) | 7041 (99.3) | 7071 (99.7) | 6885 (97.2) | 7034 (99.3) | |
| Average (%) | 6469.1 (91.3) | 6637.2 (93.6) | 6385.4 (90.1) | 2700.6 (38.1) | 3945.9 (55.7) | |
| Weak or nobinding (IC50 > 500 nM for Class I) (IC50 > 1000 nM for Class II) | Min (%) | 6502 (91.7) | 6408 (90.4) | 6564 (92.6) | 2510 (35.4) | 5548 (78.3) |
| Max (%) | 7072 (99.8) | 7089 (99.99) | 7089 (99.99) | 7082 (99.97) | 7084 (100) | |
| Average (%) | 6902.2 (97.4) | 6991.3 (98.6) | 6945.5 (98) | 5541.5 (78.2) | 6647.2 (93.8) | |
FIGURE 1.
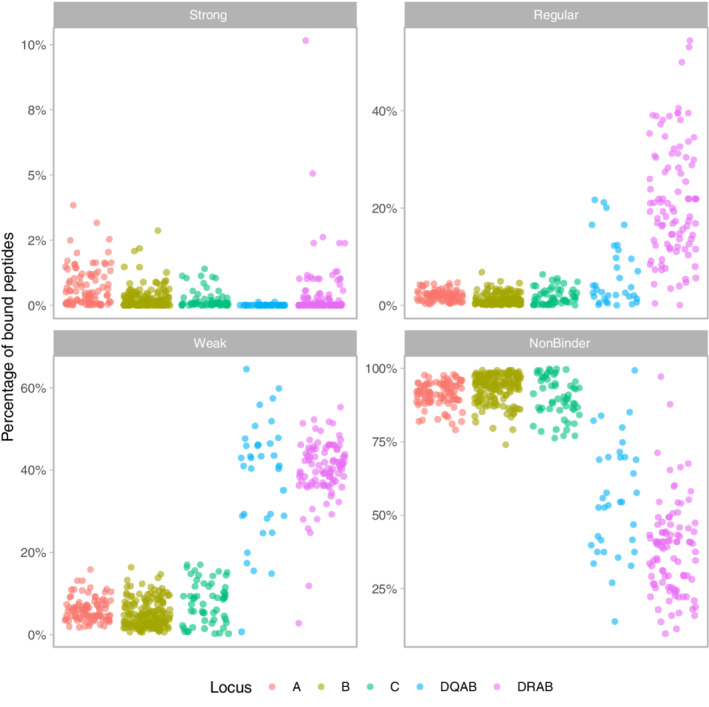
Percentage of the total number of peptides derived from the complete SARS‐CoV‐2 peptidome that is bound by each HLA protein (dots) according to NetMHCpan v. 4.0 and NethMHCpanII v. 3.2 predictions (see section 2). The four binding classes strong, regular, weak and non‐binder follow the affinity criteria as indicated in the text.DQAB refers to the protein coded jointly by DQA1 and DQB1 molecules. Locus DRA was considered as non‐polymorphic, hence DRAB actually corresponds to DRB1 molecules. The distinct patterns of Class I and Class II alleles are visible through their variabilities, which are much higher for Class II
The average proportion of SARS‐CoV‐2 peptides predicted to bind HLA molecules with strong affinity is below 1% (varying between 0.01% for HLA‐DQ and 0.7% for HLA‐A). The average proportion of peptides that bind with either regular or weak affinity is also low for Class I molecules (<2% and <8%, respectively) but substantially higher (6%‐21% and 38%‐40%, respectively) and with a much larger variance (eg, 0.03%‐54.4% and 2.8%‐55.3%, respectively, for HLA‐DR) for Class II. The vast majority of peptides (at least >74%, and on average >90%) do not bind HLA Class I molecules, whereas larger variances are again observed for HLA Class II (eg, 9.6%‐97.2% for HLA‐DR).
Among HLA Class I proteins, only one HLA‐A molecule (1.1%) is never classified as a strong binder (# of bound peptides = 0) and as many as 17 molecules (18.5%) are strong binders for more than 100 peptides (“strongest” binders, see below), while these proportions are reversed for HLA‐B and HLA‐C (18.3% and 20% of never strong binders and 3% and 0% of strongest binders, respectively) (Table 2). For HLA Class II, almost half (47.9%) of HLA‐DR and as many as 88.9% of HLA‐DQ proteins are never strong binders and the proportions of strongest binders is moderate for HLA‐DR (6.4%) and null for HLA‐DQ.
TABLE 2.
Number of HLA proteins binding at different affinity levels or not binding 0, ≥100 or ≥99% of SARS‐CoV‐2 peptides
| HLA loci (total # of proteins) | ||||||
|---|---|---|---|---|---|---|
| Affinity levels | # peptides | A (92) | B (164) | C (55) | DRB1 (94) | DQA1/DQB1 (34) |
| Strong binding (IC50 ≤ 50 nM) | 0 (%) | 1 (1.1) | 30 (18.3) | 11 (20) | 45 (47.9) | 32 (88.9) |
| ≥ 100 (%) | 17 (18.5) | 5 (3) | 0 (0) | 6 (6.4) | 0 (0) | |
| Regular binding (50 nM < IC50 ≤ 500 nM for Class I) (50 nM < IC50 ≤ 1000 nM for Class II) | 0 (%) | 0 (0) | 2 (1.2) | 5 (9.1) | 0 (0) | 1 (2.9) |
| ≥ 100 (%) | 57 (62) | 41 (25) | 27 (49.1) | 92 (97.9) | 25 (73.5) | |
| Weak binding (500 nM < IC50 ≤ 5000 nM for Class II) (1000 nM < IC50 ≤ 5000 nM for Class II) | 0 (%) | 0 (0) | 0 (0) | 0 (0) | 0 (0) | 0 (0) |
| ≥ 100 (%) | 92 (100) | 154 (93.9) | 49 (89.1) | 94 (100) | 33 (97.1) | |
| No binding (IC50 > 5000 nM) | 0 (%) | 0 (0) | 0 (0) | 0 (0) | 0 (0) | 0 (0) |
| ≥ 100 (%) | 92 (100) | 164 (100) | 55 (100) | 94 (100) | 34 (100) | |
| Weak or no binding (IC50 > 500 nM for Class I) (IC50 > 1000 nM for Class II) | 0 (%) | 0 (0) | 0 (0) | 0 (0) | 0 (0) | 0 (0) |
| ≥99% (%) | 21 (22.8) | 94 (57.3) | 21 (38.2) | 2 (2.1) | 7 (20.6) | |
Very few HLA molecules are never regular binders (the highest proportion, 9.1%, being observed at HLA‐C). However, a greater proportion of HLA‐A molecules (62%) are often regular binders compared to HLA‐B (25%) and HLA‐C (49.1%) although the great majority of regular binders are found among Class II molecules (97.9% of HLA‐DR and 73.5% of HLA‐DQ).
Each HLA molecule binds weakly or does not bind at least one peptide (the number of peptides is never 0 in these categories). Most HLA Class II (>97%) and a large proportion of HLA‐C (56.4%) bind weakly more than 500 peptides, compared to HLA‐A (31.5%) and HLA‐B (26.2%). However, HLA‐B displays the greatest proportion of proteins (57.3%) that bind weakly or do not bind the main bulk (>99%) of SARS‐CoV‐2 peptides, followed by HLA‐C (38.2%), HLA‐A (22.8%), HLA‐DQ (20.6%) and HLA‐DR (2.1%).
Overall, HLA‐A proteins appear to be better binders of SARS‐CoV‐2 peptides than the other HLA Class I proteins although the proportion of peptides predicted to be bound by all these molecules is very low. Among Class II proteins, both HLA‐DR and (to a lesser extent) HLA‐DQ display heterogeneous kinds of binding affinities, but HLA‐DQ dimers are rarely strong binders.
4.2. List of strongest and weakest HLA SARS‐CoV‐2 peptide binders at each HLA locus
We classified the HLA proteins showing extreme binding profiles relatively to SARS‐CoV‐2 peptides into strongest and weakest binders. Strongest binders were those predicted to bind at least 100 viral peptides with strong affinity and weakest binders were those predicted to bind weakly or not at all to more than 99% of viral peptides. A total of 28 HLA were classified as strongest (Table 3) and 144 as weakest (Table 4) according to these criteria.
TABLE 3.
List of HLA strongest binders (>100 peptides bound at high affinity, that is, IC50 ≤ 50 nM) of SARS‐CoV‐2 peptides
| Strongest binders | ||||||||
|---|---|---|---|---|---|---|---|---|
| HLA‐A | # bound peptides | HLA‐B | # bound peptides | HLA‐C | # bound peptides | HLA‐DRB1 | # bound peptides | HLA‐DQA1/DQB1 |
| A*02:11 | 272 | B*15:03 | 203 | (C*03:02) | (99) | DRB1*01:01 | 719 | — |
| A*02:22 | 224 | B*15:17 | 154 | DRB1*10:01 | 358 | |||
| A*02:02 | 179 | B*35:10 | 147 | DRB1*01:04 | 185 | |||
| A*02:03 | 176 | B*15:25 | 104 | DRB1*11:02 | 169 | |||
| A*02:06 | 144 | B*15:39 | 103 | DRB1*13:01 | 169 | |||
| A*02:12 | 142 | DRB1*13:22 | 169 | |||||
| A*23:04 | 120 | |||||||
| A*02:01 | 115 | |||||||
| A*02:09 | 115 | |||||||
| A*02:24 | 115 | |||||||
| A*02:40 | 115 | |||||||
| A*68:01 | 111 | |||||||
| A*68:12 | 111 | |||||||
| A*02:35 | 111 | |||||||
| A*02:05 | 104 | |||||||
| A*24:03 | 101 | |||||||
| A*24:23 | 101 | |||||||
Note: The complete list of alleles with the number of peptides bound at different affinity levels is given in Data S1.
TABLE 4.
List of HLA weakest binders (>99% of weak or no bindings, that is, IC50 > 500 nM f or Class I, IC50 > 1000 nM for Class I) of SARS‐CoV‐2 peptides
| Weakest binders | |||||||
|---|---|---|---|---|---|---|---|
| HLA‐A | HLA‐B | HLA‐C | HLA‐DRB1 | HLA‐DQA1/DQB1 | |||
| A*25:02 | B*44:06 a , b | B*48:04 | B*18:07 | B*15:08 | C*01:03 a , b | DRB1*01:01 | DQA1*01:02/DQB1*06:09 a , b |
| A*25:01 | B*51:07 a , b | B*44:05 a | B*49:01 | B*27:08 | C*07:04 a , b | DRB1*03:02 a | DQA1*01:02/DQB1*06:03 a |
| A*01:02 | B*08:03 a | B*14:01 | B*15:04 a | B*18:01 | C*07:11 a , b | DRB1*03:03 a | DQA1*01:02/DQB1*06:14 a |
| A*01:03 | B*46:01 a | B*14:02 | B*35:02 | B*18:05 | C*18:01 a , b | DQA1*01:01/DQB1*05:03 a | |
| A*02:07 | B*52:01 a | B*51:01 | B*35:04 | B*56:01 | C*18:02 a , b | DQA1*01:02/DQB1*06:08 a | |
| A*74:01 | B*27:03 a | B*27:04 | B*35:09 | B*27:05 | C*04:04 a | DQA1*01:03/DQB1*06:03 a | |
| A*74:03 | B*73:01 a | B*13:03 a | B*35:12 | B*57:02 | C*04:01 a | DQA1*01:02/DQB1*06:10 a | |
| A*01:01 | B*82:01 a | B*27:14 a | B*15:13 a | B*07:04 | C*04:05 a | ||
| A*26:03 | B*82:02 a | B*15:58 a | B*08:04 | B*40:06 | C*04:07 a | ||
| A*01:06 | B*58:02 a | B*59:01 | B*40:10 | B*54:01 | C*01:02 a | ||
| A*43:01 | B*51:05 a | B*44:04 | B*50:02 | B*55:07 | C*07:07 a | ||
| A*66:03 | B*51:08 a | B*15:21 a | B*44:03 | B*50:01 | C*04:06 | ||
| A*26:05 | B*51:04 a | B*78:01 a | B*44:07 | B*55:12 | C*04:03 | ||
| A*36:01 | B*15:09 | B*44:15 a | B*44:02 | B*07:02 | C*07:08 | ||
| A*66:01 | B*15:10 | B*40:12 | B*42:02 | B*45:01 | C*08:02 | ||
| A*30:08 | B*51:09 | B*48:03 | B*39:05 | B*47:03 | C*06:02 | ||
| A*26:01 | B*14:03 a | B*13:04 a | B*08:05 | B*40:01 | C*07:01 | ||
| A*24:04 | B*35:06 | B*38:01 | B*53:02 | B*53:05 | C*07:06 | ||
| A*30:04 a | B*51:06 a | B*37:01 a | B*18:03 | B*27:06 | C*07:18 | ||
| A*26:12 | B*78:02 a | B*51:02 | B*39:06 | B*53:01 | C*17:03 | ||
| A*26:18 | B*27:02 a | B*81:01 | B*15:24 a | B*13:01 | C*05:01 | ||
| B*35:03 | B*38:02 | B*15:18 | B*44:09 | ||||
| B*13:02 a | B*55:01 | B*15:11 | |||||
| B*48:01 | B*47:01 | B*18:02 | |||||
Note: The complete list of alleles with the number of peptides bound at different affinity levels is given in Data S1.
Never strong binders.
Never strong nor regular binders.
4.2.1. HLA‐A
Among the strongest HLA‐A binders, A*02:11 and A*02:22 are particularly successful as they bind more than 200 peptides with high affinity and are also weak or non‐binders for the lowest proportion of peptides (<93%). Regarding their allele frequencies, both of them are very rare globally (<2.5%) except A*02:11 in several Indian populations (up to 21.1% in Munda 34 ) and A*02:22 in two Indigenous populations from Brazil (5.8% in Guarani and 15% in Terena). The other strongest binders mostly belong to the A*02 lineage (A*02:02, *02:03, *02:06, *02:12, *02:01, *02:09, *02:24, *02:40, *02:35, *02:05), although A*68 (*68:01, *68:12), A23 (*23:04) and A*24 (*24:03, *24:23) molecules (all belonging to the A2 cross‐reactive group 35 ) are also represented. Most of these alleles are also very rare except A*02:01, which is widespread in the world (only absent in New Guinea) and particularly frequent (sometimes above 50%) in all Indigenous American populations (eg, in Seri from Mexico); A*02:06, which is observed at 20%‐30% in some Mexican populations; and A*68:01, which also reaches 20%‐25% in some Indigenous peoples in South America. At the opposite, A*25:02 and A*25:01 are the weakest HLA‐A binders as they are weak or non‐binders for the highest proportions of viral peptides (99.8% and 99.7%, respectively) and only bind one peptide with high affinity. Finally, A*30:04 is unique in that it never is a strong binder. The alleles corresponding to A*25:01, A*25:02 and A*30:04 are rare except the latter in a few African populations (7.4%in Sudanese and 11.5% in Cameroonese).
4.2.2. HLA‐B
At locus HLA‐B, B*15:03 is predicted to bind more than 200 peptides with strong affinity and is weak or non‐binder for a minimum number of peptides (90.4%). The other strongest binders are B*35:10 as well as other molecules of the B*15 lineage (B*15:17, *15:25, *15:39). All these alleles are generally rare (<3%) except B*15:03 in sub‐Saharan Africa (up to ~11%) and B*15:25 in populations from South‐East Asia, New‐Guinea and Australia (up to ~15%, with an exceptionally high frequency of 40% in an Indigenous Taiwanese population, the Yami). By contrast, B*44:06, B*51:07, B*08:03, B*46:01 and B*52:01 are the top weakest binders as they both bind weakly or do no bind 100% of viral peptides and are never strong binders (and B*44:06 and B*51:07 never behave as regular binders either). Contrary to HLA‐A, in which weakest binders are always rare, some HLA‐B weakest binders are observed at intermediate to high frequencies in several geographic regions, namely B*46:01 in several populations from China and South‐East Asia (eg, above 20% in Dai and Shui), and B*52:01 in some Japanese, Indian, Chinese (above 20% in Lisu) and a few other populations in different geographic regions.
4.2.3. HLA‐C
HLA‐C proteins display weaker binding properties compared to HLA‐A and ‐B, as none of them bind more than 100 peptides with high affinity (HLA‐C*03:02 is the top strongest binder with 99 peptides). The weakest binders are C*01:03, C*07:04, C*07:11, C*18:01, C*18:02 and C*04:04, all of which either bind weakly or do not bind 100% of peptides; they are also never classified as either strong or regular, except in one case for C*04:04. C*18:01 shows moderate frequencies (rarely above 10%) in a few sub‐Saharan African populations and C*04:04 reaches 20% in a single Sioux population from North America.
4.2.4. HLA‐DR
Among HLA‐DR proteins, DRB1*01:01 is strong binder for as many as 719 peptides, followed by DRB1*10:01 (358 peptides). The other strongest binders are DRB1*01:04, DRB1*11:02, DRB1*13:01 and DRB1*13:22. Most of these alleles are globally widespread although at low to intermediate frequencies (eg, up to 10%‐15% for DRB1*01:01 in some European populations and for DRB1*10:01 and DRB1*13:01 in some European, African and South‐West Asian populations). By contrast, DRB1*03:02 is the weakest binder (weak or not binder for 100% of peptides) followed by DRB1*03:03. DRB1*03:02 is only found at intermediate frequencies (10%‐20%) in a few sub‐Saharan African populations.
4.2.5. HLA‐DQ
Finally, as for HLA‐C, no HLA‐DQ protein is a strong binder for more than 100 peptides. Among the weakest binders, DQA1*01:02/DQB1*06:09 binds weakly or does not bind 100% of peptides. The other weakest binders are all DQA1*01/DQB1*06 dimers (DQA1*01:02/DQB1*06:03, DQA1*01:02/DQB1*06:14, DQA1*01:02/DQB1*06:08, DQA1*01:03/DQB1*06:03, DQA1*01:02/DQB1*06:10), except DQA1*01:01/DQB1*05:03. DQA1*01 and DQB1*06 (mostly DQB1*06:03) alleles are widespread (sometimes with high frequencies for DQA1*01) in most global populations except in Indigenous Americans where they are most often not observed.
4.3. Global frequency distributions of strongest and weakest HLA SARS‐CoV‐2 peptide binders
We developed an interactive tool (https://hla-net.eu/sars-cov-2/) to visualise the population frequencies of HLA alleles in relation to the ability of their corresponding proteins to bind SARS‐CoV‐2 peptides at different affinity levels. This tool was built using R Shiny Package (version 1.4.0) and runs on the hla.net.eu server maintained at the Anthropology Unit of the University of Geneva. It allows one to select one or more HLA alleles per locus, per geographic region and per kind of binding (strong, regular, weak or non‐binder), and in each case a continuous slider allows choosing a cut‐off for the number of viral peptides bound (or not bound) to the corresponding molecules (default value 10% of peptides per locus). Three outputs are provided for each set of selected alleles: a global map (two for HLA‐DQ, that is, for DQA1 and DQB1, respectively) showing their frequencies in all populations in the form of pie charts; box plots showing the frequencies of these alleles in each of the 10 geographic regions; and a table providing information on all population samples used in the study including detailed allele frequencies. This tool has been implemented in the hla‐net.eu bioinformatic platform (http://hla-net.eu) first developed within the scope of the EU‐funded HLA‐NET BM0803 Action. 22 , 36
We plotted the cumulative frequency distributions of the strongest (red dots in Figure 2) and weakest (blue dots in Figure 2) binders in each population at each locus, except HLA‐DQ, which is not represented because it involves two polymorphic loci and no such joint frequencies were available (as we do not have information on populations' genotypes, we do not know the frequencies of DQ heterodimers, this is why we could not report DQ results in relation to population frequencies). This revealed notable differences both among the loci and geographical regions (Figure 2 top). Strongest binders are generally more frequent than weakest binders at loci HLA‐A and HLA‐DRB1, whereas HLA‐B displays the opposite pattern (for HLA‐C, no strongest binders following our criteria were found). Notably, HLA‐A shows both extremely high frequencies of strongest binders and relatively low frequencies of weakest binders in Indigenous peoples of North (NAM) and South (SAM) America. The populations from the other geographic regions have more similar frequencies for both kinds of alleles, although there is substantially more overlap in sub‐Saharan Africa (SAF), South‐East Asia (SEA) and (to a lesser extent) Oceania (OCE). At HLA‐B, the frequencies of strongest binders are very low compared with those of weakest binders (except in one population of Oceania). At HLA‐DRB1, the frequencies of weakest binders are residual except in sub‐Saharan Africa, and strongest binders show lower frequencies in South‐East Asia (SEA), Australia (AUS), Oceania (OCE) and North (NAM) and South (SAM) America compared with the other regions.
FIGURE 2.
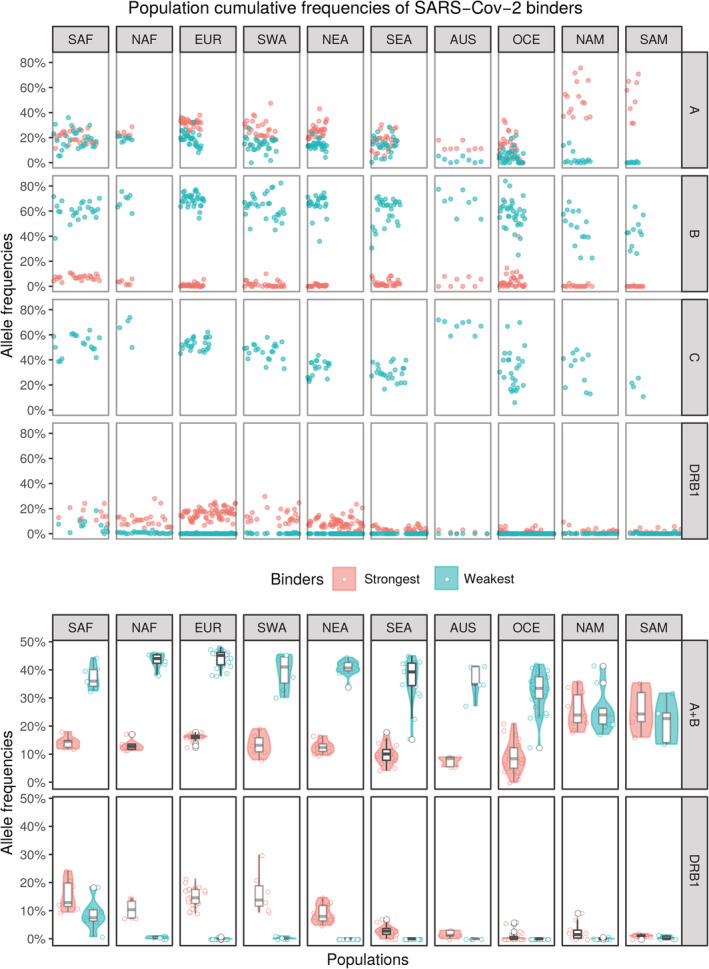
Cumulative allele frequencies for the two groups of alleles that were considered as strongest (in red) and weakest (in blue) binders, by locus (HLA‐A, ‐B, ‐C and ‐DRB1) and geographic region for each population sample. Population samples and binding criteria are described in the main text. In the bottom panel, HLA‐A and ‐B frequencies have been averaged (named as “A + B”) and the distribution of the cumulative frequencies among the population samples of each region are presented both as violin and box plots. Geographic regions are SAF, Sub‐Saharan Africa; NAF, North Africa; EUR, Europe; SWA, South‐West Asia; NEA, North‐East Asia; SEA, South‐East Asia; AUS, Australia; OCE, Oceania; NAM, North America; SAM, South America
HLA Class I molecules are mostly involved in the presentation of viral peptides and CD8+ CTL restriction, whereas HLA Class II molecules present antigenic peptides to CD4+ T‐helper cells, which triggers differentiation of antibody‐producing B cells. For that reason, we also plotted the averaged cumulative frequencies of HLA Class I (A + B) strongest and weakest binders separately from those of HLA Class II (DRB1) for the same subset of 124 populations (7 SAF, 6 NAF, 26 EUR, 7 SWA, 16 NEA, 17 SEA, 5 AUS, 25 OCE, 10 NAM and 5 SAM, respectively) tested at these three loci (Figure 2 bottom). On average, strongest binders are less frequent than weakest binders for A + B, although weakest binders' frequencies sometimes show larger variances. All Indigenous Americans again display the highest frequencies of strongest and the lowest frequencies of weakest binders. The plot of HLA Class II (DRB1) frequencies clearly distinguishes sub‐Saharan Africa, which displays the highest frequencies of weakest binders, and contrasts SAF, NAF, EUR, SWA, and NEA from SEA, AUS, OCE, NAM, SAM regions due to higher frequencies of strongest binders in the former.
4.4. Effects of HLA locus and geographic region on the global frequency distributions of HLA SARS‐CoV‐2 peptide binders
We tested simultaneously the effects of several parameters, that is, HLA locus (HLA‐A, ‐B, ‐DR) and geographic region (SAF, NAF, EUR, SWA, NEA, SEA, AUS, OCE, NAM, SAM) on the global frequencies of the strongest and weakest HLA binders by setting up a statistical model (see Materials and Methods).
We tried many simplifications (either automatic, via stepwise regression or handmade) of the complete maximal model (the model including all variables and their interactions) by grouping some regions together, but the resulting models were significantly worse. As our initial model presented some heteroscedasticity, not unexpected given the uneven number of samples per region, we resorted to mixed models using the samples as a random effect. The complete maximal mixed model could not be simplified without significant loss and the relative magnitudes of almost all the coefficients remained the same. We thus concluded that the structure presented by the data was relevant as the (linear) model retained explains 85% and 95% of the total variance of the frequency of strongest and weakest binders, respectively (Table 5).
TABLE 5.
Retained models for each kind of peptide binding
| Dependent variable | ||
|---|---|---|
| Freq | ||
| Terms | Strongest | Weakest |
| LocusB | −0.121*** (0.028) | 0.44*** (0.033) |
| LocusDR | −0.046 (0.028) | −0.068** (0.033) |
| RegionNAF | 0.028 (0.029) | 0.04 (0.035) |
| RegionEUR | 0.109*** (0.022) | 0.037 (0.027) |
| RegionSWA | 0.051* (0.028) | −0.025 (0.033) |
| RegionNEA | 0.045* (0.024) | −0.022 (0.028) |
| RegionSEA | −0.033 (0.023) | −0.023 (0.028) |
| RegionAUS | −0.063** (0.031) | −0.131*** (0.037) |
| RegionOCE | −0.081*** (0.022) | −0.096*** (0.027) |
| RegionNAM | 0.305*** (0.026) | −0.116*** (0.031) |
| RegionSAM | 0.314*** (0.031) | −0.151*** (0.037) |
| LocusB:RegionNAF | −0.075* (0.041) | 0.04 (0.049) |
| LocusDR:RegionNAF | −0.079* (0.041) | −0.121** (0.049) |
| LocusB:RegionEUR | −0.183*** (0.031) | 0.058 (0.038) |
| LocusDR:RegionEUR | −0.115*** (0.031) | −0.123*** (0.038) |
| LocusB:RegionSWA | −0.118*** (0.039) | 0.092* (0.047) |
| LocusDR:RegionSWA | −0.044 (0.039) | −0.058 (0.047) |
| LocusB:RegionNEA | −0.119*** (0.033) | 0.114*** (0.040) |
| LocusDR:RegionNEA | −0.111*** (0.033) | −0.064 (0.040) |
| LocusB:RegionSEA | −0.015 (0.033) | 0.021 (0.040) |
| LocusDR:RegionSEA | −0.096*** (0.033) | −0.063 (0.040) |
| LocusB:RegionAUS | −0.007 (0.043) | 0.232*** (0.052) |
| LocusDR:RegionAUS | −0.076* (0.043) | 0.045 (0.052) |
| LocusB:RegionOCE | 0.057* (0.032) | 0.09** (0.038) |
| LocusDR:RegionOCE | −0.066** (0.032) | 0.01 (0.038) |
| LocusB:RegionNAM | −0.381*** (0.036) | −0.001 (0.044) |
| LocusDR:RegionNAM | −0.436*** (0.036) | 0.031 (0.044) |
| LocusB:RegionSAM | −0.393*** (0.043) | −0.017 (0.052) |
| LocusDR:RegionSAM | −0.459*** (0.043) | 0.07 (0.052) |
| Constant | 0.202*** (0.020) | 0.153*** (0.024) |
| Observations | 372 | 372 |
| R2 | 0.859 | 0.954 |
| Adjusted R2 | 0.847 | 0.95 |
| Residual Std. Error (df = 342) | 0.052 | 0.063 |
| F Statistic (df = 29; 342) | 71.608*** | 244.587*** |
Note: The dependent variable is the frequency (Freq) of the strongest (left) and weakest (right) HLA binders. The left column (terms) lists all the independent variables and their interactions. For each retained model (Strongest and Weakest) the first column displays the coefficients of the model, that is, the differences in average cumulated frequencies between the group defined by each term and the reference (Locus: A; Region: SAF, grouped on the constant term); the second column shows asterisks indicating the significance level of a test for the coefficient being zero (no effect); and the third column presents in parentheses the values of the standard errors associated with the coefficients.
P < .1;
P < .05;
P < .01.
Both kinds of binding show common patterns of significant differences between Locus A (taken as reference) and Locus B (P < .01) but not Locus DR (P < .05 only for weakest). Region SAF (taken as reference) is significantly different from AUS (P < .05 for strongest binders and P < .01 for weakest), OCE (P < .01), NAM (P < .01) and SAM (P < .01), with particularly high frequency increases of strongest binders (>30%) in NAM and SAM and marked frequency decreases of weakest binders (>11%) in AUS, NAM and SAM. Region EUR shows a 10.9% significant increase (P < .01) in the frequency of strongest binders compared with SAF, while SWA and NEA show marginally significant differences (P < .1) and only a ~5% increase, while for weakest binders no significant differences are observed for these regions.
The pattern of significant interactions is split, with opposite significance for strongest and weakest binders, to the exceptions of LocusDR:RegionNAF, LocusDR:RegionEUR, LocusB:RegionSWA, LocusDR:RegionSWA, LocusB:RegionNEA, LocusB:RegionSEA and LocusB:RegionOCE that present similar patterns for strongest and weakest binders.
According to the retained models for both kinds of binding affinities, allele frequencies of strongest and weakest HLA SARS‐CoV‐2 peptide binders thus depend both on the HLA locus and the geographic region, although not in an additive way, therefore explaining the numerous interactions that appear as statistically significant.
4.5. Comparison of the HLA peptide‐binding patterns observed for the seven different viruses
Using the same methods and set of alleles as was done for SARS‐CoV‐2, we performed peptide‐binding predictions for peptides derived from SARS‐CoV‐1, MERS‐CoV, H1N1, H3N2, H7N9 and HIV‐1 ([Link], [Link]). Overall, the patterns displaying the percentages of bound peptides are very similar for the seven viruses (Figure 3), but we also note relevant differences between the three viral families (coronaviruses, influenza viruses and the immunodeficiency virus). Among strong binders, the three coronaviruses bind a greater range of peptides than the three influenza, and the range of bound peptides is lowest for HIV‐1. Regular binders show analogous differences among the virus families although with a greater contrast for HIV‐1 at HLA‐DR. The ranges observed for non‐binders are also globally slightly reduced for the three influenza viruses compared with coronaviruses and for HIV‐1 compared with the other two viral families.
FIGURE 3.
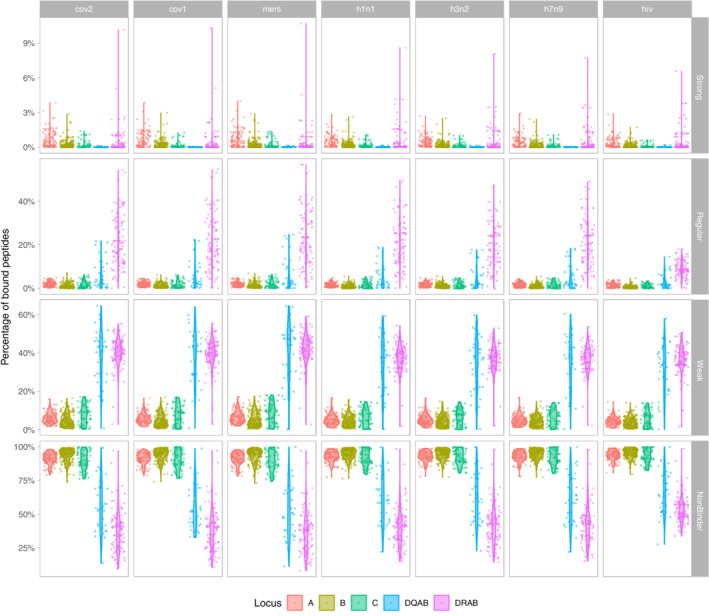
Proportion of the total number of peptides derived from the peptidomes of the 7 viruses analysed in this study (SARS‐CoV‐2, SARS‐CoV‐1, MERS‐CoV; H1N1, H3N2, H7N9; HIV‐1) that is bound by each HLA protein, per locus and binding kind. The four binding classes strong, regular, weak and non‐binder follow the usual affinity criteria (as indicated in the text). DQAB refers to the protein coded jointly by DQA1 and DQB1 molecules. Locus DRA was considered as non‐polymorphic, hence DRAB actually corresponds to DRB1 molecules
We then looked at the classification of HLA proteins as strongest and weakest binders for each virus. In order to make the data comparable among viruses that do not display the same proteome lengths, we took a minimal threshold of 1% of peptides bound with high affinity (instead of an absolute value of 100 used before for the SARS‐CoV‐2 analyses) to classify HLA molecules as strongest binders. The criterion to define weakest binders remained the same as was used for the SARS‐CoV‐2 analysis (ie, weak or non‐binder for more than 99% of viral peptides).
Among the total set of 65 HLA molecules predicted to be strongest binders for at least one virus, 16 were found to be strongest binders for all viruses (A*02:02, A*02:03, A*02:06, A*02:11, A*02:12, A*02:22, A*31:04, B*15:03, B*15:17, DRB1*01:01, DRB1*01:04, DRB1*10:01, DRB1*11:02, DRB1*13:01, DRB1*13:04, DRB1*13:22), nine only for respiratory viruses, that is, all viruses except HIV‐1 (A*68:01, A*68:12, B*15:25, B*15:39, B*35:10, C*03:02, DRB1*07:01, DRB1*11:14, DRB1*13:02), 15 only for coronaviruses (A*02:01, A*02:05, A*02:09, A*02:14, A*02:24, A*02:26, A*02:34, A*02:35, A*02:40, A*24:03, A*24:10, A*24:23, A*68:02, C*14:02, C*14:03), only one for influenza viruses (A*30:01) and the remaining 24 for other combinations (Table S4). Also, among the 187 HLA molecules found to be the weakest binders for at least one virus, 121 were the weakest binders for all viruses, 25 only for HIV‐1 and the remaining 41 for other combinations.
The majority of HLA proteins are thus not specific binders of SARS‐CoV‐2 or even coronavirus peptides but are generalist binders for viral pathogens of different families. We did not identify any strongest binder for HIV‐1 alone at this threshold. In addition, a significant number (25) of the weakest binders are HIV‐1‐specific, although the majority (121) is weakest for all viruses (Table S4).
4.6. Effects of the kind of binding, the HLA locus and the variety of virus on the proportions of bound peptides
Finally, we tested simultaneously the effects of several parameters, that is, kind of binding (strong, regular, weak, non‐binding), HLA locus (HLA‐A, ‐B, ‐C, ‐DR) and virus (SARS‐CoV‐2, SARS‐CoV‐1, MERS‐CoV, H1N1, H3N2, H7N9, HIV‐1) on the proportions of bound peptides by setting up a statistical model (see Materials and Methods).
We tried many simplifications (either automatic, via stepwise regression, or handmade) of the complete maximal model (ie, the model including all variables and their interactions) by grouping together some viruses or kinds of binding, but the resulting models were significantly worse. As our initial model presented heteroscedasticity, we restarted the modelling using a non‐parametric approach by replacing the proportion of bound peptides with their ranks. The model could not be simplified without significant loss. In addition, to further assess the model and reduce the effects of outliers, we used robust regression and again the maximal complete model could not be simplified, with the relative magnitudes of almost all the coefficients remaining the same. We thus concluded that the structure presented by the data was relevant as the retained model explained 90% of the total variance.
According to the retained model, both the kind of binding and the HLA locus and their interactions are highly significant (Table 6). This contrasts with a weak effect due to the virus (null for coronaviruses and with moderate ranks and significances for influenza viruses), except for HIV‐1, which shows much higher ranks as well as strong and highly significant interactions with all kinds of bindings.
TABLE 6.
Retained model for peptide‐binding proportion
| Dependent variable | |
|---|---|
| Terms | Rank (value) |
| Kind.Strong | −1813.988*** (93.579) |
| Kind.Weak | 1929.162*** (93.579) |
| Kind.NonBinder | 6177.37*** (93.579) |
| LocusB | −953.978*** (55.024) |
| LocusC | −609.803*** (72) |
| LocusDQ | 826.365*** (84.912) |
| LocusDR | 3302.612*** (61.951) |
| Virus.cov1 | −9.609 (75.479) |
| Virus.mers | 17.622 (75.436) |
| Virus.h1n1 | −141.812* (75.436) |
| Virus.h3n2 | −235.549*** (75.436) |
| Virus.h7n9 | −193.273** (75.436) |
| Virus.hiv | −654.673*** (75.436) |
| Kind.Strong:LocusB | −36.94 (77.816) |
| Kind.Weak:LocusB | 519.922*** (77.816) |
| Kind.NonBinder:LocusB | 1270.303*** (77.816) |
| Kind.Strong:LocusC | −458.426*** (101.823) |
| Kind.Weak:LocusC | 564.693*** (101.823) |
| Kind.NonBinder:LocusC | 590.722*** (101.823) |
| Kind.Strong:LocusDQ | −3019.89*** (120.084) |
| Kind.Weak:LocusDQ | 1420.448*** (120.084) |
| Kind.NonBinder:LocusDQ | −2089.007*** (120.084) |
| Kind.Strong:LocusDR | −4068.383*** (87.611) |
| Kind.Weak:LocusDR | −826.425*** (87.611) |
| Kind.NonBinder:LocusDR | −5163.576*** (87.611) |
| Kind.Strong:Virus.cov1 | −27.935 (106.744) |
| Kind.Weak:Virus.cov1 | −13.4 (106.744) |
| Kind.NonBinder:Virus.cov1 | 29.968 (106.744) |
| Kind.Strong:Virus.mers | −46.915 (106.683) |
| Kind.Weak:Virus.mers | 50.838 (106.683) |
| Kind.NonBinder:Virus.mers | −72.158 (106.683) |
| Kind.Strong:Virus.h1n1 | 69.534 (106.683) |
| Kind.Weak:Virus.h1n1 | −39.497 (106.683) |
| Kind.NonBinder:Virus.h1n1 | 261.228** (106.683) |
| Kind.Strong:Virus.h3n2 | 86.513 (106.683) |
| Kind.Weak:Virus.h3n2 | 26.338(106.683) |
| Kind.NonBinder:Virus.h3n2 | 390.448*** (106.683) |
| Kind.Strong:Virus.h7n9 | 79.336 (106.683) |
| Kind.Weak:Virus.h7n9 | −15.716 (106.683) |
| Kind.NonBinder:Virus.h7n9 | 342.746*** (106.683) |
| Kind.Strong:Virus.hiv | 289.56*** (106.683) |
| Kind.Weak:Virus.hiv | 281.013*** (106.683) |
| Kind.NonBinder:Virus.hiv | 1027.091*** (106.683) |
| Constant | 4734.063*** (66.171) |
| Observations | |
| R2 | 0.901 |
| Adjusted R2 | 0.901 |
| Residual Std. Error | 1117.625 (df = 12244) |
| F Statistic 12 288 | 2592.272*** (df = 43; 12 244) |
Note: The dependent variable is the rank of the proportion of bound peptides. The left column (terms) lists all the independent variables and their interactions. For the retained model, the first column displays the coefficients of the model, that is, the differences in average ranks between the group defined by each term and the reference (Locus: A; Virus: cov2; Kind: regular, grouped on the constant term); the second column shows asterisks indicating the significance level of a test for the coefficient being zero (no effect); and the third column presents in parentheses the values of the standard errors associated with the coefficients.
P < .1;
P < .05;
P < .01.
5. DISCUSSION
In this study, we considered a total set of 438 Class I and Class II proteins differing from each other by the amino acid sequence of their PBR. We have identified which HLA molecules are predicted to bind all possible 9‐mer (for Class I) and 13‐mer (for Class II) peptides (> 7000) derived from the complete SARS‐CoV‐2 proteome, and we have classified them according to the proportions of peptides that they are expected to bind with different kinds of affinity (IC50), i.e. strong, regular, weak or non‐binding. We have also explored the global distributions of the strongest and weakest HLA binders by using a large dataset of HLA frequencies estimated in 158‐374 populations (depending on the locus) from 10 geographic regions worldwide and by using statistical modelling to detect possible patterns. We then complemented these analyses by using the complete proteomes of six additional viruses, two of them belonging to the same coronavirus family (SARS‐CoV‐1 and MERS‐CoV), three of them being involved in another, very common, respiratory disease, that is, flu (H1N1, H3N2 and H7N9), and the last one being the main causal pathogen of AIDS (HIV‐1). We have finally compared the results obtained for the seven viruses to identify possible similarities or differences in the ability of HLA Class I and Class II proteins to present their derived peptides, and in the worldwide distribution of their strongest and weakest binders. To our knowledge, this is the first study providing a comprehensive analysis of HLA peptide‐binding predictions for such a large set of highly infectious and (potentially) pandemic viruses in relation to such an extensive database of HLA‐typed population samples. We are also fully confident that our results differ from what we would expect by chance, as they were fully replicated by using two independent algorithms to run the predictions (as mentioned in Material & Methods) and by running independent analyses on multiple viruses for which we found similar results within each viral family.
5.1. Binding affinities of HLA proteins to SARS‐CoV‐2 and comparison to other viruses
Our first observation is that HLA molecules, independent of the locus, are predicted to bind a limited proportion of all possible SARS‐CoV‐2 derived peptides with high affinity (on average 0.01% for HLA‐DQ to 0.7% for HLA‐A). The large majority of them (on average > 90%) do not bind Class I molecules, whereas more even proportions of regular (6.1%‐21.3%), weak (38.1%‐40.1%) and non‐binders (38.1‐55.7%) are found among Class II proteins. Of course, we do not know, in reality, how many viral peptides may trigger an immune response among the total set of theoretical ones that we have derived in silico from the SARS‐CoV‐2 proteome (and further on from that of the other viruses). Nevertheless, we can confidently expect a lower number and the proportions that we have found may thus actually be much higher. Also, because we chose a very low IC50 (≤50) and thus a very high affinity threshold to characterise peptide bindings as strong, we expect that peptide presentations by the HLA molecules that we have classified as strongest binders (IC50 ≤ 50 for many peptides) are able to trigger efficient CD8+ and/or CD4+ immune responses. In support to our hypothesis, bioinformatic predictions combined to in vitro experimental testing and in vivo immunogenicity testing in HLA transgenic mice showed that Class I alleles displaying a higher number of predicted binders with higher‐binding affinities are associated with higher magnitude of T‐cell responses. 37 Peptide‐binding predictions for HLA Class II molecules are also highly relevant to explore potential responses to viral infections such as SARS‐CoV‐2, not only in view of the crucial role of CD4+ T‐helper cells in CD8+ T cell differentiations and in the production of neutralising antibodies, but also because of increasing evidence that CD4+ cytotoxic T lymphocytes may act in concert with CD8+ CTLs during viral infections thanks to a dual recognition of peptides through HLA Class I and II. 38 We thus believe that the inclusion, in our study, of both Class I and Class II peptide‐binding predictions brings crucial information for the development of peptide‐based vaccines, 12 although immunogenicity would need to be validated experimentally. 17 , 18
Interestingly, different proportions of HLA strongest binders were seen among the loci that we analysed (up to 18.5% of HLA‐A but only 6.4% of HLA‐DRB1, 3% of HLA‐B and no HLA‐C nor HLA‐DQ molecules), and other differences were found for regular and weak binders. The contrasts observed among the HLA loci may be related, at least in part, to the diverse functions that their proteins assume for immunity. First, the greater proportion of HLA Class I strongest binders may be explained by the more decisive role of these molecules in viral infections although, as stated above, Class II molecules are also essential in particular to the development of sustained, long‐term humoral responses that may play a vital role in terms of vaccination and herd immunity. In addition, the major difference observed among the three Class I loci is in line with both the greater promiscuity of HLA‐A proteins in peptide binding 39 (see also below), which explains why more HLA‐A proteins present large numbers of peptides than HLA‐B, and the greater involvement of HLA‐C in KIR interactions, 40 which suggests that the peptide‐binding function of HLA‐C molecules could be less efficient compared with that of HLA‐A and HLA‐B 41 or fine‐tuned differently to also accommodate peptide selectivity by KIR molecules on NK cells. 42 The strength of the immune function is also influenced by the expression levels of HLA molecules 43 —which is affected by many factors 44 —and may explain why HLA‐C molecules, the abundance of which are highly variable at the cell surface, 45 here exhibited worse peptide‐binding affinities.
Besides these locus‐specific effects, a relevant observation of our study is that the HLA‐binding patterns that we predicted for SARS‐CoV‐2 peptides are not unique to this virus. Indeed, we found almost identical peptide‐binding patterns (Figure 3) and many common HLA strongest binders (Table S4) for the other two coronaviruses SARS‐CoV‐1 and MERS‐CoV, which could be explained by their (relatively) high level of genome‐wide sequence identity (about 79% and 50%, respectively 46 ) with SARS‐CoV‐2. The three influenza viruses H1N1, H3N2 and H7N9 behave somewhat differently, showing slightly lower percentages of strong or regular bindings to HLA and by sharing fewer strongest binders (although still a substantial number). Our statistical model also revealed that, overall, the variety of respiratory virus (ie, coronaviruses or influenza) has little effect on the HLA peptide‐binding patterns (according to Table 6, no statistical significance is ever observed for coronaviruses, and heterogeneous significances for influenza viruses).
By contrast, the patterns observed for HIV‐1 reveal that a lesser proportion of peptides derived from this non‐respiratory virus binds HLA molecules with either strong or regular affinity (the difference being particularly pronounced for regular bindings), which is highly significant according to our statistical model (Table 6). Also, although 16 HLA proteins are found to be strongest binders for all viruses including HIV‐1 (Table S4), this virus stands out by showing the greatest proportion of weakest binders (of 187 weakest binders, 154 are shared with others viruses and 25 are unique to HIV‐1). Overall, these results suggest that adaptive immune responses driven by HLA are less efficient towards HIV‐1 than towards respiratory viruses. In the same way, HLA proteins that are usually considered as conferring protection against HIV‐1, that is, B*57:01, B*57:02, B*57:03, B*58:01, B*27:05 and B*27:02, 47 bind between 0 (B*27:02) and 16 (B*58:01) HIV‐1 derived peptides (ie, 0%‐0.6%) with high affinity, which is quite low compared with 48 peptides (1.7%) presented by the strongest HLA binder found for HIV‐1, B*15:03 (which is actually the strongest HLA‐B binder for all viruses). On the other hand, our definition of strongest binders relies on two different estimates considered simultaneously, that is, a strong affinity (IC50 ≤ 50) and a large number of peptides bound, which prevents us from identifying more specialist alleles that would bind very few but key viral peptides with strong affinity, as might be the case for some of the alleles listed above. Moreover, another limitation of our study is that we may have missed some strong or regular HLA binders of peptides having different lengths than those that we used for our predictions. Indeed, while most HLA Class I ligands are 9‐mer peptides, their lengths typically vary between 8 and 12 amino acids in relation to different HLA allele clusters (eg, A*01:01 and A*03:01 often present longer peptides), 48 and slightly shorter or longer peptides may sometimes display better affinities. This is the case for the 11‐mer KAFSPEVIPMF epitope derived from the p24 capsid Gag HIV‐1 protein (“KF11” p24 Gag 162‐172), 49 which binds HLA‐B*57 molecules with much better stability than shorter peptides 50 (see also Table 7). The putative protective effect of HLA‐B proteins to HIV‐1 could thus be attributed to a very specific affinity to a few conserved peptides (likely of different lengths than those that we tested), rather than a large affinity to many diverse regions of the viral proteome. This is supported by the idea that many (but not all) HLA‐B proteins would be more fastidious (ie, specific) whereas many (but not all) HLA‐A would be more promiscuous (ie, generalist) at presenting pathogenic peptides. 39 This agrees with our result that HLA‐A (mostly A*02, which can be considered as highly generalist) molecules form a majority representation among the HLA Class I strongest binders shared by the seven viruses that we have analysed.
TABLE 7.
Binding affinities of HLA‐B*57:01 for different lengths of Gag‐derived peptide
| Allele | # | Start | End | Length | Peptide | Core | Icore | IC50 | Percentile rank |
|---|---|---|---|---|---|---|---|---|---|
| HLA‐B*57:01 | 1 | 1 | 11 | 11 | KAFSPEVIPMF | KAFSVIPMF | KAFSPEVIPMF | 145.5 | 0.26 |
| HLA‐B*57:01 | 1 | 1 | 10 | 10 | KAFSPEVIPM | KAFSPEVIM | KAFSPEVIPM | 591.6 | 0.77 |
| HLA‐B*57:01 | 1 | 1 | 8 | 8 | KAFSPEVI | KAFSP‐EVI | KAFSPEVI | 3307.6 | 3 |
| HLA‐B*57:01 | 1 | 3 | 11 | 9 | FSPEVIPMF | FSPEVIPMF | FSPEVIPMF | 3846.1 | 3.4 |
| HLA‐B*57:01 | 1 | 1 | 9 | 9 | KAFSPEVIP | KAFSPEVIP | KAFSPEVIP | 5220.4 | 4.5 |
| HLA‐B*57:01 | 1 | 2 | 11 | 10 | AFSPEVIMF | ASPEVIPMF | AFSPEVIPMF | 6502.4 | 5.6 |
| HLA‐B*57:01 | 1 | 3 | 10 | 8 | FSPEVIPM | FS‐PEVIPM | FSPEVIPM | 22 769.8 | 28 |
| HLA‐B*57:01 | 1 | 4 | 11 | 8 | SPEVIPMF | ‐SPEVIPMF | SPEVIPMF | 28 204.3 | 39 |
| HLA‐B*57:01 | 1 | 2 | 10 | 9 | AFSPEVIPM | AFSPEVIPM | AFSPEVIPM | 30 593.4 | 46 |
| HLA‐B*57:01 | 1 | 2 | 9 | 8 | AFSPEVIP | ‐AFSPEVIP | AFSPEVIP | 39 962.7 | 79 |
Note: NetMHCPan v. 4.0 output shows the IC50 affinity scores for the immunodominant HIV‐1 Gag‐derived peptide KAFSPEVIPMF and all possible 8, 9 and 10‐mer derived from this peptide. B*57:01 is a regular binder (50 nM < IC50 ≤ 500 nM) of the 11‐mer epitope and a bad (500 nM < IC50 ≤ 5000 nM) or non binder (IC50 > 5000 nM) for all other epitopes.
As a consequence of the promiscuous peptide‐binding behaviour of many HLA proteins that we disclose in the present study, some alleles that have been claimed as strongest and weakest binders of SARS‐CoV‐2 so far 51 are not unique to this virus. This is the case, for example, for HLA‐B*15:03 and B*46:01 (the latter having previously been considered to confer susceptibility to SARS‐CoV‐1 disease by comparing severe cases to controls, 52 as recently reviewed 53 ), which are in our top list of strongest and weakest binders, respectively, for SARS‐CoV‐2 (in agreement with Reference 51 ), but also for the other six viruses that we have analysed. Therefore, we propose that these alleles do not confer specific protection or vulnerability to SARS, as recently suggested, 51 but more widely to different diseases. However, it is important to stress that weakest binders defined by the current work might still act as regular or strongest binders in the context of infections by other viruses not tested in this study or by other kinds of pathogens (ie, bacteria, fungi or parasites). Furthermore, weakest binders could also play a crucial role by providing more specific but significant advantages to their carriers against new virulent strains appearing in a population.
5.2. Global distribution of strongest and weakest HLA SARS‐CoV‐2 peptide binders in human populations
Two unexpected results also emerged from our study regarding the global distribution of strongest and weakest HLA binders to SARS‐CoV‐2 peptides in human populations. The first one is the opposite pattern observed for the two loci HLA‐A and ‐B. Indeed, the cumulative frequency of strongest binders is higher for HLA‐A and lower for HLA‐B in most regions of the world, while the reverse is observed for weakest binders (Figure 2). The fact that HLA‐B is more polymorphic than HLA‐A 4 (164 HLA‐B and 92 HLA‐A alleles defined at the second field level of resolution were considered in this study) probably explains why the cumulative frequencies of weakest binders are much greater for HLA‐B. However, this explanation does not hold for strong binders. Actually, the high cumulative frequencies of HLA‐A strongest binders are principally due (but not only, see below) to HLA‐A*02:01, an allele which is frequent almost everywhere in the world, whereas most of the strongest HLA‐B binders are rare.
The second, and probably the most remarkable result, is the dual observation of particularly high and low cumulative frequencies of, respectively, strongest and weakest HLA binders in Indigenous populations from North and South America. These two independent patterns were highly significant (Table 5) and not observed in any other geographic region (Figure 2, see loci A + B combined). Among the strongest binders, A*02:01 is common in most regions of the world but reaches especially high frequencies (sometimes up to 50%) in Indigenous Americans and is classified as strongest binder for the three coronaviruses analysed in this study (Table S4); A*02:06, the strongest binder for all seven viruses, is rare globally, slightly more common in North‐East Asia and sometimes very frequent in America where it reaches 20%‐30% in some Mexican populations; A*68:01 is rarely above 5% globally but reaches frequencies of about 15%‐20% in Indigenous populations from North America (Mixtec and Seri), and is strongest binder for all viruses except HIV‐1; A*02:22, also strongest binder for all viruses, is virtually absent or very rare in the world except in some Indigenous populations from Venezuela (Bari, 6.5%) and Brazil (Terena, 15%); A*24:03, strongest binder for all coronaviruses, is another rare allele that is observed at 10% to 11% frequency in Brazil and Argentina. Other strongest binders are also found in other regions (eg, A*02:03, reaching 17% and B*15:25, reaching 15%—40% in Yami—in South‐East Asia; A*02:11, reaching 9%‐16% in India; or B*15:03, reaching 11% in sub‐Saharan Africa) but the cumulative frequencies of strongest binders in these populations (except Yami) are always lower than in Indigenous Americans.
We reported many strongest HLA binders that are at high frequencies in multiple Indigenous American populations that are not necessarily close geographically nor related to each other. This is in contrast to other regions of the world where populations underwent similar strong bottlenecks and/or rapid genetic drift, such as in Taiwan, Australia and Oceania. Therefore, the patterns observed in the Americas might be insufficiently explained by demography alone. Remarkably, weakest HLA binders are also less frequent in Indigenous Americans (as opposed to other populations where frequencies for both strongest and weakest binders overlap), which again represents an independent result that might not be easily explained by demography. Instead, it seems plausible that strongest binders were positively selected (eg, through soft selective sweep) from the standing genetic variation, 21 , 54 , 55 , 56 by conferring protective effects against some (undefined) pathogens, although the formal testing necessary to confirm our hypothesis is beyond the scope of this study. A possible explanation is the European colonisation of the Americas five centuries ago, as it introduced new infectious diseases (eg, smallpox 57 ), which many historical records claim to have been a key factor in the decimation of Indigenous American populations. Here, as the great majority of strongest HLA binders that we have identified are not specific to a given virus among the seven that we have compared (many of them are even strongest binders for all these viruses, including HIV‐1), the frequency patterns that we observe today in Indigenous Americans might be the result of selective pressures increasing the frequencies of promiscuous strong HLA binders (such as HLA‐A*02:01) and decreasing the frequencies of weak HLA binders already present in these populations. We note that the HLA region harbours the highest levels of advantageous genetic diversity maintained by balancing selection and/or recombination events for, potentially, millions of years. 58 , 59 , 60 , 61 , 62 Previous studies already suggested that high frequency HLA alleles could have been positively selected in first American populations because they would have conferred some selective advantage. 63 , 64 Interestingly, recent HLA sequencing of 50 exomes of a continuous population from North‐West America dating from before and after European contact (ancient DNA) identified a strong signal of negative selection at the HLA‐DQA1 gene, 65 which shows that potential selective pressures on HLA genes may also be traced by other approaches.
By contrast, strongest HLA‐DRB1 binders appear to be more frequent in Africa, Europe, South‐West Asia and North‐East Asia than in South‐East Asia, Oceania, Australia and North and South America (Figure 2). Some of these alleles, for example, DRB1*13:01 and DRB1*13:02, are frequent in all the regions where they are observed, while others are less evenly distributed, for example, DRB1*01:01 in Europe and Asia, DRB1*11:02 in Africa and Europe and DRB1*13:04 in West Africa. 66 , 67 These results might indicate that, in addition to HLA‐A, promiscuous HLA‐DRB1 molecules may have been selected for by playing a protective role to endemic (eg, parasitic) diseases in populations from diverse geographic regions, as proposed for HLA‐DRB1*12:02 in China. 68 Selection would have been most likely to occur if such populations were submitted to high pathogen diversity, as has been recently suggested. 20 Finally, sub‐Saharan Africans display higher proportions of weakest HLA‐DRB1 binders, which might be protective to other diseases (ie, strongest binders for another pathogen) or simply evolve neutrally or under the influence of different selective pressures. This fits with the known versatile evolution of HLA genes that are submitted to different kinds of selection. 21 , 69 , 70 The evolutionary history of the HLA region is probably particularly complicated in Africa given a potentially higher burden of infectious diseases.
Importantly, our study provides a different conclusion to that recently drawn by Nguyen et al., 51 who stated that there is no correlation between HLA allele frequencies in populations and allele ability to bind SARS‐CoV peptides. As SARS‐CoV viruses appeared extremely recently, 71 , 72 it seems clear that natural selection did not have enough time to induce allele frequency changes in populations, as potentially many generations are necessary to substantially change allele frequencies over time, depending on the selection coefficient and the population size. A more reasonable explanation for the associations that we do observe in the present study is that most of the strong HLA binders of coronavirus peptides are also strong binders of other pathogens, and hence are likely to be generalist (or promiscuous) strong binders that probably underwent selection in the past.
6. CONCLUSION
Thanks to an extensive analysis of peptide‐binding predictions across multiple HLA genes, multiple infectious pathogens and multiple populations worldwide, the present study makes it possible to consider both HLA population variation and HLA evolution in a different light. First, the observed peptide‐binding patterns are compatible with current knowledge on HLA protein function and diversity, which differ among the loci. Our results also underline the promiscuous behaviour of HLA proteins (especially HLA‐A), which are able to bind peptides of various pathogens, even from distinct families, with high affinities. Finally, the global frequency distribution of HLA alleles coding for the strongest and weakest peptide binders predicted by our analyses indicates potential signatures of selective events occurring throughout humans history, although future studies are needed to confirm this hypothesis. It is important to note, however, that the characterisation of HLA proteins as strongest and weakest binders of pathogen‐derived peptides, as presented in this study, relies on computer‐based binding affinity predictions with no experimental validation nor immunogenicity testing. Our results should thus be taken with care until combined bioinformatic (also needing improved predictive algorithms) and experimental approaches can be performed. 14 , 53 , 73 Moreover, although some protective or susceptibility markers to infectious diseases may be observed at varying frequencies across populations from different geographic regions of the world, the resistance and vulnerability of individuals to such diseases are multifactorial phenomena that cannot be determined by single genetic markers as they strongly depend on multiple, complex and often unknown biological (in a broad sense), environmental and other factors. This is important to remember in the context of global coronavirus outbreaks where all people may be highly vulnerable. However, this study demonstrates that knowledge on (or at least estimation of) individual epitope binding can be embedded into a population context to provide powerful clues about population and individual susceptibilities to human viral infections, at least as a crucial informed first step towards formulating working hypotheses that can be tested epidemiologically or experimentally.
CONFLICT OF INTEREST
The authors have declared no conflicting interests.
Supporting information
Data S1. Supporting Information.
Data S2. Supporting Information.
Data S3. Supporting Information.
Data S4. Supporting Information.
Data S5. Supporting Information.
Data S6. Supporting Information.
Data S7. Supporting Information.
Table S1. Number of population samples tested for HLA per locus and geographic region.
Table S2. Detailed list of population samples used in this study.
Table S3. List of alleles used in this study.
Table S4. List of strongest (>1% bound peptides at IC50 ≤ 50 nM) and weakest (>99% bound peptides at IC ≥500 nM for Class I and IC50 ≥ 1000 nM for Class II) HLA binders for all viruses.
ACKNOWLEDGMENTS
This work was supported by the Swiss National Foundation for Scientific Research (grants #31003A_144180 and #310030_188820) and the EU‐funded COST Action HLA‐NET (BM0803) to ASM. RB is supported by the Max Planck Society. EC is supported by the Australian Government Research Training Program Stipend (RTPS). JT is supported by an Australian Research Council (ARC) Discovery Indigenous Project (IN180100017). BL is supported by an ARC Future Fellowship (FT170100448). We also thank David Roessli for his technical help, and we are most grateful to two anonymous reviewers for their useful and constructive comments on a previous version of this manuscript.
Barquera R, Collen E, Di D, et al. Binding affinities of 438 HLA proteins to complete proteomes of seven pandemic viruses and distributions of strongest and weakest HLA peptide binders in populations worldwide. HLA. 2020;96:277–298. 10.1111/tan.13956
Funding information Australian Government Research Training Program Stipend (RTPS); Australian Research Council Discovery Indigenous Project, Grant/Award Number: IN180100017; Australian Research Council Future Fellowship, Grant/Award Number: FT170100448; European Cooperation in Science and Technology, Grant/Award Number: BM0803; Max‐Planck‐Gesellschaft; Schweizerischer Nationalfonds zur Förderung der Wissenschaftlichen Forschung, Grant/Award Numbers: 310030_188820, 31003A_144180
Contributor Information
José M. Nunes, Email: jose.deabreununes@unige.ch.
Alicia Sanchez‐Mazas, Email: alicia.sanchez-mazas@unige.ch.
DATA AVAILABILITY STATEMENT
The data that support the findings of this study are available in the Supplementary Materials and from the corresponding authors upon request.
REFERENCES
- 1. Parham P. The Immune System. W. W. Norton & Company. https://wwnorton.com/books/The-Immune-System. Accessed May 11, 2020.
- 2. Mehra NK. The HLA Complex in Biology and Medicine: A Resource Book. New Dehli: Jaypee Brothers Medical Publishers (P) Ltd; 2010. [Google Scholar]
- 3. Klein J, Sato A. The HLA system. First of two parts. N Engl J Med. 2000;343(10):702‐709. 10.1056/NEJM200009073431006. [DOI] [PubMed] [Google Scholar]
- 4. Robinson J, Barker DJ, Georgiou X, Cooper MA, Flicek P, Marsh SGE. IPD‐IMGT/HLA Database. Nucleic Acids Res. 2020;48(D1):D948‐D955. 10.1093/nar/gkz950. [DOI] [PMC free article] [PubMed] [Google Scholar]
- 5. Shiina T, Hosomichi K, Inoko H, Kulski JK. The HLA genomic loci map: expression, interaction, diversity and disease. J Hum Genet. 2009;54(1):15‐39. 10.1038/jhg.2008.5. [DOI] [PubMed] [Google Scholar]
- 6. Key FM, Teixeira JC, de Filippo C, Andrés AM. Advantageous diversity maintained by balancing selection in humans. Curr Opin Genet Dev. 2014;29:45‐51. 10.1016/j.gde.2014.08.001. [DOI] [PubMed] [Google Scholar]
- 7. Klein J, Satta Y, O'hUigin C, Takahata N. The molecular descent of the major histocompatibility complex. Annu Rev Immunol. 1993;11:269‐295. 10.1146/annurev.iy.11.040193.001413. [DOI] [PubMed] [Google Scholar]
- 8. Solberg OD, Mack SJ, Lancaster AK, et al. Balancing selection and heterogeneity across the classical human leukocyte antigen loci: a meta‐analytic review of 497 population studies. Hum Immunol. 2008;69(7):443‐464. 10.1016/j.humimm.2008.05.001. [DOI] [PMC free article] [PubMed] [Google Scholar]
- 9. Buhler S, Sanchez‐Mazas A. HLA DNA sequence variation among human populations: molecular signatures of demographic and selective events. PLoS One. 2011;6(2):e14643. 10.1371/journal.pone.0014643. [DOI] [PMC free article] [PubMed] [Google Scholar]
- 10. Dos Santos Francisco R, Buhler S, Nunes JM, et al. HLA supertype variation across populations: new insights into the role of natural selection in the evolution of HLA‐A and HLA‐B polymorphisms. Immunogenetics. 2015;67(11–12):651‐663. 10.1007/s00251-015-0875-9. [DOI] [PMC free article] [PubMed] [Google Scholar]
- 11. Sette A, Sidney J. Nine major HLA class I supertypes account for the vast preponderance of HLA‐A and ‐B polymorphism. Immunogenetics. 1999;50(3):201‐212. 10.1007/s002510050594. [DOI] [PubMed] [Google Scholar]
- 12. Wang M, Claesson MH. Classification of human leukocyte antigen (HLA) supertypes. In: De RK, Tomar N, eds. Immunoinformatics. Methods in Molecular Biology (Methods and Protocols), vol. 1184. New York: Humana Press; 2014:309‐317. 10.1007/978-1-4939-1115-8_17. [DOI] [PMC free article] [PubMed] [Google Scholar]
- 13. Takeshita LYC, Jones AR, Gonzalez‐Galarza FF, Middleton D. Allele frequencies database. Transfus Med Hemother. 2014;41(5):355‐352. 10.1159/000368056. [DOI] [PMC free article] [PubMed] [Google Scholar]
- 14. Gfeller D, Bassani‐Sternberg M. Predicting antigen presentation—what could we learn from a million peptides? Front Immunol. 2018;9:1716. 10.3389/fimmu.2018.01716. [DOI] [PMC free article] [PubMed] [Google Scholar]
- 15. Abdulla F, Adhikari UK, Uddin MK. Exploring T & B‐cell epitopes and designing multi‐epitope subunit vaccine targeting integration step of HIV‐1 lifecycle using immunoinformatics approach. Microb Pathog. 2019;137:103791. 10.1016/j.micpath.2019.103791. [DOI] [PubMed] [Google Scholar]
- 16. Jain S, Baranwal M. Conserved peptide vaccine candidates containing multiple Ebola nucleoprotein epitopes display interactions with diverse HLA molecules. Med Microbiol Immunol (Berl). 2019;208(2):227‐238. 10.1007/s00430-019-00584-y. [DOI] [PubMed] [Google Scholar]
- 17. Hyun‐Jung Lee C, Koohy H. In silico identification of vaccine targets for 2019‐nCoV. F1000Research. 2020;9:145. 10.12688/f1000research.22507.1. [DOI] [PMC free article] [PubMed] [Google Scholar]
- 18. Ahmed SF, Quadeer AA, McKay MR. Preliminary identification of potential vaccine targets for the COVID‐19 coronavirus (SARS‐CoV‐2) based on SARS‐CoV immunological studies. Viruses. 2020;12(3):254. 10.3390/v12030254. [DOI] [PMC free article] [PubMed] [Google Scholar]
- 19. Pierini F, Lenz TL. Divergent allele advantage at human MHC genes: signatures of past and ongoing selection. Mol Biol Evol. 2018;35(9):2145‐2158. 10.1093/molbev/msy116. [DOI] [PMC free article] [PubMed] [Google Scholar]
- 20. Manczinger M, Boross G, Kemény L, et al. Pathogen diversity drives the evolution of generalist MHC‐II alleles in human populations. PLoS Biol. 2019;17(1):e3000131. 10.1371/journal.pbio.3000131. [DOI] [PMC free article] [PubMed] [Google Scholar]
- 21. Sanchez‐Mazas A, Černý V, Di D, et al. The HLA‐B landscape of Africa: signatures of pathogen‐driven selection and molecular identification of candidate alleles to malaria protection. Mol Ecol. 2017;26(22):6238‐6252. 10.1111/mec.14366. [DOI] [PubMed] [Google Scholar]
- 22. Nunes JM, Buhler S, Roessli D, Sanchez‐Mazas A, HLA‐net 2013 collaboration . The HLA‐net GENE[RATE] pipeline for effective HLA data analysis and its application to 145 population samples from Europe and neighbouring areas. Tissue Antigens. 2014;83(5):307‐323. 10.1111/tan.12356. [DOI] [PubMed] [Google Scholar]
- 23. Jensen KK, Andreatta M, Marcatili P, et al. Improved methods for predicting peptide binding affinity to MHC class II molecules. Immunology. 2018;154(3):394‐406. 10.1111/imm.12889. [DOI] [PMC free article] [PubMed] [Google Scholar]
- 24.Summary of Influenza Risk Assessment Tool (IRAT) Results. Pandemic Influenza (Flu). CDC. 2019. https://www.cdc.gov/flu/pandemic-resources/monitoring/irat-virus-summaries.htm. Accessed May 4, 2020.
- 25. UniProt: a worldwide hub of protein knowledge. Nucleic Acids Res. 2019;47(D1):D506‐D515. 10.1093/nar/gky1049. [DOI] [PMC free article] [PubMed] [Google Scholar]
- 26. Wang P, Sidney J, Kim Y, et al. Peptide binding predictions for HLA DR, DP and DQ molecules. BMC Bioinformatics. 2010;11:568. 10.1186/1471-2105-11-568. [DOI] [PMC free article] [PubMed] [Google Scholar]
- 27. Moutaftsi M, Peters B, Pasquetto V, et al. A consensus epitope prediction approach identifies the breadth of murine T(CD8+)‐cell responses to vaccinia virus. Nat Biotechnol. 2006;24(7):817‐819. 10.1038/nbt1215. [DOI] [PubMed] [Google Scholar]
- 28. Jurtz V, Paul S, Andreatta M, Marcatili P, Peters B, Nielsen M. NetMHCpan‐4.0: improved peptide‐MHC class I interaction predictions integrating eluted ligand and peptide binding affinity data. J Immunol. 2017;199(9):3360‐3368. 10.4049/jimmunol.1700893. [DOI] [PMC free article] [PubMed] [Google Scholar]
- 29. Andreatta M, Nielsen M. Gapped sequence alignment using artificial neural networks: application to the MHC class I system. Bioinforma Oxf Engl. 2016;32(4):511‐517. 10.1093/bioinformatics/btv639. [DOI] [PMC free article] [PubMed] [Google Scholar]
- 30. Zhao W, Sher X. Systematically benchmarking peptide‐MHC binding predictors: from synthetic to naturally processed epitopes. PLoS Comput Biol. 2018;14(11):e1006457. 10.1371/journal.pcbi.1006457. [DOI] [PMC free article] [PubMed] [Google Scholar]
- 31. Pinheiro JC, Bates DM. Mixed‐Effects Models in S and S‐PLUS. New York: Springer‐Verlag; 2001. 10.1007/b98882. [DOI] [Google Scholar]
- 32. Venables WN, Ripley BD. Modern Applied Statistics with S‐Plus. 3rd ed. New York: Springer‐Verlag; 1999. [Google Scholar]
- 33. R Core Team . R: A Language and Environment for Statistical Computing. R Foundation for Statistical Computing; 2018. https://www.R-project.org
- 34. Riccio ME, Nunes JM, Rahal M, Kervaire B, Tiercy J‐M, Sanchez‐Mazas A. The Austroasiatic Munda population from India and its enigmatic origin: a HLA diversity study. Hum Biol. 2011;83(3):405‐435. 10.3378/027.083.0306. [DOI] [PubMed] [Google Scholar]
- 35. El‐Awar N, Jucaud V, Nguyen A. HLA epitopes: the targets of monoclonal and alloantibodies defined. J Immunol Res. 2017;2017:1‐16. 10.1155/2017/3406230. [DOI] [PMC free article] [PubMed] [Google Scholar]
- 36. Sanchez‐Mazas A, Vidan‐Jeras B, Nunes JM, et al. Strategies to work with HLA data in human populations for histocompatibility, clinical transplantation, epidemiology and population genetics: HLA‐NET methodological recommendations. Int J Immunogenet. 2012;39(6):459‐476. 10.1111/j.1744-313X.2012.01113.x. [DOI] [PMC free article] [PubMed] [Google Scholar]
- 37. Paul S, Weiskopf D, Angelo MA, Sidney J, Peters B, Sette A. HLA class I alleles are associated with peptide‐binding repertoires of different size, affinity, and immunogenicity. J Immunol. 2013;191(12):5831‐5839. 10.4049/jimmunol.1302101. [DOI] [PMC free article] [PubMed] [Google Scholar]
- 38. Muraro E, Merlo A, Martorelli D, et al. Fighting viral infections and virus‐driven tumors with cytotoxic CD4+ T cells. Front Immunol. 2017;8:197. 10.3389/fimmu.2017.00197. [DOI] [PMC free article] [PubMed] [Google Scholar]
- 39. Kaufman J. Generalists and specialists: a new view of how MHC class I molecules fight infectious pathogens. Trends Immunol. 2018;39(5):367‐379. 10.1016/j.it.2018.01.001. [DOI] [PMC free article] [PubMed] [Google Scholar]
- 40. Parham P. MHC class I molecules and KIRs in human history, health and survival. Nat Rev Immunol. 2005;5(3):201‐214. 10.1038/nri1570. [DOI] [PubMed] [Google Scholar]
- 41. Buhler S, Nunes JM, Sanchez‐Mazas A. HLA class I molecular variation and peptide‐binding properties suggest a model of joint divergent asymmetric selection. Immunogenetics. 2016;68(6–7):401‐416. 10.1007/s00251-016-0918-x. [DOI] [PMC free article] [PubMed] [Google Scholar]
- 42. Hilton HG, Parham P. Missing or altered self: human NK cell receptors that recognize HLA‐C. Immunogenetics. 2017;69(8–9):567‐579. 10.1007/s00251-017-1001-y. [DOI] [PMC free article] [PubMed] [Google Scholar]
- 43. Apps R, Qi Y, Carlson JM, et al. Influence of HLA‐C expression level on HIV control. Science. 2013;340(6128):87‐91. 10.1126/science.1232685. [DOI] [PMC free article] [PubMed] [Google Scholar]
- 44. Carey BS, Poulton KV, Poles A. Factors affecting HLA expression: a review. Int J Immunogenet. 2019;46(5):307‐320. 10.1111/iji.12443. [DOI] [PubMed] [Google Scholar]
- 45. Kaur G, Gras S, Mobbs JI, et al. Structural and regulatory diversity shape HLA‐C protein expression levels. Nat Commun. 2017;8:15924. 10.1038/ncomms15924. [DOI] [PMC free article] [PubMed] [Google Scholar]
- 46. Lu R, Zhao X, Li J, et al. Genomic characterisation and epidemiology of 2019 novel coronavirus: implications for virus origins and receptor binding. Lancet. 2020;395(10224):565‐574. 10.1016/S0140-6736(20)30251-8. [DOI] [PMC free article] [PubMed] [Google Scholar]
- 47. Sanchez‐Mazas A. A review of HLA allele and SNP associations with highly prevalent infectious diseases in human populations. Swiss Med Wkly. 1516;150:2020. 10.4414/smw.2020.20214. [DOI] [PubMed] [Google Scholar]
- 48. Gfeller D, Guillaume P, Michaux J, et al. The length distribution and multiple specificity of naturally presented HLA‐I ligands. J Immunol. 2018;201(12):3705‐3716. 10.4049/jimmunol.1800914. [DOI] [PubMed] [Google Scholar]
- 49. Goulder PJ, Bunce M, Krausa P, et al. Novel, cross‐restricted, conserved, and immunodominant cytotoxic T lymphocyte epitopes in slow progressors in HIV type 1 infection. AIDS Res Hum Retroviruses. 1996;12(18):1691‐1698. 10.1089/aid.1996.12.1691. [DOI] [PubMed] [Google Scholar]
- 50. Goulder PJ, Tang Y, Pelton SI, Walker BD. HLA‐B57‐restricted cytotoxic T‐lymphocyte activity in a single infected subject toward two optimal epitopes, one of which is entirely contained within the other. J Virol. 2000;74(11):5291‐5299. 10.1128/jvi.74.11.5291-5299.2000. [DOI] [PMC free article] [PubMed] [Google Scholar]
- 51. Nguyen A, David JK, Maden SK, et al. Human leukocyte antigen susceptibility map for SARS‐CoV‐2. J Virol. 2020. 10.1128/JVI.00510-20. [DOI] [PMC free article] [PubMed] [Google Scholar]
- 52. Lin M, Tseng H‐K, Trejaut JA, et al. Association of HLA class I with severe acute respiratory syndrome coronavirus infection. BMC Med Genet. 2003;4:9. 10.1186/1471-2350-4-9. [DOI] [PMC free article] [PubMed] [Google Scholar]
- 53. Sanchez‐Mazas A. HLA studies in the context of coronavirus outbreaks. Swiss Med Wkly. 1516;150:2020. 10.4414/smw.2020.20248. [DOI] [PubMed] [Google Scholar]
- 54. Hermisson J, Pennings PS. Soft sweeps: molecular population genetics of adaptation from standing genetic variation. Genetics. 2005;169(4):2335‐2352. 10.1534/genetics.104.036947. [DOI] [PMC free article] [PubMed] [Google Scholar]
- 55. Pritchard JK, Pickrell JK, Coop G. The genetics of human adaptation: hard sweeps, soft sweeps, and polygenic adaptation. Curr Biol CB. 2010;20(4):R208‐R215. 10.1016/j.cub.2009.11.055. [DOI] [PMC free article] [PubMed] [Google Scholar]
- 56. Novembre J, Han E. Human population structure and the adaptive response to pathogen‐induced selection pressures. Philos Trans R Soc Lond B Biol Sci. 2012;367(1590):878‐886. 10.1098/rstb.2011.0305. [DOI] [PMC free article] [PubMed] [Google Scholar]
- 57. Patterson KB, Runge T. Smallpox and the Native American. Am J Med Sci. 2002;323(4):216‐222. 10.1097/00000441-200204000-00009. [DOI] [PubMed] [Google Scholar]
- 58. de Groot NG, Heijmans CMC, Bontrop RE. AIDS in chimpanzees: the role of MHC genes. Immunogenetics. 2017;69(8–9):499‐509. 10.1007/s00251-017-1006-6. [DOI] [PubMed] [Google Scholar]
- 59. de Groot NG, Heijmans CMC, de Groot N, et al. Pinpointing a selective sweep to the chimpanzee MHC class I region by comparative genomics. Mol Ecol. 2008;17(8):2074‐2088. 10.1111/j.1365-294X.2008.03716.x. [DOI] [PubMed] [Google Scholar]
- 60. Leffler EM, Gao Z, Pfeifer S, et al. Multiple instances of ancient balancing selection shared between humans and chimpanzees. Science. 2013;339(6127):1578‐1582. 10.1126/science.1234070. [DOI] [PMC free article] [PubMed] [Google Scholar]
- 61. Otting N, de Groot NG, Bontrop RE. Limited MHC class II gene polymorphism in the West African chimpanzee is distributed maximally by haplotype diversity. Immunogenetics. 2019;71(1):13‐23. 10.1007/s00251-018-1080-4. [DOI] [PubMed] [Google Scholar]
- 62. Teixeira JC, de Filippo C, Weihmann A, et al. Long‐term balancing selection in LAD1 maintains a missense trans‐species polymorphism in humans, chimpanzees, and bonobos. Mol Biol Evol. 2015;32(5):1186‐1196. 10.1093/molbev/msv007. [DOI] [PubMed] [Google Scholar]
- 63. Vina MAF, Hollenbach JA, Lyke KE, et al. Tracking human migrations by the analysis of the distribution of HLA alleles, lineages and haplotypes in closed and open populations. Philos Trans R Soc Lond B Biol Sci. 2012;367(1590):820‐829. 10.1098/rstb.2011.0320. [DOI] [PMC free article] [PubMed] [Google Scholar]
- 64. Hollenbach JA, Thomson G, Cao K, et al. HLA diversity, differentiation, and haplotype evolution in Mesoamerican Natives. Hum Immunol. 2001;62(4):378‐390. 10.1016/S0198-8859(01)00212-9. [DOI] [PubMed] [Google Scholar]
- 65. Lindo J, Huerta‐Sánchez E, Nakagome S, et al. A time transect of exomes from a Native American population before and after European contact. Nat Commun. 2016;7(1):1‐11. 10.1038/ncomms13175. [DOI] [PMC free article] [PubMed] [Google Scholar]
- 66. Goeury T, Creary LE, Brunet L, et al. Deciphering the fine nucleotide diversity of full HLA class I and class II genes in a well‐documented population from sub‐Saharan Africa. HLA. 2018;91(1):36‐51. 10.1111/tan.13180. [DOI] [PMC free article] [PubMed] [Google Scholar]
- 67. Goeury T, Creary LE, Fernandez‐Vina MA, Tiercy J‐M, Nunes JM, Sanchez‐Mazas A. Mandenka from Senegal: next generation sequencing typings reveal very high frequencies of particular HLA class II alleles and haplotypes. HLA. 2018;91(2):148‐150. 10.1111/tan.13197. [DOI] [PubMed] [Google Scholar]
- 68. Sun H, Yang Z, Lin K, et al. The adaptive change of HLA‐DRB1 allele frequencies caused by natural selection in a Mongolian population that migrated to the south of China. PLoS One. 2015;10(7):e0134334. 10.1371/journal.pone.0134334. [DOI] [PMC free article] [PubMed] [Google Scholar]
- 69. Lenz TL, Spirin V, Jordan DM, Sunyaev SR. Excess of deleterious mutations around HLA genes reveals evolutionary cost of balancing selection. Mol Biol Evol. 2016;33(10):2555‐2564. 10.1093/molbev/msw127. [DOI] [PMC free article] [PubMed] [Google Scholar]
- 70. Spurgin LG, Richardson DS. How pathogens drive genetic diversity: MHC, mechanisms and misunderstandings. Proc R Soc Biol Sci Ser B. 2010;277(1684):979‐988. 10.1098/rspb.2009.2084. [DOI] [PMC free article] [PubMed] [Google Scholar]
- 71. Khan S, Siddique R, Shereen MA, et al. Emergence of a novel coronavirus, severe acute respiratory syndrome coronavirus 2: biology and therapeutic options. J Clin Microbiol. 2020;58(5):e00187‐20. 10.1128/JCM.00187-20. [DOI] [PMC free article] [PubMed] [Google Scholar]
- 72. May RM, McLean AR, Pattison J, Weiss RA, Holmes EC, Rambaut A. Viral evolution and the emergence of SARS coronavirus. Philos Trans R Soc Lond B Biol Sci. 2004;359(1447):1059‐1065. 10.1098/rstb.2004.1478. [DOI] [PMC free article] [PubMed] [Google Scholar]
- 73. Racle J, Michaux J, Rockinger GA, et al. Robust prediction of HLA class II epitopes by deep motif deconvolution of immunopeptidomes. Nat Biotechnol. 2019;37(11):1283‐1286. 10.1038/s41587-019-0289-6. [DOI] [PubMed] [Google Scholar]
Associated Data
This section collects any data citations, data availability statements, or supplementary materials included in this article.
Supplementary Materials
Data S1. Supporting Information.
Data S2. Supporting Information.
Data S3. Supporting Information.
Data S4. Supporting Information.
Data S5. Supporting Information.
Data S6. Supporting Information.
Data S7. Supporting Information.
Table S1. Number of population samples tested for HLA per locus and geographic region.
Table S2. Detailed list of population samples used in this study.
Table S3. List of alleles used in this study.
Table S4. List of strongest (>1% bound peptides at IC50 ≤ 50 nM) and weakest (>99% bound peptides at IC ≥500 nM for Class I and IC50 ≥ 1000 nM for Class II) HLA binders for all viruses.
Data Availability Statement
The data that support the findings of this study are available in the Supplementary Materials and from the corresponding authors upon request.