

Abstract
E-cigarette use is dramatically increasing, particularly with adolescents. While the chemical composition of e-liquids and e-vapor is well characterized, the particle size distribution and the human airways deposition patterns of e-cigarette particles are understudied and poorly understood despite their likely contribution to adverse health effects from e-cigarette usage. In this study, we examined the impacts of e-cigarette device power, e-liquid composition, and vaping topography on e-cigarette particle sizes and their deposition in human airways. In addition, we observed that particle measurement conditions (dilution ratio, temperature, and humidity) significantly affect measured e-cigarette particle sizes. E-cigarette power output significantly increased particle count median diameters (CMD) from 174 ± 13 (particles generated under 6.4 W) to 236 ± 14 nm (particles generated under 31.1 W). E-cigarette particles generated from propylene glycol-based e-liquids (CMD = 145 ± 8 nm and mass median diameter [MMD] = 3.06 ± 0.17 μm) were smaller than those generated from vegetable glycerin-based e-liquids (CMD = 182 ± 9 nm and MMD = 3.37 ± 0.21 μm). Puff volume also impacted vapor particle size: CMD and MMD were 154 ± 11 nm and 3.50 ± 0.27 μm, 163 ± 6 nm and 3.35 ± 0.24 μm, and 146 ± 12 nm and 2.95 ± 0.14 μm, respectively, for 35, 90, and 170 mL puffs. Estimated e-cigarette particle mass deposition fractions in tracheobronchial and bronchoalveolar regions were 0.504−0.541 and 0.073−0.306, respectively. Interestingly, e-cigarette particles are smaller than the particles generated from cigarette smoking but have similar human airway deposition patterns.
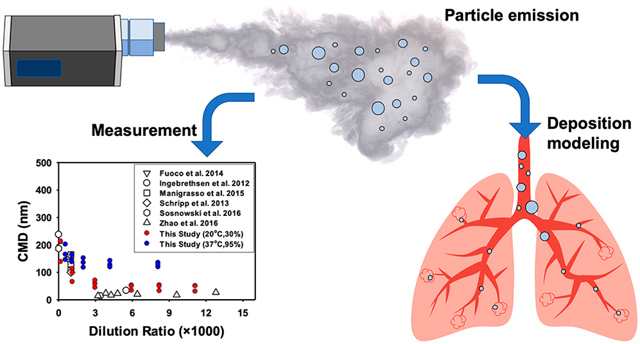
Graphical abstract
INTRODUCTION
Electronic cigarettes (e-cigarettes), i.e., battery-powered nicotine delivery systems, are believed to be substantially less harmful to human health than combusted tobacco cigarettes. The use of e-cigarettes has increased in the United States both in adult cigarette smokers and in tobacco naïve middle and high school students.1–3 However, the actual health risks of e-cigarette vaping are still not well understood, although a limited number of in vitro and in vivo rodent and human studies have suggested cardiopulmonary effects of e-cigarette vaping.4 The lack of knowledge of the physical and chemical properties of e-cigarette particles contributes to the insufficient understanding of mechanisms underlying the health impacts of e-cigarettes.5
Although studies have examined the chemical composition of e-liquids and aerosols created through vaping, little research has focused on e-cigarette particle size distributions. Data on the size and concentration of e-cigarette particles are needed to characterize the deposition of e-cigarette particles in the human respiratory system and subsequent health effects.6 E-cigarette particle deposition patterns are likely major determinants of the toxicity of e-cigarettes as most of the nicotine and toxic aldehydes are found in the particulate phase of e-cigarette aerosols.7
However, the characterization of e-cigarette particles is a challenge for many reasons. First, e-cigarettes are diverse products (including “cig-likes”, “vape pens”, “tanks”, “mods”, and “pods”) that are quickly and continually evolving as consumer-driven products, which are produced by numerous small vendors and by consumers.8 As a result, e-cigarettes vary greatly in terms of their heating power and e-liquids (e.g., flavorings, nicotine contents, and base material compositions). It is largely unknown how these factors influence the formation and the size distribution of e-cigarette particles.
Second, there is reason to believe that properties of e-cigarette particles may also be determined by the way e-cigarette users employ their devices. E-cigarette aerosols could be produced from a variety of e-liquids under various heating powers and through different vaping topographies.9–11 Preceding studies have generated and measured e-cigarette particles using a narrow range of heating power settings and under vaping topographies that are unlikely to be representative of actual vaping behaviors.10–12 Those studies employed lower puff volumes and shorter puff durations compared to the vaping conditions used by daily e-cigarette users. Further, it is not yet well understood how different e-liquid components affect e-cigarette particle sizes.13,14
The observed size of e-cigarette particles may also be highly affected by experimental measurement conditions, such as dilution, temperature, and humidity. Unlike traditional cigarette particles which are mainly solid particles, e-cigarette particles are primarily composed of liquid droplets such as propylene glycol (PG) and/or vegetable glycerin (VG).2 The evaporation and condensation of both PG and VG are affected by environmental conditions, such as the partial pressures of VG and PG in the air, temperature, and humidity.15 Previous studies reported a wide range of e-cigarette particle sizes with the count median diameter ranging from 18 to 386 nm.9,11,12,16–18 We hypothesize that this large size range may at least be partially explained by inconsistencies and differences in the expermental protocols. However, the impacts of dilution, temperature, and humidity on e-cigarette particle size measurements have not been studied to date.
Therefore, the measurement of e-cigarette particles needs to reflect the diversity of the vaping market and use patterns, i.e., different e-cigarette device settings, various e-liquid types, and range of vaping topographies; and the measurement also needs to be conducted under well-controlled environmental conditions. This study examined the impacts of vaping diversity (i.e., e-cigarette heating power, vaping topography, and e-liquid components) on the size distribution and concentrations of e-cigarette particles. This study also evaluated the impact of environmental conditions (i.e., dilution, temperature, and humidity) on e-cigarette particle measurements.
MATERIALS AND METHODS
E-Cigarette Device and E-Liquids.
The e-cigarette device used in this study consisted of a cartomizer and a battery box. The cartomizer (The Council of Vapor, Walnut, CA, USA) had an adjustable air hole (1−2 mm in diameter) and an adjustable nichrome heating coil with the electric resistance ranging from 0.8 to 2.0 Ω (Figure S1). The battery box, a Sigelei-100-W battery (Sigelei US, Pomona, CA, USA), permitted the output voltages ranging from 1 to 8.4 V. The combinations of the battery voltage and the coil resistance provided a wide range of heating power, 3−80 W. The coil temperature under each heating power was measured with a K-type thermocouple (Fisher Scientific, Pittsburgh, PA).
Commercially available e-liquids usually do not disclose detailed components and were shown to contain impurities.19 The uncertainty in e-liquid composition could make it harder to understand the impact of e-liquid on particle formation. Therefore, the e-liquids tested in this study were prepared fresh in the lab for quality control purposes with propylene glycol (PG, USP grade, Sigma-Aldrich, St. Louis, MO), vegetable glycerin (VG, USP grade, J.T. Baker, Phillipsburg, NJ), nicotine (>99%, Sigma-Aldrich, St. Louis, MO), and flavoring agents.
The selected flavoring agents included in the study were strawberry, dragon fruit, menthol, sweet cream, Bavarian cream, cinnamon, bubble gum, and graham cracker. They represent the most popular flavors currently used in the market, based on a comprehensive review of 941 914 e-liquid recipes appearing from e-cigarette forums and online vaping shops.20 These eight flavors appeared in 21.5% of all the e-liquid recipes we reviewed. Flavoring ingredients were purchased from The Perfumer’s Apprentice (Scotts Valley, CA, USA), which supplies flavoring agents for more than onehalf of the e-liquid recipes.20 The ingredients, provided by The Perfumer’s Apprentice, are detailed in the Supporting Information for each of the eight flavors.
E-Cigarette Topography Measurement.
E-cigarette use patterns collected from daily e-cigarette users were assessed to determine e-cigarette particle generation conditions. A convenience sample of 23 healthy adult e-cigarette users was recruited on Rutgers campuses with the approval of the Rutgers Institutional Review Board (Pro20140000589). The study participants were healthy adults (21 men, 2 women), ages 18−65 years old, who had used e-cigarettes daily for a total of at least 50 days at the time of the study. The study participants self-reported that no other forms of combusted tobacco or marijuana had been used in the past 30 days. Demographic details of the study participants are presented in Table S1.
To assess vaping topographies, each study participant was instructed to perform a 30 min ad-lib vaping in an office setting using his/her own e-cigarette. Vaping topographies (i.e., puff volumes, puff durations, and interpuff intervals) were recorded using a CReSS Pocket device (Borgwaldt KC Inc., North Chesterfield, VA, USA). The e-cigarette use patterns of the 23 study participants are detailed in Table 1. E-cigarette device power output ranged from 5 to 59.7 W with an average power output of 13.7 W. The average nicotine content in e-liquids was 11.9 ± 10.0 mg/mL with a maximum nicotine level of 36 mg/mL. Most subjects used vegetable glycerin (VG)-based e-liquids (14 participants) followed by PG:VG-mixed e-liquids (7 participants) and PG-based e-liquids (2 participants). Vaping topographies measured in our study are consistent with subsequently published topography data: The reported mean puff volumes ranged from 51 to 133 mL, and the mean puff durations ranged from 2.6 to 4.3 s.21–26 In addition, throughout the particle size distribution measurements, a square-shaped vaping topography was used instead of a bell-shaped topography which was used for the conventional cigarette smoking (Figure S2).
Table 1.
Vaping Topographies, E-Cigarette Device Power Settings, and Nicotine Contents in E-Liquids Across the 23 Study Participants
| parameters | mean | standard deviation | percentiles |
||||||
|---|---|---|---|---|---|---|---|---|---|
| min | 10 | 25 | 50 | 75 | 90 | max | |||
| puff volume (mL) | 100.17 | 55.57 | 9.99 | 38.39 | 63.58 | 90.04 | 135.6 | 160.5 | 251.0 |
| puff duration (s) | 3.69 | 1.16 | 1.26 | 2.08 | 3.24 | 3.85 | 4.24 | 5.06 | 5.77 |
| puff interval (s) | 24.30 | 17.30 | 8.01 | 11.90 | 13.86 | 18.67 | 26.35 | 67.91 | 69.39 |
| power (W) | 13.70 | 15.14 | 5.00 | 5.48 | 6.26 | 7.61 | 12.96 | 27.38 | 59.67 |
| Nicotine (mg/mL) | 11.92 | 10.04 | 0.00 | 3.00 | 3.00 | 12.00 | 19.50 | 24.00 | 36.00 |
E-Cigarette Particle Generation Conditions.
E-cigarette particles were generated using an LX1 smoking machine (Borgwaldt KC Inc., Hamburg, Germany) under a wide range of e-cigarette use conditions presented in Table 2. The impacts of e-cigarette device settings on e-cigarette particles were tested with 3 levels of coil heating powers (6.4, 14.7 and 31.3 W). The selected power outputs represent the observed median, average, and 95th percentile values from the 23 study participants and represent safe, hot, and extremely hot range, respectively, based on the e-cigarette vaping power chart.27 Other experimental settings include 90 mL puff volume, 3.8 s puff duration, and 30 s puff interval with VG-based e-liquid (12 mg/mL nicotine) in these experiments.
Table 2.
Experimental Settings for E-Cigarette Particle Generation
| experiments | factors | settings | other settings |
|---|---|---|---|
| device setting | device power (watt) | 6.4, 14.7, 31.3 | 90 mL puff volume, 3.8 s puff duration, 12 mg/mL nicotine in VG |
| e-liquid bulk material | base material | PG, VG, PG&VG (v:v = 1:1) | 6.4 W power output, 90 mL puff volume, 3.8 s puff duration |
| nicotine (mg/mL) | 0, 3, 12, 24, 36 in VG | ||
| e-liquid flavoring agents | flavor | 8 flavorsa in VG | 6.4 W power output, 90 mL puff volume, 3.8 s puff duration |
| flavoring level (%) | 1, 10b in VG | ||
| vaping topography | puff volume (mL) | 35, 90, 170 | 6.4 W power output and 12 mg/mL nicotine in VG |
| puff duration (s) | 2, 3.8 |
Strawberry (Ripe), dragonfruit, menthol, cinnamon, bubblegum, bavarian cream, sweet cream, and graham cracker.
0.1% and 1% for the cinnamon flavor.
In order to test the impacts of e-liquid compositions on e-cigarette particle size distributions, particles were generated under 15 conditions with the combination of five nicotine concentrations (0, 3, 12, 24, and 36 mg/mL) and three types of e-liquid base solutions (100% PG, 100% VG, and 50% PG + 50% VG [v/v]). In addition, the eight flavoring ingredients mentioned above were added into VG-based e-liquids to test their impacts on e-cigarette particle size distribution. VG was identified as the most popular base material in e-liquids; however, our study cannot demonstrate the joint impacts of flavoring agents and different base material on particle size distribution, because PG-based e-liquids were not used for testing. On the basis of the ranges of flavoring agent concentrations in 941 914 e-liquid recipes,20 flavored e-liquids containing both high (10%) and low (1%) levels of flavoring agents were used for particle generation (an exception was 1% and 0.1% for cinnamon flavor). Other e-cigarette particle generation conditions in these experiments were 6.4 W power output, 90 mL puff volume, 3.8 s puff duration, and 30 s puff interval.
The impacts of vaping topography on e-cigarette particle size distribution were tested with the combination of 3 puff volumes (35, 90, and 170 mL) and 2 puff durations (2 and 3.8 s). Besides the median puff volume (90 mL) and duration (3.8 s), a conventional cigarette smoking regime (i.e., 35 mL and 2 s) and the 95th percentile puff volume (170 mL) for the 23 study participants were included. In these experiments, the power output was 6.4 W and the e-liquid was VG-based e-liquid with 12 mg/mL nicotine.
E-Cigarette Particle Size Distribution and Number Concentration Measurements.
The size distributions and number concentrations of e-cigarette particles were measured with a portable aerosol mobility spectrometer (PAMS, KANOMAX USA, Andover, NJ) and an optical particle counter (OPC, model 3886, KANOMAX USA, Andover, NJ) to cover a wide range of e-cigarette particle sizes (from 10 nm to 5.0 μm). Before introducing e-cigarette particles, dilution chambers were purged with HEPA-Cap filtered air (Whatman, Florham Park, NJ) until the background particle (>10 nm) number concentration was nondetectable. Five replicate experiments were performed under each e-cigarette particle generation condition, and all measurements were conducted at 37 °C and 95% relative humidity (RH) to represent human respiratory track condition. E-cigarette particles, generated under various conditions, were diluted in two sequential 10 L chambers (28 cm × 22.5 cm × 16 cm, Figure 1) in order to keep the particle concentrations below the coincidence and saturation limits of the instruments. The smoking machine was connected with the first dilution chamber. After complete mixing, a fraction of diluted e-cigarette particles in the first chamber was introduced into the second chamber, which was connected with the two particle size measurement devices. Then the particle size distributions obtained from the PAMS (10−436 nm) and OPC (0.3−5.0 μm) were combined using weighted averages (Figure S3).
Figure 1.

Schematic of experimental setup.
The two dilution chambers were submerged within water baths (Isotemp 220, Fisher Scientific, Pittsburgh, PA) to reach the target temperature. The target humidity was achieved by introducing humidified air through a series of four bubblers which were also submerged within a water bath. The air that flowed through the bubblers was introduced into the first dilution chamber. Background particle concentrations were constantly monitored to ensure that no water droplets were introduced into the chamber. Temperature and humidity in dilution chambers were also monitored continuously (Traceable Humidity/Temperature sensor, Fisher Scientific, Pittsburgh, PA). To minimize particle loss, all sampling lines were kept as short as possible using a conductive material and dilution chamber walls were coated with antistatic solution (Staticide for Clean Room, ACL, Chicago, IL). Particle size distributions were measured immediately after complete mixing to minimize particle coagulation. Assuming e-cigarette particles are spherical in shape, mass median diameters (MMD) were calculated based on the measured particle count distribution and the density of e-liquids (Table S2).
The impact of dilution on the size of e-cigarette particles was evaluated by measuring particle size distributions and number concentrations under various dilution ratios (i.e., the mixing ratio between clean air and e-cigarette puff volume), ranging from 396 to 15 907, which were the lowest-and the highest-achievable dilution ratios under the combination of the chamber volume, dilution air, and puff volume in our study. The reported particle sizes in this study were adjusted for dilution using statistical models (see Results and Discussion for details). In addition, the impact of temperature and humidity on the e-cigarette particle size distribution was characterized by measuring e-cigarette particles at 20 °C and 30% RH and at 37 °C and 95% RH. The two conditions represent the normal laboratory measurement condition and the human airway condition, respectively.
Deposition of E-Cigarette Particles in Human Airways.
The deposition of e-cigarette particles in the tracheobronchial (TB) region and the bronchoalveolar (BA) regions of human airways was estimated using a modified multiple path particle dosimetry (MPPD) model.6 The modified MPPD model simulates not only particle impaction, sedimentation, and diffusion but also particle evaporation and coagulation.6,28 The detailed assumptions and input parameters for the MPPD model are tabulated in Table S3.
In addition, the cloud effect, which is the movement of dense e-cigarette particles within a small volume and governs the proximal respiratory track deposition (i.e., the oropharyngeal and the TB regions),28,29 was accounted for by calculating a cloud-equivalent particle diameter. Since a single e-cigarette particle in an e-vapor cloud is confined within the cloud and moves with the cloud, the settling velocity of the single particle equals the settling velocity of the cloud. Thus, it was assumed that a particle with the cloud-equivalent particle diameter would have the same terminal settling velocity as the particle cloud. The procedure to calculate the cloud-equivalent particle diameter is detailed in the Supporting Information (eqs S1–S3).
Statistical Analyses.
For all of the experimental conditions, mean and standard deviations were estimated and presented. Two-tailed Student’s t tests were conducted using R 3.4.3 (R Foundation, Vienna, Austria) to compare the mean values across different e-cigarette vaping conditions.
RESULTS AND DISCUSSION
Impacts of Testing Conditions on E-Cigarette Particle Measurements.
Figure 2 illustrates the impact of varying dilution ratios (i.e., the ratio of the dilution air volume and the puff volume) on the count median diameters (CMD) of e-cigarette particles reported in the literature and measured in the current study.9,11,12,17,18,30
Figure 2.

Relationship between the count median diameters (CMD, nm) of e-cigarette particles and the dilution ratio during particle measurements, based on the e-cigarette CMD reported in the literature and measurements made in this study under various dilution conditions.
Dilution ratios substantially influenced the measured e-cigarette particle sizes: The CMD decreased with increasing dilution ratio until approximately 3000-fold dilution. For example, in the case of particles generated from VG-based e-liquids under 6.4 W, when the dilution ratio increased from 548 to 8087, the CMD decreased from 202 ± 21 (mean ± SD, N = 5) to 136 ± 13 nm. The measured CMD, MMD, geometric standard deviation (GSD), and particle number concentrations at each dilution ratio are presented in Tables S4–S8. A wide range of CMD of e-cigarette particles have been reported in the literature, ranging from 18 to 386 nm across a broad dilution ratio of 0−12 800.11,12,17
We developed a statistical model to quantify the impact of dilution on the size of e-cigarette particles (eq S4 and Table S9). Separate model parameters were developed for each e-cigarette particle generation condition, because various vaping conditions resulted in different e-cigarette particle sizes, and the initial particle size was known to determine particle evaporation and coagulation rates.31 The measured particle sizes in subsequent sections were adjusted for dilution using nonlinear regressions (eq S4) and are reported as undiluted particle sizes to evaluate the impact of various vaping conditions on e-cigarette particle size unless the dilution ratio is specified. It is worth noting that the number concentrations were not adjusted since we did not observed the impact of dilution on particle number concentrations.
Temperature and RH also affected e-cigarette particle properties. E-cigarette particles were measured at both 20 °C and 30% RH and 37 °C and 95% RH at a dilution ratio of 1068 (Table S10). When the measurement condition changed from a typical experimental condition (20 °C and 30% RH) to the physiologically relevant condition (37 °C and 95% RH), the measured CMD increased by 4.0% to 44% depending on the e-liquid type. The particle size increase was driven by water condensation on PG or VG particles.15,32 At the same time, the particle number concentration showed an average increase of 117% (p < 0.001) across the three e-liquid types. It is worth noting that systematically assessing the influence of temperature and humidity on particle measurement was out of the scope of this study, and that the impact of temperature and humidity on e-cigarette particle size distribution was relatively minor compared with high dilution conditions.
This study demonstrates that the observed CMD of e-cigarette particles is sensitive to measurement conditions, indicating that e-cigarette emissions need to be tested under rigorously controlled environment and that measurement conditions need to be considered in order to interpret the results of e-cigarette particle sizes and inhalation dosimetry. Our results also suggest that valid comparisons across different studies require the consideration of experimental conditions. Aerosols measured in this study are the suspended particles in chambers. CMDs of particles suspended in chambers are affected by the particle residence time in the chambers and the particle deposition patterns on chamber walls, which is in turn affected by the geometry of a chamber (e.g., surface-to-volume ratios).31 Therefore, the chamber geometry needs to be considered while comparing our findings with the results from other studies.
Impacts of Device Settings on Particle Concentrations and Size Distributions.
Figure 3 illustrates the impacts of e-cigarette device settings on the CMD and the number concentrations of e-cigarette particles. Higher coil heating power generated higher coil temperatures and larger e-cigarette particles (i.e., larger CMD) compared to lower heating power. The measured coil temperatures were 130.6 °C at 6.4 W, 199.1 °C at 14.7 W, and 223.9 °C at 31.3 W. When the heating power increased from 6.4 to 31.3 W, the CMD increased from 200 ± 16 to 228 ± 14 nm. The CMD observed at 31.3 W was statistically significantly larger than the CMD observed at 6.4 W (p < 0.001), but the heating power did not significantly affect MMD.
Figure 3.

Impact of e-cigarette device power on e-cigarette particle count median diameters (CMD, nm) and mass median diameters (MMD, μm) (a) and particle counts (b). Particles were generated under 90 mL puff volume, 3.8 s puff duration, and VG-based e-liquid with 12 mg/mL nicotine (N = 5; error bars are standard deviations of five independent measurements).
Higher e-cigarette heating power was also associated with higher particle number concentration (particles > 10 nm). The observed number concentrations were (1.46 ± 0.14) × 108/ cm3, (4.21 ± 0.58) × 108/cm3, and (7.20 ± 0.42) × 108/cm3 at 6.4, 14.7, and 31.3 W, respectively. For power increase from 6.4 to 31.3 W, the increase in particle number concentration was statistically significant (p < 0.001). Recent studies also found positive correlations between e-cigarette power output and particle size and number concentrations.14,33–35 The increase in device power results in higher heating temperatures, faster evaporation of e-liquids, which contributes to higher levels of condensation and coagulation, leading to bigger particle sizes.
Impacts of E-Liquid Compositions on Particle Concentrations and Size Distributions.
Figure 4 shows the change in e-cigarette particle size and number concentrations across different e-liquids. Compared with PG-based e-liquids, VG-based e-liquids produced larger e-cigarette particles and higher particle number concentrations. Across all nicotine levels, the mean CMDs of e-cigarette particles were 162 ± 10 nm for PG-based e-liquids and 175 ± 9 nm for PG:VG (v:v = 1:1)-based e-liquids, significantly smaller than 209 ± 10 nm for VG-based e-liquids (p < 0.001). In addition, the MMDs of VG-and PG:VG (v:v = 1:1)-based e-liquids were significantly higher than that of PG-based e-liquids (p < 0.001). The particle number concentration for VG-based e-liquids was (1.89 ± 0.25) × 108/cm3, which is significantly higher than the particle number concentration for PG-based e-liquids [(9.00 ± 1.53) × 107/cm3] (p < 0.001).
Figure 4.

Impact of e-liquid composition on e-cigarette particle count median diameters (CMD, nm) and mass median diameters (MMD, μm) (a) and particle counts (b). Particles were generated under 6.4 W e-cigarette battery power output, 90 mL puff volume, and 3.8 s puff duration (N = 5; error bars are standard deviations of the five independent measurements).
The type of base material (i.e., VG or PG) in e-liquids was found to be a determinant in this study affecting e-cigarette particle size distribution. VG has a much lower vapor pressure (0.01 Pa) than PG (20 Pa), and therefore tends to condense more on the particle phase than PG, leading to higher particle number concentrations and larger particle sizes. Previous studies have also shown that VG-based e-liquids generated larger particles than PG-based e-liquids under the same power outputs and vaping topographies.13,14,34–36 However, particle number concentrations generated using different e-liquids showed inconsistent trends. This study and ref 13 observed higher number concentrations of particles generated from VG-based e-liquids (vs PG-based e-liquids), while another study36 showed the opposite result. The impact of other e-liquid components (i.e., nicotine and flavoring) on e-cigarette particle emissions also showed conflicting results in terms of particle size and concentrations.14,36 Most of the flavoring ingredients contain PG, and therefore, adding flavoring ingredients into VG-based solution increases PG contents lead to smaller particles, although the differences in CMDs were not statistically significant between flavored and nonflavored e-liquids (Table S11). Compared with nonflavored e-liquids, flavored e-liquids (except for strawberry and dragon fruit flavors) significantly decreased particle number concentrations (p < 0.001). Increased nicotine levels, another bulk chemical in e-liquids, also decreased e-cigarette particle number concentrations (p < 0.473) (Table S12). The differences in CMDs or MMDs across different nicotine levels were usually less than 8.2% and 5.5%, respectively, without clear trends (Table S12). The differences in e-cigarette particle size distributions observed in this study and reported by others14,34–36 could be largely attributable to different experimental conditions/ protocols used for particle generation and measurements (e.g., dilution ratio, and particle sizing instrument), and warrant further investigations.
Impacts of Vaping Topographies on Particle Concentrations and Size Distributions.
Figure 5 demonstrates the impacts of puff volume and puff duration on e-cigarette particle sizes and concentrations. Longer puff duration at a fixed puff volume (i.e., slower air flow rate) generated significantly larger particles and resulted in higher particle number concentrations (p < 0.001). The CMDs of a 2 s puff and a 3.8 s puff were 114 ± 7 and 203 ± 17 nm, 110 ± 6 and 205 ± 5 nm, and 125 ± 10 and 160 ± 14 nm, for 35, 90, and 170 mL puffs, respectively. When puff duration increased from 2 to 3.8 s, particle number concentrations increased from (1.64 ± 0.37) × 107 to (4.66 ± 1.56) × 107/cm3, from (5.99 ± 1.44) × 107 to (1.61 ± 0.11) × 108/cm3, and from (7.79 ± 0.14) × 107 to (3.47 ± 0.22) × 108/cm3, for 35, 90, and 170 mL puffs, respectively.
Figure 5.

Impact of vaping topography on e-cigarette particle count median diameters (CMD, nm, bar plots) and mass median diameters (MMD, μm, dot plots) (a) and particle counts (b). Particles were generated under 6.4 W e-cigarette battery power output and VG-based e-liquid with 12 mg/mL nicotine (N = 5; error bars are standard deviations of the 5 independent measurements).
Larger puff volumes with a fixed puff duration (i.e., faster air flow rate) significantly increased particle number concentrations but reduced CMD and MMDs under 3.8 s puff duration. The particle number concentration of a 170 mL puff was 1.3−7.5 times higher than that of a 35 or 90 mL puff (p < 0.024). When the puff duration was 3.8 s, the CMD decreased from 203 ± 17 nm for a 35 mL puff to 160 ± 14 nm for a 170 mL puff (p < 0.003).
Vaping topography affected the size distribution of e-cigarette particles by modifying the air flow rate and the residence time of e-cigarette particles in the cartomizer. We observed larger e-cigarette particles under longer puff durations and smaller puff volumes, which is consistent with what refs 12 and 37 reported, i.e., the CMD of e-cigarette particles increased from 296 to 386 nm when the puff duration (55 mL puffs) increased from 2 to 4 s. This is explained by the fact that both longer puff duration and smaller puff volumes can decrease the air flow through e-cigarettes and increase the particle residence time in the cartomizer. Decreased air flow facilitates a stable and higher coil temperature, which can increase the evaporation of e-liquids.11,38 Increased particle residence time also increased particle coagulation, leading to larger particles.31 The theoretical thermal coagulation coefficient is 6.3 × 1010 cm3/s for particles with a CMD of 200 nm and a GSD of 1.5, and the kinematic coagulation, due to the air flow passing through the cartomizer, could be an order of magnitude higher than thermal coagulation.31 The coagulation rate in our study, i.e., 7.64 × 1011 cm3/s, was similar to the theoretical kinematic coagulation rate.
E-cigarette vaping topography is generally different from that of cigarette smoking. For example, e-cigarette users need longer puff durations (and/or puff volumes) in order to warm up the heating coil of their e-cigarette devices.38 Despite this major difference, some studies still use cigarette smoking topographies to assess e-cigarette health effects under the conventional cigarette smoking regimes (i.e., 35−55 mL and 2 s puffs). Our study and several other studies have also clearly shown that vaping topography impacts e-cigarette particle size distributions.12,16,18,39 Therefore, it is imperative to factor in real-world vaping topographies into simulated or laboratory-based e-cigarette particle measurements.
E-cigarette Particle Deposition in Human Airways.
Figure 6 shows the mass deposition of e-cigarette particles in the tracheobronchial (TB) and the bronchoalveolar (BA) regions of the human lungs under different e-cigarette device settings, vaping topographies, and e-liquid compositions. The percent depositions of e-cigarette particles in the TB and the BA regions are summarized in Tables S13–S16.
Figure 6.

Impact of e-cigarette device power output (a), vaping topography (b), e-liquid base material (c), and e-liquid flavoring agents (d) on lung deposition of e-cigarette particles. In panel d, St, D, M, C, Bu, Ba, Sw, and G represent strawberry, dragon fruit, menthol, cinnamon, bubble gum, Bavarian, sweet cream, and graham flavors, respectively; low level and high level indicate 1% and 10% of flavoring agents except for the cinnamon flavor (0.1% and 1%, respectively) (N = 5; error bars are standard deviations of the five independent measurements).
The total particle mass deposition per puff of e-cigarette vaping in human airways was 3.3−7.3 times higher under high-power settings (4.64 mg for 31.3 W and 2.12 mg for 14.7 W) than under the 6.4 W power setting (0.638 mg) (p < 0.001), while lower power output settings resulted in higher TB deposition fraction than high-power setting: 0.541, 0.532, and 0.517 for 6.4, 14.7, and 31.3 W, respectively.
Increased puff volume and puff duration resulted in higher particle depositions in both the TB and the BA regions. The total mass deposition of a 90 mL (3.8 s) puff was 747 μg, which was 72 times higher than that calculated for puffs generated under the International Organization for Standardization (ISO) puffing regime for cigarette smoking (35 mL and 2 s) (p < 0.001). In addition, higher puff volumes showed higher deposition in the TB region (Figure 5): The deposition fractions in the TB region were 0.506, 0.530, and 0.543 for 35, 90, and 170 mL puffs (3.8 s puff duration), respectively. Despite the fact that smaller particles are known to deposit deeper in the lung,31 the cloud effect could facilitate upper lung deposition of smaller particles than larger particles (see eq S1).29
The total mass depositions for VG-and PG:VG mixture-based e-liquids were 940 μg and 395 μg, which was 2.6−6.3 times higher than the deposition of particles generated from PG-based e-liquids (150 μg) (p < 0.001). Flavored e-liquids resulted in significantly lower particle mass deposition than nonflavored e-liquids (p < 0.011) except for fruit-flavored e-liquids (strawberry and dragon fruit).
We estimate that 7−31% of e-cigarette particles are deposited in the BA regions and about 50% in the TB region of the human lungs, which are higher than the findings in previous studies. Reference 40 estimated a 10% and a 17% deposition of e-cigarette particles in the BA and the TB regions, respectively; and ref 39 reported that the BA deposition of e-cigarette particles was two times higher than that in the TB region. However, none of the previous studies considered particle cloud effects, which is critical for e-cigarette particle deposition in the upper human airways, nor corrected for particle measurement artifacts. Figure S4 illustrates the calculated e-cigarette particle deposition in human airways with and without cloud effects. The total deposition and the TB region deposition of e-cigarette particles increased substantially when the cloud effect was considered, i.e., changing from 33% and 10% without cloud effects to 80% and 52% with cloud effects, respectively. Our estimates are consistent with a recently published report on nicotine retention for e-cigarettes vaping: About 90% of the inhaled nicotine from e-cigarettes was retained in the human respiratory system.41
Public Health Implications.
This work contributes to a better understanding of the impacts of measurement conditions and a wide range of vaping diversity on the size and the human airway deposition of e-cigarette particles, which has critical implications for e-cigarette product and toxicity testing. The e-cigarette particle size and deposition pattern could affect local dose and toxicological end points.42
Although previous studies recognized that dilution and experimental conditions might affect measured particle size distribution, to the best of our knowledge, this is the first study systematically testing how experimental measurement conditions (i.e., dilution, temperature, and humidity) affect e-cigarette particle size estimations. This study indicates that e-cigarette emissions need to be tested in rigorously controlled environments with minimal dilution, so that the measured CMD of e-cigarette particles can be compared across different studies and be used to determine inhalation dosimetry.
This study systematically evaluated the impacts of e-cigarette heating power, vaping topography, and e-liquid components on the size distribution of e-cigarette particles. Our experimental conditions support the draft guidance of the U.S. FDA highlighting the importance of the real-world vaping diversity in e-cigarette testing.43 E-cigarette device power, e-liquid composition, and vaping topography impact the size of e-cigarette particles and their deposition in the human airways. Our findings provide key information required for e-cigarette regulation and harm reduction strategies. E-cigarette device power and e-liquid composition should be regulated to optimize nicotine and flavor delivery while reducing harmful constituent emission, including particles. In addition, estimated e-cigarette particle deposition patterns may help improve the design of toxicological testing protocols.
Our study indicates that particles generated from e-cigarette have smaller sizes and lower mass than particles emitted from conventional cigarettes (Table 3). Particles generated from e-cigarette vaping and from cigarette smoking both tend to have a higher deposition fraction for the TB region than the pulmonary region (Table 3), although the deposited mass of e-cigarette particles is an order of magnitude lower than that of cigarette particles. Our findings are critically important to the evaluation of inhalation exposures to e-cigarette particles and human health risks associated with e-cigarette vaping, which is much needed to map the position of e-cigarettes on the risk continuum of tobacco products and to inform FDA e-cigarette regulations.43
Table 3.
CMD and Human Airway Deposition Patterns of Particles Generated from Cigarettes and E-Cigarettes
| parameters | e-cigarettea | cigarette |
|---|---|---|
| CMD (nm) | 110−228 | 180−34046 |
| particle number concentration (no./cm3) | 0.16 × 10⁸−7.04 × 10⁸ | 3.67 × 10⁹−6.12 × 10⁹ 46 |
| deposition fraction tracheobronchial (TB) | 0.51−0.55 | 0.46−0.6329 |
| pulmonary (BA) | 0.07−0.31 | 0.26−0.3529 |
| total | 0.60−0.84 | 0.32−0.8929 |
| mass deposition (mg/puff) tracheobronchial (TB) | 0.008−3.1 | 6.4−56.629,b |
| pulmonary (BA) | 0.002−1.8 | 3.5−31.229,b |
| total | 0.010−4.9 | 10.0−87.829,b 4.3−25.147 2.5−5.848 |
E-cigarette data were measured in this study.
Backcalculated from deposition fraction.
Further, the impact of particle hygroscopic growth needs to be evaluated because the deposition of the hydrophilic particles in the proximal respiratory track (i.e., oropharynx and TB region) could be much larger than that from cigarette smoke particles, which are not hydrophilic. For example, the hygroscopic growth factor of VG was 1.5-fold higher than that of cigarette smoke.15,44 Therefore, e-cigarette particles more quickly swell in the proximal airways, which will result in greater particle deposition than conventional cigarette smoke. Reference 45 showed a 25-fold increase in hygroscopic particle deposition in the lung compared to stable particles. Moreover, deposition of VG aerosol could be dramatically affected by the hygroscopic growth compared to PG aerosol because larger particles have much higher growth rates than smaller particles.31
Our study has several limitations: (1) the study investigated a limited number of flavored e-liquids; (2) some e-cigarette particles during measurements were lost; and (3) undiluted particles sizes were estimated/adjusted using nonlinear regression models. Although it is not possible to assess all available flavored e-liquids on the market, we limited our assessments to the most frequently used eight flavors that appeared in more than 20% of the 941 914 e-liquid recipes we collected. Nanosized e-cigarette particles might have been subject to electrical and/or diffusion loss during measurements. This potential confounder was, however, minimized in our study through the use of conductive materials for the sampling lines and making the sampling lines as short as possible. Although the undiluted particle sizes reported in our study were not directly measured due to instrument availability but estimated based on nonlinear regression models, the adjusted e-cigarette particle sizes in this study were within the range of e-cigarette particle sizes directly measured at nondiluting conditions (diffraction spectrometer, 180−220 nm; spectral transmission method, 210−380 nm).12,17 Given the variety of vaping devices on the market, cautions need to be exercised to extrapolate our findings to other types of vaping devices. Our study provide a method to estimate undiluted particle size, which could be further evaluated in future studies under well-controlled e-cigarette particle size testing conditions. In addition, the deposition of e-cigarette particles in human airways, estimated by the MPPD model, needs to be verified by in vivo dosimetry studies.
Supplementary Material
ACKNOWLEDGMENTS
The authors thank Drs. Clifford Weisel and Lance Wallace for valuable discussions. We also thank all study participants for their support of the study.
Funding
The authors thank the Cancer Institute of New Jersey, New Jersey Health Foundation, and National Institute of Environmental Health Sciences (P30 ES005022) for funding this study. Contributions by OAW were supported in part by K01 CA189301 from the National Cancer Institute and the FDA Center for Tobacco products. The content is solely the responsibility of the authors and does not necessarily represent the official views of the funding organizations.
ABBREVIATIONS USED
- PG
propylene glycol
- VG
vegetable glycerin
- PAMS
portable aerosol mobility spectrometer
- OPC
optical particle counter
- TB
tracheobronchial
- BA
bronchoalveolar
- MPPD
multiple path particle dosimetry
- CMD
count median diameter
- MMD
mass median diameter
- GSD
geometric standard deviation
Footnotes
ASSOCIATED CONTENT
Supporting Information
The Supporting Information is available free of charge at https://pubs.acs.org/doi/10.1021/acs.chemrestox.9b00243.
E-cigarette device and chemical components of flavoring ingredients, vaping topography measurements, e-cigarette particle measurement setting and data processing, mass median diameter (MMD) calculation, MPPD model assumptions and deposition of e-cigarette particles in the human respiratory system, impact of dilution on the sizes and number concentrations of e-cigarette particles, impact of temperature and relative humidity on the sizes and number concentrations of e-cigarette particles, impact of E-liquid flavoring and nicotine on the sizes and number concentrations of e-cigarette particles, estimated e-cigarette particle deposition fractions (PDF)
The authors declare no competing financial interest.
REFERENCES
- (1).Arrazola RA, Singh T, Corey CG, Husten CG, Neff LJ, Apelberg BJ, Bunnell RE, Choiniere CJ, King BA, and Cox S. (2015) Tobacco use among middle and high school students-United States, 2011−2014. MMWR 64, 381–385. [PMC free article] [PubMed] [Google Scholar]
- (2).King BA, Patel R, Nguyen K, and Dube SR (2015) Trends in awareness and use of electronic cigarettes among US adults, 2010−2013. Nicotine Tob. Res 17, 219–227. [DOI] [PMC free article] [PubMed] [Google Scholar]
- (3).Trtchounian A, Williams M, and Talbot P. (2010) Conventional and electronic cigarettes (e-cigarettes) have different smoking characteristics. Nicotine Tob. Res 12, 905–912. [DOI] [PubMed] [Google Scholar]
- (4).Burstyn I. (2014) Peering through the mist: systematic review of what the chemistry of contaminants in electronic cigarettes tells us about health risks. BMC Public Health 14, 18. [DOI] [PMC free article] [PubMed] [Google Scholar]
- (5).FDA 81 FR 28973: Deeming Tobacco Products To Be Subject to the Federal Food, Drug, and Cosmetic Act, as Amended by the Family Smoking Prevention and Tobacco Control Act; Restrictions on the Sale and Distribution of Tobacco Products and Required Warning Statements for Tobacco Products; Federal Register; Food and Drug Administration: Silver Spring, MD, 2016. [PubMed] [Google Scholar]
- (6).Kane DB, Asgharian B, Price OT, Rostami A, and Oldham MJ (2010) Effect of smoking parameters on the particle size distribution and predicted airway deposition of mainstream cigarette smoke. Inhalation Toxicol. 22, 199–209. [DOI] [PubMed] [Google Scholar]
- (7).Uchiyama S, Senoo Y, Hayashida H, Inaba Y, Nakagome H, and Kunugita N. (2016) Determination of Chemical compounds generated from Second-generation E-cigarettes using a Sorbent Cartridge followed by a Two-step Elution Method. Anal. Sci 32, 549–555. [DOI] [PubMed] [Google Scholar]
- (8).Seidenberg AB, Jo CL, and Ribisl KM (2016) Differences in the design and sale of e-cigarettes by cigarette manufacturers and non-cigarette manufacturers in the USA. Tob. Control 25, e3–e5. [DOI] [PubMed] [Google Scholar]
- (9).Fuoco F, Buonanno G, Stabile L, and Vigo P. (2014) Influential parameters on particle concentration and size distribution in the mainstream of e-cigarettes. Environ. Pollut 184, 523–529. [DOI] [PubMed] [Google Scholar]
- (10).Talih S, Balhas Z, Eissenberg T, Salman R, Karaoghlanian N, El Hellani A, Baalbaki R, Saliba N, and Shihadeh A. (2015) Effects of user puff topography, device voltage, and liquid nicotine concentration on electronic cigarette nicotine yield: measurements and model predictions. Nicotine Tob. Res 17, 150–157. [DOI] [PMC free article] [PubMed] [Google Scholar]
- (11).Zhao T, Shu S, Guo Q, and Zhu Y. (2016) Effects of design parameters and puff topography on heating coil temperature and mainstream aerosols in electronic cigarettes. Atmos. Environ 134, 61–69. [Google Scholar]
- (12).Ingebrethsen BJ, Cole SK, and Alderman SL (2012) Electronic cigarette aerosol particle size distribution measurements. Inhalation Toxicol. 24, 976–984. [DOI] [PubMed] [Google Scholar]
- (13).Baassiri M, Talih S, Salman R, Karaoghlanian N, Saleh R, El Hage R, Saliba N, and Shihadeh A. (2017) Clouds and “throat hit”: Effects of liquid composition on nicotine emissions and physical characteristics of electronic cigarette aerosols. Aerosol Sci. Technol 51, 1231–1239. [DOI] [PMC free article] [PubMed] [Google Scholar]
- (14).Lechasseur A, Altmejd S, Turgeon N, Buonanno G, Morawska L, Brunet D, Duchaine C, and Morissette MC (2019) Variations in coil temperature/power and e-liquid constituents change size and lung deposition of particles emitted by an electronic cigarette. Physiol. Rep 7, No. e14093. [DOI] [PMC free article] [PubMed] [Google Scholar]
- (15).Wright TP, Song C, Sears S, and Petters MD (2016) Thermodynamic and kinetic behavior of glycerol aerosol. Aerosol Sci. Technol 50, 1385–1396. [Google Scholar]
- (16).Laugesen M. Ruyan e-cigarette bench-top tests; Society for Research on Nicotine and Tobacco (SRNT): Dublin, Ireland, 2009. [Google Scholar]
- (17).Sosnowski TR, and Kramek-Romanowska K. (2016) Predicted Deposition of E-Cigarette Aerosol in the Human Lungs. J. Aerosol Med. Pulm. Drug Delivery 29, 299–309. [DOI] [PubMed] [Google Scholar]
- (18).Manigrasso M, Buonanno G, Stabile L, Morawska L, and Avino P. (2015) Particle doses in the pulmonary lobes of electronic and conventional cigarette users. Environ. Pollut 202, 24–31. [DOI] [PubMed] [Google Scholar]
- (19).Etter JF, Zäther E, and Svensson S. (2013) Analysis of refill̈ liquids for electronic cigarettes. Addiction 108, 1671–1679. [DOI] [PubMed] [Google Scholar]
- (20).ELiquidRecipes; http://e-liquid-recipes.com/ (accessed Oct 31, 2019).
- (21).Dautzenberg B, and Bricard D. (2015) Real-Time Characterization of E-Cigarettes Use: The 1 Million Puffs Study. J. Addict. Res. Ther 6, 229. [Google Scholar]
- (22).Hua M, and Talbot P. (2016) Potential health effects of electronic cigarettes: a systematic review of case reports. Preventive medicine reports 4, 169–178. [DOI] [PMC free article] [PubMed] [Google Scholar]
- (23).Meng Q, Schwander S, Son Y, Rivas C, Delnevo C, Graber J, Giovenco D, Bruen U, Mathew R, and Robson M. (2016) Has the mist been peered through? Revisiting the building blocks of human health risk assessment for electronic cigarette use. Hum. Ecol. Risk Assess. 22, 558–579. [DOI] [PMC free article] [PubMed] [Google Scholar]
- (24).Norton KJ, June KM, and O’Connor RJ (2014) Initial puffing behaviors and subjective responses differ between an electronic nicotine delivery system and traditional cigarettes. Tob. Induced Dis. 12, 17. [DOI] [PMC free article] [PubMed] [Google Scholar]
- (25).Robinson R, Hensel E, Morabito P, and Roundtree K. (2015) Electronic cigarette topography in the natural environment. PLoS One 10, No. e0129296. [DOI] [PMC free article] [PubMed] [Google Scholar]
- (26).Spindle TR, Breland AB, Karaoghlanian NV, Shihadeh AL, and Eissenberg T. (2015) Preliminary results of an examination of electronic cigarette user puff topography: The effect of a mouthpiece-based topography measurement device on plasma nicotine and subjective effects. Nicotine Tob. Res 17, 142–149. [DOI] [PMC free article] [PubMed] [Google Scholar]
- (27).Variable Voltage and Vaping Power Chart; Misthub, 2013; https://www.misthub.com/blogs/vape-tutorials/76788421-tutorialvariable-voltage-and-vaping-power-chart (accessed Oct 31, 2019).
- (28).Asgharian B, Hofmann W, and Bergmann R. (2001) Particle deposition in a multiple-path model of the human lung. Aerosol Sci. Technol 34, 332–339. [Google Scholar]
- (29).Broday DM, and Robinson R. (2003) Application of cloud dynamics to dosimetry of cigarette smoke particles in the lungs. Aerosol Sci. Technol 37 (6), 510–527. [Google Scholar]
- (30).Schripp T, Markewitz D, Uhde E, and Salthammer T. (2013) Does e-cigarette consumption cause passive vaping? Indoor Air 23, 25–31. [DOI] [PubMed] [Google Scholar]
- (31).Hinds WC Aerosol technology: properties, behavior, and measurement of airborne particles; John Wiley & Sons, 2012. [Google Scholar]
- (32).Byron PR, Davis SS, Bubb MD, and Cooper P. (1977) Pharmaceutical implications of particle growth at high relative humidities. Pestic. Sci 8, 521–526. [Google Scholar]
- (33).Floyd EL, Queimado L, Wang J, Regens JL, and Johnson DL (2018) Electronic cigarette power affects count concentration and particle size distribution of vaping aerosol. PLoS One 13, No. e0210147. [DOI] [PMC free article] [PubMed] [Google Scholar]
- (34).Pourchez J, Parisse S, Sarry G, Perinel-Ragey S, Vergnon J-M, Clotagatide A, and Prévôt N. (2018) Impact of power level and refill liquid composition on the aerosol output and particle size distribution generated by a new-generation e-cigarette device. Aerosol Sci. Technol 52, 359–369. [Google Scholar]
- (35).Zhao J, Nelson J, Dada O, Pyrgiotakis G, Kavouras IG, and Demokritou P. (2018) Assessing electronic cigarette emissions: linking physico-chemical properties to product brand, e-liquid flavoring additives, operational voltage and user puffing patterns. Inhalation Toxicol. 30, 78–88. [DOI] [PMC free article] [PubMed] [Google Scholar]
- (36).Zervas E, Litsiou E, Konstantopoulos K, Poulopoulos S, and Katsaounou P. (2018) Physical characterization of the aerosol of an electronic cigarette: impact of refill liquids. Inhalation Toxicol. 30, 218–223. [DOI] [PubMed] [Google Scholar]
- (37).Mikheev VB, Ivanov A, Lucas EA, South PL, Colijn HO, and Clark PI (2018) Aerosol size distribution measurement of electronic cigarette emissions using combined differential mobility and inertial impaction methods: Smoking machine and puff topography influence. Aerosol Sci. Technol 52, 1233–1248. [DOI] [PMC free article] [PubMed] [Google Scholar]
- (38).Gillman I, Kistler K, Stewart E, and Paolantonio A. (2016) Effect of variable power levels on the yield of total aerosol mass and formation of aldehydes in e-cigarette aerosols. Regul. Toxicol. Pharmacol. 75, 58–65. [DOI] [PubMed] [Google Scholar]
- (39).Manigrasso M, Buonanno G, Fuoco FC, Stabile L, and Avino P. (2015) Aerosol deposition doses in the human respiratory tree of electronic cigarette smokers. Environ. Pollut 196, 257–267. [DOI] [PubMed] [Google Scholar]
- (40).Zhang Y, Sumner W, and Chen D-R (2013) In vitro particle size distributions in electronic and conventional cigarette aerosols suggest comparable deposition patterns. Nicotine Tob. Res 15, 501–508. [DOI] [PubMed] [Google Scholar]
- (41).St Helen G, Havel C, Dempsey DA, Jacob P, and Benowitz NL (2016) Nicotine delivery, retention and pharmacokinetics from various electronic cigarettes. Addiction 111, 535–544. [DOI] [PMC free article] [PubMed] [Google Scholar]
- (42).Balásházy I, Hofmann W, and Heistracher T. (2003) Locaĺ particle deposition patterns may play a key role in the development of lung cancer. J. Appl. Physiol. 94, 1719–1725. [DOI] [PubMed] [Google Scholar]
- (43).Premarket Tobacco Product Applications for Electronic Nicotine Delivery Systems; Food and Drug Administration, Silver Spring, MD, 2016. [Google Scholar]
- (44).Johnson TJ, Olfert JS, Yurteri CU, Cabot R, and McAughey J. (2015) Hygroscopic effects on the mobility and mass of cigarette smoke particles. J. Aerosol Sci. 86, 69–78. [Google Scholar]
- (45).Broday DM, and Georgopoulos PG (2001) Growth and deposition of hygroscopic particulate matter in the human lungs. Aerosol Sci. Technol 34, 144–159. [Google Scholar]
- (46).Bernstein DM (2004) A review of the influence of particle size, puff volume, and inhalation pattern on the deposition of cigarette smoke particles in the respiratory tract. Inhalation Toxicol. 16, 675–689. [DOI] [PubMed] [Google Scholar]
- (47).Polydorova M. An attempt to determine the retention of tobacco smoke by means of membrane filters Inhaled Particles and Vapours; Pergamon Press: New York, 1961; pp 142–144. [Google Scholar]
- (48).Baumberger JP (1923) The amount of smoke produced from tobacco and its absorption in smoking as determined by electrical precipitation. J. Pharmacol. Exp. Ther 21, 47–57. [Google Scholar]
Associated Data
This section collects any data citations, data availability statements, or supplementary materials included in this article.