Abstract
High-energy (1–100 keV) electrons can coherently couple to plasmonic and dielectric nanostructures, creating cathodoluminescence (CL) of which the spectral features reveal details of the material’s resonant modes at a deep-subwavelength spatial resolution. While CL provides fundamental insight in optical modes, detecting its phase has remained elusive. Here, we use Fourier-transform CL holography to determine the far-field phase distribution of fields scattered from plasmonic nanoholes, nanocubes, and helical nanoapertures and reconstruct the angle-resolved phase distributions. From the derived fields, we derive the relative strength and phase of induced scattering dipoles. Fourier-transform CL holography opens up a new world of coherent light scattering and surface wave studies with nanoscale spatial resolution.
Keywords: cathodoluminescence, holography, transition radiation, plasmonics, nanoantennas, phase singularity
Cathodoluminescence (CL) spectroscopy is a unique technique to create and probe optical materials excitations at nanoscale spatial resolution.1 In coherent CL a sample is directly polarized by the time-varying electric fields carried by a high-energy (1–100 keV) electron beam.2,3 Each electron creates a single electromagnetic field cycle in the sample with a duration of a few hundred attoseconds with a corresponding frequency spectrum with energies in the 0–30 eV spectral range. The electron thus acts as a broadband source of optical excitation with a spatial resolution limited by the extent of its evanescent field (∼10 nm).4 The electron-induced polarization excitations can then decay by optical radiation (CL) that is collected in the far field.
CL spectroscopy directly probes the radiative local density of optical states, and spatial maps of the CL spectrum probe detailed information on optical modes in photonic nanostructures at deep-subwavelength spatial resolution.2,4−6 Several CL modalities have been developed recently: angle-resolved CL spectroscopy provides a direct measure of photonic bandstructures;3,4 CL polarimetry provides the full polarization state,7 and g(2)(τ) two-photon correlation spectroscopy provides quantum statistics of emitted CL photons.8,9 A key parameter in CL spectroscopy is measurement of the wavefront of the emitted light. Phase information is crucial to reconstruct the nature of the electron-induced polarization densities in CL spectroscopy and, in general, to control the structure of scattered optical wavefronts, which is key to many applications in imaging, integrated optics, optical computing, optical communication, and more.
Previously, we have studied the cathodoluminescence generated by plasmon polaritons scattered from nanoscale gratings in Ag and found it strongly interferes with transition radiation generated by the same electron.10 This interference directly represents the phase of the scattered fields, as recently also shown in ref (11). Fourier-transform CL holography can be used to determine from the measured interference pattern the far-field phase distribution of scattered fields with nanoscale spatial excitation resolution.12−14 Fourier-transform holography was previously applied in other fields.15−19 In our work we analyze the CL signal that originates from electron-beam excited surface plasmon polaritons (SPPs), hybrid light–matter waves that propagate in two dimensions at the interface between a metal and a dielectric. Their strong electric and magnetic fields confined to the interface provide unique ways to control light-matter interactions at the nanoscale. SPPs can carry information in miniature integrated circuits,20 enable efficient sensors,21 and couple efficiently to quantum emitters.22,23 In all these 2D-confined geometries, precise control over SPP scattering is essential in order to control coupling to the third dimension.
We use 30 keV electrons to excite SPPs that propagate at a Ag/SiOx interface and subsequently scatter by suitably designed plasmonic scatterers. The scattered light interferes with transition radiation (TR) that is excited by the same electron at the point of impact and that serves as a reference field with known phase and polarization.3,10,11,24 Applying Fourier-transform CL holography, we reconstruct the angle-resolved amplitude and phase distribution of the p-polarized scattered fields originating from a subwavelength hole in a Ag film. Applying the same technique to a single-crystal Ag nanocube (NC) deposited on the Ag/SiOx stack, which forms a gap plasmon resonance, we retrieve the π-phase jump for light scattered at frequencies across the resonance. Moreover, Fourier-transform CL holography reveals that helical nanoapertures made in a single-crystal gold surface convert SPPs to free-space waves with pronounced phase singularities. The measurements take advantage of the 10 nm spatial resolution of CL excitation spectroscopy, establishing Fourier-transform CL holography as a powerful deep-subwavelength technique to study scattering phenomena of surface waves and (resonant) nanostructures.
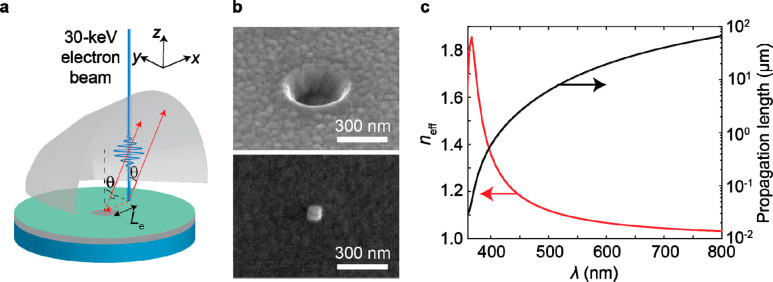
A 200 nm thick Ag film was deposited on a Si(100) substrate using thermal evaporation. Subsequently, a 15 nm thin SiOx film was deposited to avoid oxidation of the Ag film. Spectroscopic ellipsometry was used to characterize the optical constants and layer thicknesses (see section 1 of the Supporting Information). From these data we derived the SPP dispersion at the Ag/SiOx interface; the SPP mode effective index and the propagation length are shown in Figure 1c. Focused ion beam milling using 30 keV Ga ions was used to fabricate 300 nm diameter holes in the Ag/SiOx stack with a depth of 215 nm [see Figure 1b (top)]. On the same multilayer substrate, we drop-casted 75 nm sized single-crystalline Ag nanocubes [NCs; see Figure 1b (bottom)]. The NCs were made using the synthesis procedure as described in ref (25). This procedure leads to a highly monodisperse solution of Ag NCs that are functionalized by polyvinylpyrrolidone (PVP) ligands. Fabrication details on thin-film growth and chemical synthesis of Ag nanocubes are given in the Methods section. Focused ion beam milling using 30 keV Ga ions was used to fabricate helical nanoapertures on the (111) surface of polished single-crystalline Au. The helical nanoapertures have a diameter of 940 nm and a maximum depth of 570 nm.
Figure 1.
Cathodoluminescence geometry, Ag sample, and surface plasmon polariton dispersion. (a) Schematic of experiment. A 30-keV electron wave packet hits onto a SiOx (15 nm)/Ag (200 nm)/Si stack and generates broadband transition radiation (TR) and surface plasmon polaritons (SPP). The SPPs scatter from a nanohole, nanocube or nanohelix that is placed at a distance Le from the excitation point. One example of a TR trajectory toward the parabolic mirror under an angle θ is given as a red solid line. One example of a SPP trajectory is given as a combination of two red lines, where the dashed part is the path difference with respect to TR. Both TR and radiation from scattered SPPs are collimated by a parabolic mirror and projected onto a CCD array. (b) SEM images of 215 nm deep 300 nm diameter nanohole in the layer stack (top) and 75 nm Ag nanocube on the layer stack (bottom). (c) Effective index of SPP mode: Re(nSPP) and propagation length: 1/[2Im(k0nSPP)] of SPP mode derived from the optical constants obtained from spectroscopic ellipsometry of the layer stack.
CL experiments were performed using a scanning electron microscope (SEM, Vacc = 30 kV, I = 4 nA) equipped with an aluminum paraboloid mirror to collect CL. We use two measurement geometries: (1) angle-resolved, or Fourier, CL (ARCL) in which a wide zenithal and azimuthal angular emission pattern is collected over a wavelength range determined by a band-pass filter (λ = 600 ± 20 nm);26 and (2) hyperspectral angle-resolved cathodoluminescence (HSARCL) in which the angular distribution of CL intensity is collected in the vertical plane along the parabola’s center and analyzed with a spectrometer at 0.9 nm spectral resolution.27,28 Details of the CL geometry and spectroscopy are described in the Methods section.
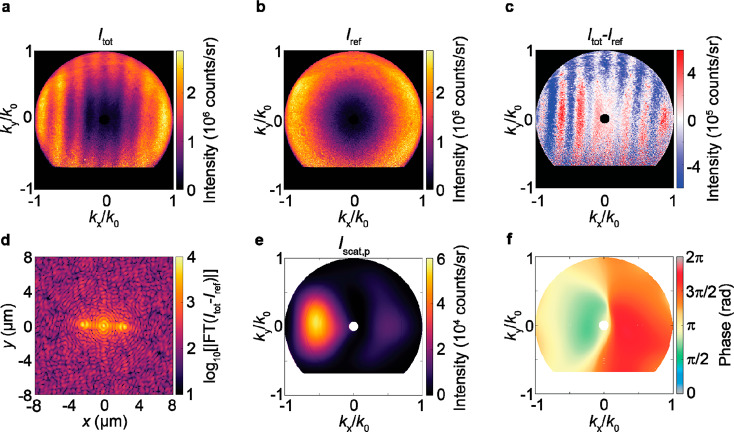
Figure 2a shows the ARCL intensity at λ = 600 nm for the electron beam placed Le = 2.29 μm away from the center of the nanohole. The electron beam is positioned on the right side of the nanohole, along the horizontal x axis crossing the center of the nanohole (see Figure 1a). A clear interference pattern is observed with fringes along the vertical ky direction.24Figure 2b shows the ARCL intensity at λ = 600 nm for the unstructured planar stack. A cylindrically symmetric transition radiation pattern is observed, with the highest intensity observed at larger zenithal angles as expected for a z-polarized dipole slightly above the multilayer stack that represents transition radiation. Subtracting the transition radiation reference from the data of Figure 2a results in a pronounced interference pattern, as shown in Figure 2c. The modulation depth of the fringes is 45% in the forward scattering direction and lower for backward scattering (see section 2 of Supporting Information on how we derived the visibility of the interference fringes). The lower visibility for backward scattering can partially be explained by the partial temporal coherence of light after passing through the bandpass filter. A bandpass filter filters out most frequency components of light, thereby effectively stretching the temporal signal. In the backward scattering direction the time delay between TR and the scattered SPPs is much larger than in the forward scattering direction, which leads to partially washing out interference fringes. The visibility can be enhanced by using a narrower bandpass filter, at the expense of signal intensity. Taking the 2D fast Fourier transform of the data presented in Figure 2c using k0 = 2π/λ results in Figure 2d (see section 3 of the Supporting Information for the convention used for the Fourier transform). Aside from a central spot two distinct spots are observed that are displaced 2.29 μm from the origin, in agreement with the distance between the electron beam and the center of the hole in the experiment. As shown in section 4 of the Supporting Information, these spots contain the interference terms, while the central spot represents the scattered intensity coming from individual scattering centers. Note that the electron beam can neither be placed too close, nor too far from the scattering object. When the electron beam is placed too close to the nanohole (<λ), no interference can be seen. When the electron beam is placed too far from the nanohole, the driving field from the SPPs has decreased too much which leads to a reduction of the interference visibility.
Figure 2.
Phase profiles for SPPs scattered from a nanohole in Ag. (a) Angle-resolved cathodoluminescence radiation pattern (λ= 600 ± 20 nm) obtained for a 30 keV electron beam placed 2.29 μm to the right of a 300 nm diameter nanohole. (b) Transition radiation from the same layer stack in the absence of nanoscatterer. (c) The difference in data presented in (a) and (b). (d) 2D fast Fourier transform of data presented in (c). (e) Numerically derived p-polarized amplitude pattern for the nanohole. (f) Numerically derived phase profile of p-polarized scattered field by the nanohole.
After isolating the interference term on the left in Figure 2d (see section 4 of Supporting Information for a detailed explanation and discussion of this numerical technique) and performing a 2D inverse fast Fourier transform, we retrieve the angular amplitude and phase patterns of the p-polarized scattered electric field Esc,p. The amplitude profile shown in Figure 2e shows a bright leftward-oriented lobe and a weak rightward lobe along the horizontal kx axis. Figure 2f shows the phase pattern which shows a π phase flip between left and right propagating fields, all relative to the phase of the spherical transition radiation wavefront which varies only very weakly (see section 5 of Supporting Information). This shows that the induced polarization density in the nanohole breaks cylindrical symmetry and has a strong in-plane component. This analysis now provides the full (p-polarized) electric field amplitude and phase of the field radiated by the SPP-driven nanohole.
As we have shown previously, nanoholes in metal films possess both electric and magnetic dipoles that interfere in the far field resulting in strong angular beaming from the hole.29,30 Using the amplitude and phase information from the analysis above, we can directly perform a multipolar decomposition of the scattered fields (for details on this calculation, see section 6 of Supporting Information). Given the small size of the hole we limit the multipolar decomposition to electric and magnetic dipoles and find that SPP excitation of the Ag nanohole induces mainly x- and z-polarized electric (px, pz) and y-polarized magnetic (my) dipoles.29 This is in full agreement with the fact that transverse-magnetic (TM)-polarized SPPs propagating along the x axis contain x and z electric field and y magnetic field components that directly couple to these three dipole moments. Figure 3a graphically presents the retrieved complex-valued dipole moments. We find that the phase difference ϕ between my and px is 0.5π, in full agreement with the Maxwell–Faraday relation that states that the current loop formed by the px dipole and its image dipole induces a π/2-phase-shifted magnetic field [∇ × E(r,ω) = iωμ0H(r,ω)]. The fact that small py and mx contributions are also found, despite the symmetry of the scattering problem, is ascribed to the fact that the parabolic mirror causes the far fields created by pz, py, and mx to be nonorthogonal (see Table S3). The excitation of pz then leads to small apparent py and mx components in the measurement. The asymmetric beaming of the scattered radiation (Figure 2e) is a direct consequence of the interference between the induced z-polarized electric dipole and the induced in-plane dipoles.30
Figure 3.
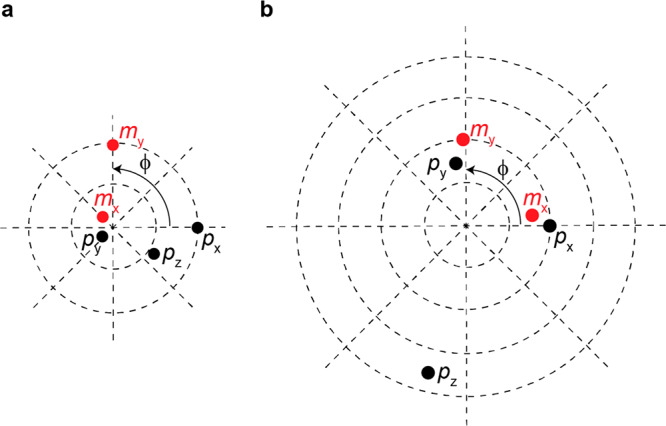
Multipole decomposition of the scattered field from CL holograpy data. Visualization of numerically retrieved values of electric (black) and magnetic (red) dipole moments. The amplitude of the dipoles is encoded in the radial distance to the center of the circle; the phase in the polar angle ϕ. (a) Electron beam is placed Le = 2.29 μm to the right of a nanohole. (b) Electron beam is placed Le = 2.29 μm to the right of the Ag nanocube.
Next, we performed HSARCL in which we measure the spectrally resolved angular radiation pattern in the plane defined by the surface normal and the ky axis in Figure 2a. We rotated the excitation scheme presented in Figure 1a by 90° clockwise, including the Cartesian coordinate system, so that the interference fringes can be measured. This measurement scheme allows probing fine details in the interference phenomena over a wide wavelength range, enabling derivation of the SPP dispersion as well as the phase distribution of the scatterer’s emission profile, as we will show. Figure 4a shows the CL dispersion diagram in the λ = 375–820 nm spectral band for the electron beam placed Le = 2.40 μm away from the center of the nanohole along the positive x axis. Subtracting the transition radiation reference data (Figure 4b), we find clear interference fringes over a broad wavelength range (Figure 4c). We model the dispersion relation of the maxima of the interference fringes by considering the constructive interference conditions in the far field taking into account the optical path lengths (k0nSPPLe, kxLe), with kx the in-plane wave vector of scattered light, and a phase term ϕscat related to scattering:
| 1 |
Figure 4.
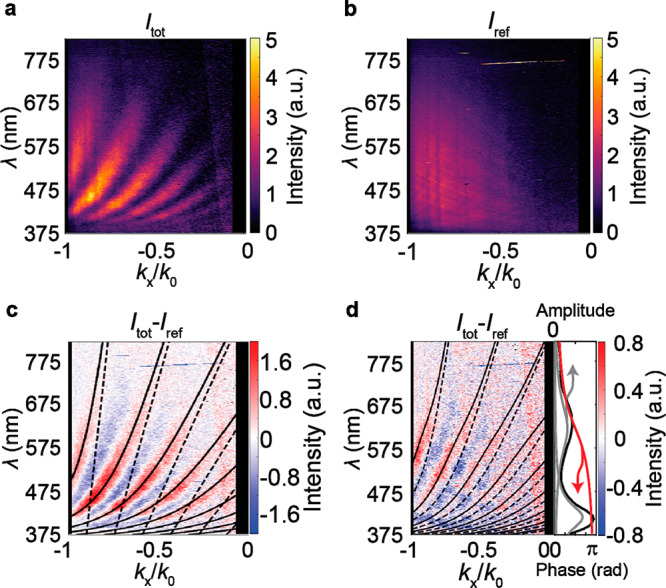
Plasmon dispersion and resonant scattering revealed with hyperspectral angle-resolved cathodoluminescence. (a) CL radiation pattern for electron beam placed Le = 2.40 μm to the right of the center of a nanohole (Itot). (b) Transition radiation pattern for the stack (Iref). The vertical black sections in (a) and (b) reflect the hole in the parabolic mirror through which the electron beam enters. (c) Difference of data presented in (a) and (b). Solid curve is fit to constructive interference wavelength λm given in eq 1. Dashed curve assumes a dispersionless surface wave. (d) Left: Itot – Iref for an electron beam placed Le = 2.37 μm to the right of a Ag nanocube. Solid curve is fit to a constructive interference condition, taking into account a Lorentzian scattering resonance. Dashed curve includes a dispersive surface wave and does not include the resonance. Right: Lorentzian resonance considered for fit (black curve, measured CL spectrum; red curve, fitted phase; gray curve, fitted amplitude).
The solid curves in Figure 4c are fits of this model to the data for different orders N; they fit the data very well over a broad spectral range, with N ranging from N = 1–5, all for the same scattering phase (ϕscat = 0.7π). The curvature of the solid curves clearly reflects the SPP dispersion; the dashed lines show the dispersionless case (nspp = 1) for reference. The largest deviation between the solid and the dashed curves occurs for shorter wavelengths, in agreement with the SPP dispersion shown in Figure 1c. The data in Figure 4a–c show that the scattering of SPPs by the nanohole is a nondispersive process in this wavelength range described by a fixed overall scattering phase of 0.7π.
Next, we investigate the scattering of SPPs by single-crystalline Ag NCs.31 It is known that NCs on a metal substrate with a thin dielectric spacer possess gap plasmon resonances in the visible spectral range.32 We collect ARCL data at λ = 600 nm using the same distance between electron impact position and the center of the NC of Le = 2.29 μm. Subtracting the transition radiation, we find the angular profile in Figure 5a. Clear interference fringes are observed, with a notable left/right asymmetry. To study this in more detail, we plot in Figure 5b the angular data averaged along the vertical angular axis for scattering from the hole and the NC. In both cases, the fringe amplitude is higher for negative than for positive kx values, which we relate to the left/right symmetry breaking by the off-center excitation in combination with the use of a bandpass filter (see section S2 of Supporting Information). Moreover, for the Ag NC, the maxima for positive kx values are phase-shifted compared to values for negative kx, while this phase shift is not observed for the hole. This reflects a fundamental difference in the SPPs scattering mechanism for NCs and nanoholes, as we will further illustrate below.
Figure 5.
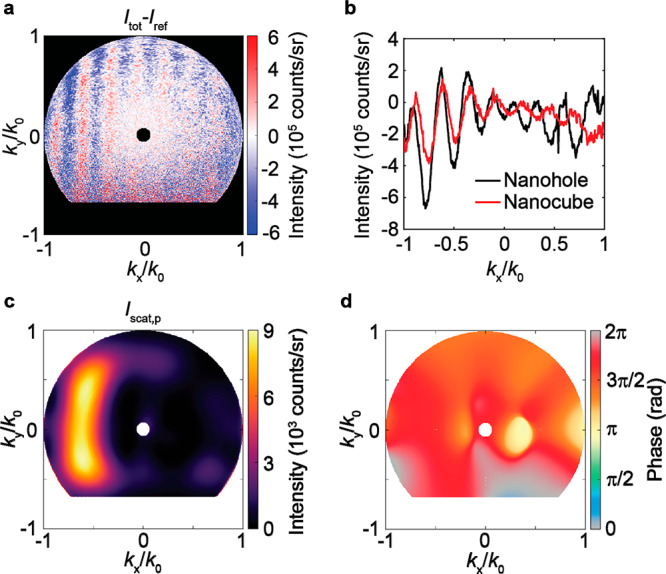
Angular intensity and phase profiles for SPPs scattered from a Ag nanocube. (a) Angle-resolved cathodoluminescence radiation pattern (λ = 600 ± 20 nm) corrected for transition radiation. (b) Interference fringes obtained by averaging data of Figures 2c and 5c along the ky/k0 axis. (c) Numerically derived p-polarized amplitude pattern for the nanocube. (d) Numerically derived phase profile of the p-polarized scattered field by the nanocube.
Using Fourier analysis, we retrieved both the amplitude (Figure 5c) and phase (Figure 5d) patterns of the p-polarized scattered electric field radiated by the Ag NC. As for the nanohole, we observe beaming of light to the left, which we partially attribute to the asymmetry in the excitation process and the resulting modal excitation. In contrast to the case of the hole, the phase profile is found to be quite homogeneous in angle, that is, the π-phase flip between left and right propagating fields, as was observed for scattering off the hole, is not observed here. Using the intensity and phase patterns, we perform a multipolar decomposition of the scattered fields (see section 6 of Supporting Information) and find that the main scattering contributions come from px, py, pz, mx, and my (see Figure 3b for the graphical representation of the retrieved complex-valued dipole moments). We find similar amplitudes for px and my and for py and mx, with a phase difference between electric and magnetic dipoles of 0.5π and −0.5π, respectively, again explained by the electric–magnetic dipole coupling argument described above for the nanohole. The nanoparticle shows a dominant z-polarized electric dipole mode, as expected for a plasmonic nanocube above a mirror with a dielectric spacer in between.33 By symmetry, the angular profile of the phase is expected to be symmetric, as is observed. The contrasting phase symmetries observed for hole and nanocube are clearly reflected in the shifted phase profiles for positive angles in Figure 5b.
Next, we present the HSARCL data for the Ag NC obtained by placing the electron beam at Le = 2.37 μm in Figure 4d. As for the nanoholes, we observe a clear interference pattern over a broad spectral range, with mode numbers N = 1–5. However, for the case of the NCs, the fringes do not match the dispersive SPP model indicated by the dashed curves. The discrepancy is a direct manifestation of the increasing phase shift between the induced polarization density and the plasmonic driving field as the wavelength is decreased across the scattering resonance. Figure 4d shows the CL spectrum of the Ag NC taken by directly placing the electron beam at a corner of the NC. As can be seen, the plasmon spectrum peaks at 620 nm with a full-width-at-half-maximum line width of 152 nm. Indeed, the largest discrepancy between the data in Figure 4d and the dispersive SPP model occurs for wavelengths below the resonance peak. To quantitatively analyze this trend, we fit the plasmon contribution to the CL spectrum with a single Lorentzian line shape and introduce the corresponding phase shift to the dispersion model (solid curve). Clearly, this resonant scattering model fits the trends in the CL data well for different values of N. This analysis clearly shows the power and sensitivity of CL holography to detect characteristic phase shifts in scattering.
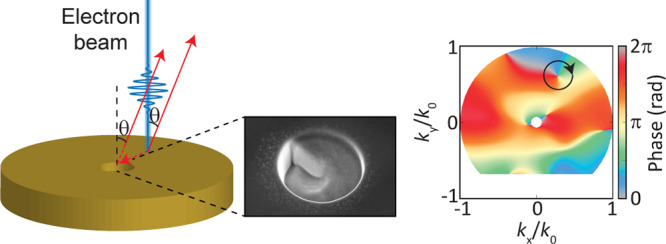
As a final demonstration of the power of CL holography we study SPP scattering from a helical nanoaperture in single-crystalline Au (Figure 6a). Figure 6b shows the ARCL intensity at λ = 600 nm for the electron beam placed Le = 2.29 μm away from the center of the nanohelix along the negative y-axis. A clear interference pattern is observed with fringes along the ky direction. Remarkably, we observe a clear fork-like structure around (kx/k0,ky/k0) = (0.25;0.60) pointing at the existence of a phase singularity in the far-field phase profile. The retrieved angle-dependent intensity and phase patterns of the scattered field are shown in Figure 6c and d, respectively. Figure 6c shows the radiation profile is strongly beamed in the forward direction. Figure 6d shows for (kx/k0,ky/k0) = (0.28;0.60) a phase singularity with topological charge −1, as the phase evolves once from 0 to 2π when turning clockwise around the phase singularity.
Figure 6.
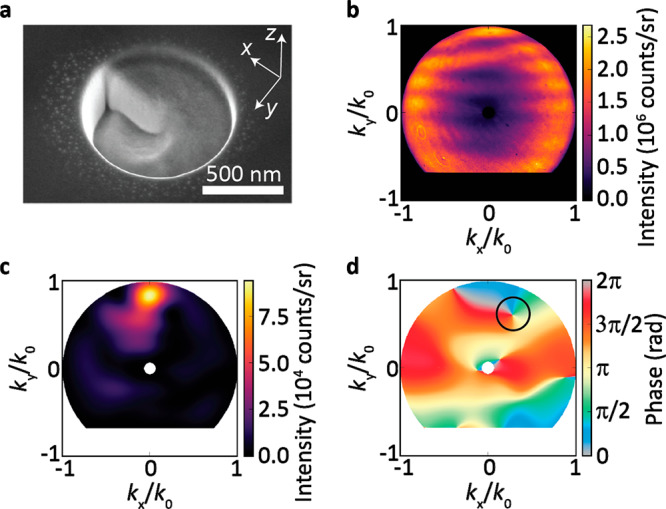
Phase singularity for SPPs scattered from a helical nanoaperture in Au. (a) SEM image of a helical nanoaperture milled in single-crystalline Au. (b) Angle-resolved cathodoluminescence radiation pattern (λ = 600 ± 20 nm) obtained for a 30 keV electron beam placed 2.29 μm from the helical nanoaperture along the negative y-axis. (c) Numerically derived p-polarized intensity pattern for the helical nanoaperture. (d) Numerically derived phase profile of p-polarized scattered field by the helical nanoaperture (indicated by circle) showing phase singularity with topological charge −1.
We have used Fourier-transform cathodoluminescence holography to directly retrieve the phase of surface plasmon polaritons scattered from nanoscale holes, nanocubes, and nanohelices. From the data, we retrieve the phase and amplitude of the 3D vectorial electric and magnetic dipole moments that interfere to create the measured scattering pattern. The spectral phase jump across a plasmonic scattering resonance is directly revealed from the data and we directly observe phase singularities in the scattering of plasmonic nanohelices. Fourier-transform cathodoluminescence holography can find many further applications to probe scattering of surface waves and other guided waves from nanoscale objects at high precision.
Methods
Fabrication of Multilayer Stack
A layer stack of 200 nm Ag and 15 nm SiOx was made by thermal evaporation. Ag was deposited at a base pressure of 1.6 × 10⁻⁶ mbar and a deposition rate of 2 Å/s. For the SiOx layer, we used SiOx as the target, a deposition rate of 0.6 Å/s, and a base pressure of 9.3 × 10⁻⁷ mbar.
Synthesis of Ag Nanocubes
The Ag nanocubes were synthesized by adopting a chemical synthesis procedure reported earlier.34 Well-defined (100)-faceted Ag cubes of ∼75 nm were made in solution, filtrated, and dispersed in ethanol, and then dropcast onto the multilayer stack.
Fabrication of Nanohelices
A total of 30 keV Ga focused ion beam milling of nanohelices was performed using serpentine scans at a current of 1.5 pA and a pixel dwell time of 1.5 μs. The structure was made in 60 passes, each pass taking 667 ms.
CL Measurement Geometries
CL experiments were performed using a Thermo Fisher 650 Quanta SEM equipped with a thermionic Schottky field emission electron source, operated at 30 kV, and a typical beam current on the sample of 4 nA. The CL is collected with an aluminum paraboloid mirror (1.47π sr acceptance angle), of which the focus is aligned with respect to the electron beam and the sample using a motorized micropositioning stage inside the vacuum chamber. The CL signal is analyzed using a Delmic SPARC system equipped with a 2048 × 512 pixel back-illuminated CCD array mounted on a Czerny-Turner spectrograph. We perform two different types of CL experiments:
1. Angle-Resolved CL (ARCL)
In this geometry, the spectrometer slit is fully opened (15 mm) and a planar aluminum mirror is selected on the turret in the spectrograph. The reflected light is projected onto the CCD camera. In this way, we acquire a full angular pattern/momentum distribution within the NA of the paraboloid collection optics. Wavelength specificity is attained with a band-pass filter (λ = 600 ± 20 nm).
2. Hyperspectral Angle-Resolved Cathodoluminescence (HSARCL)
The entrance slit is closed to 150 μm and acts as a filter in angular/momentum space, selecting the radiation in the vertical plane along the paraboloid optical axis. This angular emission pattern is dispersed by the diffraction grating in the spectrometer, leading to a hybrid 2D CCD image with a wavelength on the horizontal axis and an angle on the vertical axis. This map is converted into a wavelength (λ) and momentum (k) map by applying the appropriate coordinate transform.
Acknowledgments
We gratefully acknowledge Bob Drent for help with the fabrication of the multilayer stack, Dimitri Lamers for FIB nanofabrication, and Toon Coenen for insightful discussions. This work is part of the research program of AMOLF, which is partly financed by the Dutch Research Council (NWO). This project has received funding from the European Research Council (ERC) under the European Union’s Horizon 2020 research and innovation programme (Grant Agreement No. 695343) and an NWO VIDI Grant (Project Number 14846).
Supporting Information Available
The Supporting Information is available free of charge at https://pubs.acs.org/doi/10.1021/acsphotonics.0c00209.
Optical constants of the stack, angle-dependent visibility of interference fringes, definition of Fourier transform, numerical algorithm to retrieve amplitude and phase information on the scattered field, far-field phase profile of transition radiation, multipole expansion, and an additional example of surface plasmon scattering by a hole (PDF)
The authors declare the following competing financial interest(s): A.P. is co-founder and co-owner of Delmic BV, a company that produces the cathodoluminescence system that was used in this work.
Supplementary Material
References
- Polman A.; Kociak M.; García de Abajo F. J. Electron-Beam Spectroscopy for Nanophotonics. Nat. Mater. 2019, 18 (11), 1158–1171. 10.1038/s41563-019-0409-1. [DOI] [PubMed] [Google Scholar]
- García de Abajo F. J. Optical Excitations in Electron Microscopy. Rev. Mod. Phys. 2010, 82 (1), 209–275. 10.1103/RevModPhys.82.209. [DOI] [Google Scholar]
- Brenny B. J. M.; Polman A.; García de Abajo F. J. Femtosecond Plasmon and Photon Wave Packets Excited by a High-Energy Electron on a Metal or Dielectric Surface. Phys. Rev. B: Condens. Matter Mater. Phys. 2016, 94 (15), 15. 10.1103/PhysRevB.94.155412. [DOI] [Google Scholar]
- Schefold J.; Meuret S.; Schilder N.; Coenen T.; Agrawal H.; Garnett E. C.; Polman A. Spatial Resolution of Coherent Cathodoluminescence Super-Resolution Microscopy. ACS Photonics 2019, 6 (4), 1067–1072. 10.1021/acsphotonics.9b00164. [DOI] [PMC free article] [PubMed] [Google Scholar]
- Sapienza R.; Coenen T.; Renger J.; Kuttge M.; van Hulst N. F.; Polman A. Deep-Subwavelength Imaging of the Modal Dispersion of Light. Nat. Mater. 2012, 11 (9), 781–787. 10.1038/nmat3402. [DOI] [PubMed] [Google Scholar]
- Peng S.; Schilder N. J.; Ni X.; Van De Groep J.; Brongersma M. L.; Alù A.; Khanikaev A. B.; Atwater H. A.; Polman A. Probing the Band Structure of Topological Silicon Photonic Lattices in the Visible Spectrum. Phys. Rev. Lett. 2019, 122 (11), 117401. 10.1103/PhysRevLett.122.117401. [DOI] [PubMed] [Google Scholar]
- Osorio C. I.; Coenen T.; Brenny B. J. M.; Polman A.; Koenderink A. F. Angle-Resolved Cathodoluminescence Imaging Polarimetry. ACS Photonics 2016, 3 (1), 147–154. 10.1021/acsphotonics.5b00596. [DOI] [Google Scholar]
- Meuret S.; Tizei L. H. G.; Cazimajou T.; Bourrellier R.; Chang H. C.; Treussart F.; Kociak M. Photon Bunching in Cathodoluminescence. Phys. Rev. Lett. 2015, 114 (19), 1–17. 10.1103/PhysRevLett.114.197401. [DOI] [PubMed] [Google Scholar]
- Meuret S.; Coenen T.; Zeijlemaker H.; Latzel M.; Christiansen S.; Conesa-Boj S.; Polman A. Photon Bunching Reveals Single-Electron Cathodoluminescence Excitation Efficiency in InGaN Quantum Wells. Phys. Rev. B: Condens. Matter Mater. Phys. 2017, 96 (3), 1–8. 10.1103/PhysRevB.96.035308. [DOI] [Google Scholar]
- Kuttge M.; Vesseur E. J. R.; Koenderink A. F.; Lezec H. J.; Atwater H. A.; Garcia de Abajo F. J.; Polman A. Local Density of States, Spectrum, and Far-Field Interference of Surface Plasmon Polaritons Probed by Cathodoluminescence. Phys. Rev. B: Condens. Matter Mater. Phys. 2009, 79 (11), 2–5. 10.1103/PhysRevB.79.113405. [DOI] [Google Scholar]
- Sannomiya T.; Konečná A.; Matsukata T.; Thollar Z.; Okamoto T.; García De Abajo F. J.; Yamamoto N. Cathodoluminescence Phase Extraction of the Coupling between Nanoparticles and Surface Plasmon Polaritons. Nano Lett. 2020, 20 (1), 592–598. 10.1021/acs.nanolett.9b04335. [DOI] [PubMed] [Google Scholar]
- Stroke G. W. Lensless Fourier-Transform Method for Optical Holography. Appl. Phys. Lett. 1965, 6 (10), 201–203. 10.1063/1.1754131. [DOI] [Google Scholar]
- Kim M. K. Principles and Techniques of Digital Holographic Microscopy. J. Photonics Energy 2010, 1 (1), 018005. 10.1117/6.0000006. [DOI] [Google Scholar]
- Röhrich R.; Hoekmeijer C.; Osorio C. I.; Koenderink A. F. Quantifying Single Plasmonic Nanostructure Far-Fields with Interferometric and Polarimetric K-Space Microscopy. Light: Sci. Appl. 2018, 7 (65), 1–12. 10.1038/s41377-018-0059-0. [DOI] [PMC free article] [PubMed] [Google Scholar]
- Harp G. R.; Saldin D. K.; Tonner B. P. Atomic-Resolution Electron Holography in Solids with Localized Sources. Phys. Rev. Lett. 1990, 65 (8), 1012–1015. 10.1103/PhysRevLett.65.1012. [DOI] [PubMed] [Google Scholar]
- Harp G. R.; Saldin D. K.; Tonner B. P. Scanned-Angle X-Ray Photoemission Holography with Atomic Resolution. Phys. Rev. B: Condens. Matter Mater. Phys. 1990, 42 (14), 9199–9202. 10.1103/PhysRevB.42.9199. [DOI] [PubMed] [Google Scholar]
- Tegze M.; Faigel G. X-Ray Holography with Atomic Resolution. Nature 1996, 380 (6569), 49–51. 10.1038/380049a0. [DOI] [Google Scholar]
- Tegze M.; Faigel G.; Marchesini S.; Belakhovsky M.; Ulrich O. Structure Resolution: Imaging Light Atoms by X-Ray Holography. Nature 2000, 407 (6800), 38. 10.1038/35024153. [DOI] [PubMed] [Google Scholar]
- Sur B.; Rogge R. B.; Hammond R. P.; Anghel V. N. P.; Katsaras J. Atomic Structure Holography Using Thermal Neutrons. Nature 2001, 414 (6863), 525–527. 10.1038/35107026. [DOI] [PubMed] [Google Scholar]
- Fang Y.; Sun M. Nanoplasmonic Waveguides: Towards Applications in Integrated Nanophotonic Circuits. Light: Sci. Appl. 2015, 4, 1–11. 10.1038/lsa.2015.67. [DOI] [Google Scholar]
- Zijlstra P.; Paulo P. M. R.; Orrit M. Optical Detection of Single Non-Absorbing Molecules Using the Surface Plasmon Resonance of a Gold Nanorod. Nat. Nanotechnol. 2012, 7 (6), 379–382. 10.1038/nnano.2012.51. [DOI] [PubMed] [Google Scholar]
- Akimov A. V.; Mukherjee A.; Yu C. L.; Chang D. E.; Zibrov A. S.; Hemmer P. R.; Park H.; Lukin M. D. Generation of Single Optical Plasmons in Metallic Nanowires Coupled to Quantum Dots. Nature 2007, 450 (7168), 402–406. 10.1038/nature06230. [DOI] [PubMed] [Google Scholar]
- Bouchet D.; Lhuillier E.; Ithurria S.; Gulinatti A.; Rech I.; Carminati R.; De Wilde Y.; Krachmalnicoff V. Correlated Blinking of Fluorescent Emitters Mediated by Single Plasmons. Phys. Rev. A: At., Mol., Opt. Phys. 2017, 95 (3), 3. 10.1103/PhysRevA.95.033828. [DOI] [Google Scholar]
- Ravets S.; Rodier J. C.; Ea Kim B.; Hugonin J. P.; Jacubowiez L.; Lalanne P. Surface Plasmons in the Young Slit Doublet Experiment. J. Opt. Soc. Am. B 2009, 26 (12), B28. 10.1364/JOSAB.26.000B28. [DOI] [Google Scholar]
- Tao A.; Sinsermsuksakul P.; Yang P. Polyhedral Silver Nanocrystals with Distinct Scattering Signatures. Angew. Chem., Int. Ed. 2006, 45 (25), 4597–4601. 10.1002/anie.200601277. [DOI] [PubMed] [Google Scholar]
- Coenen T.; Vesseur E. J. R.; Polman A. Angle-Resolved Cathodoluminescence Spectroscopy. Appl. Phys. Lett. 2011, 99 (14), 143103. 10.1063/1.3644985. [DOI] [PubMed] [Google Scholar]
- Mignuzzi S.; Mota M.; Coenen T.; Li Y.; Mihai A. P.; Petrov P. K.; Oulton R. F. M.; Maier S. A.; Sapienza R. Energy-Momentum Cathodoluminescence Spectroscopy of Dielectric Nanostructures. ACS Photonics 2018, 5 (4), 1381–1387. 10.1021/acsphotonics.7b01404. [DOI] [Google Scholar]
- Coenen T.; Polman A. Energy-Momentum Cathodoluminescence Imaging of Anisotropic Directionality in Elliptical Aluminum Plasmonic Bullseye Antennas. ACS Photonics 2019, 6 (2), 573–580. 10.1021/acsphotonics.8b01711. [DOI] [Google Scholar]
- Rotenberg N.; Krijger T. L.; Le Feber B.; Spasenović M.; García de Abajo F. J.; Kuipers L. Magnetic and Electric Response of Single Subwavelength Holes. Phys. Rev. B: Condens. Matter Mater. Phys. 2013, 88 (24), 24. 10.1103/PhysRevB.88.241408. [DOI] [Google Scholar]
- Coenen T.; Polman A. Optical Properties of Single Plasmonic Holes Probed with Local Electron Beam Excitation. ACS Nano 2014, 8 (7), 7350–7358. 10.1021/nn502469r. [DOI] [PubMed] [Google Scholar]
- Coenen T.; Bernal Arango F.; Koenderink A. F.; Polman A. Directional Emission from a Single Plasmonic Scatterer. Nat. Commun. 2014, 5, 3250. 10.1038/ncomms4250. [DOI] [PubMed] [Google Scholar]
- Takahara J.; Yamagishi S.; Taki H.; Morimoto A.; Kobayashi T. Guiding of a One-Dimensional Optical Beam with Nanometer Diameter. Opt. Lett. 1997, 22 (7), 475. 10.1364/OL.22.000475. [DOI] [PubMed] [Google Scholar]
- Chikkaraddy R.; Zheng X.; Benz F.; Brooks L. J.; De Nijs B.; Carnegie C.; Kleemann M.; Mertens J.; Bowman R. W.; Vandenbosch G. A. E.; Moshchalkov V. V; Baumberg J. J. How Ultranarrow Gap Symmetries Control Plasmonic Nanocavity Modes: From Cubes to Spheres in the Nanoparticle-on-Mirror. ACS Photonics 2017, 4, 469. 10.1021/acsphotonics.6b00908. [DOI] [Google Scholar]
- Sun Y.; Xia Y. Shape-Controlled Synthesis of Gold and Silver Nanoparticles. Science (Washington, DC, U. S.) 2002, 298 (5601), 2176–2179. 10.1126/science.1077229. [DOI] [PubMed] [Google Scholar]
Associated Data
This section collects any data citations, data availability statements, or supplementary materials included in this article.


