

Abstract
Background
Liver cancer is one of the most common cancers in the world. The primary aim of this research was to discover the correlation between single nucleotide polymorphisms (SNPs) of the MIR155HG and liver cancer risk.
Methods
The selected SNPs in MIR155HG were genotyped utilizing the Agena MassARRAY platform. We evaluated the correlation between MIR155HG polymorphisms and Liver cancer by genetic model analysis, stratification analysis and haplotype analysis. Relative risk of Liver cancer was shown based on odds ratios (ORs) and 95% confidence intervals (95% CIs).
Results
Our results uncovered that rs12482371 and rs1893650 in the MIR155HG were associated with protection against Liver cancer. And the rs928883 was related to increase risk of Liver cancer. Furthermore, apart from rs77218221, other selected SNPs formed two LD blocks, and haplotype “GATAG” in block 2 elevated individual liver cancer risk.
Conclusions
MIR155HG gene polymorphism may be correlated to Liver cancer susceptibility in Han Chinese population, particularly in males and aged ≤55 years.
Keywords: Liver cancer, MIR155HG, Single nucleotide polymorphisms (SNPs), Case-control study
Background
Globally, Liver cancer is a common malignancy and the second leading cause of cancer death worldwide [1], accounting for 466,100 new patients and 422,100 deaths per year in China [2]. The major type of Liver cancer (70-80%) is hepatocellular carcinoma (HCC), followed by intrahepatic cholangio carcinoma [3]. Among all cancers in China, liver cancer had poorest survival with a 5-year relative survival rate of only 10.1% [4]. Due to the difficulty of early diagnosis, most of the patients are identified at an advanced stage with numerous lesions and extrahepatic metastasis. Moreover, as a highly aggressive malignancy with rapid progression, Liver cancer is difficult to control because of low selectivity and limited chemotherapeutic drugs [5]. So there is urgent need to better understand the potential mechanism of cancer development, especially in Chinese people. Liver cancer is a complex process, associated with many factors and co-factors. Hepatitis B virus (HBV) is commonly accepted to contribute to be the leading cause of Liver cancer [6, 7]. Occupational and environmental factors, such as certain metabolic Liver diseases and cirrhosis, have also been reported to contribute to the incidence of Liver cancer [8]. In addition, similarly with the breast cancer and glioma [9, 10], the occurrence of Liver cancer is also influenced by genetic factors, and the associations have been proved in many studies [11–13]. For example, Kumar V et al. found that genetic variant rs2596542 located in the 5′ flanking region of MICA was strongly linked to HCV-induced hepatocellular carcinoma [14]. Zhang H et al. identified that internal polymorphism locus rs17401966 in KIF1B gene was highly correlated with HBV- associated HCC [15].
Long noncoding RNAs (lncRNAs) have no coding protein potential with a length of more than 200 nucleotides. They have been mistaken for genetic dark matter for a Long time. However, in recent years, studies have confirmed that such RNAs participate in a variety of regulation in biological activities, such as transcriptional inhibition and post-transcriptional regulation [16]. MIR155HG is a typical lncRNA, known as B-cell Integration Cluster (BIC) [17]. This gene located on chromosome 21 of human. Tam subsequently proved that it is encoded in a highly conserved region of the third exon of the BIC [18]. In addition, miR-155 expression is closely related to tumor. Xuechao Wu et al. revealed that MIR155HG can promote the development of glioma, and showed cancer-promoting activity by expressing miR-155-5p/−3p [19]. Siqi Chen et al. discovered that host miR-155 activates tumor growth via a myeloid-derived mechanism of inhibiting cell-dependence [20]. Given the importance of MIR155HG in glioma, we hypothesized that germline genetic variants within MIR155HG would influence the course of Liver cancer. As the most common genetic variation, single nucleotide polymorphisms (SNPs) can influence the development of diseases by influencing gene expression and its function. Therefore, we conducted a case-control study to discover the effects of genetic polymorphisms in MIR155HG on liver cancer susceptibility in Han Chinese population.
Methods
Study participants
A total of 432 liver cancer cases were recruited from the Shaanxi University of Chinese Medicine from August 2017 to December 2018. The inclusion criteria for eligible case were newly diagnosed primary liver cancer patients and histologically confirmed by at least two pathologists. The exclusion criteria for patients were family history of non-liver cancer, or any other malignancy and digestive diseases, such as hepatitis and cirrhosis of the liver. None of the patients received any treatment before blood collection. During the same period, 430 healthy controls were randomly enrolled from the same hospital’s physical examination center. The exclusion criteria of controls were family history of liver cancer more than three generations and chronic digestive disease. All participants were Han Chinese and there was no blood relationship between each participant.
DNA extraction
Blood samples from each participant were drawn and stored with ethylenediamine tetraacetic acid (EDTA) at − 80 °C. Genomic DNA was extracted from peripheral blood using the GoldMag extraction method (GoldMag Co Ltd., Xi’an, China). The quality of DNA samples was detected by the NanoDrop 2000 (Thermo Scientifc, Waltham, Massachusetts, USA).
SNPs selection and genotyping
The genetic information of the SNPs was obtained from dbSNP database and 1000 Genomes database (http://www.internationalgenome.org/). Only the variant with minor allele frequency (MAFs) > 5% in Asian population are eligible in this study in order to achieve adequate statistical power. Therefore, we finally picked up eight candidate polymorphisms (rs4143370, rs77218221, rs12482371, rs77699734, rs11911469, rs1893650, rs34904192, and rs928883) to perform analysis in Chinese Han population. According to Agena online software, the primers for the eight related sites were designed (Supplementary Table 1). SNPs were genotyped by Agena MassARRAY RS1000 (Agena, San Diego, CA, U.S.A.) (Supplementary Table 2) [21].
Statistical analysis
We applied SPSS version 19.0 (SPSS, Chicago, IL, USA) and Microsoft Excel software for statistical analysis. Hardy-Weinberg equilibrium in controls was determined via χ2 test [22]. The distribution differences were evaluated using the chi-square test for sex and independent sample student’s t test for age between cases and controls. The odds ratio (OR) values and 95% confidence intervals (CIs) were calculated to assess the relationships between MIR155HG polymorphisms and liver cancer risk [23]. The influence of SNPs in the MIR155H on individual liver cancer risk was assessed by four genetic model analyses (genotype, dominant, recessive and log-additive) through PLINK software (Version 1.07). Further, we conducted stratification analysis by both age and sex. Then, statistical power of each SNP was examined through the online software (http://sampsize.sourceforge.net/iface/s3.html#ccp) in our research. Finally, the Haploview software package (version 4.2) was used to assess the linkage disequilibrium (LD) and performed haplotype analysis.
Results
Characteristics of the participants
We selected 432 liver cancer cases and 430 healthy controls in this research. The case group included 344 males and 88 females. The control group included 342 males and 88 females. The average age among cases and controls was 55.09 ± 11.59 years and 55.22 ± 10.73 years, respectively. The demographic characteristics of the case and control groups were listed in Table 1. The statistical analysis results manifested that age and gender between two groups had no statistically significant difference (p > .05).
Table 1.
Characteristics of patients with liver cancer and controls
| Characteristics | Cases n = 432 |
Controls n = 430 |
p-value |
|---|---|---|---|
| Age, years | 55.09 ± 11.59 | 55.22 ± 10.73 | 0.972a |
| > 55 | 209 | 185 | |
| ≤ 55 | 223 | 245 | |
| Gender | 0.861b | ||
| Male | 344 | 342 | |
| Female | 88 | 88 |
ap values were calculated by Student’s t tests
bp values were calculated from two-sided chi-square tests
The associations between MIR155HG and liver cancer
Basic information of candidate SNPs in the MIR155HG were listed in Table 2, including chromosomal position, allele, minimum allele frequency (MAF), HWE test results and the p value of allele model analysis. All the selected SNPs met HWE (p > 0.05). We evaluated the risk of gene polymorphism in the allele model by chi-squared test, and found that there were no associations between the SNPs and the risk of Liver cancer with all p > 0.05.
Table 2.
Basic information about the candidate SNPs in this study
| SNP ID | Chr.Position | Alleles | MAF | p-HWE | OR (95%CI) | p-value | |
|---|---|---|---|---|---|---|---|
| (minor/major) | Cases | Controls | |||||
| rs4143370 | 21:25564661 | C/G | 0.169 | 0.154 | 0.715 | 1.12 (0.86 - 1.44) | 0.407 |
| rs77218221 | 21:25565063 | C/T | 0.047 | 0.046 | 0.613 | 1.02 (0.66 - 1.60) | 0.918 |
| rs12482371 | 21:25566041 | C/T | 0.284 | 0.317 | 0.095 | 0.85 (0.69 - 1.05) | 0.125 |
| rs77699734 | 21:25566995 | C/G | 0.074 | 0.095 | 0.784 | 0.76 (0.54 - 1.07) | 0.120 |
| rs11911469 | 21:25567971 | A/C | 0.122 | 0.107 | 0.804 | 1.16 (0.86 - 1.56) | 0.334 |
| rs1893650 | 21:25568503 | C/T | 0.182 | 0.196 | 0.879 | 0.91 (0.72 - 1.16) | 0.447 |
| rs34904192 | 21:25569623 | A/G | 0.238 | 0.248 | 0.438 | 0.95 (0.76 - 1.18) | 0.634 |
| rs928883 | 21:25571713 | A/G | 0.494 | 0.454 | 0.624 | 1.18 (0.97 - 1.42) | 0.099 |
CI confidence interval, HWE Hardy–Weinberg equilibrium, MAF minor allele frequency; p-HWE < 0.01 indicates imbalance, OR odds ratio, SNP single-nucleotide polymorphism
*p < 0.05 indicates statistical significance
*p < 0.00625 (0.05/8) indicates statistical significance for Bonferroni correction
As shown in Table 3, four genetic models (codominant, dominant, recessive, and additive genetic models) were applied to analyze the correlation between SNPs and liver cancer. For each variation, the minor allele was a risk factor when compared to the wild-type (major) allele in the genetic model. Our results found that rs12482371 in MIR155HG was associated with a 0.56-fold decrease in risk for Liver cancer under genotype model (adjusted, OR = 0.56, p = 0.022 for the “C/C” genotype) and a 0.55-fold decreased in risk for Liver cancer under recessive model (adjusted, OR = 0.55, p = 0.015 for the “C/C” genotype). The rs1893650 in MIR155HG was associated with a 0.35-fold decrease in risk for liver cancer under genotype model (adjusted, OR = 0.35, p = 0.030 for the “C/C” genotype) and a 0.34-fold decreased in risk for Liver cancer under recessive model (adjusted, OR = 0.34, p = 0.026 for the “C/C” genotype). The rs928883 in MIR155HG was associated with a 1.71-fold increase in risk for Liver cancer under genotype model (adjusted, OR = 1.71, p = 0.001 for the “A/G” genotype) and a 1.60-fold increase in risk for Liver cancer under dominant model (adjusted, OR = 1.60, p = 0.003 for the “A/G-A/A” genotype). We have found no other SNPs on MIR155HG associated with the susceptibility to Liver cancer risk, either uncorrected or adjusted for age and sex.
Table 3.
Relationships between MIR155HG polymorphism and liver cancer risk
| SNP ID | Model | Genotype | Case (number) | Control (number) | Before adjusted | After adjusted | Power | ||
|---|---|---|---|---|---|---|---|---|---|
| OR (95%CI) | pa | OR (95%CI) | pb | ||||||
| rs12482371 | Genotype | TT | 217 | 208 | 1.00 | 1.00 | 68.97% | ||
| CT | 185 | 171 | 1.04 (0.78 - 1.38) | 0.801 | 1.04 (0.78 - 1.37) | 0.801 | |||
| CC | 30 | 51 | 0.56 (0.35 - 0.92) | 0.022* | 0.56 (0.35 - 0.92) | 0.022* | |||
| Dominant | TT | 217 | 208 | 1.00 | 1.00 | ||||
| CT-CC | 215 | 222 | 0.93 (0.71 - 1.21) | 0.585 | 0.93 (0.71 - 1.21) | 0.586 | |||
| Recessive | TT-CT | 402 | 379 | 1.00 | 1.00 | ||||
| CC | 30 | 51 | 0.55 (0.35 - 0.89) | 0.014* | 0.55 (0.35 - 0.89) | 0.015* | |||
| Log-additive | – | – | – | 0.85 (0.70 - 1.05) | 0.129 | 0.85 (0.70 - 1.05) | 0.129 | ||
| rs1893650 | Genotype | TT | 281 | 279 | 1.00 | 1.00 | 63.95% | ||
| CT | 145 | 135 | 1.07 (0.80 - 1.42) | 0.661 | 1.07 (0.80 - 1.42) | 0.663 | |||
| CC | 6 | 17 | 0.35 (0.14 - 0.90) | 0.030* | 0.35 (0.14 - 0.90) | 0.030* | |||
| Dominant | TT | 281 | 279 | 1.00 | 1.00 | ||||
| CT-CC | 151 | 152 | 0.99 (0.75 - 1.30) | 0.923 | 0.99 (0.75 - 1.3) | 0.922 | |||
| Recessive | TT-CT | 426 | 414 | 1.00 | 1.00 | ||||
| CC | 6 | 17 | 0.34 (0.13 - 0.88) | 0.026* | 0.34 (0.13 - 0.88) | 0.026* | |||
| Log-additive | – | – | – | 0.91 (0.71 - 1.16) | 0.433 | 0.90 (0.71 - 1.16) | 0.432 | ||
| rs928883 | Genotype | GG | 90 | 129 | 1.00 | 1.00 | 97.12% | ||
| AG | 244 | 204 | 1.71 (1.24 - 2.38) | 0.001* | 1.71 (1.24 - 2.38) | 0.001* | |||
| AA | 85 | 90 | 1.35 (0.91 - 2.02) | 0.138 | 1.35 (0.9 - 2.02) | 0.141 | |||
| Dominant | GG | 90 | 129 | 1.00 | 1.00 | ||||
| AG-AA | 329 | 294 | 1.60 (1.17 - 2.19) | 0.003* | 1.60 (1.17 - 2.19) | 0.003* | |||
| Recessive | GG-AG | 334 | 333 | 1.00 | 1.00 | ||||
| AA | 85 | 90 | 0.94 (0.67 - 1.31) | 0.723 | 0.94 (0.67 - 1.31) | 0.716 | |||
| Log-additive | – | – | – | 1.19 (0.97 - 1.45) | 0.088 | 1.19 (0.97 - 1.45) | 0.090 | ||
OR odds ratio, SNP single-nucleotide polymorphism, 95% CI 95% confidence interval. ap values were calculated from unconditional logistic regression analysis. bp values were adjusted by age and gender
*p < 0.05 indicates statistical significance
*p < 0.0002 (0.05/8/4) indicates statistical significance for Bonferroni correction
Statistical power of rs12482371, rs1893650, rs928883 was estimated through the online software (http://sampsize.sourceforge.net/iface/s3.html#ccp), which were related to liver cancer risk in our research. The powers for rs12482371, rs1893650, rs928883 were 68.97, 63.95, and 97.12%, achieved a certain statistical power.
Stratification analysis of age and sex
Next, stratification analysis by age or gender was carried out to evaluate the influence of these candidate SNPs on liver cancer risk (Table 4). The stratification analysis of sex revealed the associations between three SNPs and Liver cancer risk. Two loci (rs12482371 and rs1893650) decreasing risk of Liver cancer in male under genotype model (rs12482371, CC vs T/T, OR = 0.51, p = 0.016; rs1893650, CC vs TT, OR = 0.32, p = 0.030) and recessive model (rs12482371, C/C vs T/T-C/T, OR = 0.52, p = 0.018; rs1893650, CC vs T/T-C/T, OR = 0.32, p = 0.030). Rs928883 was observed to increase Liver cancer risk under genotype model (AG vs GG, OR = 1.95, p = 0.000) and dominant model (AG-AA vs GG, OR = 1.74, p = 0.002). No statistical correlations were found in female in any genetic model.
Table 4.
The relationship of three gene polymorphisms with liver cancer according to the stratification by gender and age
| SNP | Model | Genotype | Male | Female | > 55 | ≤55 | ||||
|---|---|---|---|---|---|---|---|---|---|---|
| OR (95%CI) | p | OR (95%CI) | p | OR (95%CI) | p | OR (95%CI) | p | |||
| rs12482371 | Allele | T | 1.00 | 1.00 | 1.00 | 1.00 | ||||
| C | 0.79 (0.63 - 1.00) | 0.046 | 1.11 (0.71 - 1.76) | 0.642 | 0.88 (0.65 - 1.19) | 0.410 | 0.81 (0.61 - 1.08) | 0.155 | ||
| Genotype | TT | 1.00 | 1.00 | 1.00 | 1.00 | |||||
| CT | 0.93 (0.68 - 1.28) | 0.651 | 1.55 (0.83 - 2.92) | 0.170 | 1.08 (0.71 - 1.65) | 0.718 | 0.97 (0.66 - 1.43) | 0.895 | ||
| CC | 0.51 (0.29 - 0.88) | 0.016* | 0.82 (0.29 - 2.36) | 0.716 | 0.60 (0.30 - 1.21) | 0.156 | 0.52 (0.26 - 1.04) | 0.063 | ||
| Dominant | TT | 1.00 | 1.00 | 1.00 | 1.00 | |||||
| CT-CC | 0.83 (0.62 - 1.13) | 0.236 | 1.38 (0.76 - 2.49) | 0.293 | 0.97 (0.65 - 1.44) | 0.871 | 0.87 (0.60 - 1.26) | 0.460 | ||
| Recessive | TT-CT | 1.00 | 1.00 | 1.00 | 1.00 | |||||
| CC | 0.52 (0.31 - 0.90) | 0.018* | 0.67 (0.24 - 1.86) | 0.448 | 0.58 (0.30 - 1.14) | 0.112 | 0.52 (0.27 - 1.03) | 0.059 | ||
| Log-additive | – | 0.79 (0.63 - 1.00) | 0.049 | 1.11 (0.71 - 1.74) | 0.648 | 0.88 (0.65 - 1.19) | 0.395 | 0.82 (0.62 - 1.08) | 0.161 | |
| rs1893650 | Allele | T | 1.00 | 1.00 | 1.00 | 1.00 | ||||
| C | 0.85 (0.65 - 1.11) | 0.224 | 1.22 (0.70 - 2.12) | 0.481 | 1.01 (0.71 - 1.44) | 0.956 | 0.82 (0.59 - 1.15) | 0.252 | ||
| Genotype | TT | 1.00 | 1.00 | 1.00 | 1.00 | |||||
| CT | 0.99 (0.71 - 1.36) | 0.929 | 1.43 (0.75 - 2.72) | 0.279 | 1.13 (0.74 - 1.73) | 0.577 | 1.00 (0.67 - 1.48) | 0.984 | ||
| CC | 0.32 (0.11 - 0.90) | 0.030* | 0.55 (0.05 - 6.25) | 0.627 | 0.66 (0.20 - 2.14) | 0.491 | 0.10 (0.01 - 0.80) | 0.030* | ||
| Dominant | TT | 1.00 | 1.00 | 1.00 | 1.00 | |||||
| CT-CC | 0.91 (0.66 - 1.24) | 0.537 | 1.36 (0.72 - 2.56) | 0.339 | 1.08 (0.71 - 1.63) | 0.719 | 0.89 (0.61 - 1.32) | 0.570 | ||
| Recessive | TT-CT | 1.00 | 1.00 | 1.00 | 1.00 | |||||
| CC | 0.32 (0.12 - 0.90) | 0.030* | 0.49 (0.04 - 5.51) | 0.560 | 0.63 (0.20 - 2.04) | 0.445 | 0.10 (0.01 - 0.79) | 0.029* | ||
| Log-additive | – | 0.84 (0.64-1.11) | 0.212 | 1.24 (0.69 - 2.23) | 0.464 | 1.01 (0.71 - 1.46) | 0.941 | 0.80 (0.56 - 1.13) | 0.206 | |
| rs928883 | Allele | G | 1.00 | 1.00 | 1.00 | 1.00 | ||||
| A | 1.17 (0.94 - 1.45) | 0.155 | 1.20 (0.78-1.83) | 0.406 | 1.12 (0.85 - 1.49) | 0.420 | 1.22 (0.94 - 1.59) | 0.130 | ||
| Genotype | GG | 1.00 | 1.00 | 1.00 | 1.00 | |||||
| AG | 1.95 (1.34 - 2.82) | 0.000* | 1.11 (0.55 - 2.23) | 0.766 | 1.84 (1.14 - 2.98) | 0.013* | 1.62 (1.03 - 2.55) | 0.036* | ||
| AA | 1.34 (0.86 - 2.09) | 0.203 | 1.54 (0.62 - 3.87) | 0.356 | 1.20 (0.66 - 2.17) | 0.547 | 1.53 (0.88 - 2.65) | 0.130 | ||
| Dominant | GG | 1.00 | 1.00 | 1.00 | 1.00 | |||||
| AG-AA | 1.74 (1.23 - 2.48) | 0.002* | 1.20 (0.62 - 2.34) | 0.588 | 1.63 (1.03 - 2.58) | 0.036* | 1.59 (1.04 - 2.45) | 0.034* | ||
| Recessive | GG-AG | 1.00 | 1.00 | 1.00 | 1.00 | |||||
| AA | 0.85 (0.59 - 1.23) | 0.399 | 1.44 (0.65 - 3.19) | 0.370 | 0.80 (0.49 - 1.31) | 0.373 | 1.10 (0.70 - 1.74) | 0.671 | ||
| Log-additive | – | 1.18 (0.95 - 1.47) | 0.144 | 1.22 (0.78 - 1.92) | 0.381 | 1.13 (0.84 - 1.52) | 0.408 | 1.25 (0.95 - 1.65) | 0.106 | |
OR odds ratio, 95%CI 95% confidence interval
Bold indicates statistical significance (p < 0.05)
*p < 0.00625 (0.05/8) indicates statistical significance for Bonferroni correction
Furthermore, we conducted the stratification analysis of age. At age > 55 years group and age ≤ 55 years group, we found that MIR155HG rs928883 added Liver cancer risk under genotype model (AG vs GG: age > 55 years group: OR = 1.84, p = 0.013; age ≤ 55 years group: OR = 1.62, p = 0.036) and dominant model (AG-AA vs GG: age > 55 years group: OR = 1.63, p = 0.036; age ≤ 55 years group: OR = 1.59, p = 0.034). For MIR155HG rs1893650, we only found that MIR155HG rs1893650 reduced Liver cancer risk in age ≤ 55 years under genotype model (CC vs TT, OR = 0.10, p = 0.030) and recessive model (CC vs TT-CT, OR = 0.10, p = 0.029).
Haplotype analyses
LD construction and haplotype analyses of these SNPs were performed in cases and controls. All SNPs existed in two LD blocks (Block 1: rs4143370 and rs12482371; Block 2: rs77699734, rs11911469, rs1893650, rs34904192 and rs928883) in MIR155HG (Fig. 1). Haplotype “GATAG” in Block 2 increased the risk of liver cancer (OR = 1.44, p = 0.047) (Table 5). However, we didn’t find a significant correlation between the other haplotypes and Liver cancer risk.
Fig. 1.
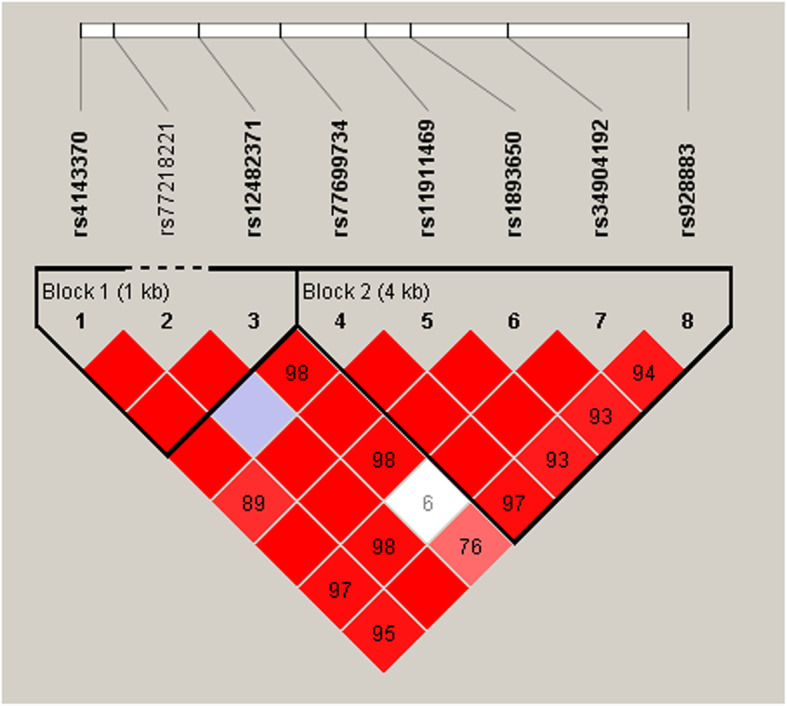
Linkage disequilibrium (LD) plots containing SNPs from MIR155HG
Table 5.
Haplotype analysis results in this study
| Block | Haplotype | Frequency | OR (95%CI) | p | |
|---|---|---|---|---|---|
| Case | Control | ||||
| Block 1 | rs4143370|rs12482371 | ||||
| GT | 0.284 | 0.317 | 0.85 (0.70 - 1.05) | 0.129 | |
| CC | 0.831 | 0.845 | 0.9 (0.70 - 1.16) | 0.424 | |
| GC | 0.548 | 0.528 | 1.08 (0.90 - 1.31) | 0.414 | |
| Block 2 | rs77699734|rs11911469|rs1893650|rs34904192|rs928883 | ||||
| CATGA | 0.527 | 0.554 | 0.9 (0.74 - 1.09) | 0.267 | |
| GATAG | 0.932 | 0.905 | 1.44 (1.01 - 2.06) | 0.047* | |
| CATAG | 0.850 | 0.849 | 1.01 (0.78 - 1.32) | 0.932 | |
| CACGG | 0.172 | 0.190 | 0.87 (0.68 - 1.13) | 0.311 | |
| CCTGG | 0.116 | 0.106 | 1.12 (0.82 - 1.52) | 0.477 | |
OR odds ratio, pa adjusted by gender and age, SNP single nucleotide polymorphism, 95% CI 95% confidence interval
Bold indicates statistical significance (p < 0.05)
Discussion
In this study, we assessed the associations of selected SNPs in MIR155HG with liver cancer susceptibility in the Han Chinese population. We demonstrated that MIR155HG genetic polymorphisms are correlated with liver cancer risk among Han Chinese individuals. Our findings uncovered that rs12482371 and rs1893650 in MIR155HG were related to reduce Liver cancer risk, and rs928883 increased Liver cancer risk. Furthermore, apart from the rs77218221, other selected SNPs could form two LD blocks. Haplotype “GATAG” in Block 2 was found to elevate the liver cancer risk. These results indicated the importance of MIR155HG gene polymorphism in liver cancer development among the Han Chinese population.
Non-coding RNAs are non-protein encoding transcripts closely related to gene transcription, epigenetic regulation and protein translation, which include miRNAs, piwiRNAs and long non-coding RNAs (lncRNAs). Previous studies have confirmed the functional interaction between lncRNA and miRNA, as well as the fact that some lncRNAs themselves may encode miRNAs [24]. The dis-regulation of miR-155 can affect cancer development [25]. The increased expression of miR-155 accompanied by the occurrence of several cancers such as glioma, breast cancer, lung cancer and gastric cancer has been established recently [26, 27]. Therefore, targeting miR-155 is considered a promising method for the treatment of hematopoietic and solid tumors. MIR155HG was the primary micro (mi)RNA of miR-155 [18]. However, underlying mechanisms of host miR-155 in modulating tumor growth are still poorly understood. Xuechao Wu et al. demonstrated that MIR155HG was an independent adverse prognostic factor in glioma. And its repression inhibited glioma growth in vitro and in vivo [19]. Veerakumar Balasubramaniyan et al. raised that targeting MIR155HG can be a novel approach in glioma [28]. And miR-155 is a transcriptional product of its host gene (MIR155HG), the genetic variation of MIR155HG gene and miR-155 gene may affected its expression [29].
To date, however, there were no studies focusing on the influence of MIR155HG genetic variations on liver cancer risk. Our findings suggest that our hypothesis that MIR155HG polymorphisms were related to liver cancer risk in Chinese is correct. Our results showed that rs12482371 and rs1893650 in the MIR155HG were associated with protection from Liver cancer. And the rs928883 was connected with an added risk of Liver cancer. One research found that the allele “C” of rs12482371 and rs1893650, and the allele “A” of rs928883 in MIR155HG were correlated to colorectal cancer risk [30]. Moreover, the sites selected in this study are existed in the intron region of MIR155HG. This is consistent with our recent understanding of introns. Introns are no longer what we traditionally think of as meaningless. Studies have shown that it can influence transcription level by affecting transcription rate, nuclear output and transcription stability, and also can improve the efficiency of mRNA translation [31]. Although the specific mechanism of rs12482371, rs1893650, and rs928883 on the MIR155HG affecting liver cancer is unclear, it is worthwhile to reveal the correlation between the SNPs and liver cancer susceptibility. Meanwhile, our results will be helpful for the prevention and early detection of Liver cancer and give theoretical basis.
There are several limitations to consider in the current study. Our research is fundamental, and it does not performed experiments to investigate the expression of miR-155 and its predicted targets. So, the exact molecular mechanism by which SNP alters the expression of MIR155HG needs to be clarified in future work.
Conclusions
To sum up, our research first demonstrated that MIR155HG gene polymorphisms were correlated with the susceptibility to Liver cancer among Han Chinese population, in particular males and age ≤ 55 years old.
Supplementary information
Additional file 1: Table 1. PCR primer for this study
Additional file 2: Table 2. the Genetic polymorphisms of eight locus in 432 liver cancer cases and 430 healthy controls
Acknowledgements
We thank all of the participants for their involvement in this study. We are very grateful to the clinicians and other hospital staff for providing blood samples and data collection for this study.
Abbreviations
- SNPs
Single nucleotide polymorphisms
- miRNA-155 HG
miRNA-155 host gene
- OR
Odds ratio
- CI
Confidence interval
- MAF
Minor allele frequency
- EDTA
Ethylenediamine tetraacetic acid
- HWE
Hardy–Weinberg equilibrium
- LD
Linkage disequilibrium
- HCC
Hepatocellular carcinoma
- HBV
Hepatitis B virus
- LncRNAs
Long noncoding RNAs
Authors’ contributions
XC conceived and designed the experiments. XPW, HLS and YNC performed genotyping experiment. HL and YWW extracted the DNA. LLW, HYS, and QZ completed the statistical analysis. XC and XSF wrote the manuscript. All authors approved the final manuscript.
Funding
This research was supported by the National Natural Science Foundation of China (No. 81774132) and Subject Innovation Team of the Shaanxi University of Chinese Medicine (No. 2019-YS05), which helped us in financial.
Availability of data and materials
All data generated or analysed during this study are included in this published article and its supplementary information files.
Ethics approval and consent to participate
This study was conducted in compliance with the Declaration of Helsinki, and approved by the Research Ethics Committee of the Shaanxi University of Chinese Medicine. Written informed consent was obtained from all participants before taking part in this research. The design and performance of this study involving human subjects were implemented in accordance with the approved guidelines.
Consent for publication
Not Applicable.
Competing interests
None.
Footnotes
Publisher’s Note
Springer Nature remains neutral with regard to jurisdictional claims in published maps and institutional affiliations.
Xu Chao and Xuesong Feng are Joint first author.
Contributor Information
Xu Chao, Email: chaoxu2004@126.com.
Xuesong Feng, Email: 325470777@qq.com.
Xiaoping Wang, Email: 120145557@qq.com.
Hailong Shi, Email: 361523244@qq.com.
Hong Li, Email: szefyy.lh@163.com.
Yuewen Wang, Email: wyw_100@163.com.
Lanlan Wang, Email: 1273231929@qq.com.
Haiyu Shen, Email: 940456206@qq.com.
Qing Zha, Email: 1605261821@qq.com.
Yanni Chen, Email: 601658610@qq.com.
Supplementary information
Supplementary information accompanies this paper at 10.1186/s12881-020-01064-4.
References
- 1.Torre LA, Bray F, Siegel RL, Ferlay J, Lortet-Tieulent J, Jemal A. Global cancer statistics, 2012. CA Cancer J Clin. 2015;65(2):87–108. doi: 10.3322/caac.21262. [DOI] [PubMed] [Google Scholar]
- 2.Chen W, Zheng R, Baade PD, Zhang S, Zeng H, Bray F, Jemal A, Yu XQ, He J. Cancer statistics in China, 2015. CA Cancer J Clin. 2016;66(2):115–132. doi: 10.3322/caac.21338. [DOI] [PubMed] [Google Scholar]
- 3.de Jong MC, Nathan H, Sotiropoulos GC, Paul A, Alexandrescu S, Marques H, Pulitano C, Barroso E, Clary BM, Aldrighetti L, et al. Intrahepatic cholangiocarcinoma: an international multi-institutional analysis of prognostic factors and lymph node assessment. J Clin Oncol. 2011;29(23):3140–3145. doi: 10.1200/JCO.2011.35.6519. [DOI] [PubMed] [Google Scholar]
- 4.Zeng H, Zheng R, Guo Y, Zhang S, Zou X, Wang N, Zhang L, Tang J, Chen J, Wei K, et al. Cancer survival in China, 2003-2005: a population-based study. Int J Cancer. 2015;136(8):1921–1930. doi: 10.1002/ijc.29227. [DOI] [PubMed] [Google Scholar]
- 5.Fu J, Wang H. Precision diagnosis and treatment of liver cancer in China. Cancer Lett. 2018;412:283–288. doi: 10.1016/j.canlet.2017.10.008. [DOI] [PubMed] [Google Scholar]
- 6.Levrero M, Zucman-Rossi J. Mechanisms of HBV-induced hepatocellular carcinoma. J Hepatol. 2016;64(1 Suppl):S84–s101. doi: 10.1016/j.jhep.2016.02.021. [DOI] [PubMed] [Google Scholar]
- 7.Wen J, Song C, Jiang D, Jin T, Dai J, Zhu L, An J, Liu Y, Ma S, Qin N, et al. Hepatitis B virus genotype, mutations, human leukocyte antigen polymorphisms and their interactions in hepatocellular carcinoma: a multi-Centre case-control study. Sci Rep. 2015;5:16489. doi: 10.1038/srep16489. [DOI] [PMC free article] [PubMed] [Google Scholar]
- 8.McGlynn KA, Petrick JL, London WT. Global epidemiology of hepatocellular carcinoma: an emphasis on demographic and regional variability. Clin Liver Dis. 2015;19(2):223–238. doi: 10.1016/j.cld.2015.01.001. [DOI] [PMC free article] [PubMed] [Google Scholar]
- 9.Li G, Zhang Z, Tu Y, Jin T, Liang H, Cui G, He S, Gao G. Correlation of microRNA-372 upregulation with poor prognosis in human glioma. Diagn Pathol. 2013;8:1. doi: 10.1186/1746-1596-8-S1-S1. [DOI] [PMC free article] [PubMed] [Google Scholar]
- 10.Xia P, Li B, Geng T, Deng Z, Dang C, Chang D, Kang L, Jin T, Chen C. FGFR2 gene polymorphisms are associated with breast cancer risk in the Han Chinese population. Am J Cancer Res. 2015;5(5):1854–1861. [PMC free article] [PubMed] [Google Scholar]
- 11.Li Y, Sun X, Zhan SH, Gao YQ, Xin YN. Xuan SY: [research progress of single-nucleotide polymorphism in theTM6SF2 rs58542926] Zhonghua Gan Zang Bing Za Zhi. 2019;27(3):223–226. doi: 10.3760/cma.j.issn.1007-3418.2019.03.012. [DOI] [PMC free article] [PubMed] [Google Scholar]
- 12.Yadegar A, Mohabati Mobarez A, Zali MR. Genetic diversity and amino acid sequence polymorphism in helicobacter pylori CagL hypervariable motif and its association with virulence markers and gastroduodenal diseases. Cancer Med. 2019;8(4):1619–1632. doi: 10.1002/cam4.1941. [DOI] [PMC free article] [PubMed] [Google Scholar]
- 13.Dondeti MF, El-Maadawy EA, Talaat RM. Hepatitis-related hepatocellular carcinoma: insights into cytokine gene polymorphisms. World J Gastroenterol. 2016;22(30):6800–6816. doi: 10.3748/wjg.v22.i30.6800. [DOI] [PMC free article] [PubMed] [Google Scholar]
- 14.Kumar V, Kato N, Urabe Y, Takahashi A, Muroyama R, Hosono N, Otsuka M, Tateishi R, Omata M, Nakagawa H, et al. Genome-wide association study identifies a susceptibility locus for HCV-induced hepatocellular carcinoma. Nat Genet. 2011;43(5):455–458. doi: 10.1038/ng.809. [DOI] [PubMed] [Google Scholar]
- 15.Zhang H, Zhai Y, Hu Z, Wu C, Qian J, Jia W, Ma F, Huang W, Yu L, Yue W, et al. Genome-wide association study identifies 1p36.22 as a new susceptibility locus for hepatocellular carcinoma in chronic hepatitis B virus carriers. Nat Genet. 2010;42(9):755–758. doi: 10.1038/ng.638. [DOI] [PubMed] [Google Scholar]
- 16.Yoon JH, Abdelmohsen K, Gorospe M. Posttranscriptional gene regulation by long noncoding RNA. J Mol Biol. 2013;425(19):3723–3730. doi: 10.1016/j.jmb.2012.11.024. [DOI] [PMC free article] [PubMed] [Google Scholar]
- 17.Tam W, Ben-Yehuda D. Hayward WS: bic, a novel gene activated by proviral insertions in avian leukosis virus-induced lymphomas, is likely to function through its noncoding RNA. Mol Cell Biol. 1997;17(3):1490–1502. doi: 10.1128/MCB.17.3.1490. [DOI] [PMC free article] [PubMed] [Google Scholar]
- 18.Tam W. Identification and characterization of human BIC, a gene on chromosome 21 that encodes a noncoding RNA. Gene. 2001;274(1-2):157–167. doi: 10.1016/S0378-1119(01)00612-6. [DOI] [PubMed] [Google Scholar]
- 19.Wu X, Wang Y, Yu T, Nie E, Hu Q, Wu W, Zhi T, Jiang K, Wang X, Lu X, et al. Blocking MIR155HG/miR-155 axis inhibits mesenchymal transition in glioma. Neuro Oncol. 2017;19(9):1195–1205. doi: 10.1093/neuonc/nox017. [DOI] [PMC free article] [PubMed] [Google Scholar]
- 20.Yu F, Jia X, Du F, Wang J, Wang Y, Ai W. Fan D: miR-155-deficient bone marrow promotes tumor metastasis. Mol Cancer Res. 2013;11(8):923–936. doi: 10.1158/1541-7786.MCR-12-0686. [DOI] [PMC free article] [PubMed] [Google Scholar]
- 21.Gabriel S, Ziaugra L, Tabbaa D. SNP genotyping using the Sequenom MassARRAY iPLEX platform. Curr Protoc Hum Genet. 2009;2:2–12. doi: 10.1002/0471142905.hg0212s60. [DOI] [PubMed] [Google Scholar]
- 22.Adamec C. Example of the use of the nonparametric test. Test X2 for comparison of 2 independent examples. Cesk Zdrav. 1964;12:613–619. [PubMed] [Google Scholar]
- 23.Bland JM, Altman DG. Statistics notes. The odds ratio. BMJ. 2000;320(7247):1468. doi: 10.1136/bmj.320.7247.1468. [DOI] [PMC free article] [PubMed] [Google Scholar]
- 24.Briggs JA, Wolvetang EJ, Mattick JS, Rinn JL, Barry G. Mechanisms of long non-coding RNAs in mammalian nervous system development, plasticity, disease, and evolution. Neuron. 2015;88(5):861–877. doi: 10.1016/j.neuron.2015.09.045. [DOI] [PubMed] [Google Scholar]
- 25.Tili E, Croce CM. Michaille JJ: miR-155: on the crosstalk between inflammation and cancer. Int Rev Immunol. 2009;28(5):264–284. doi: 10.1080/08830180903093796. [DOI] [PubMed] [Google Scholar]
- 26.O'Connell RM, Rao DS, Chaudhuri AA, Baltimore D. Physiological and pathological roles for microRNAs in the immune system. Nat Rev Immunol. 2010;10(2):111–122. doi: 10.1038/nri2708. [DOI] [PubMed] [Google Scholar]
- 27.Volinia S, Calin GA, Liu CG, Ambs S, Cimmino A, Petrocca F, Visone R, Iorio M, Roldo C, Ferracin M, et al. A microRNA expression signature of human solid tumors defines cancer gene targets. Proc Natl Acad Sci U S A. 2006;103(7):2257–2261. doi: 10.1073/pnas.0510565103. [DOI] [PMC free article] [PubMed] [Google Scholar]
- 28.Balasubramaniyan V, Bhat KP. Targeting MIR155HG in glioma: a novel approach. Neuro Oncol. 2017;19(9):1152–1153. doi: 10.1093/neuonc/nox095. [DOI] [PMC free article] [PubMed] [Google Scholar]
- 29.Tao H, Cui L, Li Y, Zhou X, Ma G, Yao L, Fu J, Li W, Cai Y, Zhou H, et al. Association of tag SNPs and rare CNVs of the MIR155HG/miR-155 gene with epilepsy in the Chinese Han population. Biomed Res Int. 2015;2015:837213. doi: 10.1155/2015/837213. [DOI] [PMC free article] [PubMed] [Google Scholar]
- 30.Wu H, He G, Han H, Xiong W, Song T, Chen H, Chen X, Wu X, Huang G, Zhang Y, et al. Analysis of MIR155HG variants and colorectal cancer susceptibility in Han Chinese population. Mol Genet Genom Med. 2019;7(8):e778. doi: 10.1002/mgg3.778. [DOI] [PMC free article] [PubMed] [Google Scholar]
- 31.Shaul O. How introns enhance gene expression. Int J Biochem Cell Biol. 2017;91(Pt B):145–155. doi: 10.1016/j.biocel.2017.06.016. [DOI] [PubMed] [Google Scholar]
Associated Data
This section collects any data citations, data availability statements, or supplementary materials included in this article.
Supplementary Materials
Additional file 1: Table 1. PCR primer for this study
Additional file 2: Table 2. the Genetic polymorphisms of eight locus in 432 liver cancer cases and 430 healthy controls
Data Availability Statement
All data generated or analysed during this study are included in this published article and its supplementary information files.