

Abstract
Over a dozen morphologically and physiologically distinct primary somatosensory neuron subtypes report salient features of our internal and external environments. How specialized gene expression programs emerge during development to endow somatosensory neuron subtypes with their unique properties is unclear. To assess the developmental progression of transcriptional maturation of each principal somatosensory neuron subtype, we generated a transcriptomic atlas of cells traversing the primary somatosensory neuron lineage. We found that somatosensory neurogenesis gives rise to neurons in a transcriptionally unspecialized state, characterized by co-expression of transcription factors (TFs) that become restricted to select subtypes as development proceeds. Single cell transcriptomic analyses of sensory neurons from mutant mice lacking TFs suggest that these broad-to-restricted TFs coordinate subtype-specific gene expression programs in the subtypes where their expression is maintained. We also define a role for neuronal targets for TF expression as disruption of the prototypic target-derived neurotrophic factor NGF leads to aberrant subtype-restricted patterns of TF expression. Our findings support a model in which cues emanating from intermediate and final target fields promote neuronal diversification in part by transitioning cells from a transcriptionally unspecialized state to transcriptionally distinct subtypes through modulating selection of subtype-restricted TFs.
Decades of analyses have revealed more than a dozen functionally distinct somatosensory neuron subtypes of the dorsal root ganglia (DRG) that collectively enable detection of a broad range of salient features of the external world1–4. A fundamental question in sensory and developmental biology is how somatosensory neuron subtypes acquire their characteristic physiological, morphological, and synaptic properties during development, enabling animals to detect and respond to innocuous and noxious thermal, chemical, and mechanical stimuli. Classical studies of embryonic development indicate that migrating multipotent neural crest progenitors, originating from the dorsal neural tube, populate nascent DRGs5. During ganglia formation, dedicated progenitors that express either Neurog1 (neurogenin-1) or Neurog2 (neurogenin-2) are proposed to give rise to distinct somatosensory neuron subtypes6, which then innervate peripheral target fields where they form morphologically distinct axonal ending types1. Current models of somatosensory neuron development have primarily been inferred from studies analyzing changes in expression of individual genes or axonal ending types in loss-of-function models1,7,8. Here, we use genome-wide transcriptomic analyses coupled with molecular genetic approaches to define transcriptional mechanisms of somatosensory neuron subtype diversification.
scRNA-seq of somatosensory neurons
To begin to define transcriptional cascades underlying somatosensory neuron subtype specification, we performed single-cell RNA sequencing (scRNA-seq) at embryonic day 11.5 (E11.5), which is shortly after DRG formation, and at critical developmental milestones during somatosensory neuron development: at E12.5, when virtually all DRG neurons are post-mitotic9 and have extended axons well into the periphery; at E15.5, when peripheral and central target fields of somatosensory neurons are being innervated10,11; at P0, when maturation of sensory neuron endings within the skin and other targets is occuring12,13; at P5, when peripheral endings have mostly refined into their mature morphological states and central projection terminals are properly organized within select spinal cord laminae8,14,15; and in early adulthood (P28–42) (Figure 1A, Extended Data Figure 1A–F). We first examined primary sensory neurons residing in young adult DRGs obtained from all axial levels (Figure 1A, Extended Data Figure 1A). Principal component analysis (PCA) and t-distributed stochastic neighbor embedding (t-SNE) were used to cluster adult DRG neurons based on the similarity of their transcriptomes (Figure 1A). Each cluster was classified as a subtype based on prior studies that have described markers and functions for individual somatosensory neuron subtypes, in situ analysis confirmation, and by comparison to scRNA-seq generated from adult trigeminal ganglia (Methods, Extended Data Figure 2A–B, 3A–D, Extended Data Table 1). These cell type classifications are consistent with previously published RNA-seq findings of adult DRG and trigeminal ganglia16–19.
Figure 1. scRNA-seq of developing and mature DRG sensory neurons.
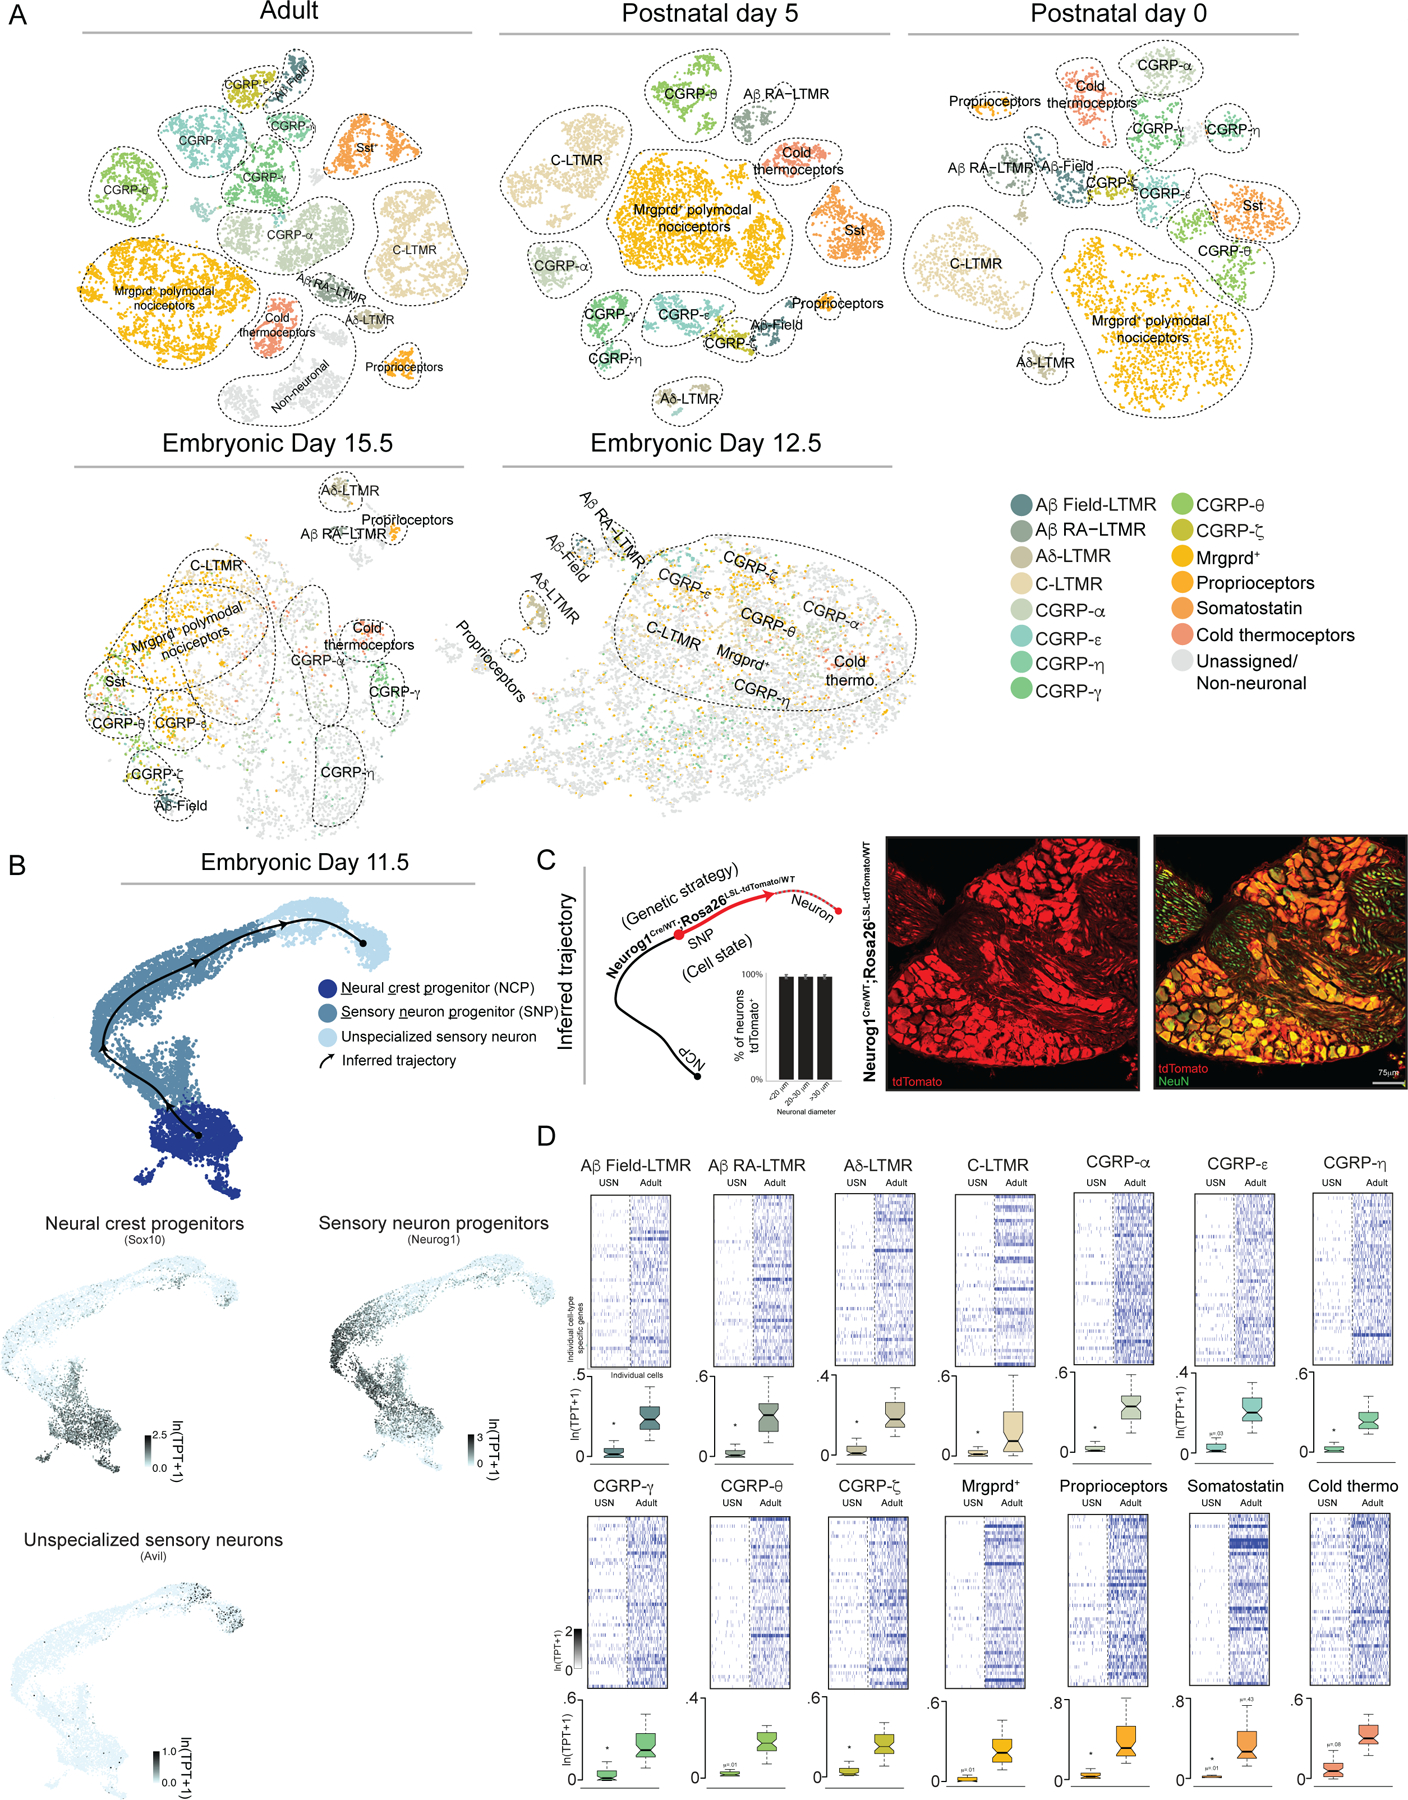
a. t-SNE visualizations DRG scRNA-seq data.
b. UMAP visualization of DRG scRNA-seq data from E11.5 with developmental trajectory and gene expression information overlaid. TPT: tags per ten thousand.
c. Quantification of tdTomato+ neurons and representative image. Mean +/- s.e.m. is indicated.
d. Heatmap and quantification of genes enriched in each somatosensory neuron subtype as well as their expression levels in unspecialized sensory neurons. USN: unspecialized sensory neuron. Boxes represent IQR, whiskers represent minimum and maximum values, and notches represent the 95% confidence interval of the median. TPT: tags per ten thousand. * denotes two-sided Wilcoxon rank-sum test with Bonferroni corrected p < 0.0001.
We next sought to determine how the transcriptional identities of mature somatosensory neuron subtypes compare to those of newborn sensory neurons by analyzing the transcriptomes of cells from DRGs at E11.5 (Figure 1B). The E11.5 scRNA-seq data were visualized using uniform manifold approximation and projection (UMAP)20. Mapping historically defined marker genes onto the UMAP representation revealed three principal cell types in E11.5 ganglia: 1) multipotent neural crest progenitors (NCPs), marked by Sox1021,22; 2) sensory neuron progenitors (SNPs), marked by Neurog1/223; and 3) nascent, postmitotic sensory neurons marked by expression of the somatosensory neuron gene Advillin (Avil24) and concomitant loss of expression of cell-cycle associated genes (Figure 1B, Extended Data Figure 4A). Monocle 325 was then used to infer developmental relationships between the NCPs, SNPs, and nascent Avil+ sensory neurons. This analysis revealed a single continuous trajectory connecting NCPs, SNPs, and Avil+ sensory neurons, suggesting a lack of transcriptional diversity in sensory neuron progenitors populating the Avil+ compartment. Surprisingly, descendants of Neurog1+ SNPs, labeled using Neurog1Cre; Rosa26LSL-tdTomato mice, were found to include a broad range of cell diameters (Figure 1C), consistent with in vitro directed differentiation with Neurog1 overexpression leading to the generation of both small and large diameter DRG sensory neuron subtypes26. Moreover, genes that are highly enriched in E11.5 Avil+ sensory neurons, relative to progenitors, generally remain expressed in adult somatosensory neuron subtypes (Extended Data Figure 4B). On the other hand, the majority of genes with expression patterns restricted to individual terminal somatosensory subtypes of adult ganglia were expressed at trace levels in E11.5 Avil+ sensory neurons (Figure 1D), suggesting that upon cell-cycle exit sensory neurons are transcriptionally unspecialized specifically with respect to subtype specific genes. These observations led us to consider whether a ‘transcriptionally unspecialized state’ serves as the starting point for somatosensory subtype diversification.
To address this, we compared scRNA-seq transcriptomes generated from sensory neurons between E11.5 and adulthood. Prospective identities for sensory neurons at each developmental stage were assigned based on transcriptional similarity using canonical correlation analysis27 (Figure 1A, Extended Data Figure 1F) as well as a graph-based strategy for locally embedding consecutive timepoints based on the transcriptional variation they share. We constructed single-cell k-nearest neighbor graphs for each timepoint (ti) with nodes representing cells and edges linking neighbors. These graphs were then joined by identifying neighboring cells in adjacent timepoints using a coordinate system learned from the subsequent timepoint (ti+1) (Methods). The resulting graph forms a branching network that can be visualized using a force-directed layout. This representation spans all developmental stages and provides a consolidated view of the transcriptional maturation of each principal somatosensory neuron subtype from E11.5 to adulthood (Figure 2A).
Figure 2. Transcriptional development of DRG neuron subtypes.
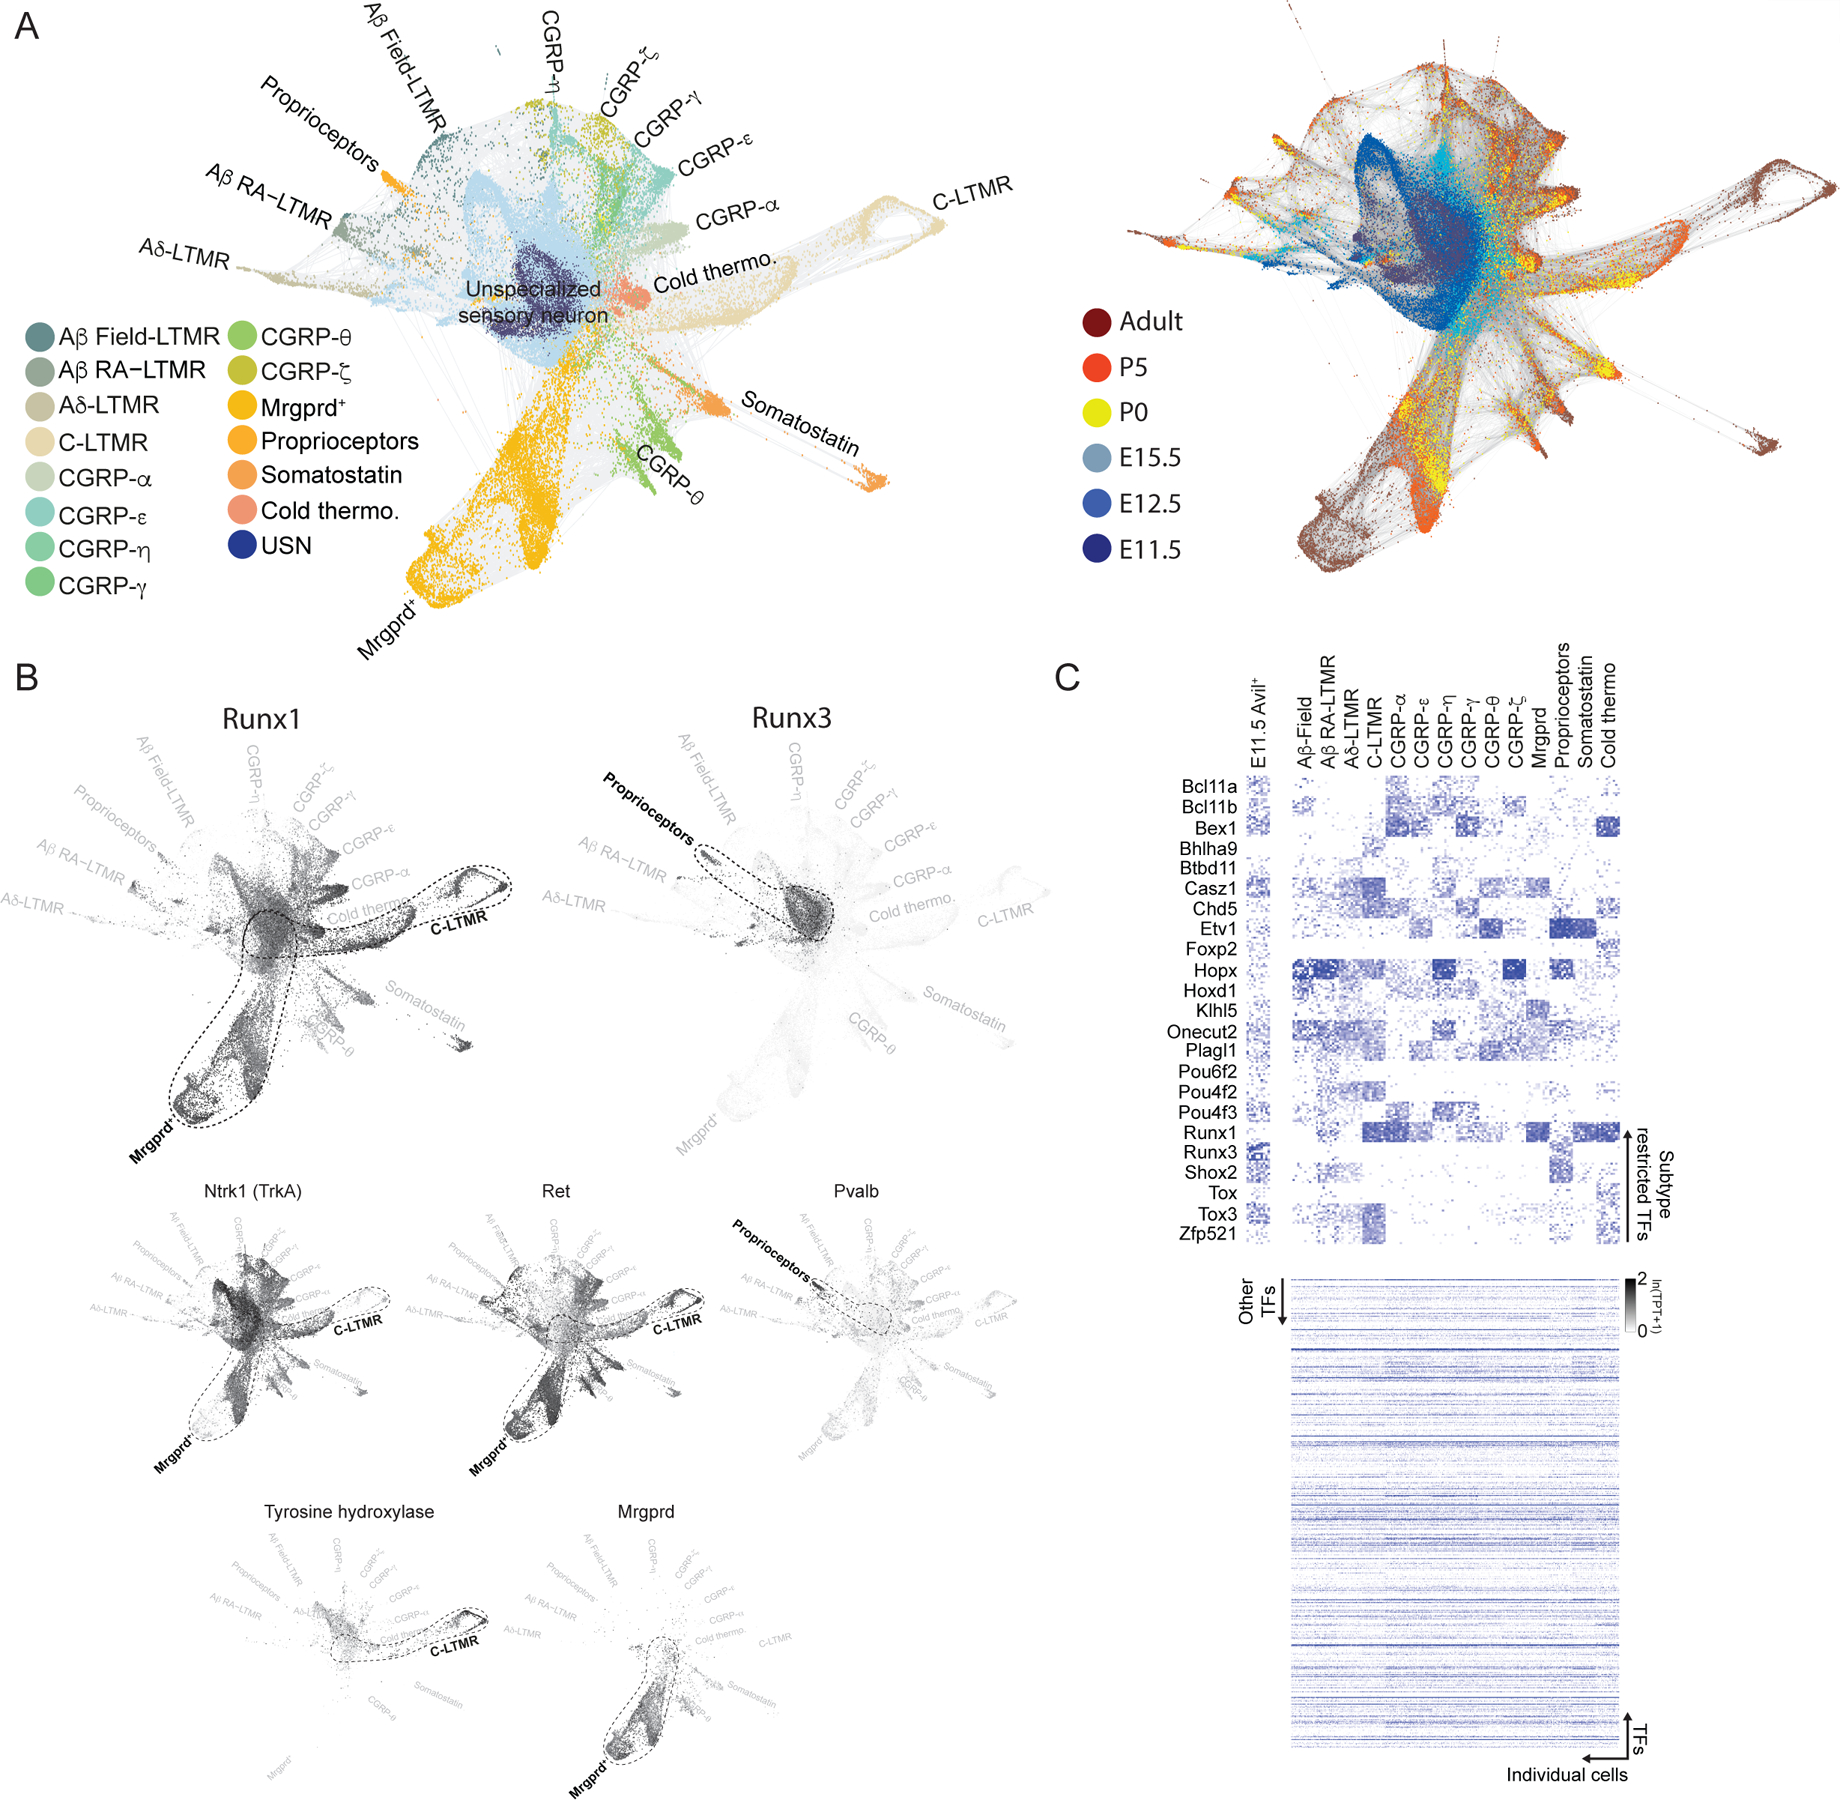
a. Force-directed layout of DRG sensory neurons overlaid with time point or cell type information.
b. Force-directed layout of DRG development overlaid with expression of indicated genes.
c. Heatmap of subtype-restricted TFs in each somatosensory neuron subtype of adult ganglia. TPT: tags per ten thousand.
We next tested whether this graph-based representation of developmental gene expression profiles of sensory neuron subtypes recapitulates known developmental relationships. We inspected the expression patterns of the TFs Runx1 and Runx3, which are implicated in development of select unmyelinated (C-fiber) neuron subtypes and proprioceptors, respectively28–30. We found Runx1 expression was prominent in unmyelinated sensory neuron subtypes, whereas Runx3 expression was restricted to mature proprioceptors of adult ganglia, as previously described28,29 (Figure 2B). Furthermore, the graph-based representation accurately depicts the developmental switch from Ntrk1+ to Ret+ known to occur in subsets of non-peptidergic C-fiber neurons30 (Figure 2B). To facilitate exploration of this dataset by the community, we created an HTML based interactive interface enabling visualization of the expression pattern of any gene at each developmental time point, from E11.5 to adulthood, for each of the somatosensory neuron subtypes (click here for interactive somatosensory neuron browser).
TFs in sensory neuron development
One observation from our initial analysis of the graph-based representation of developmental transcriptomes of sensory neurons is that TFs implicated in development of sensory neuron subtypes, Runx1 and Runx3, are broadly co-expressed in nascent E11.5 Avil+ sensory neurons, which stands in contrast to their mutually exclusive expression patterns in terminally differentiated subtypes of adult DRGs (Figure 2B). This is consistent with the finding that Runx1 and Runx3 proteins are co-localized in embryonic DRG31. This observation led us to consider whether other TFs that are subtype-restricted in adult ganglia may be co-expressed in nascent, transcriptionally unspecialized sensory neurons. To address this possibility, we identified TFs beyond Runx1 and Runx3 that are expressed in select somatosensory neuron subtypes of mature ganglia by inspecting 1152 neuronally expressed TFs and found that 23 are expressed in distinct subsets of adult somatosensory neurons (Figure 2C). Strikingly, as observed with Runx1 and Runx3, the scRNA-seq data revealed that several TFs expressed in select subtypes of sensory neurons of mature DRGs are co-expressed in newborn E11.5 sensory neurons (Extended Data Figure 5A). These scRNA-seq findings were verified using double single-molecule RNA fluorescent in situ hybridization (smRNA-FISH), with Runx1 and Runx3 as well as Pou4f2 and Pou4f3 serving as test cases. Indeed, smRNA-FISH measurements showed that Runx1 and Runx3 as well as Pou4f2 (Aβ RA-LTMRs, Aδ-LTMRs, C-LTMRs) and Pou4f3 (CGRP-αs and CGRP-ηs) are co-expressed in the majority of E11.5 Avil+ sensory neurons, despite their mutually exclusive expression patterns in neurons of P0 and adult ganglia (Extended Data Figure 5B–C). These observations suggest that all somatosensory neuron subtypes transit through a postmitotic transcriptionally unspecialized state. To further address this, we genetically labeled descendants in the Avil+ cell compartment at E11.5 by administering a low dose of tamoxifen (0.5 mg) at E11.5 to AvilCreERT2; Rosa26LSL-tdTomato mice and found tdTomato transcripts to be present in 5–19% of cells in each somatosensory neuron subtypes of adult ganglia by scRNA-seq (Figure 3A–C). In addition, we labeled all descendants of one of the ‘broad early’-to-’subtype restricted late’ TFs, Pou4f2, with tdTomato using a Pou4f2Cre; Rosa26LSL-tdTomato mouse line, and terminally differentiated Pou4f2+ DRG subtypes were transduced in the same mouse using an AAV carrying a Cre-dependent GFP reporter delivered at P14 (Figure 3D). smRNA-FISH analysis revealed tdTomato transcripts in >90% of DRG sensory neurons in adult Pou4f2Cre; Rosa26LSL-tdTomato; AAV-CAG:FLEX-GFPP14 I.V. mice while, in contrast, GFP transcripts were restricted to Aβ RA-LTMRs, Aδ-LTMRs and C-LTMRs (mature Pou4f2+ populations) (Figure 3E). Interestingly, a developmental analysis of subtype-specific gene expression revealed that, in general, large diameter neurons achieve transcriptional maturity prior to small diameter neurons, consistent with the historical view32,33 (Extended Data Figure 6A–B). Together, these experiments indicate that cells in the transcriptionally unspecialized compartment express a broad array of TFs that become restricted to select subsets of sensory neurons as development proceeds.
Figure 3. Refinement of TF expression in developing somatosensory neurons.
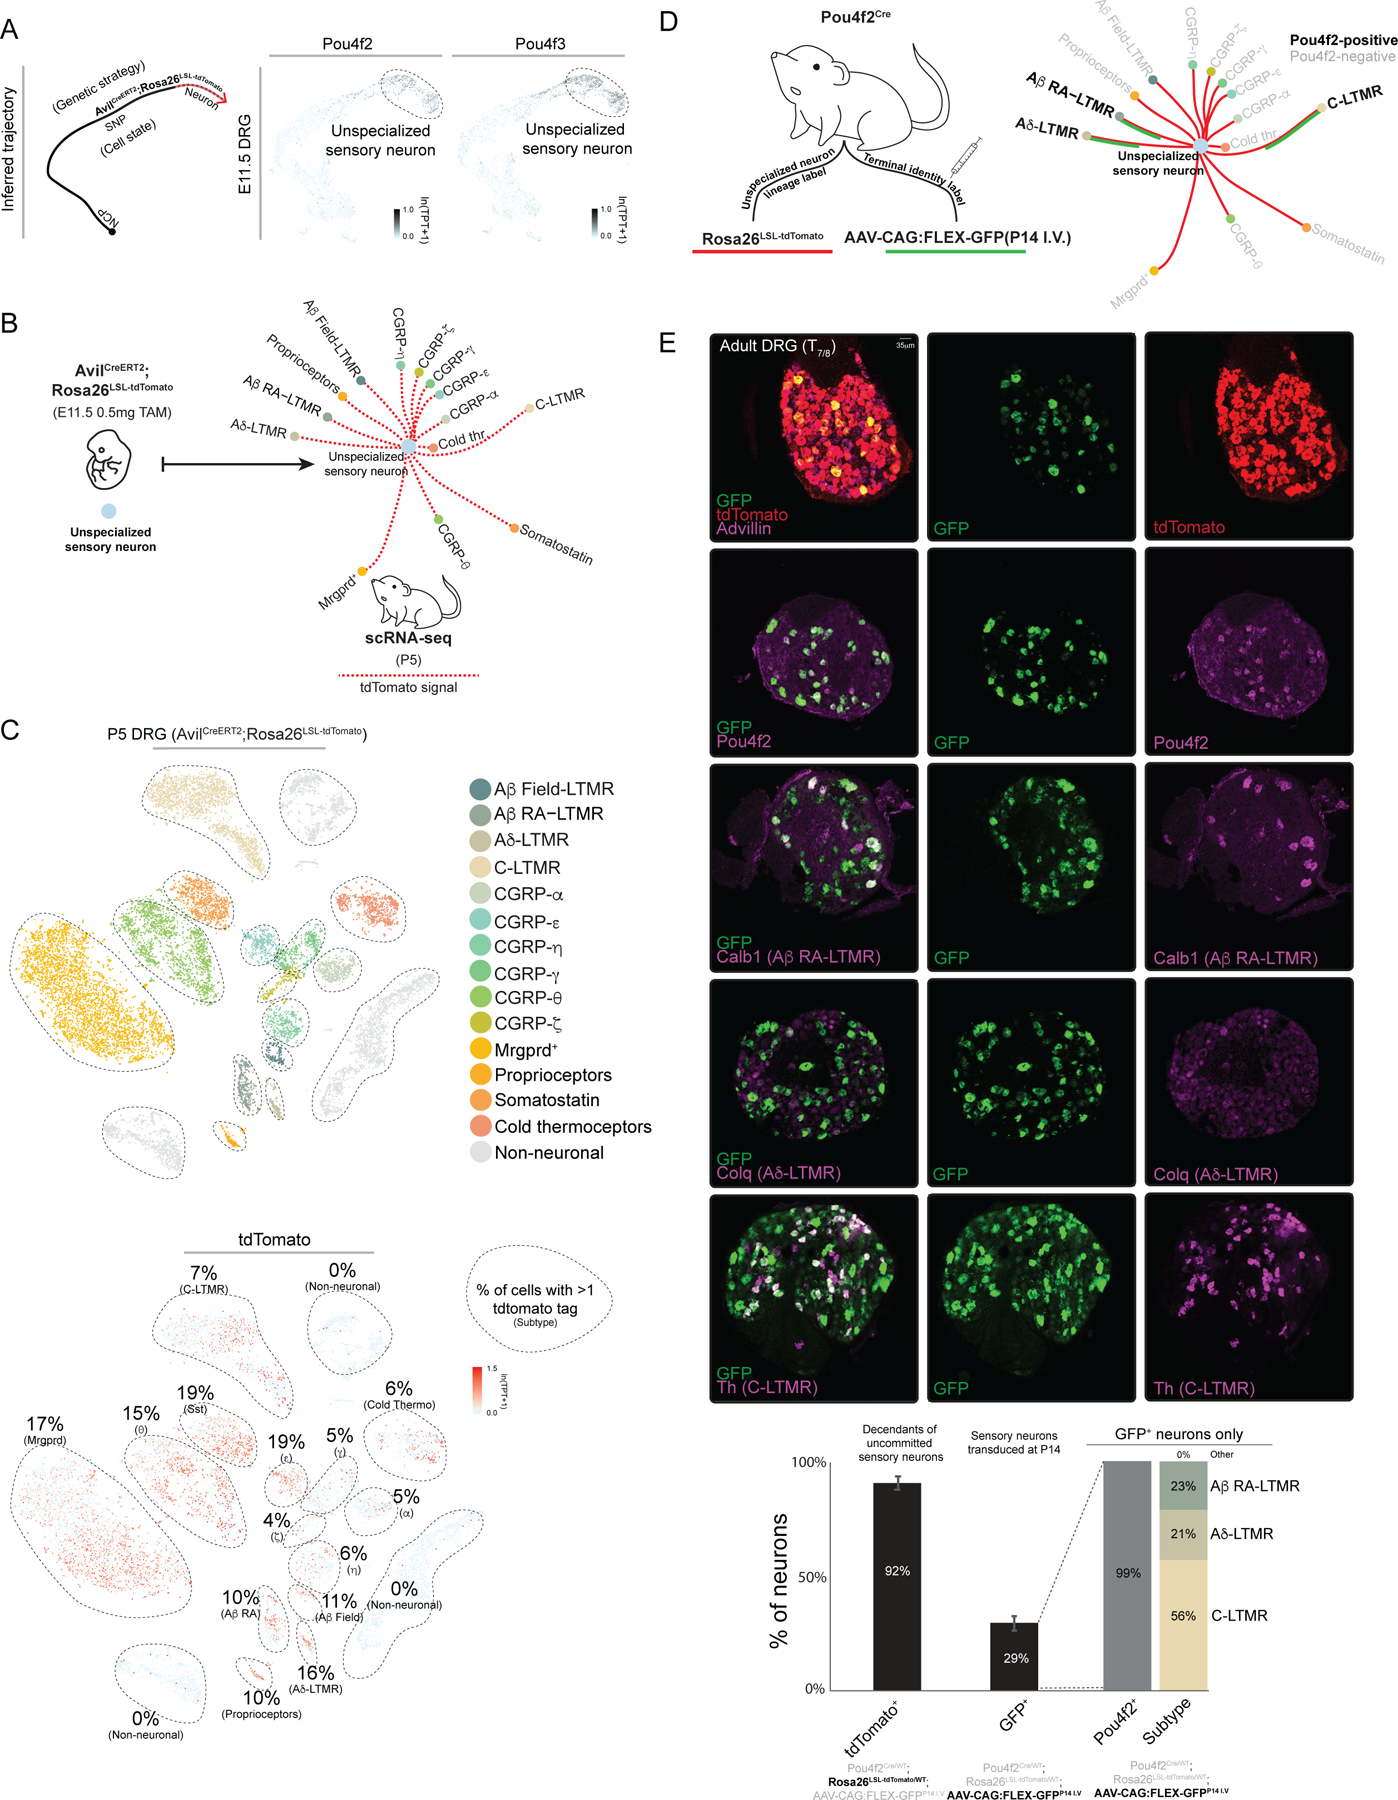
a. Developmental trajectory of sensory neurons (left) and tSNE visualization with TF expression overlaid. TPT: tags per ten thousand.
b. Schematic description of the AvilCreERT2; Rosa26LSL-tdTomato labeling strategy.
c. tSNE visualization of AvilCreERT2; Rosa26LSL-tdTomato scRNA-seq with cell type identity or tdTomato expression overlaid. TPT: tags per ten thousand.
d. Schematic representing strategy for labeling neurons with Pou4f2Cre/WT mice.
e. smRNA-FISH and quantification for the indicated transcripts. Mean +/- s.e.m is indicated. * represents two-tailed t-test. p<0.01.
Specification of subtype identity
We next asked if broad-to-restricted TFs contribute to sensory neuron diversification during the transcriptionally unspecialized state, thus broadly influencing transcriptional maturation of sensory neurons, or whether these TFs primarily influence the subtypes in which their expression is maintained. We harvested DRGs from neonatal (P0–5) pups harboring null alleles of either Pou4f2 or Pou4f3, which are representative broad-to-restricted TFs, and generated scRNA-seq transcriptomes from Pou4f2KO(Cre)/KO(Cre) mice and Pou4f2+/+ littermate controls as well Pou4f3−/− mice and Pou4f3+/+ littermate controls. Initial inspection of the scRNA-seq data obtained from both Pou4f2 and Pou4f3 mutant animals revealed clusters corresponding to each somatosensory subtype (Figure 4A–B). We found that cell numbers were not compromised as representative ganglia (T7/8) from Pou4f2 or Pou4f3 knockouts have similar numbers of neurons compared to littermate controls (Extended Data Figure 7A–B). Importantly, subtype-specific genes in both the Pou4f2+ populations and Pou4f3+ populations were reduced in the respective knockouts, compared to littermate controls (Figure 4C–D), whereas randomly selected genes were unchanged (Figure 4C–D). In contrast, somatosensory neuron subtypes that normally extinguish expression of Pou4f2 and Pou4f3 after E11.5 generally exhibited less dramatic alterations to subtype-specific gene expression or subtype-restricted TF expression (Figure 4C–D, Extended Data Figure 7A–B). Given the reduction of subtype-specific gene expression in Pou4f2 and Pou4f3 mutants, we also determined the consequences of Pou4f2 or Pou4f3 ablation on the unique axonal endings associated with mature somatosensory neuron subtypes. Although the axonal endings associated with Pou4f2+ subtypes are known to form longitudinal lanceolate endings around hair follicles1, the axonal ending morphologies associated with the Pou4f3+ subtypes were not known. Genetic labeling experiments using newly generated Cre lines for each Pou4f3+ subtype revealed that the axonal ending types of CGRP-α neurons are free nerve endings that penetrate the epidermis whereas CGRP-η neurons form circumferential endings associated with hair follicles (Extended Data Figure 8A–D). We found the longitudinal lanceolate endings and CGRP+ circumferential axonal endings were partially compromised in Pou4f2 and Pou4f3 knockout mice, respectively (Extended Data Figure 8E–K). Furthermore, postnatal depletion of Pou4f3 with shRNA altered subtype-specific gene expression and function (Extended Data Figure 9A–G). Taken together, two representative subtype-restricted TFs, Pou4f2 and Pou4f3 control transcriptional maturation of the sensory neuron subtypes in which they remain expressed.
Figure 4. Pou4f2 and Pou4f3 regulate select somatosensory neuron subtype identities.
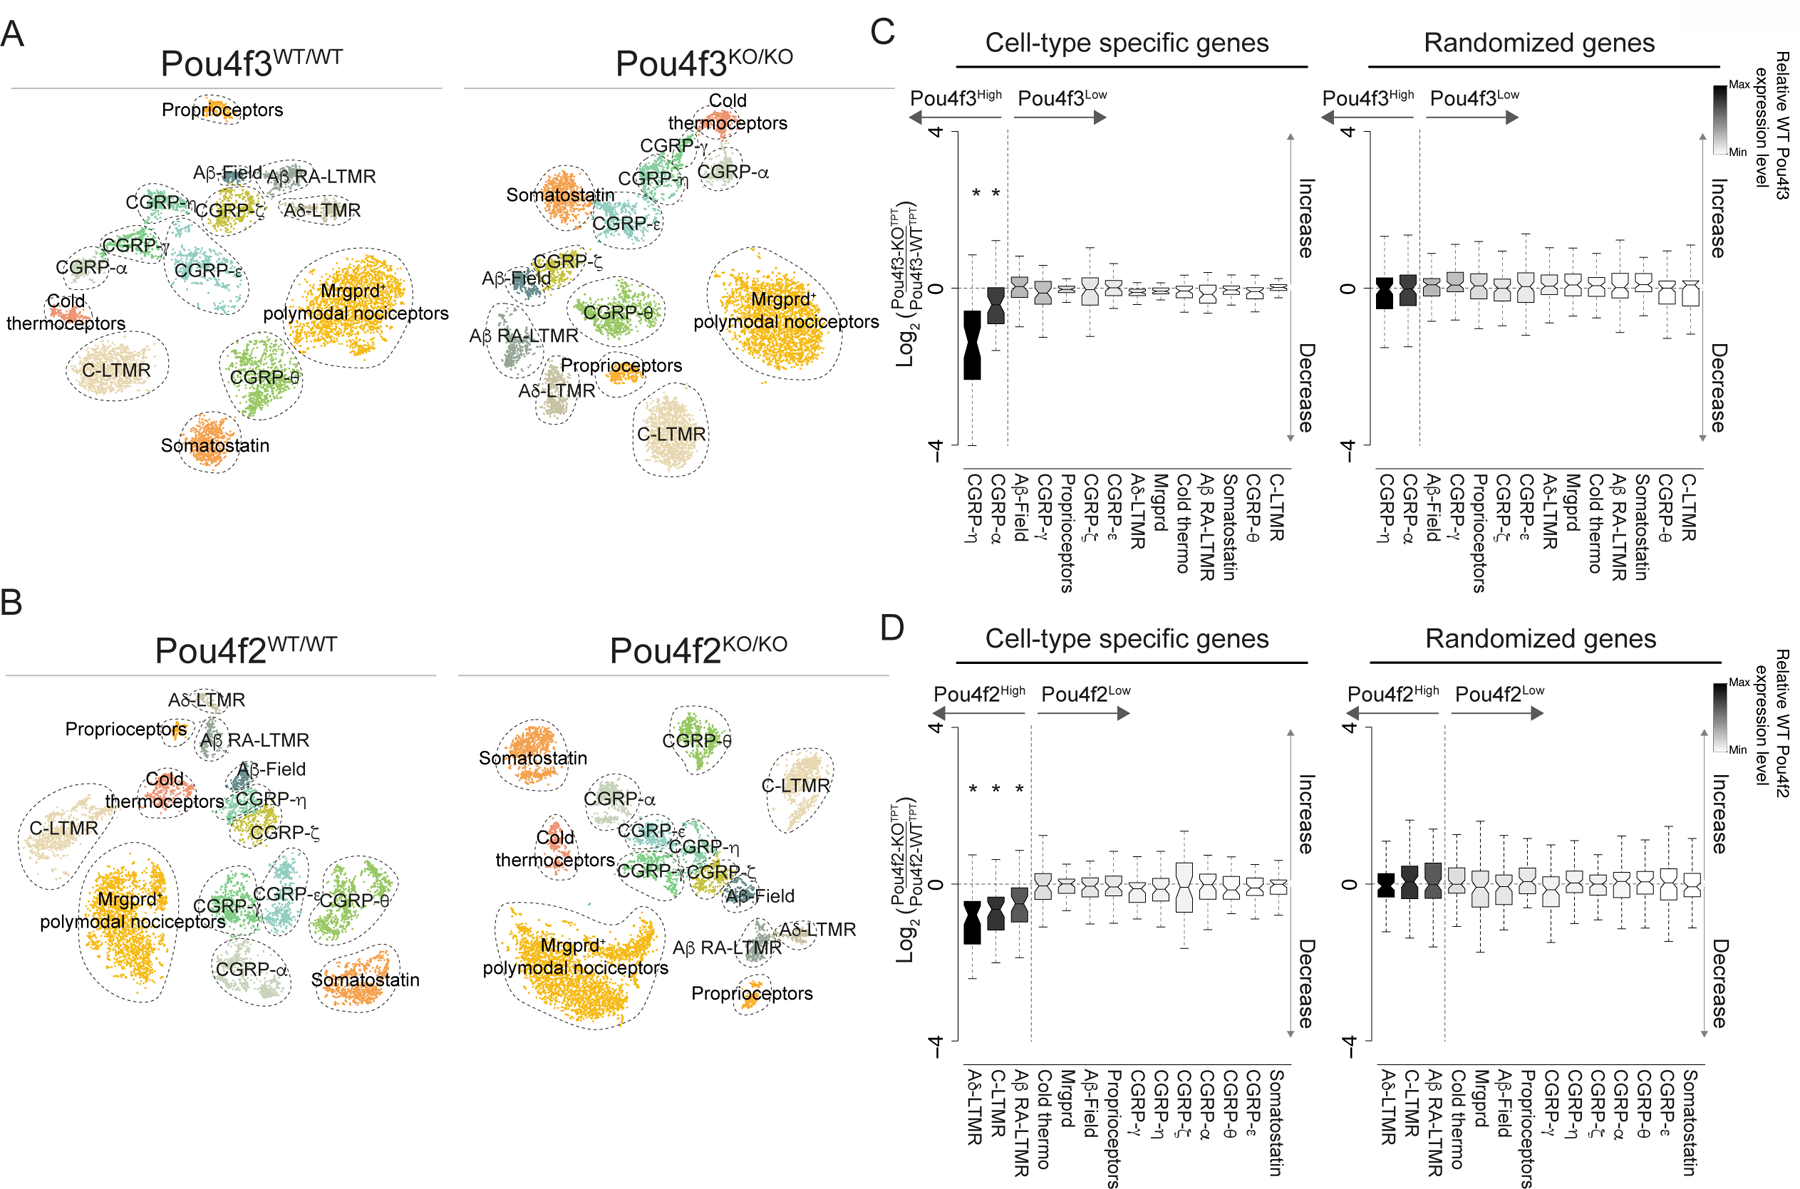
a. t-SNE visualizations of scRNA-seq data for neurons generated from Pou4f3WT/WT and Pou4f3KO/KO littermates.
b. t-SNE visualizations of scRNA-seq data for neurons generated from Pou4f2WT/WT and Pou4f2KO/KO littermates.
c. Fold-change distribution of cell-type specific genes when comparing Pou4f3KO/KO and Pou4f3WT/WT littermates control samples.
d. Fold-change distribution of cell-type specific genes when comparing Pou4f2KO/KO and Pou4f2WT/WT littermates. In c,d Boxes represent IQR, whiskers represent minimum and maximum values, and notches represent the 95% confidence interval of the median and * denotes two sided Wilcoxon rank-sum test with Bonferroni corrected p < 0.01. TPT: tags per ten thousand.
Extrinsic control of subtype identity
Whether differential maintenance or extinction of TFs in emerging subtypes occurs via a process that is entirely intrinsic to developing sensory neurons or guided by extrinsic cues was next addressed. The mesenchymal and epidermal environments through which embryonic somatosensory axons extend are rich sources of extrinsic signals including neuronal growth factors8. Therefore, we asked whether nerve growth factor (NGF), an extrinsic cue critical for growth and survival of Ntrk1 (TrkA; NGF-receptor)-expressing embryonic somatosensory neurons34, which represent ~80% of the adult DRG, may exert control over the TF selection process. To address this, scRNA-seq was performed using DRGs from neonatal mice harboring a targeted mutation in the NGF gene. This genome-wide analysis of NGF-dependent gene expression was done using the apoptosis deficient Bax-knockout genetic background to circumvent the apoptotic cell death of DRG neurons associated with developmental loss of NGF35. While clustering analysis of the scRNA-seq data revealed that all somatosensory neuron subtypes are present in Bax−/− controls (Figure 5A), fewer transcriptionally distinct neuronal populations were observed in NGF−/−; Bax−/− double mutants (Figure 5A). Ntrk1-negative populations (proprioceptors and A-fiber mechanoreceptors) were not dramatically transcriptionally compromised in NGF−/−; Bax−/− mutants compared to Bax−/− controls (Figure 5B), as expected. However, subtype-specific gene expression patterns normally present in Ntrk1+ sensory neuron subtypes were dramatically altered in the NGF−/−; Bax−/− mutants (Figure 5C). Importantly, examination of the aforementioned subtype-restricted TFs showed that the combinations of TFs expressed in the unidentified neuronal clusters in NGF−/−; Bax−/− mutants bore no resemblance to the TF combinations observed in neuronal subtypes of control animals, which was confirmed using smRNA-FISH analyses (Extended Data Figure 10A). Furthermore, members of the Neurod family of transcription factors, which are normally extinguished during embryonic development, remained expressed at P0 in NGF−/−; Bax−/− mutants (Extended Data Figure 10B–D). These findings indicate that the selection of somatosensory neuron subtype-restricted TFs is controlled, at least in part, by extrinsic cues acting on nascent sensory neurons.
Figure 5. The extrinsic cue NGF is required for subtype specific gene expression and TF expression patterns.
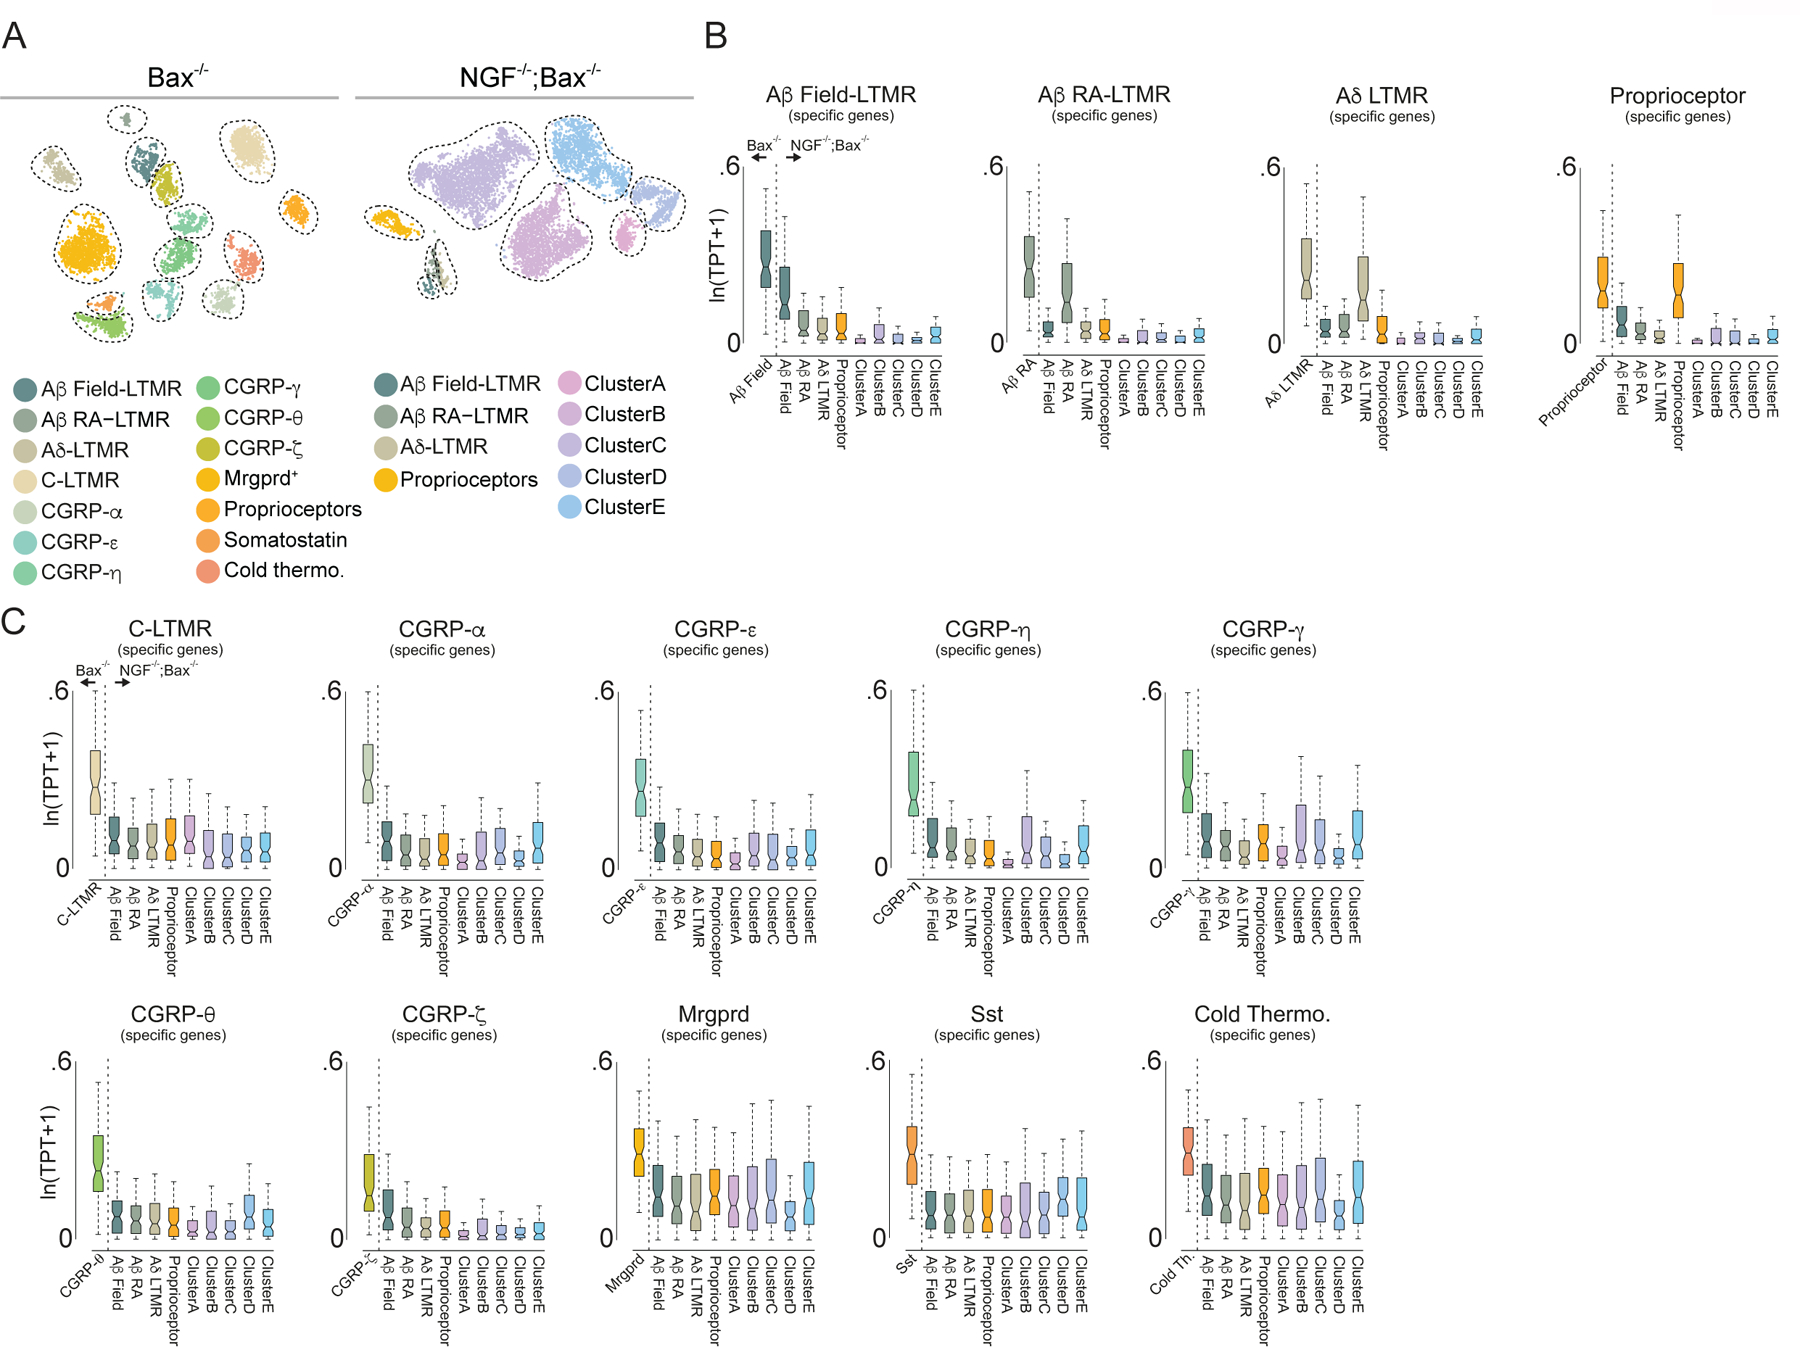
a. t-SNE visualizations of scRNA-seq data for neurons generated from P0 Bax−/− and NGF−/−; Bax−/− littermates.
b. Cell-type specific gene expression in proprioceptor and A-fiber mechanoreceptor sensory neuron subtypes in Bax−/− and NGF−/−; Bax−/− littermates.
c. Cell-type specific gene expression in all other sensory neuron subtypes in Bax−/− and NGF−/−; Bax−/− littermates, Boxes represent IQR, whiskers represent minimum and maximum values, and notches represent the 95% confidence interval of the median. In b,c all clusters are different from controls by two sided Wilcoxon rank-sum test with Bonferroni corrected p < 0.01. TPT: tags per ten thousand.
Discussion
Our genome-wide transcriptomic analyses of cells traversing somatosensory neuron developmental stages support a model in which newborn somatosensory neurons are unspecialized with respect to expression of subtype-restricted TFs, and that differential maintenance of unique combinations of these subtype-restricted TFs enables nascent sensory neurons to resolve into mature subtypes (Extended Data Figure 10D). Early co-expression, and subsequent resolution, of TFs has been proposed to underlie diversification of stem cells in the hematopoietic lineage36–38, neural crest progenitors prior to lineage committment39, and developing spinal motor neurons40–42, although this view has been challenged in the case of the hematopoietic system43. The diversification of somatosensory neurons shares commonalities and differences with these systems. Unlike cells of the early neural crest and the hematopoietic lineages, we propose that somatosensory neuron subtypes emerge following cell cycle exit, and unlike other progenitor types, newborn, post-mitotic Avil+ somatosensory neurons are not migratory but rather permanent residents of sensory ganglia. Therefore, nascent sensory neurons cannot rely on cell division or migration to encounter new environments. Rather, a feature of nascent somatosensory neurons is that they immediately extend axons along intermediate targets, such as large blood vessels, en route to target organs, such as the skin, where they encounter extrinsic cues, including NGF and other secreted factors. We propose a model in which multiple distinct extrinsic cues act on axons of transcriptionally unspecialized sensory neurons, depending on the timing and trajectories of their projection patterns. These cues function, in part, to resolve TF expression patterns from a co-expressed state to a subtype-restricted state to promote the transcriptional specializations underlying the unique molecular, morphological, and physiological properties of somatosensory neuron subtypes.
Online Methods
Animals.
All mouse experiments in this study were approved by the National Institutes of Health and the Harvard Medical School IACUC. Experiments followed the ethical guidelines outlined in the NIH ‘Guide for the care and use of laboratory animals (https://grants.nih.gov/grants/olaw/guide-for-the-care-and-use-of-laboratory-animals.pdf). Avpr1aT2a-Cre and Bmpr1bT2a-Cre mice were generated using standard homologous recombination techniques in ES cells. Chimeras were generated by blastocyst injection and subsequent germline transmission was confirmed by tail PCR. The neo selection cassette was excised using a Flp-deleter strain for the Avpr1aT2a-Cre but left intact for the Bmpr1bT2a-Cre lines. Mice were housed under standard conditions and provided chow and water ad libitum. Plug date was considered embryonic day 0.5 (E0.5) and date of birth was considered postnatal day 0 (P0). Pou4f3 null mice were obtained from Jax (Stock No. 008645). Pou4f2 null(Cre) mice were obtained from Jax (Stock No. 030357). Rosa26 Cre-dependent tdtomato reporter mice were obtained from Jax (Stock No. 007914). AvilCreERT2 mice were obtained from Jax (Stock No. 032027). All experiments with wild-type animals were conducted with mice on the C57Bl/6J background and were obtained from Jackson Laboratory.
Dissociation and purification of isolated single sensory neurons.
The dissection strategy used were nearly identical for all ages presented in this study. Specifically, animals were sacrificed, and spinal columns were removed and placed on a tray of ice. Individual DRGs with central and peripheral nerves attached were removed from all axial levels and placed into ice-cold DMEM:F12 (1:1) supplemented with 1% pen/strep and 12.5mM D-Glucose. A fine dissection was performed to remove the peripheral and central nerve roots, resulting in only the sensory ganglia remaining. 200–400 individual ganglia were collected for the DRG and 20–30 ganglia for the trigeminal for each bioreplicate of single-cell sequencing. All scRNA-seq experiments in this study were performed with >2 bioreplicates. Sensory ganglia were dissociated in 40 units papain, 4mg/ml Collagenase, 10mg/mL BSA, 1mg/mL hyalurdonidase, 0.6mg/mL DNAse in DMEM:F12+1% pen/strep+12.5mM glucose for 10 minutes at 37C. Digestion was quenched using 20mg/mL ovomucoid (trypsin inhibitor), 20mg/mL BSA in DMEM:F12+1% pen/strep+12.5mM glucose. Ganglia were gently triturated with fire polished glass pipettes (opening diameter of approx. 150–200µm). Neurons were then passed through a 70µm filter to remove cell doublets and debris. Neurons were pelleted and washed 4–8x in 20mg/mL ovomucoid (trypsin inhibitor), 20mg/mL BSA in DMEM:F12+1% pen/strep+12.5mM glucose followed by 2x washes with DMEM:F12+1% pen/strep+12.5mM Glucose all at 4C. After washing, cells were resuspended in 50–200uL of DMEM:F12+1% pen/strep+12.5mM glucose. Cells were counter stained with Trypan blue, visually inspected, counted with a hemocytometer. Dissociated ganglia preparations were considered to pass quality control and used for scRNA-seq if >90% of cells were viable, as measured by exclusion of trypan blue and virtually no cellular debris was visible.
Tissue processing for RNA florescent in situ hybridization (RNA-FISH).
For sample preparation, individual DRGs from mice were rapidly dissected and axial level was identified by identifying specific DRGs using the T12 DRG as a landmark. The T12 DRG was defined as the ganglia immediately caudal to the last rib. DRGs were frozen in dry-ice cooled 2-metylbutane and stored at −80°C until sectioned. DRGs were sectioned at a thickness of 15–20µm and RNAs were detected by RNAscope (Advanced Cell Diagnostics) using the manufacturer’s protocol. Total numbers of neurons per section of DRG were estimated by counting neuronal nuclei as measured by DAPI and counts were confirmed as reasonable estimates by comparing to counts measured by measuring Advillin or Pou4f/Brn3a, which are both pan-somatosensory neuron markers. It was observed that somatosensory neuron number per section were similar for DAPI vs Advillin or Pou4f1/Brn3a. The following probes were used: Mm-Th (Cat#: 317621), Mm-Calb1 (Cat#-428431), Mm-Pou4f2 (Custom made), Mm-Pou4f3 (Custom made), Mm-Avil (Cat#: 498531), Mm-Asic1 (Cat#: 480581), Mm-Mrgpra3 (Cat#: 548161), Mm-Pou4f1 (Cat#: 414671), Mm-Colq (Cat#: 496211), Mm-Sst (Cat#: 404631), Mm-Pvalb (Cat#: 421931), Mm-Ikzf1 (Cat#: 511201), Mm-Avpr1a (Cat#: 418061), Mm-Oprk1 (Cat#: 316111), Mm-Mrgprd (Cat#: 417921), Mm-Bmpr1b (Custom made), Mm-Vcan (Cat#: 486231), Mm-Trpm8 (Cat#: 420451), Mm-Neurod1 (Cat#: 416871), Mm-Neurod6 (Cat#: 444851), Mm-Shox2 (Cat#: 554291), Mm-Hopx (Cat#: 405161), Mm-Runx1 (Cat#: 406671), Mm-Runx3 (Cat#: 451271) GFP (Cat#: 400281), tdTomato (Cat#: 317041).
Single-cell RNA library preparation, sequencing, and analysis.
Single cell RNA-seq was performed with the 10X Genomics Chromium Single Cell Kit (v2 & v3). Approximately 1000–8000 cells were added to the RT mix prior to loading on the microfluidic chip. Downstream reverse transcription, cDNA synthesis/amplification, and library preparation were performed according to manufacturer’s instructions. All samples were sequenced on a NextSeq 500 with 58bp sequenced into the 3’ end of the mRNAs. Initial gene expression tables for individual barcodes were generated using the cellranger pipeline according to instructions provided by 10x Genomics. All gene expression tables were then imported into R and analyzed with Seurat (v 2.3) with standard procedures. Cluster identification: clusters were classified into transcriptionally distinct somatosensory neuron subtypes: Aβ RA-LTMRs44–46, Aβ Field-LTMRs/Aβ SA1-LTMRs46,47, Aδ-LTMRs46,48, C-LTMRs46,49, CGRP+ neurons50,51 (containing six transcriptionally discrete subtypes), Mrgprd+ polymodal nociceptors46,52–54, proprioceptors55,56, Sst+ pruriceptors (Somatostatin/Nppb+)57,58, cold sensitive thermoceptors50,59,60, as well as two main classes of support cells (Endothelial and Schwann cells). We note that a transcriptionally distinct cluster uniquely corresponding to Merkel cell-associated Aβ SA1-LTMRs was not detected. However, based on bulk RNA-seq analysis of genetically defined and FACS-purified LTMR subtypes, Aβ SA1-LTMRs harbor transcriptomes bearing striking resemblance to Aβ Field-LTMRs46; therefore, these two Aβ LTMR subtypes are likely embedded within the same cluster in our tSNE plot. We confirmed that marker genes for each of the sensory neuron subtypes are expressed in subsets of DRG neurons and noted that the relative proportions of certain sensory neuron subtypes varied across ganglia located at different axial levels (Extended Data Figure 2A–B). Moreover, the somatosensory neuron subtypes identified in this adult DRG analysis are remarkably similar to those identified in scRNA-seq analysis of 5,556 somatosensory neurons we obtained from adult trigeminal ganglia (TG) (Extended Data Figure 3A–D). The cell types identified by our scRNA-seq findings are largely consistent with previously published adult DRG/TG scRNA-seq data sets16,17,19,61,62 Exclusion Criteria: As a first quality control filter, individual cells were removed from the data setif they had fewer than 1000 discovered genes, fewer than 1000 UMI or greater than 5% reads mapping to mitochondrial genes (several data sets use a 10% threshold for this parameter and is indicated in the respective figures). Preparing single cell suspensions of DRG/TG sensory neurons often results in a population non-neuronal/neuronal doublets. To circumvent this, we defined individual cells showing expression of Schwann cell markers (Sox2 or Ednrb) and neuronal markers as neurons that did not resolve into single cells during the dissociation process. Cells matching these criteria were removed before performing subsequent analysis and this analysis was applied to all data sets presented in this study. Lastly, for simplicity, most displays exclude non-neuronal cells (Schwann and endothelial). Generally, we found that <10% of cells in any given data set were classified as non-neuronal. General analysis parameters: Raw UMI counts were normalized to 10,000 UMIs per cell. Highly variable genes were calculated using the FindVariableGenes function with mean.function=ExpMean, dispersion.function=LogVMR, x.low.cutoff=0, and y.cutoff=0.5. PCA/tSNE analysis were used for dimensionality reduction and elbow plots were generated to determine which principal components to include in the analysis. This corresponded to roughly the first 20 principle components. Canonical correlation analysis (CCA) and matching of cell types through development was performed as previously described27. Identification of differentially expressed genes: Differential gene expression analysis was performed on all expressed genes using the FindMarker function in Seurat using the Wilcoxon-Rank Sum test and a pseudocount of 0.001 was added to each gene to prevent infinite values. P-values <10−322 were defined as 0 as the R-environment does not handle numbers <10−322. Each identified cell type was compared against an outgroup which corresponded to all other cells in the dataset at the respective timepoint. All genes identified were spot checked by overlaying the expression levels on the tSNE plot to ensure the computational method was faithfully identifying genes with the prescribed features. For subtype specific gene expression analysis, subtype specific genes were first defined using the littermate control mice as knockout mice were not always available on pure C57/Bl6 background. The subtype specific genes identified in littermate control mice was nearly identical to those observed in C57/Bl6 control animals. Of the top 100 subtype-specific genes, 50 were randomly selected from this group and compared to the knockout controls. 50 expression matched genes that were not included in the subtype-specific gene list were selected as the randomized control genes. Monocle 3 analysis (for E11 trajectory analysis). The Monocle 3 workflow was performed in a similar fashion as previously described25. In brief the Monocle 3 pipeline offers several key advantages, described here briefly. Firstly, this pipeline allows for the generation of trajectories over potentially discontinuous underlying data. This is first accomplished by performing dimensionality reduction with the recently proposed UMAP algorithm20, instead of tSNE. Notably, UMAP provides comparable visualization quality to tSNE and UMAP also performs better at preserving global relationships, which is a noted shortcoming of the tSNE algorithm. Furthermore, the UMAP algorithm is more efficient [O(N)] compared to tSNE [Nlog(N)] making UMAP a more computationally friendly option for large datasets, as those used in this study. The UMAP parameters used in this study are comparable to those previously applied25 (reduction.use = “PCA”, max.dim = 2L, neighbors = 50, min_dist = 0.1, cosine distance metric). We note similar parameters have been used to finely resolve subtrajectories25 and therefore we argue that these parameters provide greatest sensitivity for identifying branches, if they exist, within out dataset. STITCH analysis. Although UMAP provides an advance in gene expression based trajectory inference, more complex changes in gene expression space, as is observed often in development63 continue to provide a significant challenge to identifying underlying trajectories. A recently proposed algorithm, STITCH, described in63 provides an alternative strategy, which is described here in brief. Instead of projecting all the data into a single low-dimensional space, STITCH assembles a manifold that is defined by a series of independent PCA subspaces corresponding to each individual time point with nodes representing cells and edges linking transcriptionally similar cells in a low-dimensional space. This allows for connections between cells to be identified even if cells are optimally described by differing underlying PC subspaces. From here, each cell in timepoint ti, where i ∈ (E11.5, E12.5, E15.5, P0, P5, Adult) forms an outgoing edge from ti → ti and ti → ti-1, ∀i ∈ (timepoints) where all cells are projected into the PC subspace defined by ti alone. In essence, edges connect each cell to its closet transcriptional neighbor within a timepoint and the preceding timepoint. Edges are then subjected to local neighborhood restriction such that an outgoing edge from a cell was maintained if its neighbors were at most 3-fold as far as the cell’s closest neighbor. To avoid spurious connections that may form, edges were next subjected to a global neighborhood restriction where edges are maintained if they were below the average edge distance across all cells between time points (ti, ti-1) or within 1 standard deviation of the average edge distance within the timepoint. The graph was further reduced by retaining at most 20 mutual nearest neighbor edges.
Cloning, production, purification, concentration and quality control of Adeno-associated virus (AAV).
AAV backbones were generated using standing cloning and molecular biology techniques. The following sequences were used for shRNAs: Luciferase (GCGCGATAGCGCTAATAATTT), Pou4f3 (TATCCCTTGGAGAAAAGCCTTGTT). AAVs included GFP, tagged with hemagglutinin (TAC CCATACGATGTTCCAGATTACGCT) as a reporter to monitor infectivity. Each individual preparation of AAV (2/9) and (2/PHP.S64) were produced by transient transfection of pRC9, pHelper, and AAV-genome plasmid into 6–12 T225 flasks of HEK 293T cells. Viral media was collected and replaced at 72 hrs. 293T cells and a second round of viral media were collected at 120 hrs post transfection. AAVs were extracted from cell pellets using Salt Active Nuclease (Articzymes) in 40mM Tris, 500mM NaCl and 2mM MgCl2 pH8 (SAN buffer). AAV in supernatant were precipitated with 8% PEG/500mM NaCl and resuspended in SAN buffer. Viral suspensions were loaded onto an iodixanol gradient (OptiPrep) and subsequently concentrated using Amicon filters with a 100kD cutoffs to a volume of 25–30uL (1xPBS + 0.001% F-68) per 6 T225-flasks transfected. Viral titers were normalized to 1e1014 vg/mL and stored at −80C in 5–10uL aliquots. AAVs (2/9) were injected intraperitoneally (IP) into postnatal day 0 pups. Pups transiently anesthetized by hypothermia and beveled pipettes were used to deliver 1012 viral genomes in a volume of 10uL (0.01% Fast Green, 1x PBS). After mice were injected, they were returned to ambient temperature and upon regaining full mobility were cross fostered with nursing CD1 females. Approximately seven days after transduction, DRGs were extracted for subsequent experimental analysis. Upon dissecting, all DRGs were visualized and monitored for GFP expression. For behavioral experiments, a minimum of 1012 viral genomes of AAV (2/PHP.S) were delivered to P21 mice via intravenous injection (retroorbital vein).
Immunostaining analysis.
DRG: For immunostaining analysis, mice (P28–42) were anesthetized with isoflurane and transcardially perfused with 10mL of 1xPBS (with Heparin) followed by 10mL of 1xPBS/4% paraformaldehyde at room temperature. Spinal columns were then removed and rinsed in 1xPBS and then cryoprotected overnight in 1xPBS/30% sucrose at 4°C, then embedded in NEG50 and stored at −70°C. For cryosectioning, tissue blocks were equilibrated to −20°C for 1 hour and then sectioned onto glass slides at a thickness of 20–25µm. Slides were stored at −70°C until ready for staining. Slides with sections were taken from freezers and immediately placed into 1xPBS and washed 3x with 1xPBS for 5 minutes each at room temperature. Tissue was blocked using 1xPBS/5% Normal donkey serum/0.05% Triton X-100 for 1 hour at room temperature. Tissue was then washed with 1xPBS 3x 5 minutes each at room temperature. Tissue was then incubated in primary antibody (Rabbit Anti-NeuN, Millipore: MAB377, 1:1000. Goat Anti-mCherry/tdTomato, CederLane: AB0040–200, 1:1000) in 1xPBS/5% Normal donkey serum/0.05% Triton X-100 overnight at 4°C. Tissue were washed in 1xPBS 3x for 5 minutes at room temperature followed by secondary antibody (Donkey Anti-Rabbit 488, 1:1000; Donkey Anti-Goat, 1:1000) diluted in 1xPBS/5% Normal donkey serum/0.05% Triton X-100 for 1 hour at room temperature. Lastly, tissue was washed in 1xPBS 3x for 5 minutes at room temperature followed by application of mounting media and glass coverslip. Skin sections. Skin sections were immunostained as described for DRG sections with the following differences: Section thickness was 55–60µm. Primary antibodies used were (Chicken Anti-GFP, Aves: GFP-1020, 1:1000. Goat Anti-mCherry/tdTomato, CederLane: AB0040–200, 1:1000, Rabbit Anti-CGRP, Immunostar: 24112, 1:1000). All images were obtained as z-stacks using a Zeiss LSM 700 confocal microscope using a 10x or 20x objective.
Two-plate temperature choice assay.
Animals were habituated to the behavioral apparatus for 30 minutes prior to experimental analysis. Animals were placed into the center of two identical chambers with one chamber randomly set to 30°C and the other to the test temperature indicated. Animals were recorded as they freely explored the arena while automatic tracking software was used to track animals over a 5-minute period. Time spent in each temperature chamber was quantified as a fraction of total time tested and one temperature was tested per day.
RNA isolation, reverse transcription, and qRT-PCR.
DRGs were dissected as described above; however, instead of subjecting ganglia to dissociation, they were directly lysed by gentle agitation in Trizol at room temperature for 10 minutes. The RNeasy Mini (Qiagen) kit was used according to manufacturer’s instructions to purify DNA-free RNA. RNA was converted to cDNA using 200–250ng of RNA with the High-capacity cDNA reverse transcription kit (Themofisher). qRT-PCR was performed with technical triplicates and mapped back to relative RNA concentrations using a standard curve built from a serial dilution of cDNA. Data were collected using the LightCycler 480 SYBR Green I Master mix (Roche) on a QuantStudio 3 qPCR machine (Applied Biosystems).
Statistics and reproducibility.
For all scRNA-seq data shown all individual cells for the labeled cell type are shown with no downsampling or subsetting implemented unless explicitly indicated. Differential and comparative gene expression analysis were conducted using a two-sided Wilcoxon rank-sum test with Bonferroni correct p-values. Immunostaining and cell counting comparisons were done using a two-sided t-test. Behavioral analysis was compared using a two-way ANOVA followed by a Tukey’s post-hoc test. All scRNA-seq samples were derived from n=2 biologically independent samples with the exception of the adult (P28–42) sample which was derived from n=6 biologically independent samples. The follow sample sizes (cell numbers) for each cell type and samples sizes for other analyses are as follows: Fig1a Adult: 257 Aβ Field LTMR cells, 273 Aβ RA LTMR cells, 182 Aδ LTMR cells, 1554 C-LTMR cells, 1440 CGRP-α cells, 850 CGRP-ε cells, 270 CGRP-η cells, 705 CGRP-γ cells, 758 CGRP-θ cells, 333 CGRP-ζ cells, 2817 Mrgprd cells, 234 Proprioceptors cells, 761 Sst cells, 488 Cold Thermoceptors cells, Postnatal day 5 209 Aβ Field LTMR cells, 297 Aβ RA LTMR cells, 237 Aδ LTMR cells, 1392 C-LTMR cells, 445 CGRP-α cells, 473 CGRP-ε cells, 153 CGRP-η cells, 334 CGRP-γ cells, 640 CGRP-θ cells, 243 CGRP-ζ cells, 3019 Mrgprd cells, 104 Proprioceptors cells, 787 Sst cells, 405 Cold Thermoceptors cells, Postnatal day 0 257 Aβ Field LTMR cells, 273 Aβ RA LTMR cells, 182 Aδ LTMR cells, 1554 C-LTMR cells, 1440 CGRP-α cells, 850 CGRP-ε cells, 270 CGRP-η cells, 705 CGRP-γ cells, 758 CGRP-θ cells, 333 CGRP-ζ cells, 2817 Mrgprd cells, 234 Proprioceptors cells, 761 Sst cells, 488 Cold Thermoceptors cells, Postnatal day 0 214 Aβ Field LTMR cells, 163 Aβ RA LTMR cells, 165 Aδ LTMR cells, 739 C-LTMR cells, 284 CGRP-α cells, 188 CGRP-ε cells, 122 CGRP-η cells, 216 CGRP-γ cells, 359 CGRP-θ cells, 122 CGRP-ζ cells, 1704 Mrgprd cells, 103 Proprioceptors cells, 397 Sst cells, 284 Cold Thermoceptors cells, Embryonic Day 15.5 61 Aβ Field LTMR cells, 33 Aβ RA LTMR cells, 96 Aδ LTMR cells, 383 C-LTMR cells, 144 CGRP-α cells, 45 CGRP-ε cells, 26 CGRP-η cells, 97 CGRP-γ cells, 208 CGRP-θ cells, 63 CGRP-ζ cells, 670 Mrgprd cells, 40 Proprioceptors cells, 61 Sst cells, 128 Cold Thermoceptors cells, 3196 unlabeled cells, Embryonic Day 12.5 30 Aβ Field LTMR cells, 20 Aβ RA LTMR cells, 30 Aδ LTMR cells, 122 C-LTMR cells, 57 CGRP-α cells, 87 CGRP-ε cells, 48 CGRP-η cells, 60 CGRP-γ cells, 9 CGRP-θ cells, 37 CGRP-ζ cells, 555 Mrgprd cells, 37 Proprioceptors cells, 24 Sst cells, 105 Cold Thermoceptors cells, 7909 unlabeled cells; Fig1b Embryonic Day 11.5 1951 Unspecialized sensory neuron, 5402 Sensory neuron progenitor, 2781 Neural crest progenitor; Fig1c n=3 biologically independent samples; Fig1d 1951 unspecialized sensory neuron, 257 Aβ Field LTMR cells, 273 Aβ RA LTMR cells, 182 Aδ LTMR cells, 1554 C-LTMR cells, 1440 CGRP-α cells, 850 CGRP-ε cells, 270 CGRP-η cells, 705 CGRP-γ cells, 758 CGRP-θ cells, 333 CGRP-ζ cells, 2817 Mrgprd cells, 234 Proprioceptors cells, 761 Sst cells, 488 Cold Thermoceptors cells; Fig2a,b 696 Aβ Field LTMR cells, 734 Aβ RA LTMR cells, 659 Aδ LTMR cells, 3750 C-LTMR cells, 2072 CGRP-α cells, 1503 CGRP-ε cells, 555 CGRP-η cells, 1377 CGRP-γ cells, 1895 CGRP-θ cells, 743 CGRP-ζ cells, 7498 Mrgprd cells, 462 Proprioceptors cells, 1733 Sst cells, 1246 Cold Thermoceptors cells, 1951 unspecialized sensory neurons, 14982 cells with unmatched identity; Fig2c 1951 unspecialized sensory neurons, 257 Aβ Field LTMR cells, 273 Aβ RA LTMR cells, 182 Aδ LTMR cells, 1554 C-LTMR cells, 1440 CGRP-α cells, 850 CGRP-ε cells, 270 CGRP-η cells, 705 CGRP-γ cells, 758 CGRP-θ cells, 333 CGRP-ζ cells, 2817 Mrgprd cells, 234 Proprioceptors cells, 761 Sst cells, 488 Cold Thermoceptors cells; Fig3a 10321 cells from E11.5; Fig3c 159 Aβ Field LTMR cells, 385 Aβ RA LTMR cells, 203 Aδ LTMR cells, 1827 C-LTMR cells, 441 CGRP-α cells, 334 CGRP-ε cells, 348 CGRP-η cells, 417 CGRP-γ cells, 1665 CGRP-θ cells, 196 CGRP-ζ cells, 3666 Mrgprd cells, 185 Proprioceptors cells, 802 Sst cells, 717 Cold Thermoceptors cells; Fig3e n=3 biologically independent samples; Fig4a,c control/knockout 776/435 Aβ Field LTMR cells, 728/1114 Aβ RA LTMR cells, 667/927 Aδ LTMR cells, 2928/2486 C-LTMR cells, 478/656 CGRP-α cells, 990/582 CGRP-ε cells, 721/589 CGRP-η cells, 711/540 CGRP-γ cells, 1845/2381 CGRP-θ cells, 417/230 CGRP-ζ cells, 5556/7508 Mrgprd cells, 446/654 Proprioceptors cells, 1747/1460 Sst cells, 493/675 Cold Thermoceptors cells; Fig4b,d control/knockout 191/254 Aβ Field LTMR cells, 246/332 Aβ RA LTMR cells, 170/236 Aδ LTMR cells, 917/800 C-LTMR cells, 706/545 CGRP-α cells, 495/365 CGRP-ε cells, 279/330 CGRP-η cells, 559/429 CGRP-γ cells, 907/605 CGRP-θ cells, 292/341 CGRP-ζ cells, 1977/2960 Mrgprd cells, 123/213 Proprioceptors cells, 724/835 Sst cells, 427/392 Cold Thermoceptors cells; Fig5a–c 159 in control 342 Aβ Field LTMR cells, 122 Aβ RA LTMR cells, 413 Aδ LTMR cells, 783 C-LTMR cells, 363 CGRP-α cells, 314 CGRP-ε cells, 320 CGRP-η cells, 418 CGRP-γ cells, 460 CGRP-θ cells, 352 CGRP-ζ cells, 1162 Mrgprd cells, 368 Proprioceptors cells, 149 Sst cells, 442 Cold Thermoceptors cells, in NGF−/−;Bax−/− 82 Aβ Field LTMR cells, 162 Aβ RA LTMR cells, 124 Aδ LTMR cells, 395 Proprioceptors, 2558 ClusterA cells, 1878 ClusterB cells, 362, ClusterC cells, 1461 ClusterD cells, 714 ClusterE cells; Extended Data Fig1a 257 Aβ Field LTMR cells, 273 Aβ RA LTMR cells, 182 Aδ LTMR cells, 1554 C-LTMR cells, 1440 CGRP-α cells, 850 CGRP-ε cells, 270 CGRP-η cells, 705 CGRP-γ cells, 758 CGRP-θ cells, 333 CGRP-ζ cells, 2817 Mrgprd cells, 234 Proprioceptors cells, 761 Sst cells, 488 Cold Thermoceptors cells; Extended Data Fig1b 209 Aβ Field LTMR cells, 297 Aβ RA LTMR cells, 237 Aδ LTMR cells, 1392 C-LTMR cells, 445 CGRP-α cells, 473 CGRP-ε cells, 153 CGRP-η cells, 334 CGRP-γ cells, 640 CGRP-θ cells, 243 CGRP-ζ cells, 3019 Mrgprd cells, 104 Proprioceptors cells, 787 Sst cells, 405 Cold Thermoceptors cells; Extended Data Fig1c 257 Aβ Field LTMR cells, 273 Aβ RA LTMR cells, 182 Aδ LTMR cells, 1554 C-LTMR cells, 1440 CGRP-α cells, 850 CGRP-ε cells, 270 CGRP-η cells, 705 CGRP-γ cells, 758 CGRP-θ cells, 333 CGRP-ζ cells, 2817 Mrgprd cells, 234 Proprioceptors cells, 761 Sst cells, 488 Cold Thermoceptors cells; Extended Data Fig 1d 214 Aβ Field LTMR cells, 163 Aβ RA LTMR cells, 165 Aδ LTMR cells, 739 C-LTMR cells, 284 CGRP-α cells, 188 CGRP-ε cells, 122 CGRP-η cells, 216 CGRP-γ cells, 359 CGRP-θ cells, 122 CGRP-ζ cells, 1704 Mrgprd cells, 103 Proprioceptors cells, 397 Sst cells, 284 Cold Thermoceptors cells; Extended Data Fig1d 61 Aβ Field LTMR cells, 33 Aβ RA LTMR cells, 96 Aδ LTMR cells, 383 C-LTMR cells, 144 CGRP-α cells, 45 CGRP-ε cells, 26 CGRP-η cells, 97 CGRP-γ cells, 208 CGRP-θ cells, 63 CGRP-ζ cells, 670 Mrgprd cells, 40 Proprioceptors cells, 61 Sst cells, 128 Cold Thermoceptors cells; Extended data Fig 1e 30 Aβ Field LTMR cells, 20 Aβ RA LTMR cells, 30 Aδ LTMR cells, 122 C-LTMR cells, 57 CGRP-α cells, 87 CGRP-ε cells, 48 CGRP-η cells, 60 CGRP-γ cells, 9 CGRP-θ cells, 37 CGRP-ζ cells, 555 Mrgprd cells, 37 Proprioceptors cells, 24 Sst cells, 105 Cold Thermoceptors cells; Extended Data Fig1f Mature/P5 merge, P5/P0 merge, E15.5/P0 merge, E15.5/E12.5 merge; Extended Data Fig2a,b n=15 biologically independent sections for each in situ at each axial level, Extended Data Fig3a–c 293 Aβ RA LTMR cells, 106 Aδ LTMR cells, 408 C-LTMR cells, 225 CGRP-α cells, 595 CGRP-ε cells, 127 CGRP-η cells, 329 CGRP-γ cells, 199 CGRP-θ cells, 96 CGRP-ζ cells, 1103 Mrgprd cells, 131 cells, 656 Cold Thermoceptors cells; Extended Data Fig4a–e 257 Aβ Field LTMR cells, 273 Aβ RA LTMR cells, 182 Aδ LTMR cells, 1554 C-LTMR cells, 1440 CGRP-α cells, 850 CGRP-ε cells, 270 CGRP-η cells, 705 CGRP-γ cells, 758 CGRP-θ cells, 333 CGRP-ζ cells, 2817 Mrgprd cells, 234 Proprioceptors cells, 761 Sst cells, 488 Cold Thermoceptors cells, 1951 Unspecialized sensory neuron (USN), 5402 Sensory neuron progenitor (SNP), 2781 Neural crest progenitor (NCP), Extended Data Fig5a 696 Aβ Field LTMR cells, 734 Aβ RA LTMR cells, 659 Aδ LTMR cells, 3750 C-LTMR cells, 2072 CGRP-α cells, 1503 CGRP-ε cells, 555 CGRP-η cells, 1377 CGRP-γ cells, 1895 CGRP-θ cells, 743 CGRP-ζ cells, 7498 Mrgprd cells, 462 Proprioceptors cells, 1733 Sst cells, 1246 Cold Thermoceptors cells, 1951 unspecialized sensory neurons, 14982 cells with unmatched identity; Extended data Fig5b 257 Aβ Field LTMR cells, 273 Aβ RA LTMR cells, 182 Aδ LTMR cells, 1554 C-LTMR cells, 1440 CGRP-α cells, 850 CGRP-ε cells, 270 CGRP-η cells, 705 CGRP-γ cells, 758 CGRP-θ cells, 333 CGRP-ζ cells, 2817 Mrgprd cells, 234 Proprioceptors cells, 761 Sst cells, 488 Cold Thermoceptors cells; Extended Data Fig5c n=3 biologically independent samples, Extended Data Fig6a,b Adult: 257 Aβ Field LTMR cells, 273 Aβ RA LTMR cells, 182 Aδ LTMR cells, 1554 C-LTMR cells, 1440 CGRP-α cells, 850 CGRP-ε cells, 270 CGRP-η cells, 705 CGRP-γ cells, 758 CGRP-θ cells, 333 CGRP-ζ cells, 2817 Mrgprd cells, 234 Proprioceptors cells, 761 Sst cells, 488 Cold Thermoceptors cells, Postnatal day 5 209 Aβ Field LTMR cells, 297 Aβ RA LTMR cells, 237 Aδ LTMR cells, 1392 C-LTMR cells, 445 CGRP-α cells, 473 CGRP-ε cells, 153 CGRP-η cells, 334 CGRP-γ cells, 640 CGRP-θ cells, 243 CGRP-ζ cells, 3019 Mrgprd cells, 104 Proprioceptors cells, 787 Sst cells, 405 Cold Thermoceptors cells, Postnatal day 0 257 Aβ Field LTMR cells, 273 Aβ RA LTMR cells, 182 Aδ LTMR cells, 1554 C-LTMR cells, 1440 CGRP-α cells, 850 CGRP-ε cells, 270 CGRP-η cells, 705 CGRP-γ cells, 758 CGRP-θ cells, 333 CGRP-ζ cells, 2817 Mrgprd cells, 234 Proprioceptors cells, 761 Sst cells, 488 Cold Thermoceptors cells, Postnatal day 0 214 Aβ Field LTMR cells, 163 Aβ RA LTMR cells, 165 Aδ LTMR cells, 739 C-LTMR cells, 284 CGRP-α cells, 188 CGRP-ε cells, 122 CGRP-η cells, 216 CGRP-γ cells, 359 CGRP-θ cells, 122 CGRP-ζ cells, 1704 Mrgprd cells, 103 Proprioceptors cells, 397 Sst cells, 284 Cold Thermoceptors cells, Embryonic Day 15.5 61 Aβ Field LTMR cells, 33 Aβ RA LTMR cells, 96 Aδ LTMR cells, 383 C-LTMR cells, 144 CGRP-α cells, 45 CGRP-ε cells, 26 CGRP-η cells, 97 CGRP-γ cells, 208 CGRP-θ cells, 63 CGRP-ζ cells, 670 Mrgprd cells, 40 Proprioceptors cells, 61 Sst cells, 128 Cold Thermoceptors cells, Embryonic Day 12.5 30 Aβ Field LTMR cells, 20 Aβ RA LTMR cells, 30 Aδ LTMR cells, 122 C-LTMR cells, 57 CGRP-α cells, 87 CGRP-ε cells, 48 CGRP-η cells, 60 CGRP-γ cells, 9 CGRP-θ cells, 37 CGRP-ζ cells, 555 Mrgprd cells, 37 Proprioceptors cells, 24 Sst cells, 105 Cold Thermoceptors cells, Extended Data Fig7a n=3 biologically independent samples for the Avil in situ, control/knockout 776/435 Aβ Field LTMR cells, 728/1114 Aβ RA LTMR cells, 667/927 Aδ LTMR cells, 2928/2486 C-LTMR cells, 478/656 CGRP-α cells, 990/582 CGRP-ε cells, 721/589 CGRP-η cells, 711/540 CGRP-γ cells, 1845/2381 CGRP-θ cells, 417/230 CGRP-ζ cells, 5556/7508 Mrgprd cells, 446/654 Proprioceptors cells, 1747/1460 Sst cells, 493/675 Cold Thermoceptors cells; Extended Data Fig 7b n=3 biologically independent samples for the in situ, control/knockout 191/254 Aβ Field LTMR cells, 246/332 Aβ RA LTMR cells, 170/236 Aδ LTMR cells, 917/800 C-LTMR cells, 706/545 CGRP-α cells, 495/365 CGRP-ε cells, 279/330 CGRP-η cells, 559/429 CGRP-γ cells, 907/605 CGRP-θ cells, 292/341 CGRP-ζ cells, 1977/2960 Mrgprd cells, 123/213 Proprioceptors cells, 724/835 Sst cells, 427/392 Cold Thermoceptors cells; Extended Data Fig8e,f tSNE plots represent 257 Aβ Field LTMR cells, 273 Aβ RA LTMR cells, 182 Aδ LTMR cells, 1554 C-LTMR cells, 1440 CGRP-α cells, 850 CGRP-ε cells, 270 CGRP-η cells, 705 CGRP-γ cells, 758 CGRP-θ cells, 333 CGRP-ζ cells, 2817 Mrgprd cells, 234 Proprioceptors cells, 761 Sst cells, 488 Cold Thermoceptors cells; Extended Data Fig8h n=3 biologically independent samples for the immunostaining, Extended Data Fig 8j n=3 biologically independent samples for the immunostaining, Extended Data Fig8k n=3 biologically independent samples for the immunostaining and the in situ, Extended Data Fig9a n=3 biologically independent samples; Extended Data Fig9b–f 112/231 Aβ Field LTMR cells, 155/301 Aβ RA LTMR cells, 124/132 Aδ LTMR cells, 1124/1111 C-LTMR cells, 225/231 CGRP-α cells, 369/239 CGRP-ε cells, 105/76 CGRP-η cells, 235/117 CGRP-γ cells, 573/674 CGRP-θ cells, 209/110 CGRP-ζ cells, 2174/2345 Mrgprd cells, 95/170 Proprioceptors cells, 701/721 Sst cells, 175/201 Cold Thermoceptors cells Extended Data Fig9g n=8 biologically independent samples for luciferase shRNA, n=8 biological samples for Pou4f3 shRNA; Extended Data Figure 9h n=3 biologically independent samples; Extended Data Fig10a control 342 Aβ Field LTMR cells, 122 Aβ RA LTMR cells, 413 Aδ LTMR cells, 783 C-LTMR cells, 363 CGRP-α cells, 314 CGRP-ε cells, 320 CGRP-η cells, 418 CGRP-γ cells, 460 CGRP-θ cells, 352 CGRP-ζ cells, 1162 Mrgprd cells, 368 Proprioceptors cells, 149 Sst cells, 442 Cold Thermoceptors cells, in NGF−/−;Bax−/− 82 Aβ Field LTMR cells, 162 Aβ RA LTMR cells, 124 Aδ LTMR cells, 395 Proprioceptors, 2558 ClusterA cells, 1878 ClusterB cells, 362, ClusterC cells, 1461 ClusterD cells, 714 ClusterE cells; Extended Data Fig10c n=3 biologically independent samples for each in situ; Extended Data Table 1 257 Aβ Field LTMR cells, 273 Aβ RA LTMR cells, 182 Aδ LTMR cells, 1554 C-LTMR cells, 1440 CGRP-α cells, 850 CGRP-ε cells, 270 CGRP-η cells, 705 CGRP-γ cells, 758 CGRP-θ cells, 333 CGRP-ζ cells, 2817 Mrgprd cells, 234 Proprioceptors cells, 761 Sst cells, 488 Cold Thermoceptors cells.
Data availability.
Sequence data of this study have been deposited with accession code GSE139088. The data is also available for browsing and analysis via the HTML interface at https://kleintools.hms.harvard.edu/tools/springViewer_1_6_dev.html?datasets/Sharma2019/all.
Code availability.
The computational code used in the study is available at GitHub (https://github.com/wagnerde) or upon request.
Extended Data
Extended Data Figure 1. Quality control metrics for DRG sensory neuron scRNA-seq data and canonical correlation analysis.
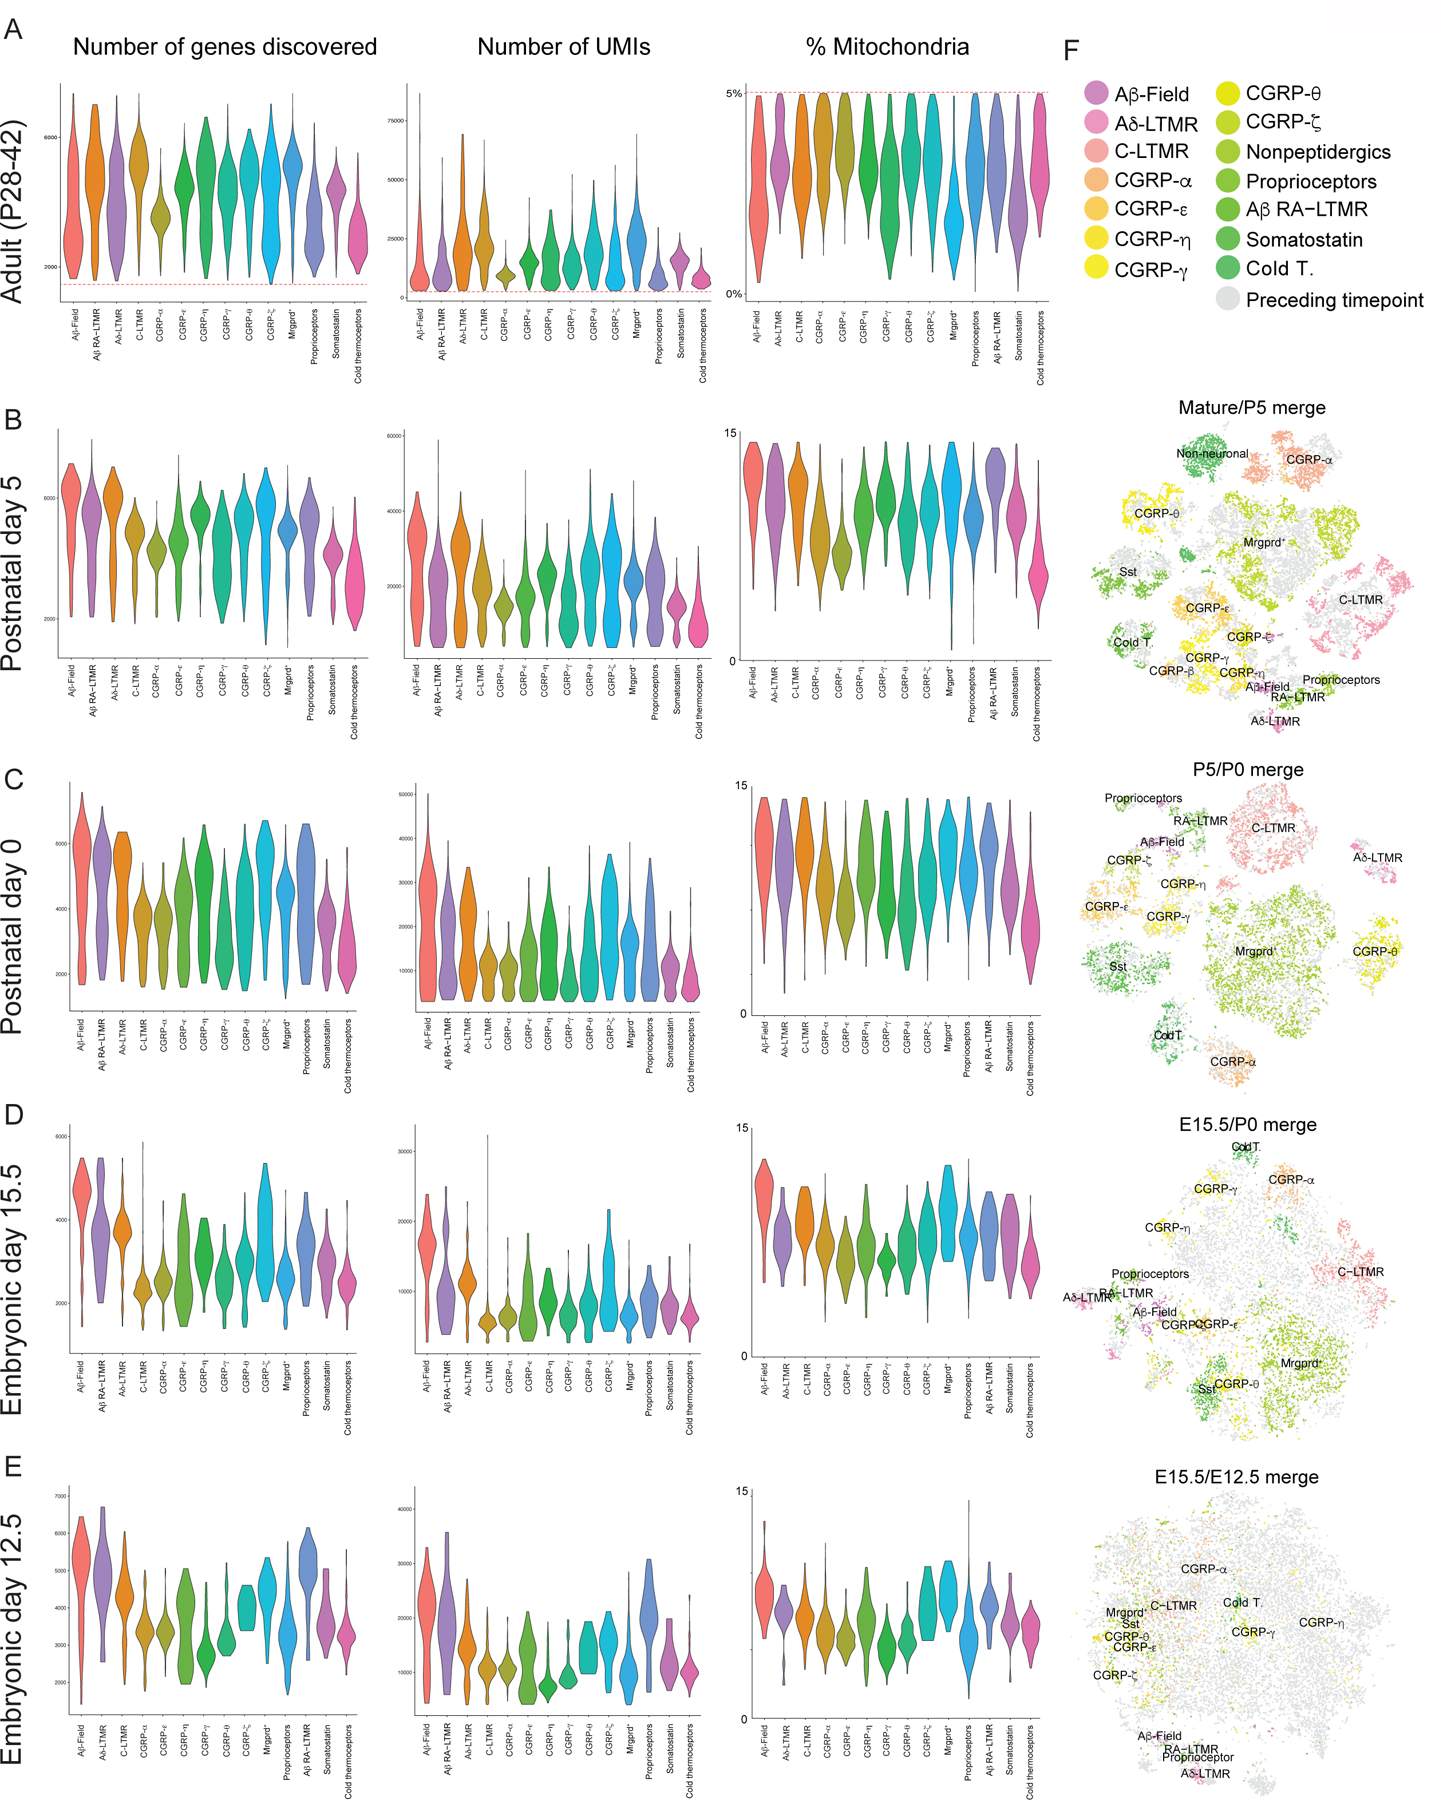
a-e. Distribution of the number of genes discovered in each cell (individual points) in each population of sensory neuron (underlying violin plot) in Adult (A), Postnatal day 5 (B), Postnatal day 0 (C), Embryonic day 15.5 (D), Embryonic day 12.5 (E). Individual cells with <1000 genes (considered to be low quality) or >10000 genes (considered to be likely doublets) discovered were eliminated from subsequent analysis. Individual cells with <2000 UMIs (considered to be low quality) were excluded from subsequent analysis. UMI: unique molecular identifier
f. Integration of Adult/P5 (1st plot), P5/P0 (2nd plot), P0/E15.5 (3rd plot), E15.5/E12.5 (4th plot) using canonical correlation analysis to find common sources of variation between timepoints. Single cells are labeled as individual points, with color representing identified cell types and gray representing cells in the preceding timepoint.
Extended Data Figure 2. Somatosensory neuron subtype composition varies across axial levels.
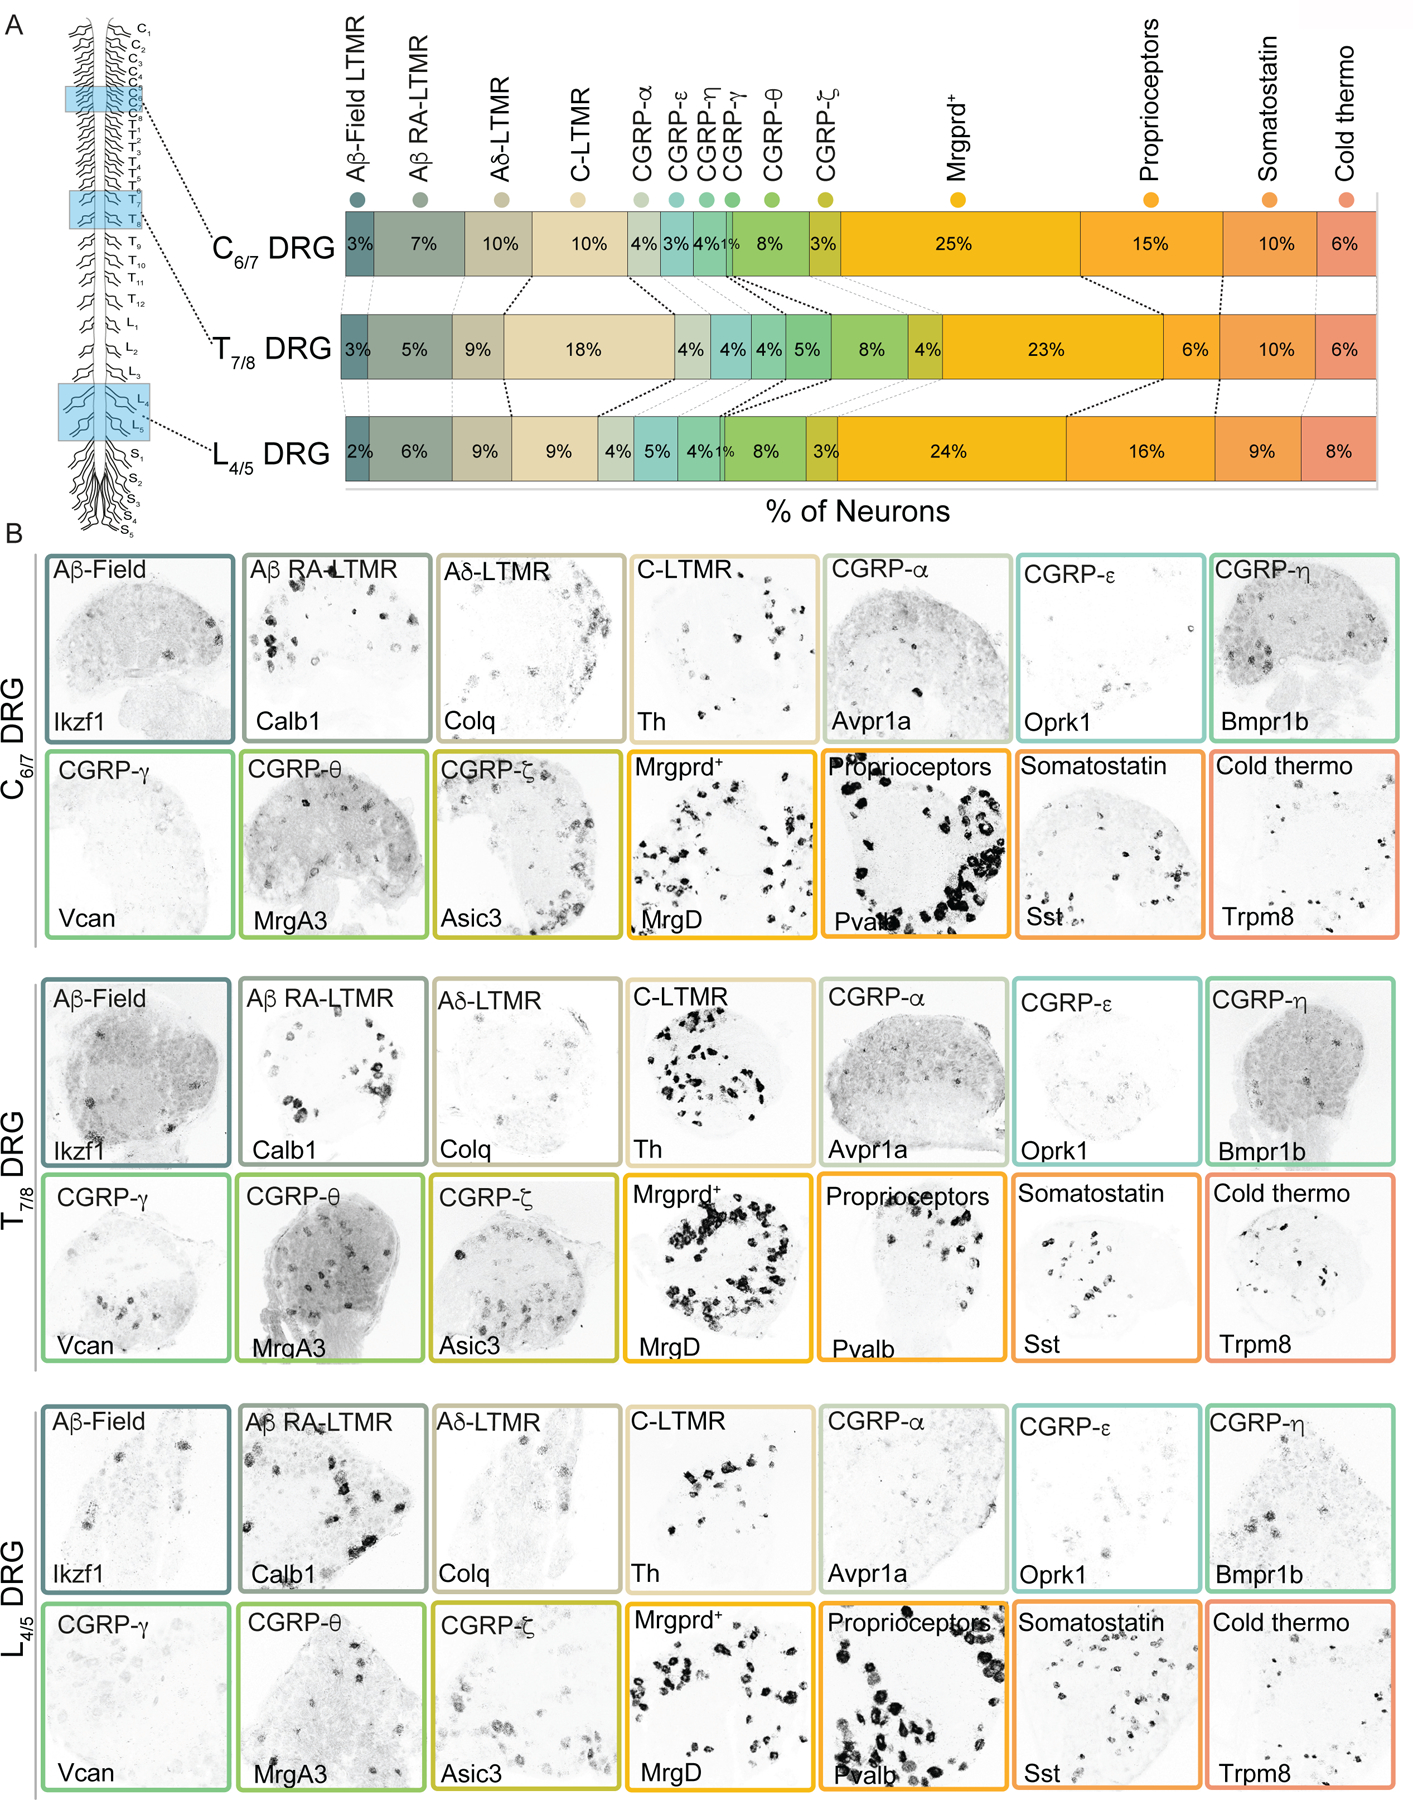
a. (Left) Schematic representing which axial levels were quantified. (Right) Quantification of single molecule RNA-FISH to determine the percentage of C6/7, T7/8, and L4/5 DRG neurons that corresponds to each transcriptionally defined somatosensory neuron subtype. Black dotted lines are used to highlight the subtypes present at different percentages at different axial levels.
b. Example images of single molecule RNA-FISH for transcriptionally distinct somatosensory neuron subtypes in C6/7 (top row), T7/8 (middle row) and L4/5 (bottom row) DRGs.
Extended Data Figure 3. Dorsal root ganglia and trigeminal ganglia are constituted by similar somatosensory neuron subtypes.
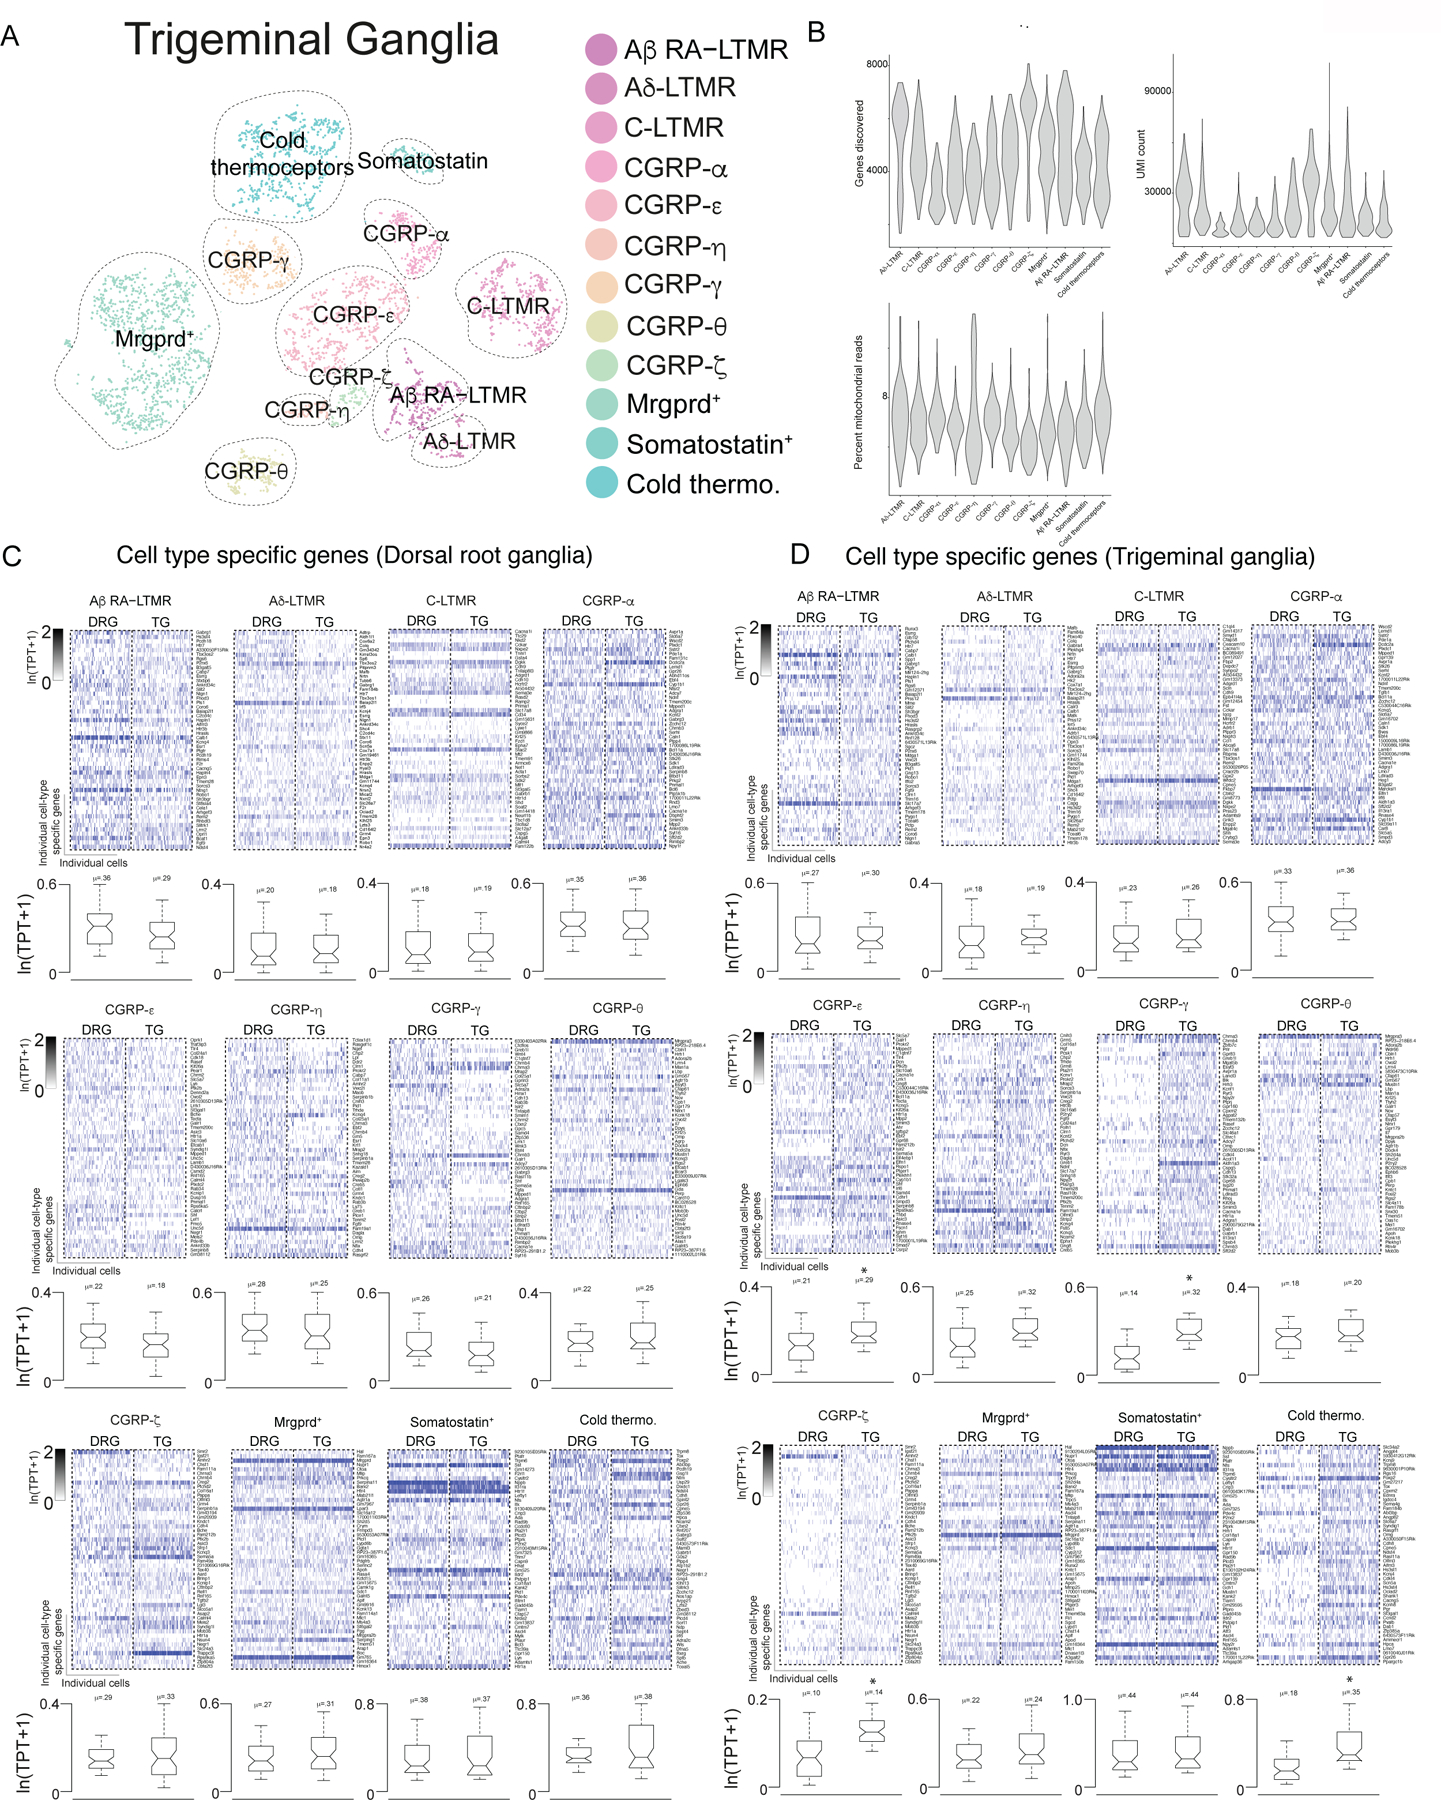
a. tSNE visualization of trigeminal ganglia scRNA-seq data obtained from Adult (P28–42) mice. Colors denote principle cell types and dotted circles were added to aid in visualization of principal cell types. LTMR/proprioceptor specific gene expression overlaid onto t-SNE visualization of mature DRG sensory neurons.
b. Distribution of the number of genes discovered in each population of sensory neuron in adult trigeminal ganglia displayed as violin plot. UMI: unique molecular identifier.
c. Heatmap depicting expression of the genes enriched in somatosensory neuron subtypes resident in the dorsal root ganglia as well as their expression levels in cognate trigeminal ganglia subtype counterparts.
d. Heatmap depicting expression of the genes enriched in somatosensory neuron subtypes resident in the trigeminal as well as their expression levels in cognate dorsal root ganglia subtype counterparts. For c,d boxes represent IQR, whiskers represent minimum and maximum values, and notches represent the 95% confidence interval of the median. TPT: tags per ten thousand. * denotes two sided Wilcoxon rank-sum test with Bonferroni corrected p < 0.01. TPT: tags per ten thousand.
Extended Data Figure 4. Neural crest progenitors, sensory neuron progenitors and unspecialized sensory neurons express highly distinct gene programs.
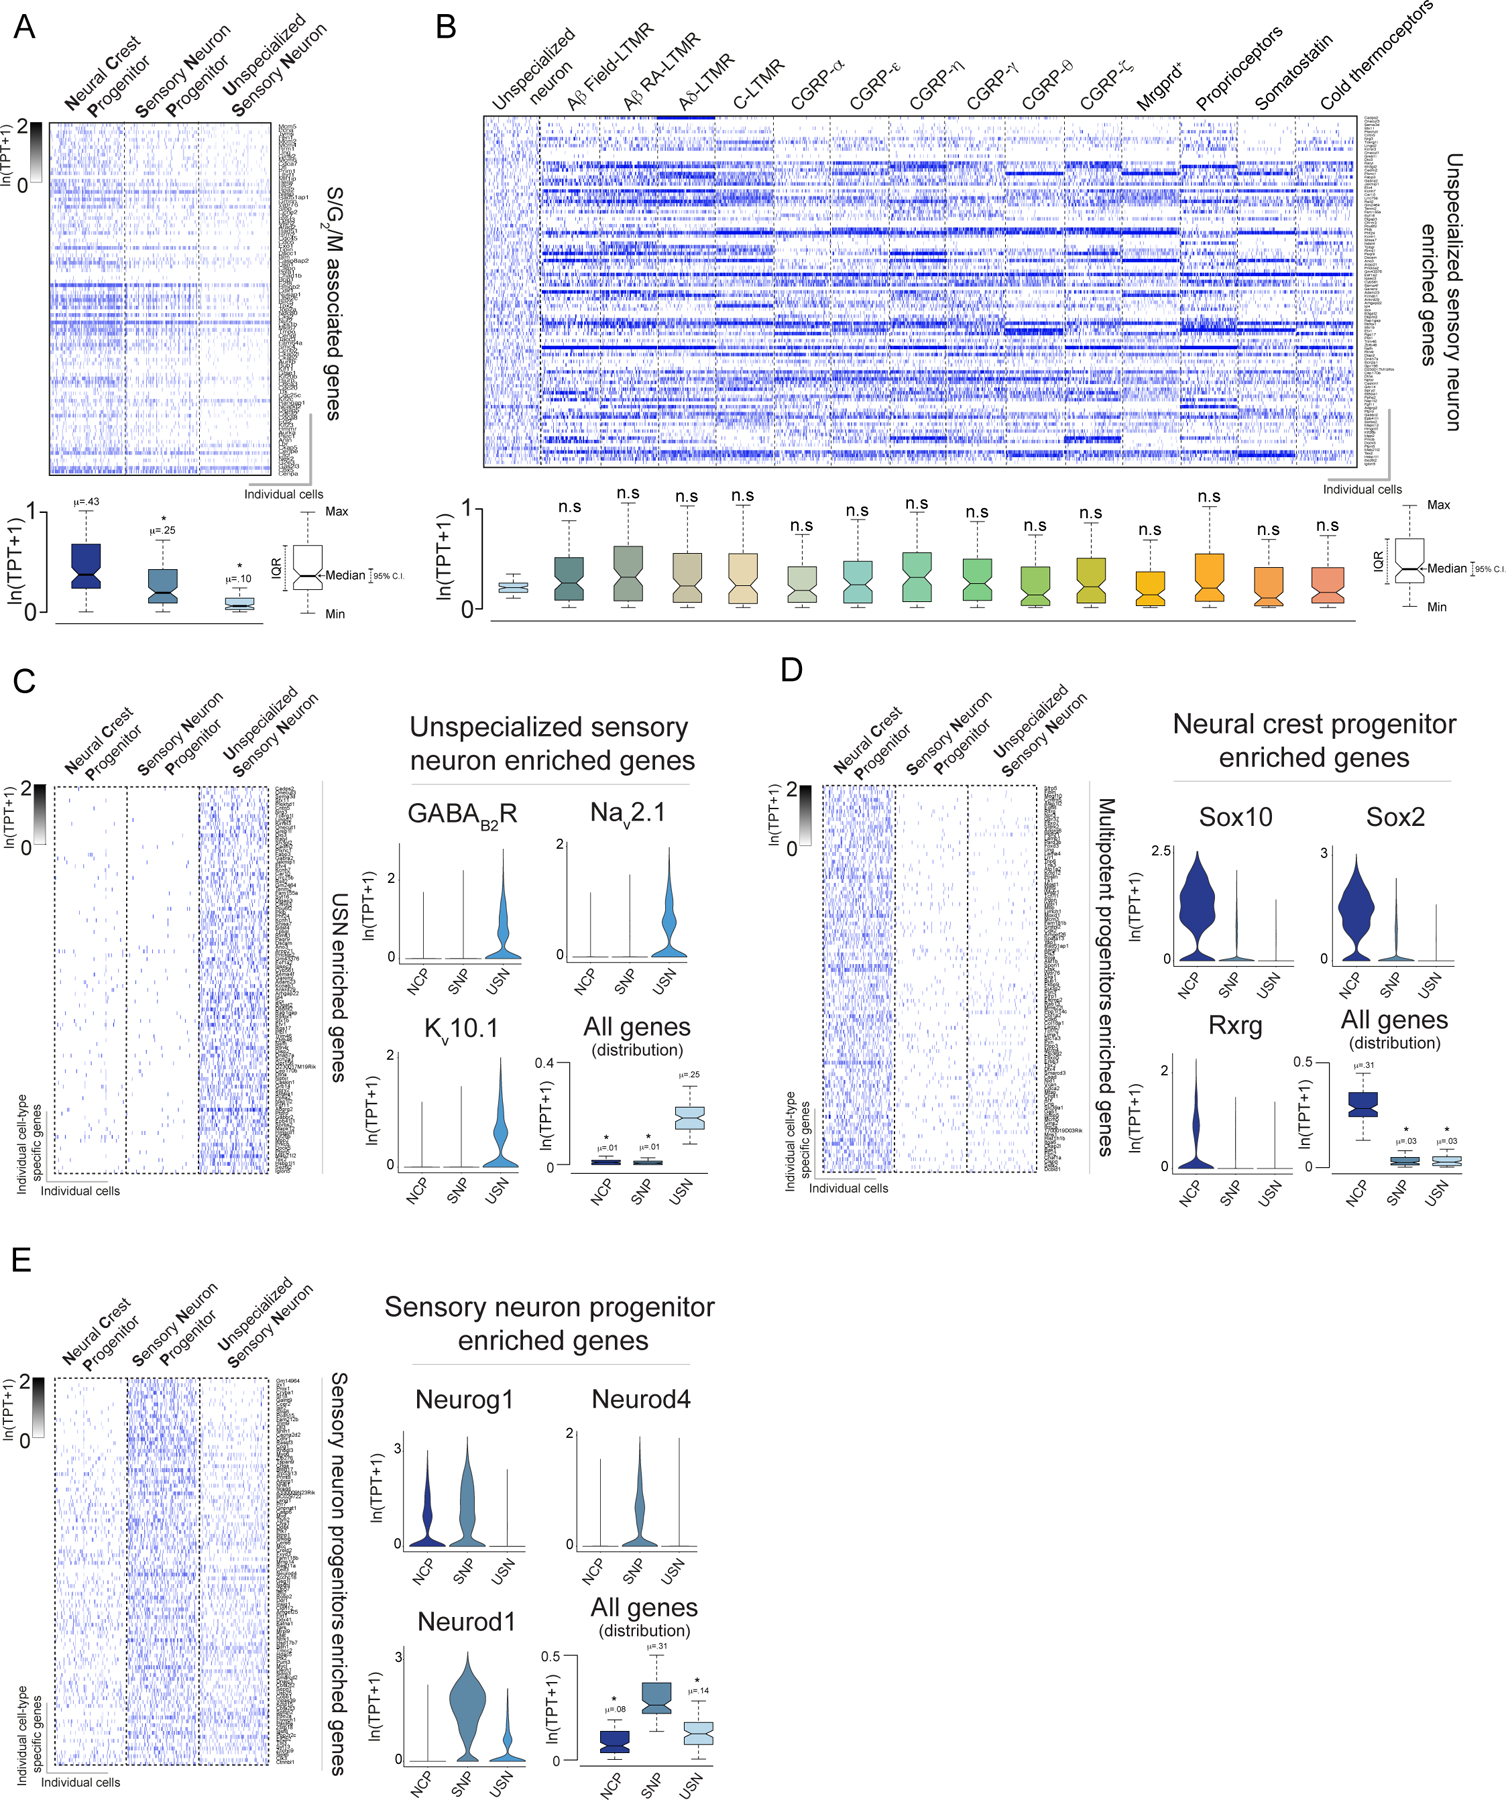
a. Heatmap depicting cell cycle (S/G2/M) associated genes for the principal subtypes identified at E11.5.
b. Heatmap depicting expression levels of unspecialized sensory neurons enriched genes in both in mature somatosensory neuron subtypes and unspecialized sensory neurons.
c. (Left) Heatmap depicting expression of the genes enriched in unspecialized sensory neurons (USN) as well as their expression levels in neural crest progenitors (NCP) and sensory neuron progenitors (SNP). (Right) Violin and box plots depicting example genes enriched in USNs.
d. Heatmap depicting expression of the genes enriched in neural crest progenitors (NCP) as well as their expression levels in sensory neuron progenitors (SNP) and unspecialized sensory neurons (USN). (Right) Violin and box plots depicting example genes enriched in NCPs.
e. Heatmap depicting expression of the genes enriched in sensory neuron progenitors (SNP) as well as their expression levels in neural crest progenitors (NCP) and sensory neuron progenitors (SNP). (Right) Violin and box plots depicting example genes enriched in SNPs. For a-e boxes represent IQR, whiskers represent minimum and maximum values, and notches represent the 95% confidence interval of the median. TPT: tags per ten thousand. * denotes two sided Wilcoxon rank-sum test with Bonferroni corrected p < 0.01.
Extended Data Figure 5. Force directed layout of putative subtype-restricted transcription factors.
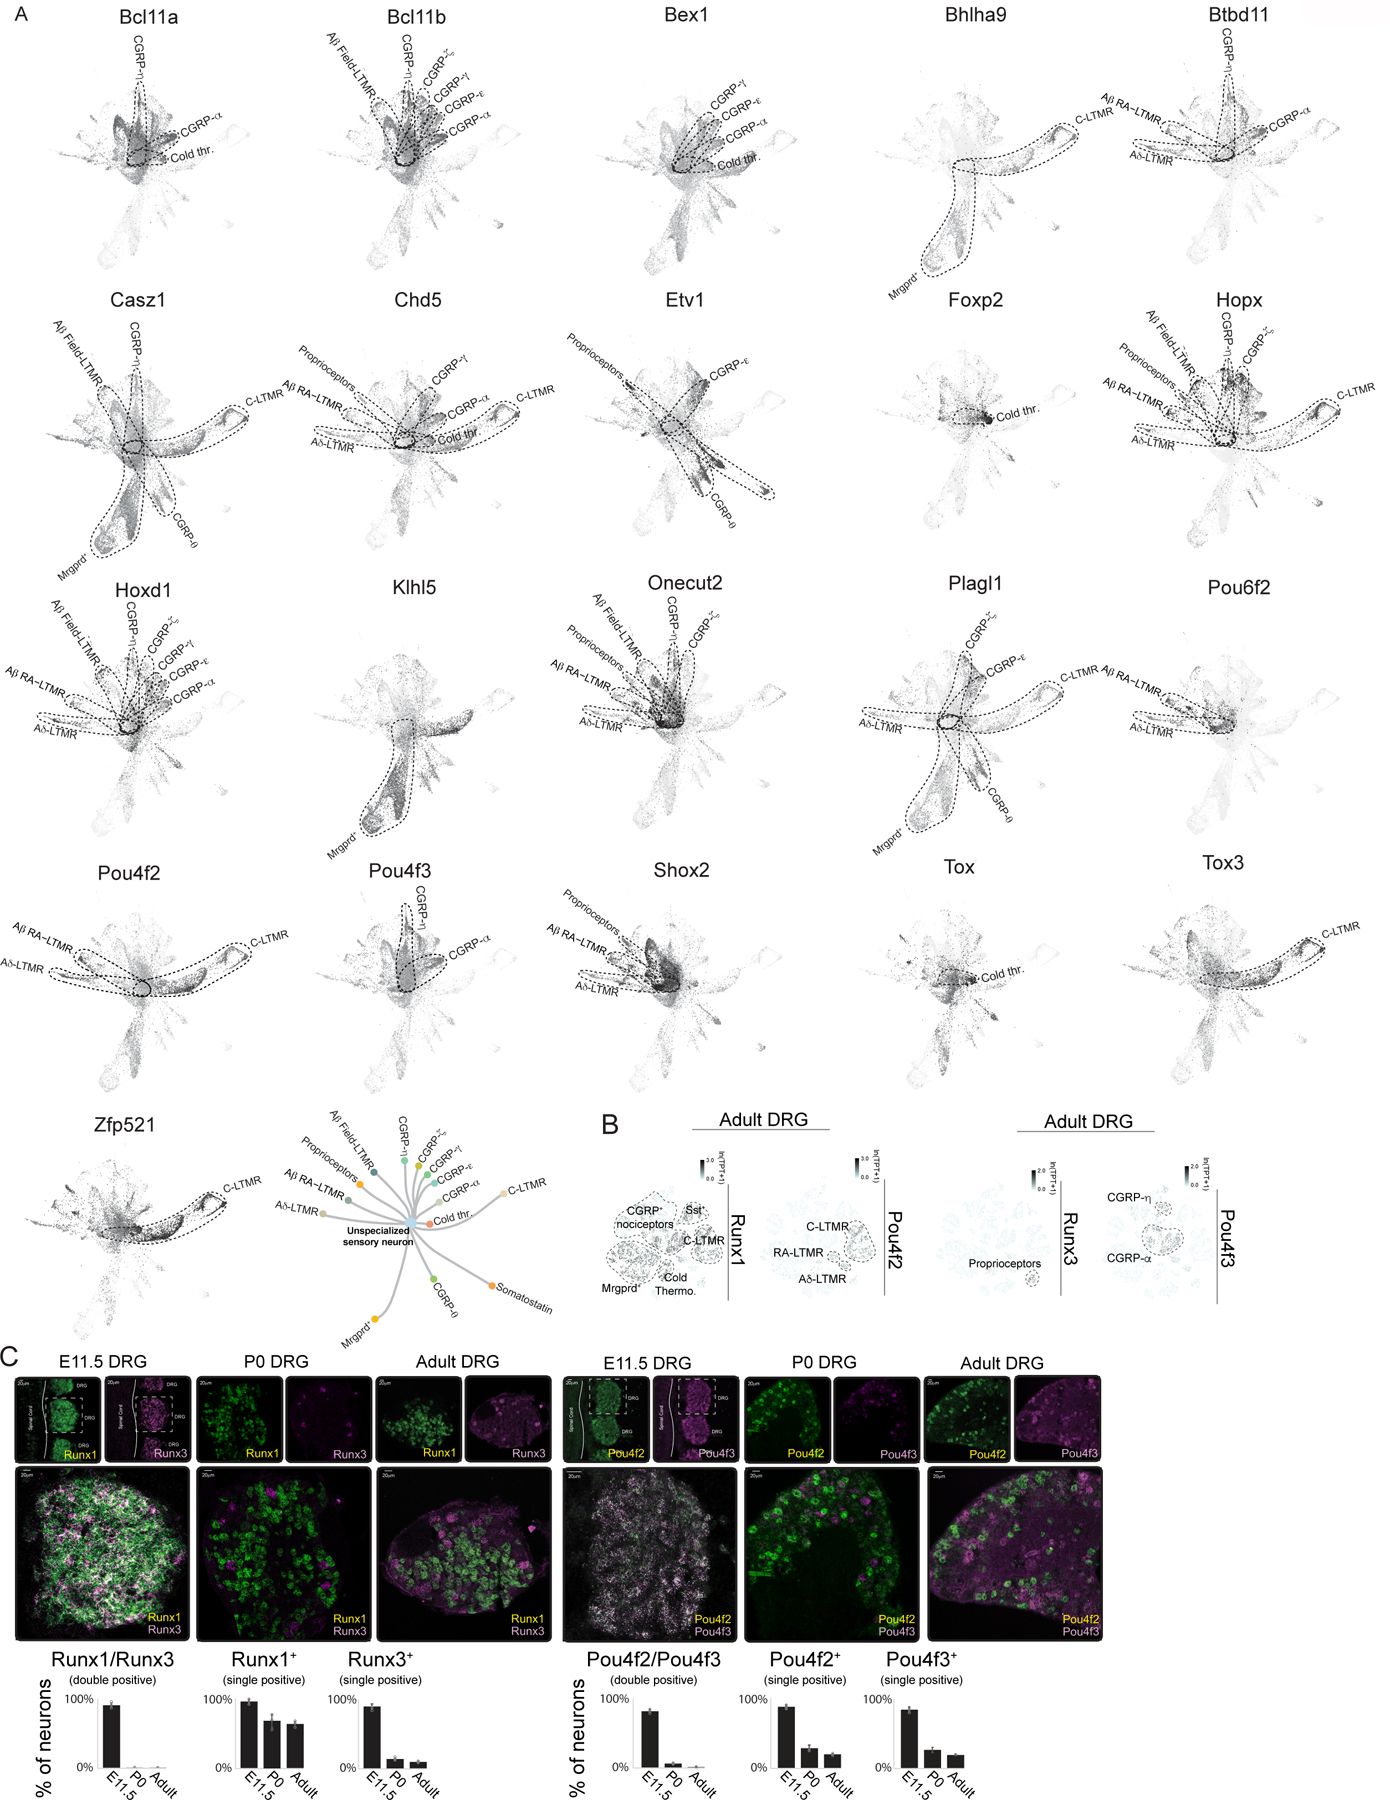
a. Force directed layout representation of DRG displaying with expression patterns displayed for the remaining putative subtype-restricted transcription factors.
b. tSNE visualization of Runx1, Runx3, Pou4f2 and Pou4f3 expression in the adult DRG. TPT: tags per ten thousand.
c. (Left) Single molecule RNA FISH for Runx1 and Runx3 in E11.5, P0 or adult DRGs. For E11.5, the spinal cord and DRG are labeled as references. (Right) Single molecule RNA FISH for Pou4f2 and Pou4f3 in E11.5, P0 or adult DRGs. For E11.5, the spinal cord and DRG are labeled as references. (Bottom) Quantification of the RNA-FISH. * represents two-sided t-test p<0.01.
Extended Data Figure 6. The expression of somatosensory neuron subtype specific genes during development.
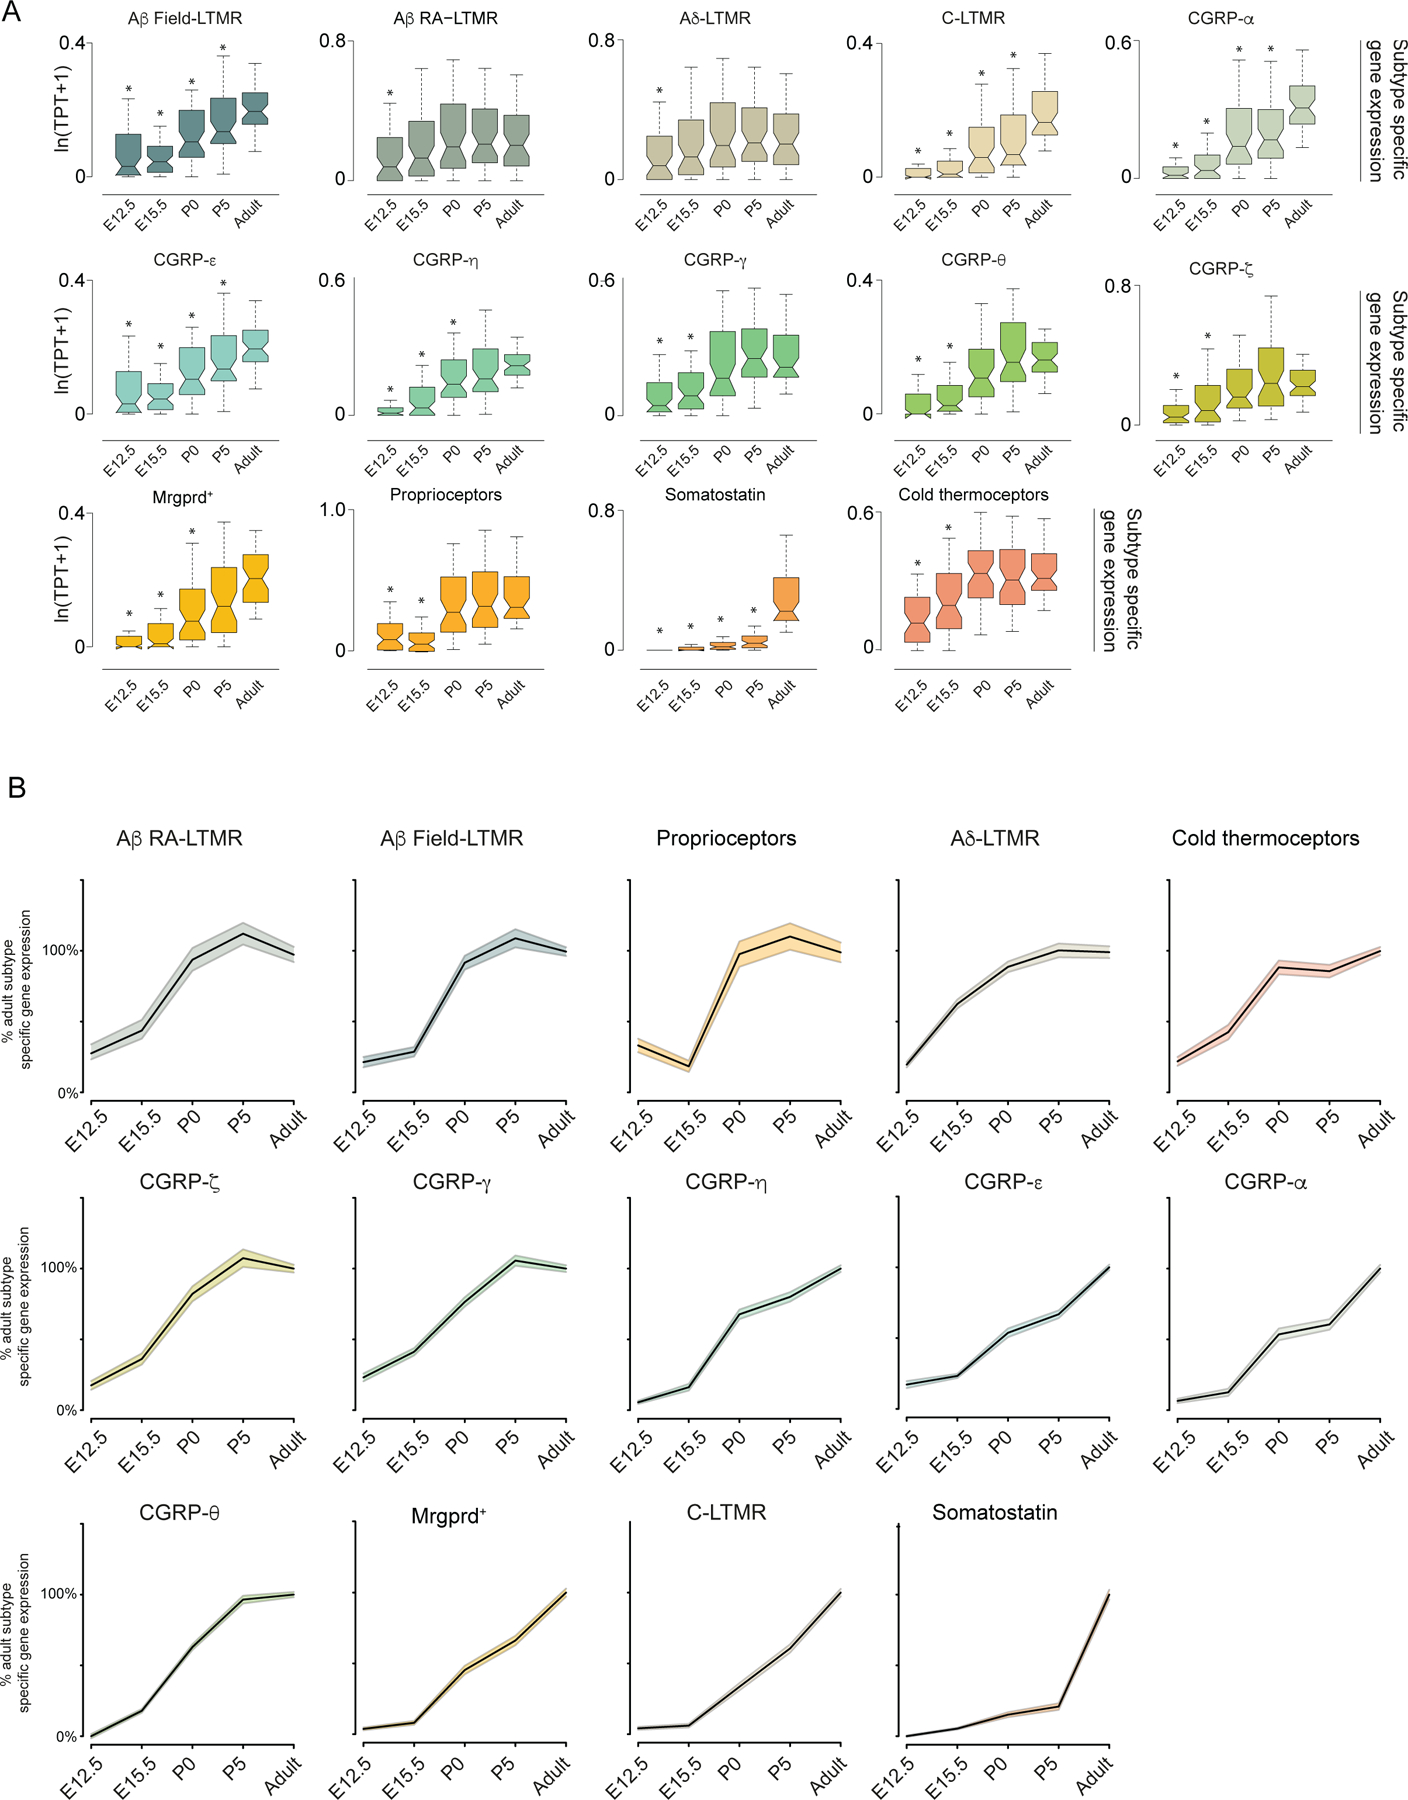
A. Box plots representing subtype specific genes at E12.5, E15.5, P0, P5 and Adult (P28–42) for each identified somatosensory neuron subtype. Boxes represent IQR, whiskers represent minimum and maximum values, and notches represent the 95% confidence interval of the median. TPT: tags per ten thousand. * denotes two sided Wilcoxon rank-sum test with Bonferroni corrected p < 0.01.
B. Normalized line plots displaying what percentage of adult-levels of subtype specific gene expression are detected at E12.5, E15.5, P0, and P5. The black line represents the median of each time point with Adult being defined as ‘100%’. Upper and lower bands represent a 95% confidence interval (defined as ± 1.87 * IQR/√n, where n=sample size, IQR: Interquartile range)
Extended Data Figure 7. DRG counts and TF analysis in Pou4f2 and Pou4f3 mutants.
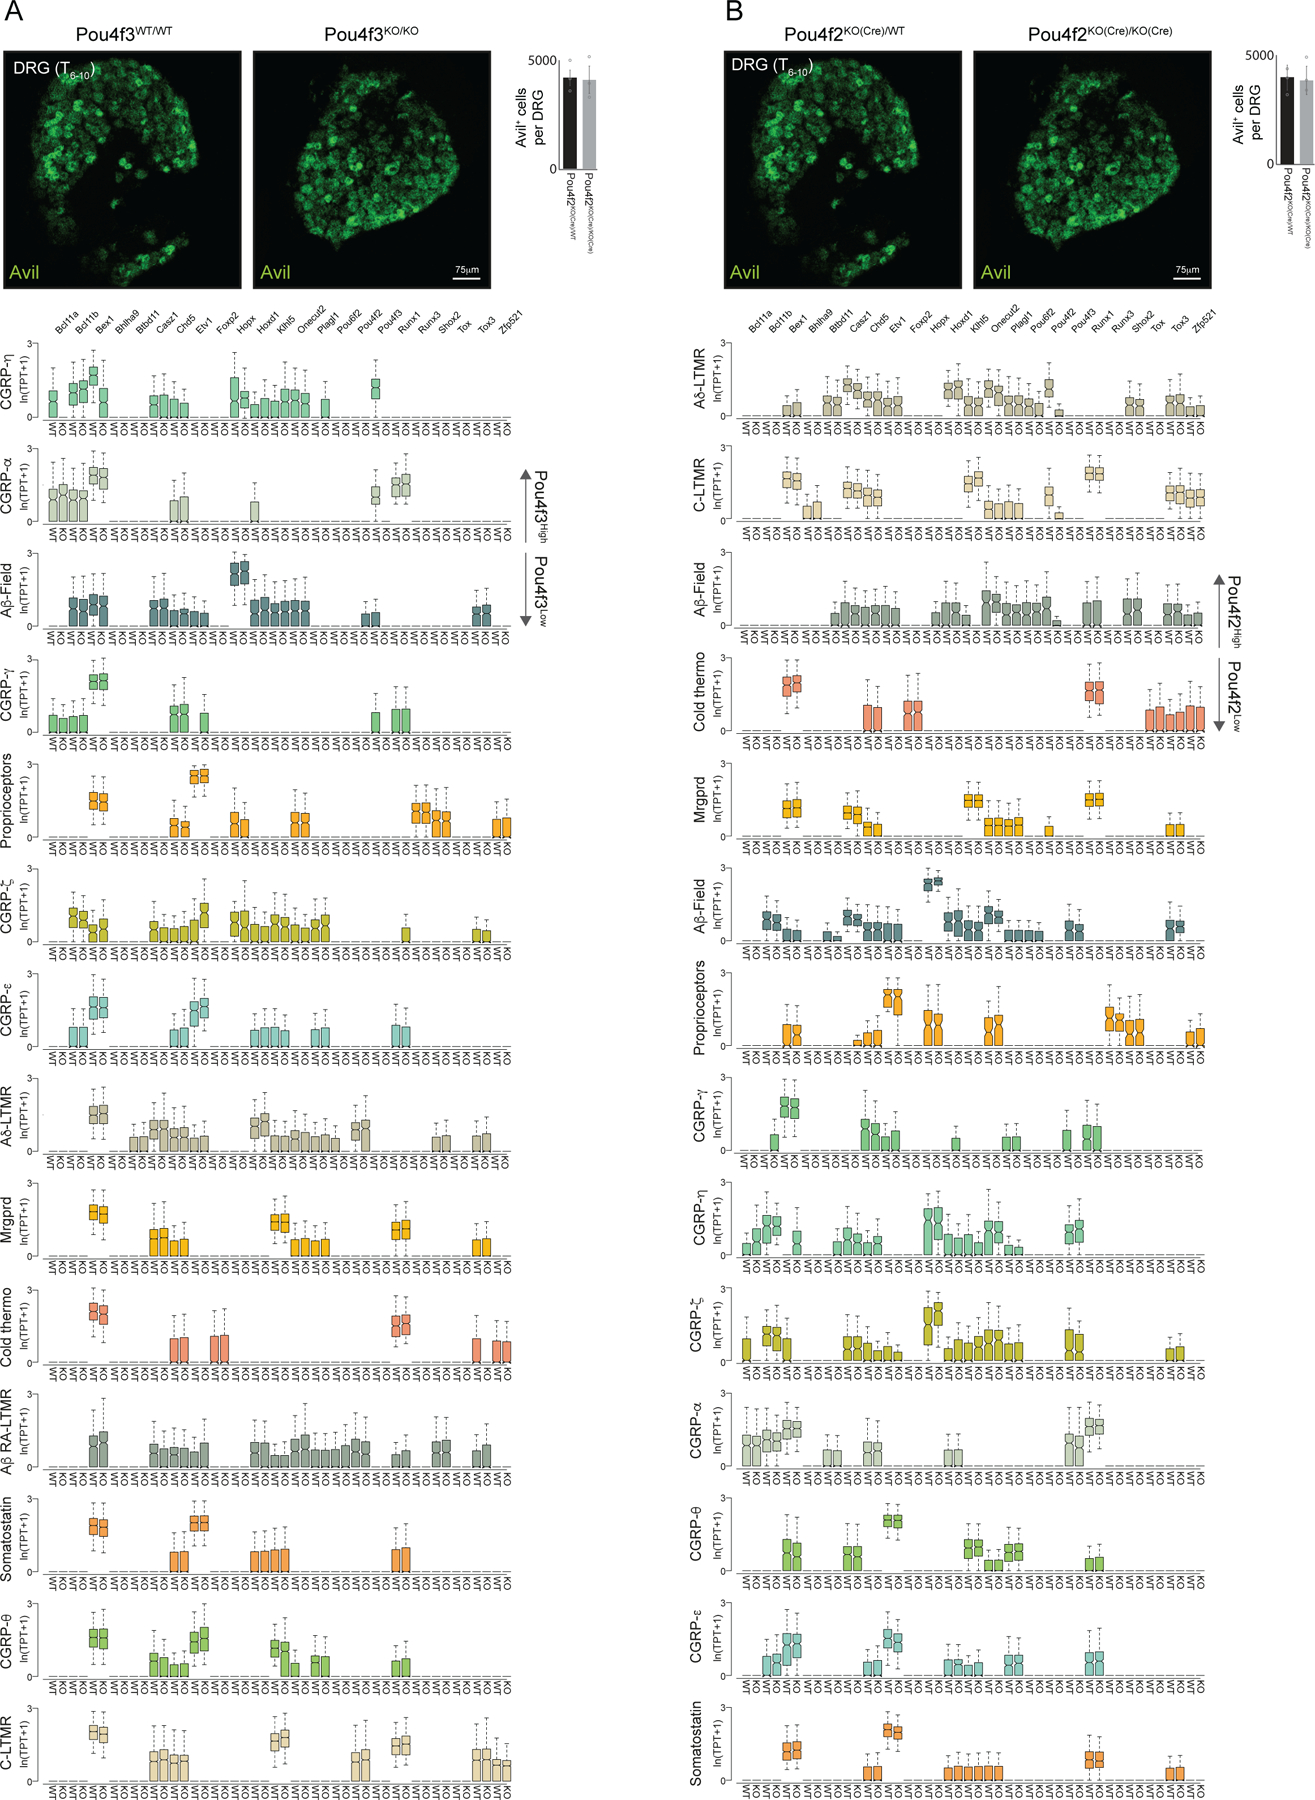
a. Representative images of Avil smRNA-FISH from T7/8 DRGs in Pou4f2KO(Cre)/WT (left) or Pou4f2KO(Cre)/KO(Cre) (right) littermate control DRGs. Quantification of estimated cell count per DRG presented to the right of the images.
b. Representative images of Avil smRNA-FISH from T7/8 DRGs in Pou4f3WT/WT (left) or Pou4f3KO/KO (right) littermate control DRGs. Quantification of estimated cell count per DRG presented to the right of the images.
c. Box plots displaying the expression levels of subtype-restricted TFs in each somatosensory neuron subtype in Pou4f2WT/WT (left column) or Pou4f2KO(Cre)/KO(Cre) (right column) littermates.
d. Box plots displaying the expression levels of subtype-restricted TFs in each somatosensory neuron subtype in Pou4f3WT/WT (left column) or Pou4f3KO/KO (right column) littermates. For c,d boxes represent IQR, whiskers represent minimum and maximum values, and notches represent the 95% confidence interval of the median. TPT: tags per ten thousand.
Extended Data Figure 8. Generation and validation of Bmpr1bT2a-Cre and Avpr1aT2a-Cre mouse lines.
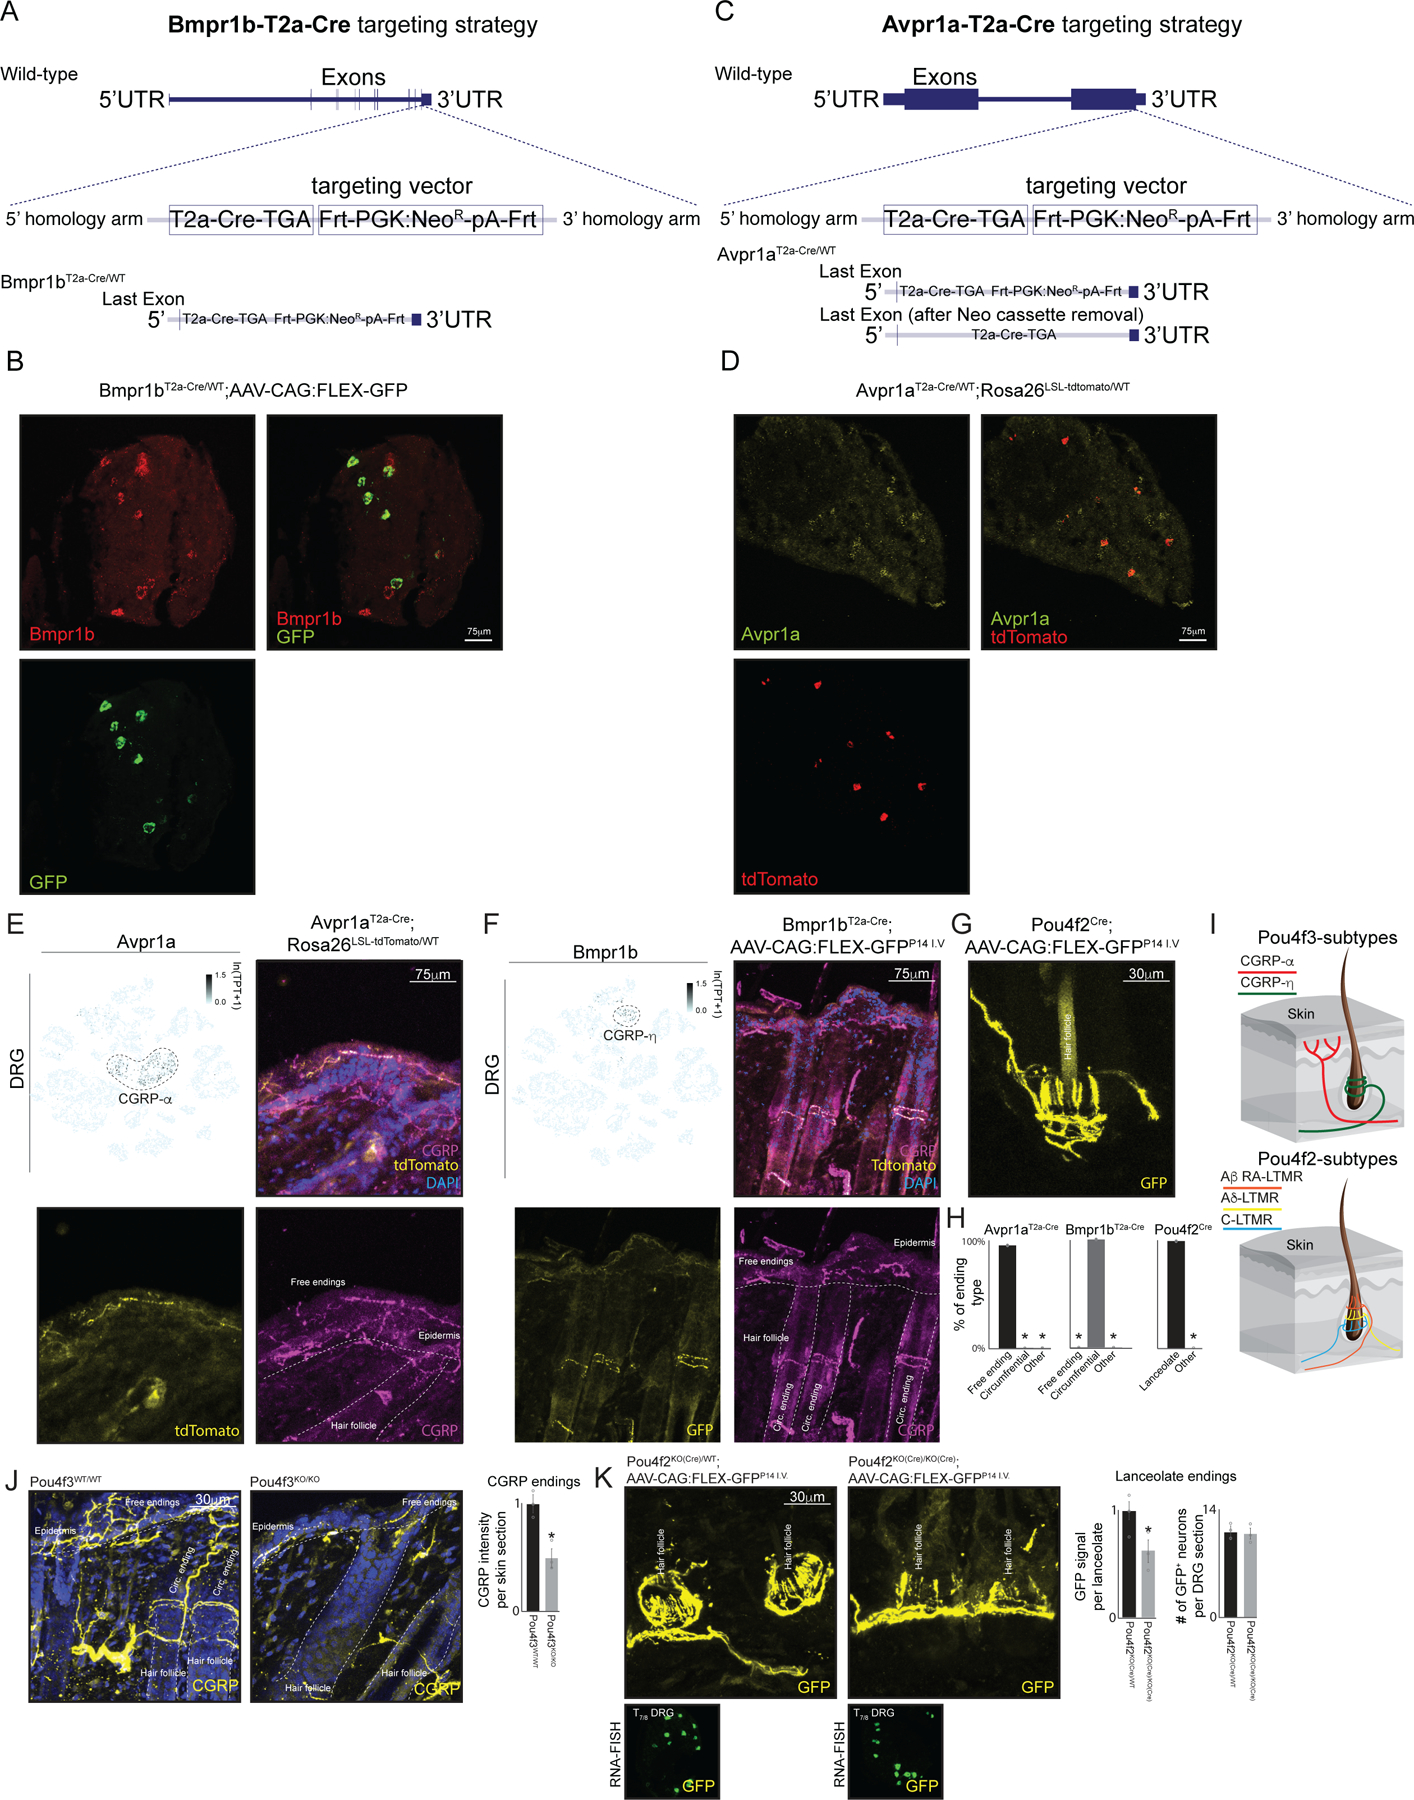
a. Targeting strategy for inserting a T2a-Cre-TGASTOP codon; Frt-PGK:NeoR-pA-Frt cassette immediately upstream of the stop codon in the Bmpr1b gene.
b. Single molecule RNA-FISH for both Bmpr1b and GFP in Bmpr1bT2aCre ; AAV-CAG:FLEX-GFPP14 I.V. mice to confirm the specificity and utility of the Bmpr1bT2a-Cre allele.
c. Targeting strategy for inserting a T2a-Cre-TGASTOP codon; Frt-PGK:NeoR-pA-Frt cassette immediately upstream of the stop codon in the Avpr1a gene.
d. Single molecule RNA-FISH for both Avpr1a and tdTomato in Avpr1aT2a-Cre(ΔNeo) ;Rosa26 LSL-tdTomato/WT mice to confirm the specificity and utility of the Avpr1aT2-aCre allele.
e. (Top left) tSNE representation of transcriptionally mature DRG overlaying the expression pattern of Avpr1a, (Remaining images) Representative immunostaining images of tdTomato and CGRP in skin sections obtained from Avpr1aT2a-Cre; Rosa26LSL-tdTomato animals. TPT: tags per ten thousand.
f. (Top left) tSNE representation of transcriptionally mature DRG overlaying the expression pattern of Bmpr1b. (Remaining images) Representative immunostaining images of tdTomato and CGRP in skin sections obtained from Bmpr1bT2a-Cre; AAV-CAG:FLEX-GFPP14 I.V. animals. TPT: tags per ten thousand.
g. Representative immunostaining images of GFP in skin sections obtained from Pou4f2KO(Cre);AAV-CAG:FLEX-GFPP14 I.V animals.
h. Quantification of ending morphology for CGRP-α (Avpr1aT2a-Cr);Rosa26LSL-tdTomato) and CGRP-η (Bmpr1bT2a-Cre;AAV-CAG:FLEX-GFPP14 I.V.) somatosensory neuron subtypes.
i. Schematic representation of the skin with the distinct morphological ending types of CGRP-α and CGRP-η neurons displayed.
j. Representative images of CGRP immunostaining in skin samples of 2–3 week old Pou4f3WT/WT (left) or Pou4f3KO/KO (right) littermate controls. Statistical comparisons were done using a two-tailed t-test. * represents p<0.01
k. Representative images of GFP immunostatining in skin samples of 3–4 week old Pou4f2KO(Cre)/WT (top left) or Pou4f2KO(Cre)/KO(Cre) (right) littermate controls and representative RNA-FISH for GFP in Pou4f2KO(Cre)/WT and Pou4f2KO(Cre)/KO(Cre) littermate controls are displayed below the skin immunostaining images. In h * represents two-way ANOVA with a Tukey’s HSD post-hoc analysis p < 0.01. In j,k * represents two-sided t-test p<0.01Bar graphs in h,j,k show mean +/- s.e.m.
Extended Data Figure 9. Postnatal depletion of Pou4f3 results in a loss of subtype specific gene expression in CGRP-α and CGRP-η □eurons.
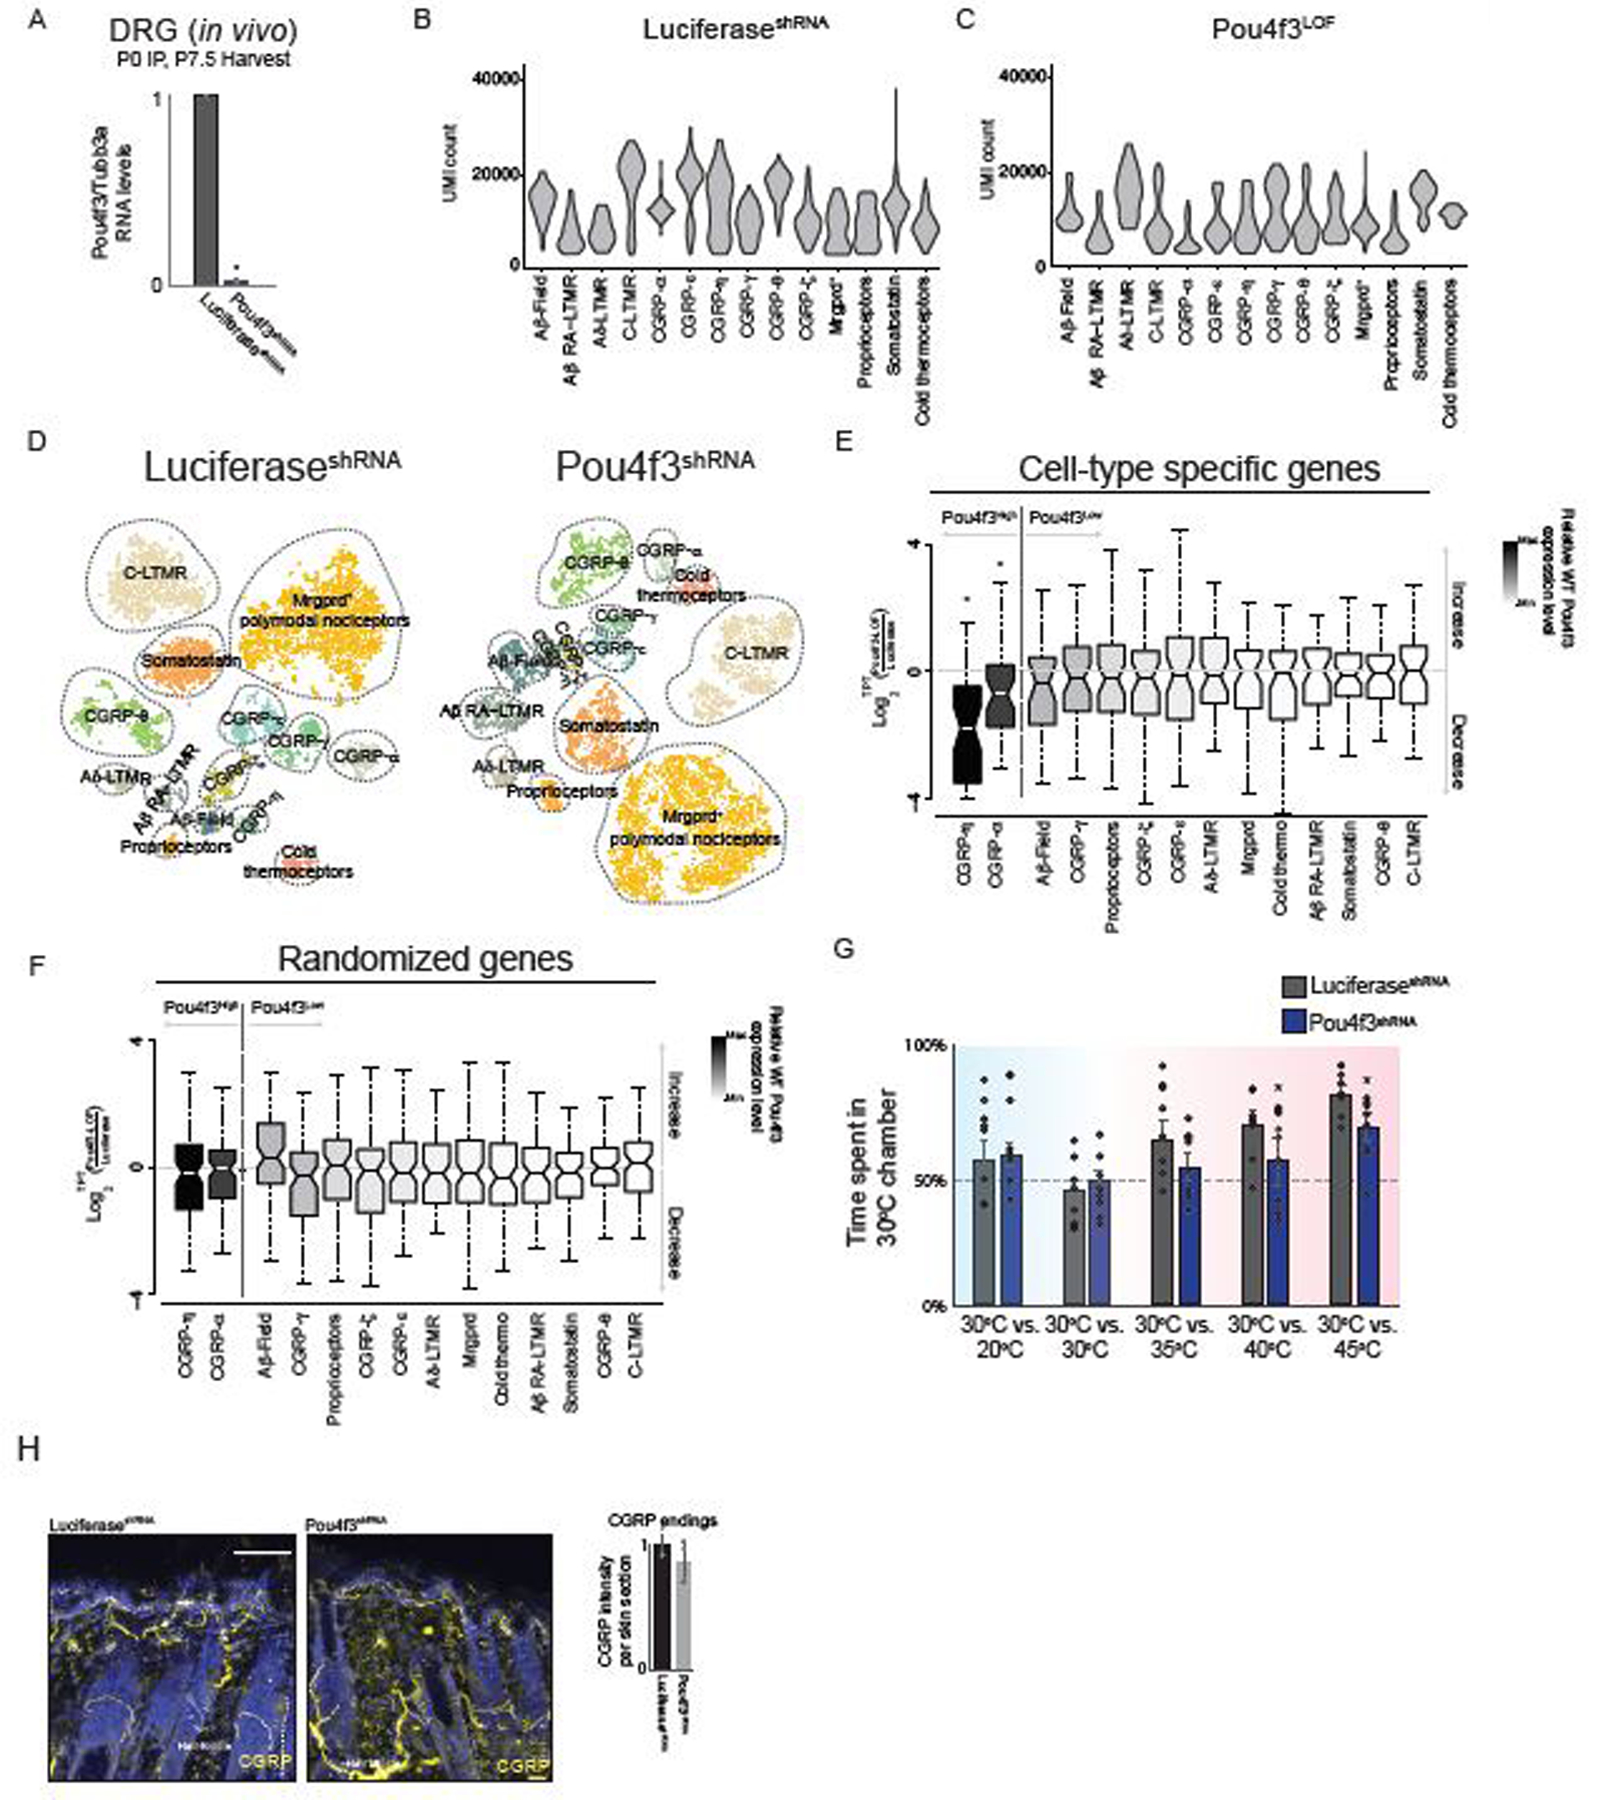
a. Quantitative RT-PCR analysis using cDNA generated from animals transduced with Luciferase or Pou4f3shRNA expressing AAVs. Error bars represent mean +/- standard error of the mean. Statistical comparisons were done using a paired two-sample t-test. * represents p < 0.01.
b. Distribution of the number of UMIs discovered in each population of control sensory neuron. UMI: unique molecular identifier.
c. Distribution of the number of UMIs counted in each each population of shRNA sensory neuron. UMI: unique molecular identifier
d. t-SNE visualizations of scRNA-seq data for neurons generated from LuciferaseshRNA (Left) and Pou4f3shRNA littermates DRGs (Right).
e. Boxplots showing the fold-change distribution of cell-type specific gene expression in sensory neuron subtypes expressing the highest and lowest levels of Pou4f3 when comparing LuciferaseshRNA and Pou4f3shRNA littermate control samples.
f. Boxplots showing the fold-change distribution in a randomized and expression matched control gene set
g. Control or Pou4f3-depleted mice were exposed to two surfaces with the indicated temperature (x-axis), and the percentage of time spent in the 30°C chamber over a 5-minute test period.
h. Representative images of CGRP immunostaining in skin samples of 1–2 week old LuciferaseshRNA (left) or Pou4f3shRNA (right) littermate controls. In a,g,h mean +/- s.e.m displayed. In a * represents two-sided t-test p<0.01. In g * represents two-way ANOVA with a Tukey’s HSD post-hoc analysis p < 0.05.
Extended Data Figure 10. Subtype restricted TF expression profiles in NGF−/−; Bax−/− cell clusters.
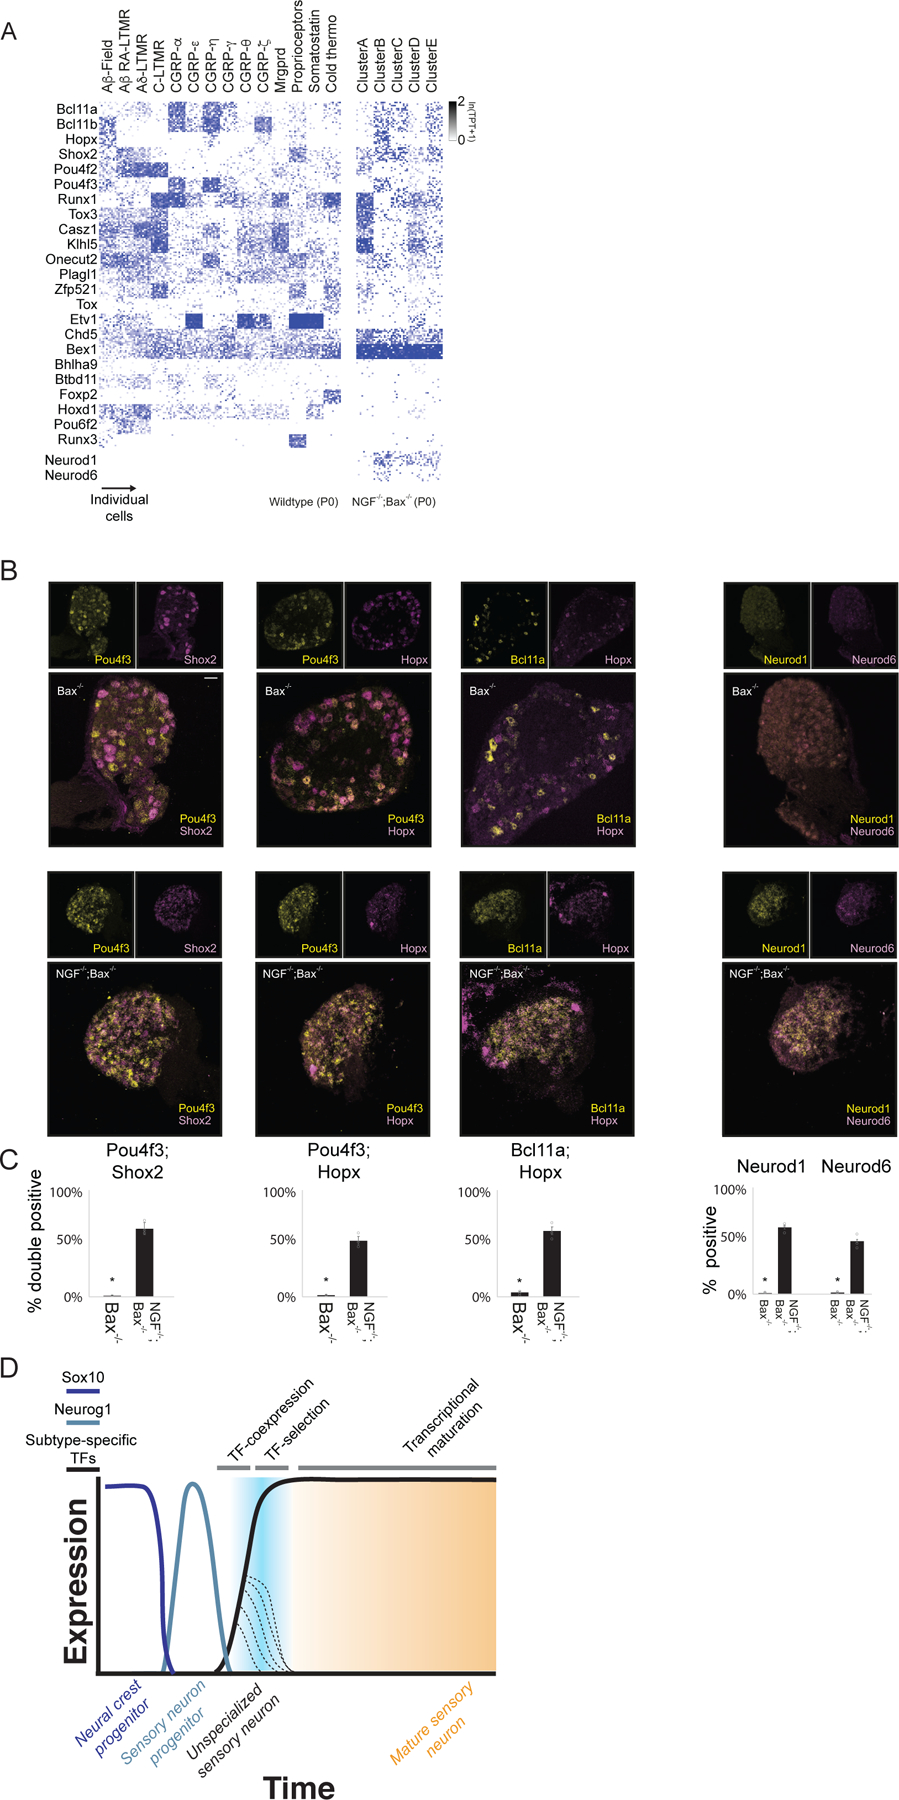
a. Heatmap depicting expression of the subtype-restricted TFs in P0 somatosensory subtypes (left) or the clusters from NGF−/−; Bax−/− mutants (Right).
b. Single molecule RNA FISH for pairs of subtype restricted TFs in NGF−/−;Bax−/− (Top) or littermate NGF−/−; Bax−/− mutants (Bottom).
c. Quantification of the RNA-FISH data showing the number of Pou4f3/Shox2 double-positive, Pou4f3/Hopx double-positive, Bcl11a/Hopx double-positive, Neurod1 single-positive or Neurod6 single-positive neurons.
d. Schematized model of gene expression programs as cells traverse development milestones. Transcriptionally unspecialized sensory neurons that emerge from Sox10+ and Neurogenin+ progenitors co-express multiple TFs which become restricted to select subtype as neurons mature. These TFs are responsible for establishing the transcriptional specializations found in each neuronal subtype. In c * represents wo-sided t-test p<0.01. TPT: tags per ten thousand.
Acknowledgements
We thank all members of the Ginty laboratory for discussions and critical feedback during the course of this work. We thank Lynn Yap, Alan Rodrigues, Amy Shyer, Brikha Shrestha, Celine Santiago, Corey Harwell, David Paul, Gordon Fishell, Lauren Orefice, Lisa Goodrich, Matthew Pecot, and Rachel Wolfson for feedback and critical evaluation of the data and manuscript. We thank Lynn Yap and Michael Greenberg for providing the base construct for AAV mediated shRNA delivery. We thank Michael Greenberg for access to the NextSeq 500 sequencing platform. This work was supported by NIH grant NS97344 (D.D.G.), the Bertarelli Foundation (D.D.G.), a Fix Fund Postdoctoral Fellowship (N.S.), and the Edward R. and Anne G. Lefler Center for Neurodegenerative Disorders. D.D.G. is an investigator of the Howard Hughes Medical Institute.
Footnotes
Competing interests
The authors declare no competing financial interests
References
- 1.Abraira VE & Ginty DD The sensory neurons of touch. Neuron 79, 618–639, 10.1016/j.neuron.2013.07.051 (2013). [DOI] [PMC free article] [PubMed] [Google Scholar]
- 2.Julius D TRP channels and pain. Annu Rev Cell Dev Biol 29, 355–384, 10.1146/annurev-cellbio-101011-155833 (2013). [DOI] [PubMed] [Google Scholar]
- 3.Basbaum AI, Bautista DM, Scherrer G & Julius D Cellular and molecular mechanisms of pain. Cell 139, 267–284, 10.1016/j.cell.2009.09.028 (2009). [DOI] [PMC free article] [PubMed] [Google Scholar]
- 4.Julius D & Basbaum AI Molecular mechanisms of nociception. Nature 413, 203–210, 10.1038/35093019 (2001). [DOI] [PubMed] [Google Scholar]
- 5.Le Douarin N The neural crest. (Cambridge University Press, 1982). [Google Scholar]
- 6.Anderson DJ Lineages and transcription factors in the specification of vertebrate primary sensory neurons. Curr Opin Neurobiol 9, 517–524, 10.1016/S0959-4388(99)00015-X (1999). [DOI] [PubMed] [Google Scholar]
- 7.Marmigere F & Ernfors P Specification and connectivity of neuronal subtypes in the sensory lineage. Nat Rev Neurosci 8, 114–127, 10.1038/nrn2057 (2007). [DOI] [PubMed] [Google Scholar]
- 8.Lallemend F & Ernfors P Molecular interactions underlying the specification of sensory neurons. Trends Neurosci 35, 373–381, 10.1016/j.tins.2012.03.006 (2012). [DOI] [PubMed] [Google Scholar]
- 9.Kitao Y, Robertson B, Kudo M & Grant G Neurogenesis of subpopulations of rat lumbar dorsal root ganglion neurons including neurons projecting to the dorsal column nuclei. J Comp Neurol 371, 249–257, (1996). [DOI] [PubMed] [Google Scholar]
- 10.Hasegawa H, Abbott S, Han BX, Qi Y & Wang F Analyzing somatosensory axon projections with the sensory neuron-specific Advillin gene. J Neurosci 27, 14404–14414, 10.1523/JNEUROSCI.4908-07.2007 (2007). [DOI] [PMC free article] [PubMed] [Google Scholar]
- 11.Ozaki S & Snider WD Initial trajectories of sensory axons toward laminar targets in the developing mouse spinal cord. J Comp Neurol 380, 215–229 (1997). [PubMed] [Google Scholar]
- 12.Mirnics K & Koerber HR Prenatal development of rat primary afferent fibers: II. Central projections. J Comp Neurol 355, 601–614, 10.1002/cne.903550409 (1995). [DOI] [PubMed] [Google Scholar]
- 13.Mirnics K & Koerber HR Prenatal development of rat primary afferent fibers: I. Peripheral projections. J Comp Neurol 355, 589–600, 10.1002/cne.903550408 (1995). [DOI] [PubMed] [Google Scholar]
- 14.Woodbury CJ, Ritter AM & Koerber HR Central anatomy of individual rapidly adapting low-threshold mechanoreceptors innervating the “hairy” skin of newborn mice: early maturation of hair follicle afferents. J Comp Neurol 436, 304–323 (2001). [PubMed] [Google Scholar]
- 15.Woodbury CJ & Koerber HR Widespread projections from myelinated nociceptors throughout the substantia gelatinosa provide novel insights into neonatal hypersensitivity. J Neurosci 23, 601–610 (2003). [DOI] [PMC free article] [PubMed] [Google Scholar]
- 16.Zeisel A et al. Molecular Architecture of the Mouse Nervous System. Cell 174, 999–1014 e1022, 10.1016/j.cell.2018.06.021 (2018). [DOI] [PMC free article] [PubMed] [Google Scholar]
- 17.Usoskin D et al. Unbiased classification of sensory neuron types by large-scale single-cell RNA sequencing. Nat Neurosci 18, 145–153, 10.1038/nn.3881 (2015). [DOI] [PubMed] [Google Scholar]
- 18.Zheng Y et al. Deep Sequencing of Somatosensory Neurons Reveals Molecular Determinants of Intrinsic Physiological Properties. Neuron 103, 598–616 e597, 10.1016/j.neuron.2019.05.039 (2019). [DOI] [PMC free article] [PubMed] [Google Scholar]
- 19.Nguyen MQ, Wu Y, Bonilla LS, von Buchholtz LJ & Ryba NJP Diversity amongst trigeminal neurons revealed by high throughput single cell sequencing. PLoS One 12, e0185543, 10.1371/journal.pone.0185543 (2017). [DOI] [PMC free article] [PubMed] [Google Scholar]
- 20.McInnes L, Healy J & Melville J UMAP: Uniform manifold approximation and projection for dimension reduction. arXiv, 1–51 (2018).
- 21.Kim J, Lo L, Dormand E & Anderson DJ SOX10 maintains multipotency and inhibits neuronal differentiation of neural crest stem cells. Neuron 38, 17–31 (2003). [DOI] [PubMed] [Google Scholar]
- 22.Britsch S et al. The transcription factor Sox10 is a key regulator of peripheral glial development. Genes Dev 15, 66–78 (2001). [DOI] [PMC free article] [PubMed] [Google Scholar]
- 23.Ma Q, Fode C, Guillemot F & Anderson DJ Neurogenin1 and neurogenin2 control two distinct waves of neurogenesis in developing dorsal root ganglia. Genes Dev 13, 1717–1728 (1999). [DOI] [PMC free article] [PubMed] [Google Scholar]
- 24.Zurborg S et al. Generation and characterization of an Advillin-Cre driver mouse line. Mol Pain 7, 66, 10.1186/1744-8069-7-66 (2011). [DOI] [PMC free article] [PubMed] [Google Scholar]
- 25.Cao J et al. The single-cell transcriptional landscape of mammalian organogenesis. Nature 566, 496–502, 10.1038/s41586-019-0969-x (2019). [DOI] [PMC free article] [PubMed] [Google Scholar]
- 26.Blanchard JW et al. Selective conversion of fibroblasts into peripheral sensory neurons. Nat Neurosci 18, 25–35, 10.1038/nn.3887 (2015). [DOI] [PMC free article] [PubMed] [Google Scholar]
- 27.Mayer C et al. Developmental diversification of cortical inhibitory interneurons. Nature 555, 457–462, 10.1038/nature25999 (2018). [DOI] [PMC free article] [PubMed] [Google Scholar]
- 28.Inoue K et al. Runx3 controls the axonal projection of proprioceptive dorsal root ganglion neurons. Nat Neurosci 5, 946–954, 10.1038/nn925 (2002). [DOI] [PubMed] [Google Scholar]
- 29.Levanon D et al. The Runx3 transcription factor regulates development and survival of TrkC dorsal root ganglia neurons. EMBO J 21, 3454–3463, 10.1093/emboj/cdf370 (2002). [DOI] [PMC free article] [PubMed] [Google Scholar]
- 30.Chen CL et al. Runx1 determines nociceptive sensory neuron phenotype and is required for thermal and neuropathic pain. Neuron 49, 365–377, 10.1016/j.neuron.2005.10.036 (2006). [DOI] [PubMed] [Google Scholar]
- 31.Yoshikawa M et al. Coexpression of Runx1 and Runx3 in mechanoreceptive dorsal root ganglion neurons. Dev Neurobiol 73, 469–479, 10.1002/dneu.22073 (2013). [DOI] [PubMed] [Google Scholar]
- 32.Lawson SN & Biscoe TJ Development of mouse dorsal root ganglia: an autoradiographic and quantitative study. J Neurocytol 8, 265–274 (1979). [DOI] [PubMed] [Google Scholar]
- 33.Lawson SN, Caddy KW & Biscoe TJ Development of rat dorsal root ganglion neurones. Studies of cell birthdays and changes in mean cell diameter. Cell Tissue Res 153, 399–413, 10.1007/bf00229167 (1974). [DOI] [PubMed] [Google Scholar]
- 34.Crowley C et al. Mice lacking nerve growth factor display perinatal loss of sensory and sympathetic neurons yet develop basal forebrain cholinergic neurons. Cell 76, 1001–1011 (1994). [DOI] [PubMed] [Google Scholar]
- 35.Patel TD, Jackman A, Rice FL, Kucera J & Snider WD Development of sensory neurons in the absence of NGF/TrkA signaling in vivo. Neuron 25, 345–357 (2000). [DOI] [PubMed] [Google Scholar]
- 36.Miyamoto T et al. Myeloid or lymphoid promiscuity as a critical step in hematopoietic lineage commitment. Dev Cell 3, 137–147 (2002). [DOI] [PubMed] [Google Scholar]
- 37.Hu M et al. Multilineage gene expression precedes commitment in the hemopoietic system. Genes Dev 11, 774–785, 10.1101/gad.11.6.774 (1997). [DOI] [PubMed] [Google Scholar]
- 38.Orkin SH Diversification of haematopoietic stem cells to specific lineages. Nat Rev Genet 1, 57–64, 10.1038/35049577 (2000). [DOI] [PubMed] [Google Scholar]
- 39.Soldatov R et al. Spatiotemporal structure of cell fate decisions in murine neural crest. Science 364, 10.1126/science.aas9536 (2019). [DOI] [PubMed] [Google Scholar]
- 40.Dasen JS, Tice BC, Brenner-Morton S & Jessell TM A Hox regulatory network establishes motor neuron pool identity and target-muscle connectivity. Cell 123, 477–491, 10.1016/j.cell.2005.09.009 (2005). [DOI] [PubMed] [Google Scholar]
- 41.Dasen JS, Liu JP & Jessell TM Motor neuron columnar fate imposed by sequential phases of Hox-c activity. Nature 425, 926–933, 10.1038/nature02051 (2003). [DOI] [PubMed] [Google Scholar]
- 42.Briscoe J, Pierani A, Jessell TM & Ericson J A homeodomain protein code specifies progenitor cell identity and neuronal fate in the ventral neural tube. Cell 101, 435–445, 10.1016/s0092-8674(00)80853-3 (2000). [DOI] [PubMed] [Google Scholar]
- 43.Hoppe PS et al. Early myeloid lineage choice is not initiated by random PU.1 to GATA1 protein ratios. Nature 535, 299–302, 10.1038/nature18320 (2016). [DOI] [PubMed] [Google Scholar]
- 44.Wende H et al. The transcription factor c-Maf controls touch receptor development and function. Science 335, 1373–1376, 10.1126/science.1214314 (2012). [DOI] [PubMed] [Google Scholar]
- 45.Ichikawa H, Deguchi T, Nakago T, Jacobowitz DM & Sugimoto T Parvalbumin, calretinin and carbonic anhydrase in the trigeminal and spinal primary neurons of the rat. Brain Res 655, 241–245 (1994). [DOI] [PubMed] [Google Scholar]
- 46.Zheng Y et al. Deep sequencing of somatosensory neurons reveals molecular determinants of intrinsic physiological properties. Neuron In Press (2019). [DOI] [PMC free article] [PubMed]
- 47.Bai L et al. Genetic Identification of an Expansive Mechanoreceptor Sensitive to Skin Stroking. Cell 163, 1783–1795, 10.1016/j.cell.2015.11.060 (2015). [DOI] [PMC free article] [PubMed] [Google Scholar]
- 48.Rutlin M et al. The cellular and molecular basis of direction selectivity of Adelta-LTMRs. Cell 159, 1640–1651, 10.1016/j.cell.2014.11.038 (2014). [DOI] [PMC free article] [PubMed] [Google Scholar]
- 49.Li L et al. The functional organization of cutaneous low-threshold mechanosensory neurons. Cell 147, 1615–1627, 10.1016/j.cell.2011.11.027 (2011). [DOI] [PMC free article] [PubMed] [Google Scholar]
- 50.Kobayashi K et al. Distinct expression of TRPM8, TRPA1, and TRPV1 mRNAs in rat primary afferent neurons with adelta/c-fibers and colocalization with trk receptors. J Comp Neurol 493, 596–606, 10.1002/cne.20794 (2005). [DOI] [PubMed] [Google Scholar]
- 51.Rosenfeld MG et al. Production of a novel neuropeptide encoded by the calcitonin gene via tissue-specific RNA processing. Nature 304, 129–135 (1983). [DOI] [PubMed] [Google Scholar]
- 52.Dong X, Han S, Zylka MJ, Simon MI & Anderson DJ A diverse family of GPCRs expressed in specific subsets of nociceptive sensory neurons. Cell 106, 619–632 (2001). [DOI] [PubMed] [Google Scholar]
- 53.Zylka MJ, Dong X, Southwell AL & Anderson DJ Atypical expansion in mice of the sensory neuron-specific Mrg G protein-coupled receptor family. Proc Natl Acad Sci U S A 100, 10043–10048, 10.1073/pnas.1732949100 (2003). [DOI] [PMC free article] [PubMed] [Google Scholar]
- 54.Zylka MJ, Rice FL & Anderson DJ Topographically distinct epidermal nociceptive circuits revealed by axonal tracers targeted to Mrgprd. Neuron 45, 17–25, 10.1016/j.neuron.2004.12.015 (2005). [DOI] [PubMed] [Google Scholar]
- 55.Arber S, Ladle DR, Lin JH, Frank E & Jessell TM ETS gene Er81 controls the formation of functional connections between group Ia sensory afferents and motor neurons. Cell 101, 485–498 (2000). [DOI] [PubMed] [Google Scholar]
- 56.de Nooij JC, Doobar S & Jessell TM Etv1 inactivation reveals proprioceptor subclasses that reflect the level of NT3 expression in muscle targets. Neuron 77, 1055–1068, 10.1016/j.neuron.2013.01.015 (2013). [DOI] [PMC free article] [PubMed] [Google Scholar]
- 57.Stantcheva KK et al. A subpopulation of itch-sensing neurons marked by Ret and somatostatin expression. EMBO Rep 17, 585–600, 10.15252/embr.201540983 (2016). [DOI] [PMC free article] [PubMed] [Google Scholar]
- 58.Mishra SK & Hoon MA The cells and circuitry for itch responses in mice. Science 340, 968–971, 10.1126/science.1233765 (2013). [DOI] [PMC free article] [PubMed] [Google Scholar]
- 59.Bautista DM et al. The menthol receptor TRPM8 is the principal detector of environmental cold. Nature 448, 204–208, 10.1038/nature05910 (2007). [DOI] [PubMed] [Google Scholar]
- 60.McKemy DD, Neuhausser WM & Julius D Identification of a cold receptor reveals a general role for TRP channels in thermosensation. Nature 416, 52–58, 10.1038/nature719 (2002). [DOI] [PubMed] [Google Scholar]
- 61.Hockley JRF et al. Single-cell RNAseq reveals seven classes of colonic sensory neuron. Gut, 10.1136/gutjnl-2017-315631 (2018). [DOI] [PMC free article] [PubMed]
- 62.Li CL et al. Somatosensory neuron types identified by high-coverage single-cell RNA-sequencing and functional heterogeneity. Cell Res 26, 967, 10.1038/cr.2016.90 (2016). [DOI] [PMC free article] [PubMed] [Google Scholar]
- 63.Wagner DE et al. Single-cell mapping of gene expression landscapes and lineage in the zebrafish embryo. Science 360, 981–987, 10.1126/science.aar4362 (2018). [DOI] [PMC free article] [PubMed] [Google Scholar]
- 64.Chan KY et al. Engineered AAVs for efficient noninvasive gene delivery to the central and peripheral nervous systems. Nat Neurosci 20, 1172–1179, 10.1038/nn.4593 (2017). [DOI] [PMC free article] [PubMed] [Google Scholar]
Associated Data
This section collects any data citations, data availability statements, or supplementary materials included in this article.
Data Availability Statement
Sequence data of this study have been deposited with accession code GSE139088. The data is also available for browsing and analysis via the HTML interface at https://kleintools.hms.harvard.edu/tools/springViewer_1_6_dev.html?datasets/Sharma2019/all.