Abstract
Sleep regulation involves interleukin-1β (IL1) family members, TNF, and circadian clock genes. Previously, we characterized spontaneous sleep and sleep after 8 h of sleep deprivation (SD) ending at zeitgeber time (ZT)4 and ZT16 in wild-type (WT) and IL1 receptor accessory protein (AcP)- and brain-specific AcP (AcPb)-knockout (KO) mice. Here, we applied quantitative reverse transcriptase polymerase chain reaction and Spearman gene pair expression correlation methods to characterize IL1, IL1 receptor 1 (IL1R1), AcP, AcPb, Period 1 (Per1), Clock, adenosine deaminase (Ada), peptidoglycan recognition protein 1 (Pglyrp1), and TNF mRNA expressions under conditions with distinct sleep phenotypes. In WT mice, IL1, IL1R1, AcP, Ada, and Clock mRNAs were higher at ZT4 (mid-sleep period) than at ZT16. mRNA expressions differed substantially in AcP and AcPb KO mice at those times. After SD ending at ZT4, only WT mice had a non-rapid eye movement sleep (NREMS) rebound, and AcPb and IL1R1 mRNA increases were unique to WT mice. In AcPb KO mice, which have spontaneous high EEG slow wave power, AcP and Pglyrp1 mRNAs were elevated relative to WT mice at ZT4. At ZT4, the AcPb KO − WT Spearman correlation difference networks showed high positive correlations between IL1R1 and IL1, Per1, and Clock and high negative correlations between TNF and Pglyrp1 and Ada. At ZT16, the WT mice gene pair expression network was mostly negative, whereas in AcP KO mice, which have substantially more rapid eye movement sleep than WT mice, it was all positive. We conclude that gene pair expression correlations depend on the presence of AcP and AcPb.
NEW & NOTEWORTHY Spearman gene pair expression correlations depend upon the presence or absence of interleukin-1 receptor accessory protein and upon sleep phenotype.
Keywords: clock genes, interleukin-1 receptor accessory protein, RNA expression, sleep, Spearman gene pair correlations
INTRODUCTION
Interleukin-1β (IL1) plays a role in physiological sleep regulation and in sleep responses to pathological insults (25, 29, 31, 32, 35–38, 46, 70). For example, intracerebral ventricular, or intravenous, injections of low doses of IL1 enhance non-rapid eye movement sleep (NREMS), whereas high doses inhibit sleep (50). IL1 mRNA peaks in brain at the beginning of the rat sleep period, zeitgeber time (ZT)0 (65, 68). Sleep deprivation (SD) enhances brain IL1 mRNA levels (40, 77). Injection of IL1 into sleep regulatory centers enhances sleep (1). Substances that enhance IL1 production, e.g., peptidoglycan, also enhance sleep (51). Local unilateral injections of IL1 onto the surface of the cortex ipsilaterally enhance electroencephalogram (EEG) slow wave power (SWP) (76). Enhanced EEG SWP indicates a deeper NREMS intensity (11). IL1 inhibition, with anti-IL1 antibodies or the IL1 receptor antagonist, inhibits sleep (47–49, 69). Furthermore, mice lacking the IL1 type 1 receptor (IL1R1) have less spontaneous NREMS (17). Collectively, such data demonstrate a role for IL1 in sleep regulation. Similar data also exist for tumor necrosis factor-α (TNF) (59); TNF induces IL1 (66).
For IL1 to signal, IL1R1 binds to a receptor accessory protein (AcP) (23, 62, 63). AcP is required for IL1 bioactivity (19). There are three isoforms of AcP. AcP is the form found in most cells. AcPb is a longer isoform unique to brain (63). There is also a soluble form of AcP that is secreted into the extracellular space and binds to the IL1 type II receptor, thereby increasing the affinity of that receptor for IL1 (62). As such, it is anti-inflammatory. AcPb is also anti-inflammatory, whereas AcP is proinflammatory. AcP knockout (KO) mice lack all isoforms of AcP; AcPb KO mice still have AcP but lack AcPb. AcPb KO mice have dampened sleep responses to influenza virus challenge (12). Brain AcPb mRNA, but not AcP mRNA, is upregulated in mice during SD (68). IL1 enhances AcPb mRNA expression but not AcP mRNA (68). The neuron-specific AcPb signals via phosphorylation of sarcoma protooncogene non-receptor tyrosine kinase (Src) at very low levels of IL1. In contrast, IL1 signaling via p38 mitogen-activated protein kinase (MAPK) phosphorylation occurs at IL1 levels roughly 1,000-fold greater (23). The levels of phosphorylated Src are less after SD in strains of mice lacking AcPb, and these strains also lack a sleep rebound after SD (44). Furthermore, spontaneous phosphorylated Src levels are high during the light hours [zeitgeber time (ZT)4, middle of the mouse sleep period] and low during the night hours (ZT16, middle of the wake period). Collectively these data suggest that low somnogenic doses of IL1 elicit sleep via Src signaling, whereas the higher sleep-inhibitory doses of IL1 reduce sleep via p38 MAPK.
Mice lacking AcPb (AcPb KO) or mice lacking both AcP and AcPb (AcP KO) fail to exhibit NREMS rebound after 8 h of SD ending at ZT4 (44). In contrast, wild-type (WT) mice had NREMS rebounds if SD ended at ZT4. In addition, AcPb KO mice display higher-amplitude EEG SWP during NREMS whether it occurs spontaneously or after SD. Furthermore, AcP KO mice, compared with WT mice, have more rapid eye movement sleep (REMS) during nighttime hours (ZT12–ZT24).
Here we analyze mRNA expressions of IL1 family members IL1, AcP, AcPb, and IL1R1 and other sleep-linked genes that they influence, period 1 (Per1), clock circadian regulator (Clock), TNF, adenosine deaminase (Ada), and peptidoglycan recognition protein 1 (Pglyrp1) (e.g., 2, 6, 58). We compare expressions in the three strains, using sampling times corresponding to times when sleep effects manifest differentially in the various strains. Two analytical approaches to mRNA expression are used; quantitative reverse transcriptase polymerase chain reaction (RT-qPCR) data are used for both approaches. First, we use a classic single-gene approach. Second, correlation analyses are used to characterize gene pair expression correlation differences. Analysis of correlations is the natural first step toward unraveling the complexity of sleep-regulating gene networks. The networks are constructed by associating a node with each gene and joining a pair of nodes with an edge if the two genes are sufficiently highly correlated. Compared with studying genes in isolation, the network-based approach offers several advantages such as finding highly influential genes, detecting gene clusters, and visualizing collective effects of various treatments. If the correlation of a pair of genes increases or decreases after SD compared with correlations obtained from controls, then resultant information suggests candidate causative pathways linked to the biological sleep-related changes. Here we illustrate that, with just a few sleep-linked transcripts, substantially different gene expression patterns associate with unique sleep phenotypes.
To quantify the strength of pair relationships, one can use any suitable association measure. Among these, Pearson correlation is the most common. However, the primary measure used in this study is Spearman rank correlation, also called Spearman’s ρ. Spearman correlation, while being also classical, seems to be better suited for biological applications, especially those involving small sample sizes. To make the article self-contained, we include the definitions and the description of the main properties of both correlations. We also introduce a permutation test to determine statistical significance of the observed difference between the two correlations. The test and the underlying mathematical analysis appear to be new and may be of independent interest in statistics and data science.
METHODS
Animals
The mouse strains used, their housing conditions, and their breeding and sleep deprivation protocols were previously published by us (44). The major differences from the prior experiments are 1) different individual mice were used; 2) the mice did not have surgical implants of EEG electrodes; and 3) sleep analyses were not done for the present work since the mice lacked EEG electrodes. Breeding pairs of C57BL/6J mice [control strain, called wild type (WT) throughout], IL1 receptor AcP KO mice, and AcPb KO mice (experimental strains) were purchased from Jackson Laboratories (Bar Harbor, ME) under the auspices of an agreement with Amgen Inc. (Thousand Oaks, CA). All mice were bred for 9–11 generations at Washington State University, and tail snips from all mice were genotyped by Transnetyx (Cordova, TN). Weaned male mice were on a 12:12-h light-dark cycle (light onset = ZT0). Food (Teklad Global Diets Envigo, 2018 18% Protein Rodent Diet, South Kent, WA) and water were available ad libitum. Experimental protocols were approved by the Washington State University Animal Care and Use Committee and conformed to National Institutes of Health guidelines. Although we did not quantitatively characterize mouse behavior, previously we described that AcP KO mice were less sensitive to anesthesia than AcPb KO or WT strains (44). No other overt behavioral differences were noted between the strains.
Quantitative Reverse Transcriptase Polymerase Chain Reaction
WT, AcP KO, and AcPb KO mice between 8 and 10 wk old were used with or without SD (roughly n = 10 for each strain and condition; see Table 2). Mice from each strain were randomly selected for 8-h SD with gentle handling (the SD gold standard in sleep research), and experimenters were blind to the mouse strain. SD began at ZT8 and ZT20 and ended at ZT16 and ZT4, respectively. The remaining AcP KO, AcPb KO, and WT mice were used as time-matched controls. At either ZT4 or ZT16, the mice were decapitated and the somatosensory cortex (Sctx) was harvested. The Sctx was used because it is relatively large and easy to dissect, exhibits local sleep (8), and has been extensively used by our laboratory for transcript characterization (e.g., 68). Tissues were immediately snap frozen in liquid N2 and stored at −80°C until RNA was extracted for RT-qPCR analysis.
Table 2.
Number of animals analyzed for each condition and strain
|
n (RT-qPCR) |
||||
|---|---|---|---|---|
| Strain | Zeitgeber Time | Figure 1 | Figure 2 | n (Spearman correlation) |
| WT | 20–4 C | 10, 9, 7, 9 | 10, 10, 9, 10, 10 | 6 |
| WT | 20–4 SD | 8, 8, 7, 7 | 9, 9, 8, 8, 9 | 5 |
| WT | 8–16 C | 9, 9, 8, 9 | 9, 9, 11, 9, 11 | 6 |
| WT | 8–16 SD | 10, 9, 8, 9 | 10, 10, 11, 11, 11 | 7 |
| AcP KO | 20–4 C | 10, 10 | 10, 10, 10, 10, 10 | 10 |
| AcP KO | 20–4 SD | 9, 10 | 10, 10, 10, 10, 10 | 9 |
| AcP KO | 8–16 C | 8, 8 | 8, 8, 10, 10, 10 | 8 |
| AcP KO | 8–16 SD | 9, 10 | 10, 10, 8, 8, 9 | 8 |
| AcPb KO | 20–4 C | 11, 8, 11 | 11, 11, 11, 11, 11 | 8 |
| AcPb KO | 20–4 SD | 8, 7, 9 | 9, 7, 9, 9, 9 | 6 |
| AcPb KO | 8–16 C | 8, 7, 8 | 8, 8, 8, 9, 8 | 5 |
| AcPb KO | 8–16 SD | 10, 7, 11 | 11, 11, 11, 11, 10 | 6 |
Mice were euthanized at the end of sleep deprivation, zeitgeber (ZT)4, or ZT16. The numbers in the Figure 1 column are the n values for IL1, IL1R1, AcP, and AcPb, respectively. The n values in the Figure 2 column are for TNF, Ada, Clock, Per1, and Pglyrp1, respectively. The numbers in the Spearman correlation column are either less than or equal to those in the Figure 1 and 2 columns because values for all 10 genes analyzed (including the housekeeping gene) from each mouse were needed for the correlational analyses. AcP KO, interleukin-1 accessory protein knockout mice; AcPb KO, brain-specific AcP knockout mice; C, control mice; SD, sleep-deprived mice for the hours shown; WT, wild type.
The tissue was homogenized, RNA was extracted with TRIzol reagent, and cDNA was prepared for RT-qPCR to analyze mRNA levels of IL1, IL1R1, TNF, Ada, AcP, AcPb, Pglyrp1, Per1, and Clock. The primer sequences used are presented in Table 1. All the reactions were performed in duplicate or triplicate for each sample, and all two-time point samples from each strain were on one plate. Inclusion criteria were that results from all wells were used if they did not exceed two standard deviations from the mean for each transcript from all the mice and the melt curves at the end of the cycling were normal. Each reported threshold cycle (Ct) value was an average of these values for the genes of interest. CyclophilinA mRNA was used to compare expression of mRNAs as previously described (65). Relative fold change gene expression was then evaluated with the (delta delta Ct) value method (39, 68).
Table 1.
Real-time PCR primer sequences
| Gene | Forward Primers (5′ → 3′) | Reverse Primers (5′ → 3′) |
|---|---|---|
| IL1 | CAACCAACACGTGATATTCTCCATG | GATCCACACTCTCCAGCTGCA |
| IL1R1 | AACGTGAGCTTCTTCGGAGT | CCGGAACGTATAGGACATAC |
| AcP | GGGCAACATCAACGTCATTTTAG | CAGCTCTTTCACCTTCATGTCCTT |
| AcPb | GGAGTTTAAGCTGGGTGTCATGT | TGCTCAAGCGGACGGTACT |
| TNF | GGGACAGTGACCTGGACTGT | GCTCCAGTGAATTCGGAAAG |
| Ada | AAGCATTTGGCATCAAGGTC | CATAGCCACCACGGTCTTCT |
| Clock | ACCGAGCACTCTCACAGCCCC | GACGGCCCCACAAGCTACAGG |
| Per1 | TTCTGTGGCCCCCTCAGCCC | GTGGTGGTGGTGGCGGGAAC |
| Pglyrp1 | TGTTGTTTGCCTGTGCTCTC | GATCACCACGTAGCGAACTG |
| CyclophilinA | AATGCTGGACCAAACACAAA | TCATGCCTTCTTTCACCTTC |
| M13-tailed primers used to verify TNF and Per1 PCR products sequences | ||
| M13 | GTAAAACGACGGCCAGT | CAGGAAACAGCTATGAC |
| M13-TNF | GTAAAACGACGGCCAGTGGGACAGTGACCTGGACTGT | CAGGAAACAGCTATGACGCTCCAGTGAATTCGGAAAG |
| M13-PER1 | GTAAAACGACGGCCAGTTTCTGTGGCCCCCTCAGCCC | CAGGAAACAGCTATGACGTGGTGGTGGTGGCGGGAAC |
The PCR products obtained with brain cortical samples from WT mice were sequenced to verify that the predicted PCR product was obtained. In the case of Per1 and TNF, the PCR product was short; thus M13-tailed primers were used as described in Table 1 (74). In all cases, the expected PCR product sequence was obtained.
RT-qPCR Graphical Statistical Analysis
Figures 1, 2, and 6 are presented graphically as mean values of ± standard error. For each mRNA, a two-way analysis of variance (ANOVA) was used to compare either strain and time differences (Figs. 1 and 2, left) or strain and post-SD differences (Figs. 1 and 2, right, and Fig. 6). Post hoc Tukey’s honestly significant difference (HSD) tests were used to determine individual significant differences within strain, time of day, or post-SD when ANOVA results showed main effects. Two-tailed Student’s t tests were used to determine significant time of day (Fig. 1, left) and post-SD (Fig. 6) differences for AcPb mRNA. An α-level of P < 0.05 was considered to be significant in all tests.
Fig. 1.
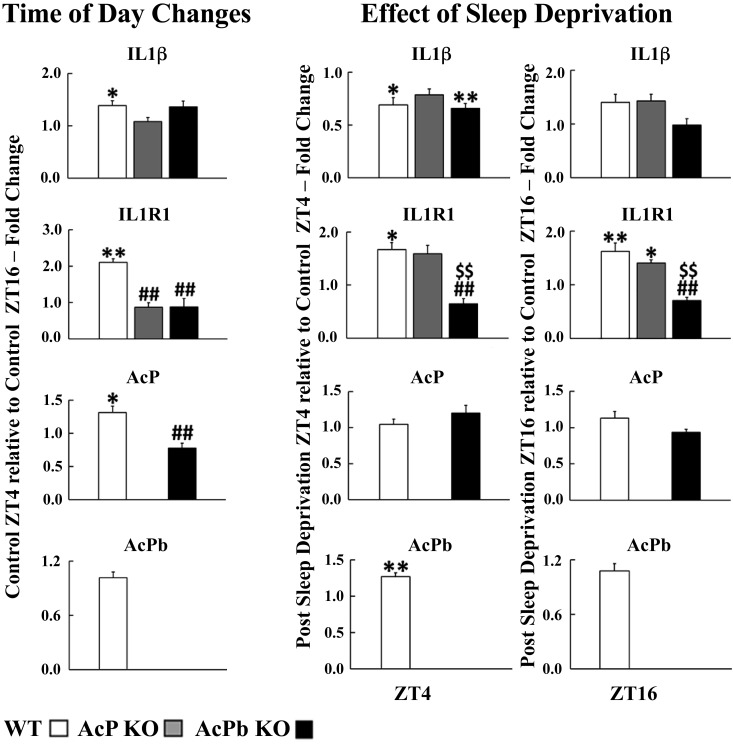
Interleukin-1β (IL1) family mRNA expressions. RT-PCR was used to determine mRNA values. Left: for each gene, the average relative fold change values ± SE of control zeitgeber time (ZT)4 normalized to control ZT16 for each strain by the delta delta threshold cycle () method. To determine strain and time of day differences within each mRNA, 2-way ANOVA analyses were used, followed by post hoc Tukey’s honestly significant difference (HSD) tests if significant (P < 0.05) main effects were found. A 2-tailed Student’s t test was used for AcPb mRNA to determine time differences for wild type (WT). Center and right: for each gene, the effects of 8 h of sleep deprivation (SD) ending at either ZT4 (center) or ZT16 (right). Values are average relative fold change values ± SE of post-SD values normalized to control values obtained at the same time of day for each gene and strain by the method. To determine strain and post-SD differences within each mRNA, 2-way ANOVA analyses were used, followed by post hoc Tukey’s HSD tests if significant (P < 0.05) main effects were found. A 2-tailed Student’s t test was used for AcPb mRNA to determine post-SD differences for WT.*P < 0.05, **P < 0.01, control ZT4 vs. control ZT16 (left); *P < 0.05, **P < 0.01, post-SD vs. control (center and right). ##P < 0.01; AcP knockout (KO) vs. WT or AcPb KO vs. WT. $$P < 0.01, AcP KO vs. AcPb KO.
Fig. 2.
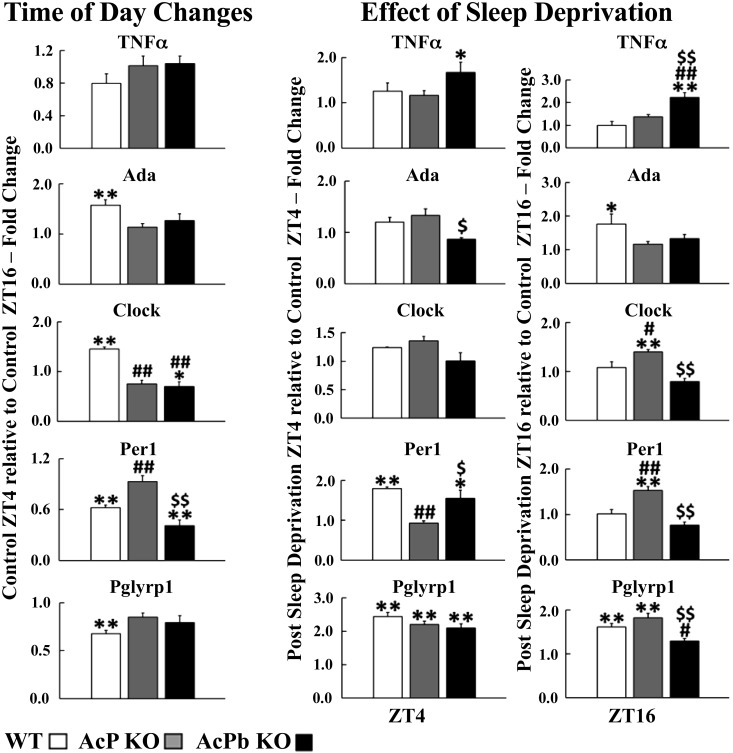
Circadian and enzyme accessory mRNA expressions. RT-PCR was used to determine mRNA values. Left: for each gene, the average relative fold change values ± SE of control zeitgeber time (ZT)4 normalized to control ZT16 for each strain by the delta delta threshold cycle () method. To determine strain and time of day differences within each mRNA, 2-way ANOVA analyses were used, followed by post hoc Tukey’s honestly significant difference (HSD) tests if significant (P < 0.05) main effects were found. Center and right: for each gene, the effects of 8 h of sleep deprivation (SD) ending at either ZT4 or ZT16. Values are average relative fold change values ± SE of post-SD values normalized to control values obtained at the same time of day for each gene and strain by the method. To determine strain and post-SD differences within each mRNA, 2-way ANOVA analyses were used, followed by post hoc Tukey’s HSD tests if significant (P < 0.05) main effects were found. *P < 0.05, **P < 0.01, control ZT4 vs. control ZT16 (left); *P < 0.05, **P < 0.01, post-SD vs. control (center and right). #P < 0.05, ##P < 0.01, AcP knockout (KO) vs. wild type (WT) or AcPb KO vs WT. $P < 0.05, $$P < 0.01, AcP KO vs. AcPb KO.
Fig. 6.
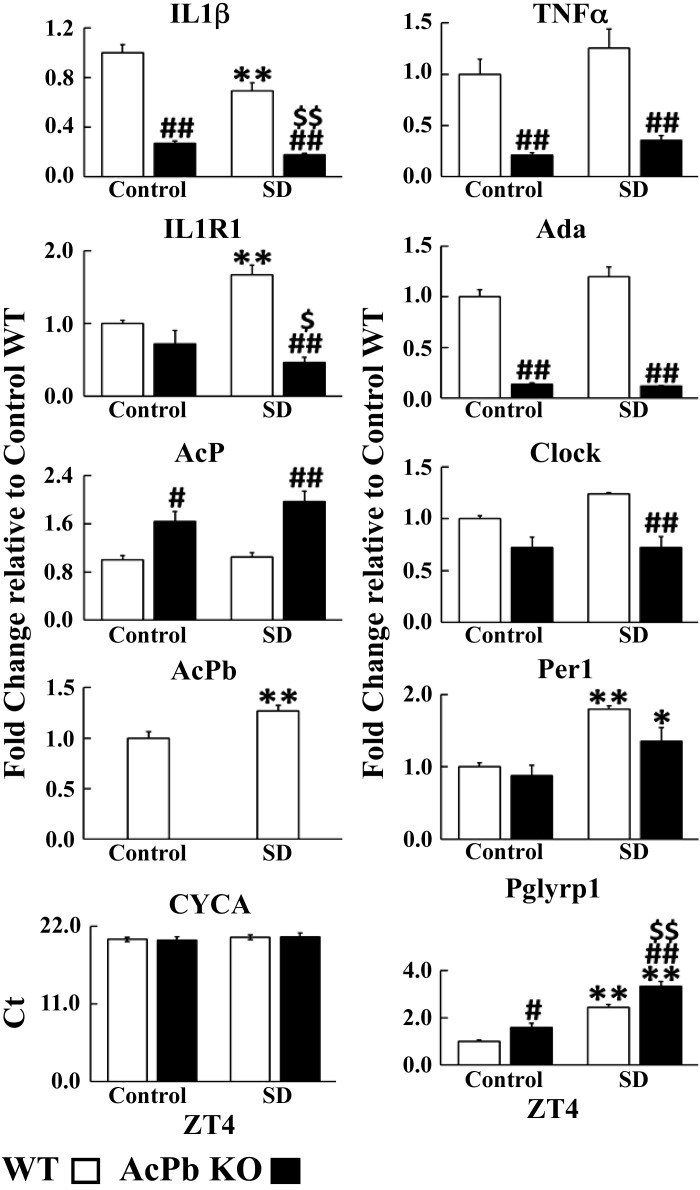
Gene mRNA expression at zeitgeber time (ZT)4 relative to cyclophilin. The values shown are the average relative fold change [delta delta threshold cycle ()]values ± SE for the gene of interest with control wild type (WT) used to normalize (i.e., those values are 1). CyclophilinA (CYCA) Ct values are shown; they were not different after sleep deprivation (SD) or by strain. To determine strain and post-SD differences within each mRNA, 2-way ANOVA analyses were used, followed by post hoc Tukey’s honestly significant difference (HSD) tests if significant (P < 0.05) main effects were found. A 2-tailed Student’s t test was used for AcPb mRNA to determine post-SD differences for WT. *P < 0.05, **P < 0.01; post-SD vs. control. #P < 0.05, ##P < 0.01, AcPb KO vs. WT. $P < 0.05, $$P < 0.01, AcPb KO post-SD vs. control WT.
RT-qPCR Correlation Analyses: Description of Statistical Analysis
Definition of Spearman correlation.
Spearman rank correlation coefficient, or simply Spearman correlation, is a nonparametric measure of the strength of a monotonic association between two variables x and y. It is calculated by applying the definition of the well-known Pearson correlation coefficient to the so-called rank transforms of these variables. Suppose that the sample of the variables x,y consists of n points (xi,yi) in the two-dimensional Euclidean space. For simplicity, suppose that all xi and yi are distinct and note that there is no loss of generality in assuming that xi are arranged in ascending order, that is, x1 < x2 < x3 < . . .< xn.
The Pearson correlation coefficient P for the sample is defined by
| (1) |
where
is the sample mean of x and ȳ is the similarly computed sample mean of y.
The definition of the rank transform is as follows. For each i = 1,2, . . ., n, the rank transform of yi is an integer corresponding to the size-based rank of yi within the set Y = {y1, y2, . . ., yn}:
| (2) |
In this way, the rank of the largest element of Y is n, the rank of the second largest is n − 1, and so on. The elements of X = {x1, x2, . . ., xn} are ranked similarly. Since xi are arranged in ascending order by default, the rank transform of (x1, x2, . . ., xn) is always
The rank transform ry of (y1, y2, . . ., yn) is obtained from rx by a permutation of its components.
example.
If the sample of y consists of numbers (0.35, 1.3, 1.01) then the corresponding rank transform ry = (1,3,2) is obtained by permuting the components of rx = (1,2,3).
The Spearman correlation is defined by
| (3) |
Thus, the Spearman correlation of x and y is equal to the Pearson correlation of their rank transforms rx and ry.
Properties of Spearman correlation.
In this subsection we explain why Spearman correlation was chosen as the measure of association and highlight some differences between Spearman and Pearson correlations.
First, note that the order relation such as x1 < x2 is quite stable with respect to perturbing x1 and x2: keeping x1 fixed, for instance, we could assign to x2 any value in the interval (x1,∞) without changing the order. Since the rank transforms depend on ordering of xi and yi, they are also stable to perturbations of xi and yi. Consequently, Spearman correlation is less sensitive to strong outliers than Pearson correlation. This is a desirable property, especially when dealing with small samples.
Next, recall that Pearson correlation is equal to 1 if and only if the vectors (x1 − x̄, . . ., xn − x̄) and (y1 − ȳ, . . ., yn − ȳ) are parallel, that is,
for some k > 0 and for i = 1,2, . . ., n. Thus, if Pearson correlation is close to 1, then the points (xi,yi) lie close to the line y = kx + ȳ −kx̄. In contrast, Spearman correlation equals 1 if and only if ry = krx, which can occur only when k = 1. Thus, the highest possible value of 1 for Spearman correlation is obtained if and only if ry = rx = (1,2, . . ., n). In that case (xi,yi) lie on an increasing curve, not necessarily linear. Similarly, the smallest Spearman correlation of −1 is obtained when (xi,yi) lie on a decreasing curve. Therefore, a high value of ρ indicates that (xi,yi) lie close to a monotone curve, either increasing or decreasing. This is also a desirable property when working with biological systems because most relationships between chemical agents such as mRNAs and proteins are expected to be nonlinear.
To summarize, compared with Pearson correlation, Spearman correlation is more suitable for statistical analysis of biological experimental data, and especially so when the sample size is small.
Description of statistical analysis.
In this work, experimental data consist of several groups (see Table 2). Each group corresponds to a different pair of traits. Based on the traits, a group is subdivided into two subgroups that can be loosely labeled treatment (SD here) and control. Both treatment and control subgroups consist of the expression data for the same genes. To quantify the effect of a trait on pairwise relationships between genes, we 1) calculate Spearman correlation for each pair of genes separately for each subgroup and 2) calculate the difference in the same pair correlations between treatment and control. Analogously, we calculate the differences in Pearson correlations.
Comparing Spearman to Pearson correlation yields more insight into the nature and the strength of the association between variables. The following interpretations are suggested:
If ρ = 1, then (xi,yi) lie on a monotone curve. If also P = 1, then that curve is linear. If , then the curve is nonlinear and 1 − r could be used to quantify the deviation from linearity.
If ρ and P have high value (that should be <1), then this could be interpreted as approximate linearity of the association between the variables.
High ρ combined with low P indicates strong monotone nonlinearity of the association.
Low ρ combined with high P signals that the data may contain strong outliers.
Further conclusions should be based on ρ alone. In discussion we further investigate the relationship between P and ρ and propose a method for determining statistical significance of the observed difference between the two correlations.
RESULTS
Transcript expression results are organized around sleep profiles obtained from WT, AcP KO, and AcPb KO mice with an identical experimental design of spontaneous sleep (control), SD between ZT20 and ZT4, and SD between ZT8 and ZT16 (44). In the present experiments, mice were euthanized at either ZT4 or ZT16. Here, we focus on four experimental conditions where sleep phenotypes were substantially different as follows: 1) time of day: all strains slept more during daylight hours (ZT0–ZT12) than during the nighttime (ZT12–ZT24); 2) AcP KO mice have substantially more REMS between ZT12 and ZT24, with maximum differences around ZT16; 3) EEG SWP (0.5–3.5 Hz) during spontaneous sleep and during the sleep rebound occurring after SD is substantially higher in AcPb KO mice than WT mice [EEG SWP is posited to be a measure of sleep intensity (11, 52)]; and 4) after SD from ZT20 and ZT4, WT mice, but not AcP KO or AcPb KO mice, have NREMS rebound.
Time of Day: Comparing Individual Gene Expressions at ZT4–ZT16
WT mice expressed more IL1 [1.39 ± 0.09; F1,50 = 14.53, P adjusted (adj) < 0.05], IL1R1 (2.10 ± 0.10; F1,44 = 9.43, P adj < 0.01), and AcP (1.31 ± 0.10; strain × time: F1,30 = 13.50, P adj < 0.05) (Fig. 1, left) and Ada (1.57 ± 0.11; F1,50 = 18.64, P adj < 0.01) and Clock (1.45 ± 0.04; strain × time: F2,52 = 21.37, P adj < 0.01) (Fig. 2, left)mRNAs at ZT4 compared with ZT16. ZT4 is in the middle of the mouse sleep period, and the gene products of all these transcripts are linked to NREMS regulation (25, 46). In contrast, Per1 (0.62 ± 0.03; F1,51 = 43.22, P adj < 0.01) and Pglyrp1 (0.68 ± 0.03; F1,52 = 26.62, P adj < 0.01) transcripts were lower at ZT4 compared with ZT16 (Fig. 2, left). Cortical Per1 mRNA is in antiphase with Clock (28, 55), and cortical Per1 increases with SD (75). Food consumption, which occurs predominantly during ZT12–ZT24 in mice, is associated with translocation of bacterial products from the intestinal lumen to blood (15). SD also increases bacterial translocation from the intestinal lumen to blood and, if prolonged, results in bacteremia (16). Sleep duration is lowest between ZT12 and ZT16, and Pglyrp1 mRNA increases during SD (58). Pglyrp1 protein binds bacterial peptidoglycan and muramyl peptides (14). In general, these results are consistent with prior reports (e.g., 68, 75).
In contrast to WT mice, transcript time-of-day expressions were different in the KO mice (Figs. 1 and 2, left). Thus, in AcP KO mice, which lack both AcP and AcPb, IL1 (1.08 ± 0.08; P adj > 0.05), IL1R1 (0.87 ± 0.12; P adj > 0.05), TNF (1.02 ± 0.12; F1,50 = 0.26, P adj > 0.05), Ada (1.14 ± 0.07; P adj > 0.05), Pglyrp1 (0.85 ± 0.04; P adj > 0.05), Per1 (0.93 ± 0.07; P adj > 0.05), and Clock (0.75 ± 0.07; P adj > 0.05) mRNAs did not change at ZT16 compared with ZT4 (Figs. 1 and 2, left). In AcPb KO mice, which retain AcP but not AcPb, ZT4 values were significantly lower than ZT16 values in AcPb KO mice for Clock (0.70 ± 0.10; P adj < 0.05) and Per1 (0.41 ± 0.07; P adj < 0.01) mRNAs (Fig. 2, left). The relative fold change values comparing ZT4 to ZT16 for AcPb KO mice were significantly lower than those in WT mice for IL1R1 (0.88 ± 0.23; F2,44 = 16.66, P adj < 0.01), AcP (0.78 ± 0.08; F1,30 = 14.42, P adj < 0.01), and Clock (F2,52 = 20.03, P adj < 0.01) mRNAs (Figs. 1 and 2, left). The increase in Pglyrp1 mRNA at ZT16 in WT mice, just after the mouse primary feeding period at the onset of dark hours, could indicate that both the bacterial translocation associated with eating and the lower amounts of sleep during ZT4–ZT16 could be driving the ZT16 levels of Pglyrp1 mRNAs.
Spearman’s ρ gene correlation comparisons at ZT4–ZT16.
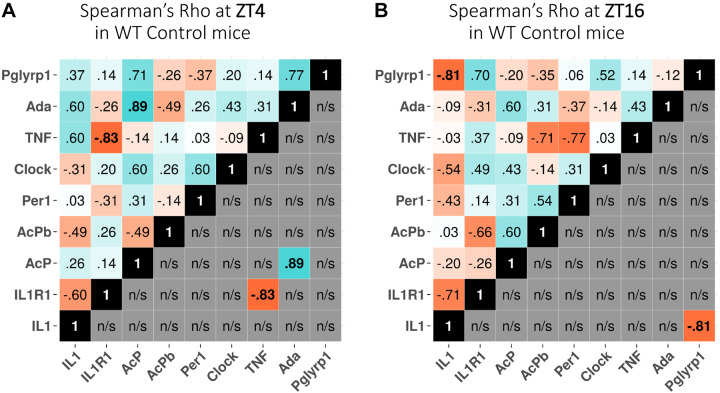
A significant negative correlation between IL1R1 and TNF mRNAs in WT mice occurred at ZT4 (Fig. 3A), and a significant negative correlation between IL1 and Pglyrp1 mRNAs occurred at ZT16 (Fig. 3B). At ZT4, there was also a positive correlation between AcP and Ada mRNAs (Fig. 3A). Viewing all the gene correlation values, whether significant or not (blue for positive and red for negative correlations), neither blue nor red dominates at either time of day (Fig. 3; compare A and B, top).
Fig. 3.
Time of day dependence of Spearman’s ρ expression correlations at zeitgeber time (ZT)4 (A) and ZT16 (B) in wild-type (WT) mice. The values shown at top left of each analysis box are the correlation values between any 2 genes. The values shown below and to the right of the black boxes show only significant expression correlations between 2 genes where their rows and columns intersect. Blue indicates positive correlations, and red shows negative correlations. n/s, Not significant.
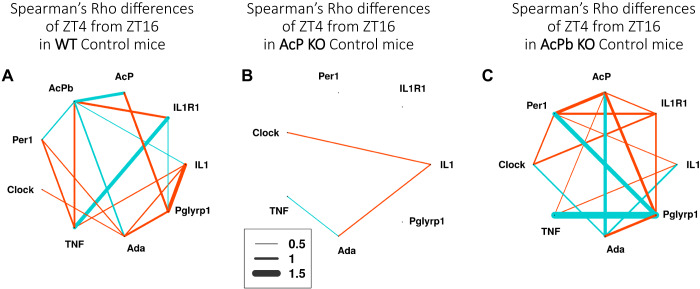
Strain differences are evident in the gene expression correlation networks for all three strains (Fig. 4). Thus, AcP KO mice had fewer and weaker gene expression correlation differences when ZT4 was compared to ZT16 (Fig. 4B); again these mice lack all three isoforms of AcP (AcP, AcPb, and the soluble AcP). In contrast, AcPb KO mice (lacking only AcPb) and WT mice have more extensive network gene expression correlation differences (Fig. 4, C vs. A). Notable were the extensive and high positive (thick blue lines) correlation differences between TNF and Pglyrp1 mRNAs in AcPb KO mice (Fig. 4C) and TNF and IL1R1 mRNAs in WT mice (Fig. 4A). In contrast, Pglyrp1 mRNA was highly negatively correlated (thick red lines) with IL1 mRNA in WT mice (Fig. 4A) and positively correlated with TNF mRNA and Per1 mRNA in AcPb KO mice (Fig. 4C). Per1 mRNA was negatively correlated with AcP mRNA in AcPb KO mice. Expression correlations between those transcripts and other genes were absent in AcP KO mice (Fig. 4B). Fundamentally, Fig. 4 shows that, in terms of the control gene expression correlation differences compared at ZT4 and ZT16, the three strains are very distinct from each other. This suggests that gene expression correlational relationships are dependent in part on the presence of AcPb. Results also indicate that the gene expression relationships going from ZT4 to ZT16 are distinct in the three strains under control conditions.
Fig. 4.
Spearman’s ρ gene expression correlation differences between zeitgeber time (ZT)4 control and ZT16 control for wild-type (WT) (A), AcP knockout (KO) (B), and AcPb KO (C) mice. The values shown represent correlation differences above 0.5 and below −0.5 after subtraction of ZT4 values from ZT16 values; e.g., compare WT AcPb and TNF mRNA expression correlation values [(−0.71) − (+0.14) = −0.57] shown in Fig. 3. Correlation differences between −0.5 and 0.5 are not shown. Line thickness indicates the strength of the correlation differences (key). Blue lines show positive correlation differences, and red lines show negative correlation differences (ZT16 – ZT4). The correlation network complexity is substantially less in the absence of AcP + AcPb as occurs in AcP KO mice (B).
Comparisons between AcP KO Mice and WT Mice at ZT16
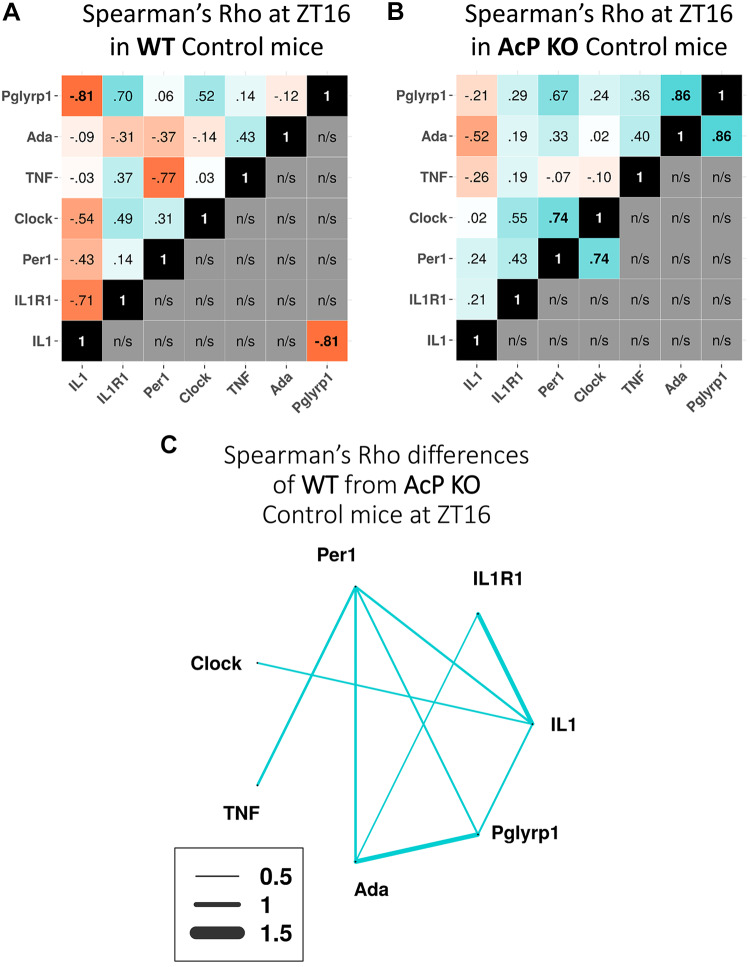
REMS duration during nighttime hours in AcP KO mice is more than double that occurring in WT mice (44). In WT mice, significant negative correlations between Pglyrp1 and IL1 mRNAs occurred at ZT16 (Fig. 5A). In contrast, that correlation was not significant in AcP KO mice (Fig. 5B). However, in AcP KO mice significant positive correlations of expression between Per1 and Clock and between Ada and Pglyrp1 mRNAs occurred (Fig. 5B).
Fig. 5.
Spearman’s ρ gene expression correlation differences between wild-type (WT) and AcP knockout (KO) mice at zeitgeber time (ZT)16. A: correlations between gene pairs in WT mice are shown. The top left boxes in each analysis show all expression correlations between gene pairs, whereas the bottom right boxes show only the significant gene pair expression correlations. B: correlations in AcP KO mice are shown as in A; fewer genes are shown because AcP KO mice lack the AcP and AcPb isoforms. C: gene expression correlation differences between AcP KO and WT at ZT16 are shown (AcP KO − WT). Blue indicates positive and red indicates negative values after subtractions for each gene were made. Difference values between −0.5 and 0.5 are not shown. n/s, Not significant.
Spearman’s ρ Gene Expression Correlation Differences between WT and AcP KO Mice at ZT16.
All the expression correlation differences between WT and AcP KO mice greater than +0.5 were positively correlated (Fig. 5C). Furthermore, when comparing Fig. 5A with Fig. 5B there are more positive correlations (blue boxes) in Fig. 5B than in Fig. 5A (top left). Whether gain in positive correlation values in cortical samples reflects increased cortical neuronal activity during REMS [(e.g., TNF and IL1 neuronal expressions are activity dependent (21, 27)], rather than duration of REMS per se, is not distinguishable from the present data.
Transcript Expression Differences at ZT4 between WT and AcPb KO Mice
During daylight hours ZT0–ZT12, control AcPb KO mice have substantially higher EEG SWP values during NREMS than control WT mice and EEG SWP remains higher in AcPb KO mice compared with WT mice after SD ending at ZT4 (44).
Individual transcript expressions.
At ZT4, IL1 (control: 0.27 ± 0.02, post-SD: 0.18 ± 0.01; F1,33 = 171.88, P adj < 0.01), TNF (control: 0.21 ± 0.02, post-SD: 0.36 ± 0.05; F1,35 = 51.97, P < 0.01), and Ada (control: 0.14 ± 0.01, post-SD: 0.12 ± 3.94E−03; F1,33 = 252.78, P < 0.01) mRNAs in AcPb KO mice were significantly lower than corresponding WT values whether during control or after SD (Fig. 6). In contrast, AcP (control: 1.64 ± 0.16, post-SD: 1.97 ± 0.17; F1,30 = 26.22, P < 0.05) and Pglyrp1 (control: 1.59 ± 0.17, post-SD: 3.34 ± 0.20; F1,34 = 24.80, P < 0.05) mRNAs were higher in AcPb KO mice than WT mice, whether in control or after SD. In WT mice, the IL1R1 (1.67 ± 0.13; strain × post-SD: F1,28 = 14.25, P adj < 0.01), AcPb (1.27 ± 0.06; t = 2.14, P < 0.01), Pglyrp1 (2.44 ± 0.13; F1,34 = 115.94, P adj < 0.01), and Per1 (1.79 ± 0.05; F1,33 = 25.57, P adj < 0.01) mRNAs increased after SD. In WT mice after SD, in contrast to the increased IL1R1 mRNA values, IL1 (0.69 ± 0.07; F1,33 = 16.50, P adj < 0.01) mRNA values decreased, suggesting a negative correlation between IL1 and the IL1R1 mRNA expressions (compare with Fig. 8, A and B). In contrast, in AcPb KO mice before and after SD, the IL1R1 and IL1 mRNAs were positively correlated (Fig. 8, E and F). Although it is tempting to ascribe the enhanced EEG SWP in AcPb KO mice to these positive correlations, all of the transcripts measured affect EEG SWP. Previously, we concluded that AcPb, but not AcP, attenuates EEG SWP (44). IL1 and TNF can enhance or reduce EEG SWP during NREMS (27, 50, 76), and adenosine agonists enhance EEG SWP (71). Ada polymorphisms are associated with changes in EEG SWP (41, 64). Similarly, Clock and Per1 can affect EEG SWP (61).
Fig. 8.
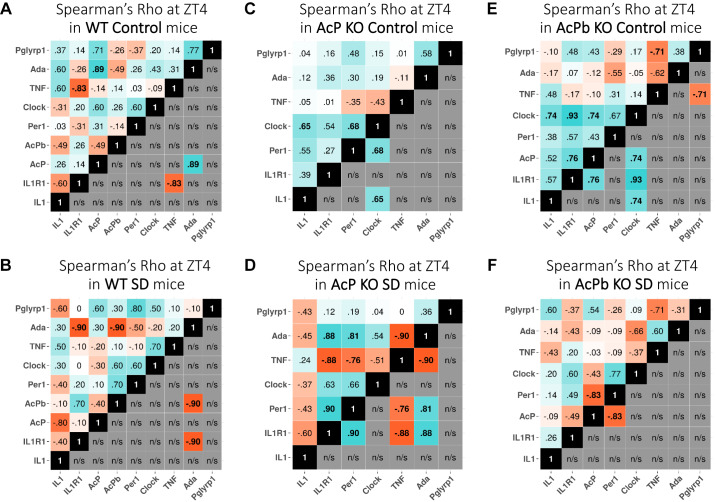
Correlation of gene expression: pairwise comparisons in control (A, C, and E) and after sleep deprivation (SD) (B, D, and F) at zeitgeber time (ZT)4 in wild-type (WT) (A and B), AcP knockout (KO) (C and D), and AcPb KO (E and F) mice. Values at top left of each analysis are expression correlation values between gene pairs, and values at bottom right are only the significant expression correlation values. Blue indicates positive correlation pairs, and red indicates negative correlation pairs. AcP and AcPb are absent in AcP KO mice, and only AcPb is absent in AcPb KO mice; thus the numbers of gene pair correlations are less for these strains. n/s, Not significant.
Correlation analyses.
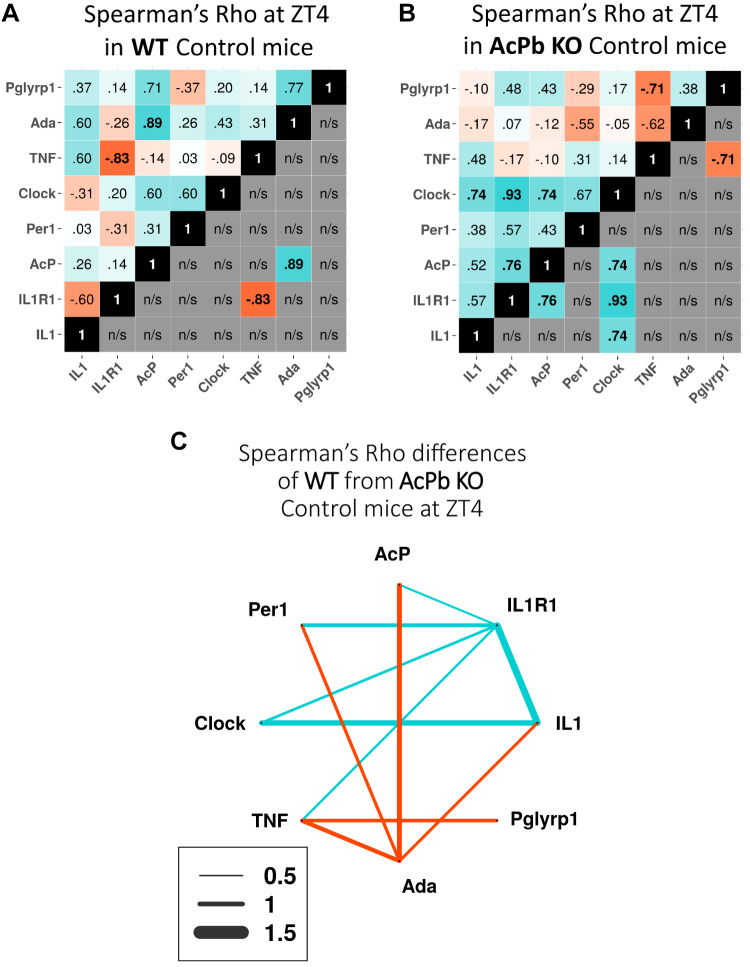
Comparisons using Spearman’s ρ correlations (Fig. 7. A and B) were somewhat different in AcPb KO mice compared with WT mice. Thus, in AcPb KO mice, Clock mRNA positively correlated with IL1, IL1R1, and AcP mRNAs and IL1R1 mRNA positively correlated with AcP mRNA (Fig. 7B). Furthermore, a significant negative correlation in AcPb KO mice between Pglyrp1 and TNF mRNAs occurred. None of these differences was evident in control WT mice (Fig. 7A). However, in WT mice at ZT4, there were significant positive correlation between AcP mRNA and Ada mRNA (Fig. 7A) and significant negative correlation between TNF mRNA and IL1R1 mRNA.
Fig. 7.
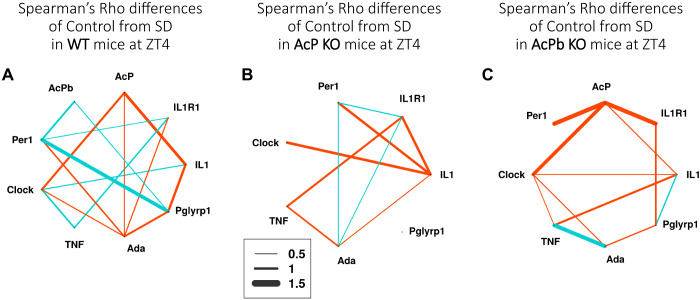
Spearman’s ρ gene expression correlations between wild-type (WT) and AcPb knockout (KO) mice under control conditions at zeitgeber time (ZT)4. A: expression correlation values between gene pairs in control WT mice at ZT4. B: correlations between gene pairs in control AcPb KO mice at ZT4. A and B: values at top left are all correlations, and values at bottom right are only those values that are statistically significant. Blue indicates positive correlation pairs, and red indicates negative correlation pairs. C: gene correlation expression differences between AcPb KO and WT at ZT4; values are expressed as the thickness of the lines and represent AcPb KO − WT. Blue indicates positive and red indicates negative values after subtractions for each gene pair were made. Difference values between −0.5 and 0.5 are not shown. n/s, Not significant.
The Spearman’s ρ network differences graph (Fig. 7C) indicates strong negative correlation differences between TNF mRNA and Ada and Pglyrp1 mRNAs comparing WT to AcPb KO mice. In contrast, the positive correlation differences between IL1 and IL1R1 and Clock mRNAs and between Per1 and IL1R1 mRNAs were slightly weaker comparing WT to AcPb KO mice at ZT4. Since the absence of AcPb associates with higher EEG SWP (44), the gains in gene correlation differences, positive or negative, in AcPb KO mice compared with WT mice suggest the involvement of these gene pairs.
Effects of SD on Transcript Expression at ZT4 between WT and AcP KO and AcPb KO Mice
After SD between ZT20 and ZT4, WT mice, but not AcP KO or AcPb KO mice, have a NREMS rebound occurring during the next 16 h (44).
Individual transcript expressions.
In WT mice, compared with their own control values, IL1R1 (1.67 ± 0.13; F1,45 = 7.28, P adj < 0.05), AcPb (1.27 ± 0.06; t = 2.14, P < 0.01), Per1 (1.79 ± 0.05; F1,50 = 17.70, P adj < 0.01), and Pglyrp1 (2.44 ± 0.13; F1,51 = 247.89, P adj < 0.01) mRNAs increased after SD ending at ZT4 (Figs. 1 and 2, center). In contrast, IL1 (0.69 ± 0.07; F1,49 = 26.81, P adj < 0.05) mRNA decreased at ZT4 after SD. In SD WT mice at ZT16, IL1R1 (1.63 ± 0.15; F1,42 = 14.59, P adj < 0.01), Ada (1.76 ± 0.30; F1,49 = 11.47, P adj < 0.05), and Pglyrp1 (1.61 ± 0.08; F1,52 = 98.43, P adj < 0.01) mRNAs increased above WT controls (Figs. 1 and 2, right); at that time the WT mice lacked a sleep rebound above control values.
AcP KO and AcPb KO mice both lack sleep rebounds after SD ending at ZT4. In AcP KO mice at ZT4 after SD, only Pglyrp1 mRNA increased (2.21 ± 0.10; P adj < 0.01) (Fig. 2, center). In AcPb KO mice at ZT4 after SD (Fig. 2, center), TNF (1.67 ± 0.23; F1,52 = 9.33, P adj < 0.05), Per1 (1.55 ± 0.21; P adj < 0.05), and Pglyrp1 (2.10 ± 0.13; P adj < 0.01) mRNAs increased whereas IL1 (0.66 ± 0.05; F1,49 = 26.81, P adj < 0.01) (Fig. 1, center) decreased compared with its control. Thus, only the increases in AcPb and IL1R1 mRNAs at ZT4 are unique to the WT strain at ZT4.
Correlation analyses.
In WT control mice at ZT4, there was a positive correlation between AcP and Ada mRNAs (Fig. 8A); however, that relationship weakened after SD in WT mice (Fig. 8B). Furthermore, in WT mice after SD at ZT4, there were significant negative correlations between Ada and IL1R1 and AcPb mRNAs (Fig. 8B). In contrast, in AcP KO mice after SD at ZT4, the correlation between Ada and IL1R1 mRNAs was significantly positive (Fig. 8D). After SD, the AcP KO mice also displayed additional significant correlations of expression; thus Per1 positively correlated with Ada and IL1R1 mRNAs (Fig. 8D). After SD, the AcP KO mice expressed several negative correlations as well; they were between TNF and Ada, IL1R1, and Per1 mRNAs (Fig. 8D). In AcPb KO mice, all the significant correlations occurring in either WT or AcP KO mice were absent. However, Per1 mRNA expression negatively correlated with AcP mRNA in AcPb KO mice after SD at ZT4 (Fig. 8F).
Gene pair correlation difference comparisons made between control and SD ending at ZT4 within each strain (Fig. 9) are striking. Thus, in AcP KO and AcPb KO strains, correlation differences were mostly negative (red lines). However, in the WT strain, which does have sleep rebound after ZT4, gene pair correlation differences between Per 1 mRNA and AcPb, IL1R1, and Pglyrp1 mRNAs and between TNF mRNA and clock and IL1R1 mRNAs were positive (Fig. 9A). As mentioned above in reference to Fig. 6, the increases in AcPb and Per1 mRNAs are unique to the WT mice after SD. Thus, both the increases in their individual levels as well as the increases in their gene pair correlation differences support our prior conclusion that AcPb is involved in sleep rebound responses to sleep loss (12, 44).
Fig. 9.
Correlation difference networks after sleep deprivation (SD) ending at zeitgeber time (ZT)4 in wild-type (WT) (A), AcP knockout (KO) (B), and AcPb KO (C) mice. Correlation differences for each strain are differences of values obtained from SD mice and from same-strain control mice. The strengths in the relationship of each difference correlation gene pair values are shown by the thickness of the lines. Blue indicate positive and red negative values after SD within-strain subtractions for each gene pair (SD – control) were made. Difference values between −0.5 and 0.5 are not shown.
A second striking result in Fig. 9 is that in WT and AcPb KO mice the gene correlation differences with AcP mRNA were all negative and dominant in number and strength (thick red lines for both strains, Fig. 9, A and C). In addition, comparing control to SD at ZT4, the complexity, i.e., number of lines and their thickness, was far greater in the WT mice than in AcP KO and AcPb KO mice, although this observation is tempered by the fact there are more gene comparisons in Fig. 9A than in Fig. 9, B and C. Whether increased complexity is permissive for the manifestation of sleep homeostasis is unknown. However, depletion of several sleep-linked genes has little effect on spontaneous sleep duration, yet their loss inhibits sleep rebound after SD, e.g., adenosine receptors (e.g., 4).
DISCUSSION
An unexpected major finding described here is that despite considerable literature linking the IL1 family of molecules (25, 31), TNF (59), and the circadian clock genes to sleep regulation (43, 61), none of the genes measured seemed to be consistently orchestrated with each other across strains to produce major sleep phenotypes. For example, the daily pattern of more sleep during the day and less sleep during the night was associated with higher expressions of IL1, IL1R1, AcP, Ada, and Clock mRNAs in WT mice at ZT4 than at ZT16 (Figs. 1 and 2, left); these results are consistent with prior findings (e.g., 68, 75). Yet in AcP KO mice these transcripts did not change at ZT4 compared with ZT16. In AcPb KO mice, at ZT4 IL1 and TNF mRNA values in AcPb KO mice were lower than in WT mice (Fig. 6). Per1 and Clock mRNAs were out of phase with each other in WT mice, with higher Clock mRNA values and lower Per1 mRNA values at ZT4 compared with ZT16 (Fig. 2). This finding is consistent with prior findings showing cortical Per1 mRNA peaking at ZT12 (55), whereas cortical Clock mRNA values lacked a rhythm although their lowest values occurred at ZT12 (28). In contrast, in AcP KO mice a different Clock/Per1 expression pattern was observed: both Clock and Per1 did not change at ZT4 compared with ZT16 (Fig. 2). Furthermore, in AcPb KO mice yet another Clock/Per1 pattern was observed: both were lower at ZT4 than at ZT16. These latter findings with Clock and Per1 mRNAs suggest that the clockworks may be disrupted in AcP KO and AcPb KO mice, although their sleep patterns in a 12:12-h light-dark cycle remained relatively normal (44).
Differences between strains are also evident from the gene expression correlation difference networks, (e.g., Figs. 4 and 9). Figure 4 shows the time of day (ZT4 vs. ZT16) networks, whereas Fig. 9 shows the effects of SD compared with within-strain controls on such networks. Fundamentally, they indicate that the three strains possess unique gene expression correlation networks, with each network responding differently to physiological stimuli—time of day and SD. Such findings suggest that the absence of AcP gene isoforms results in a reorganization of gene expression networks to produce sleep phenotypes similar to those present in WT mice. That conclusion prompts the question, what are the sleep/wake feedback signals that drive gene networks to produce niche-adapted sleep/wake patterns? Is there a “deeper state” imposing gene expression organization to gain a specific sleep/wake phenotype? If so, what are the regulatory feedback/feedforward signals? Are they metabolites, microRNAs (miRNAs), neuromodulators, neurotransmitters, electrical signals, or all of the above, operating in unfathomable myriad networks? Perhaps we should not be too surprised by the complexity of the findings in view of prior work showing that many physiological/pathological stimuli alter sleep, e.g., eating, body temperature, hormone status, stress, infection, respiration status, etc., but usually do so while maintaining core normal sleep phenotypes. Furthermore, with sleep loss more than half of all genes change in their expression (13). Regardless, from a pragmatic perspective, the present results strongly indicate that only same-strain controls can be used for such studies because the control gene expression organization is distinct for each strain.
However, in some cases direct comparisons between strains with distinct sleep phenotypes under the same experimental conditions are associated with gene expression patterns consistent with prior work. Thus, AcP KO mice have about twice as much REMS as WT mice around ZT16 (44). The within-strain gene pair correlations (Fig. 5, A and B) are very different, with positive correlations dominating in the AcP KO samples (Fig. 5B) and negative correlations dominating in WT mice (Fig. 5A). Furthermore, with between-strain gene pair correlation differences (AcP KO − WT), all gene pairs are positive (Fig. 5C). In this case, we are limited to seven genes because the AcP KO mice lack both AcP and AcPb isoforms. All the genes were previously linked to sleep. Regardless, there was a directionality of the network effect, suggesting that when “sleep-gene” expressions positively correlate with each other, greater REMS may manifest.
Another example is illustrated in Fig. 7. In this case, the sleep phenotype of EEG SWP is spontaneously much higher in AcPb KO mice than in WT mice during daylight hours (44). Both WT and AcPb KO mice had significant positive correlations at ZT4. Of note were the three positive correlations of Clock mRNA with IL1, IL1R1, and AcP mRNAs (Fig. 7B). Clock cortical expression is linked to EEG SWP (18), IL1 promotes EEG SWP, and the positive correlations between IL1 mRNA expression and IL1R1, AcP, Per1, TNF, and Clock mRNA expressions (Fig. 7B) may manifest as amplified EEG SWP. Regardless of such speculation, multiple additional genes are involved in the regulation of NREMS EEG SWP and REMS that limit statements of causation between any individual gene or gene-pair expression correlations and the biological variables they associate with.
There are additional limits to what can be said about gene-to-sleep links using mRNA data. A major caveat is that our data are snapshots of activity of mRNAs at a particular point in the sleep and light-dark cycles. The underlying dynamics by which mRNAs are translated into proteins are known to be different between genes, and the temporal relationships may be either further skewed or more closely aligned than mRNA work suggests. To this end, phase relationships between correlations (deeper description of dynamics) for mRNA and proteins are needed to paint a picture of what is moving the “sleep regulatory system”—what are the kingpin genes, can they be rank-ordered, can they be time-ordered—another way of saying finding significant phase-locked relationships with paired genes.
Gene expression dynamics, e.g., the unfolding of gene expressions responding to time of day (Figs. 1 and 2), and the responses to multiple physiological challenges, such as SD, need to be examined; the present data point to the need for dynamical data. Thus, how do the networks unfold going from ZT4 to ZT16 or, better yet, over the course of a circadian day? Potential mechanisms are myriad. For instance, a greater understanding of the links between miRNAs, which destabilize mRNAs, may be very important for creating the apparent gene expression correlations. Alterations in phosphorylation and ubiquitination may further alter the longevity or functional capacities of proteins. Such data are for the future but will be exceptionally exciting.
The use of cortical samples in the present study is an extension of our previous theoretical work positing that sleep is a local use-dependent property of small neuronal networks (34). Others have extended the theoretical work from different perspectives (e.g., 30, 54, 60, 72). Thus, sleeplike states are described in cultures of cortical cells (3, 10, 22, 27, 45). In vivo, individual cortical columns exhibit sleep and wake states. For example, individual cortical columns oscillate between sleeplike and wakelike states and show sleep homeostasis (57). If a learned task is linked to an individual column and if the column is in the sleeplike state, errors in the learned task occur (33). Furthermore, asynchronous development of sleep within occipital cortical columns is described (53). Substantial evidence from intact birds and marine mammals indicates that sleep can be unihemispheric, (e.g., 42, 56). Hemispheric differences in sleep intensity, as measured by EEG slow wave amplitudes, can be experimentally manipulated in humans (e.g., 24) and animals (e.g., 67). Collectively, these published reports are consistent with the proposal that small cortical networks exhibit sleep states justifying the use of cortical samples in the present work.
The cortical samples used in the present study contained various cell types, many of which are involved in sleep regulation (e.g., 26), and this limits interpretations. Thus, for example, optogenetic stimulation of neurons in vitro or whisker stimulation in vivo enhances TNF and IL1 expression in cortical neurons (9, 21, 27). Because IL1 and TNF are well-characterized sleep regulatory substances, they induce each other and self-induce themselves, and they can be expressed by many central nervous system (CNS) cell types, e.g., glia, the present results cannot tell us which and when gene transcript expression correlations occur at a cellular level and how such correlations directly relate to state control. Furthermore, within the cortex there are local nitric oxide synthase (NOS)-expressing neurons involved in sleep regulation (20). TNF and IL1 activate NOS expression (e.g., 7). Local cortical NOS circuits are innervated by projections from subcortical sleep regulatory circuits (e.g., 73). Unraveling how these various cortical sleep regulatory cellular components change the expression profiles is of great interest but remains the target of future experiments. Finally, the importance of identification of specific neuronal networks involved in sleep regulation is exemplified by the demonstration that a subset of hypothalamic melanin-concentrating hormone (MCH) neurons are activated during REMS whereas distinct patterns of MCH-containing networks that share neurons with the REMS-activated networks occur during movement (5).
Relationship between Pearson and Spearman Correlations
In this section, suppose that the sample vectors x and y both have zero mean and unit norm and that components of x are arranged in ascending order. Let ^y denote the vector representing an ordered arrangement of the components of y. The components of ^y are listed in ascending order if ρ(x,y) ≥ 0; otherwise, the arrangement is reversed. Since y is obtained from ^y by a permutation of its components, ^y is also a mean-zero vector of unit norm. We then write
where Pσ denotes the corresponding permutation matrix.
The Pearson correlation can be then written as
| (4) |
where the dot denotes the Euclidean scalar product in the space of n-dimensional vectors.
Next consider the rank vector rx = (1,2, . . ., n). For calculating Pearson correlation, it should be shifted and scaled so that the resulting vector w has mean 0 and norm 1. Direct calculation shows that w = (w1, . . ., wn), where
| (5) |
Since the rank vector of y is obtained from rx by the permutation Pσ that appears in Eq. 4, the Spearman correlation can be written as
| (6) |
when ^y is arranged in ascending order. In the case of descending arrangement, Pσw should be replaced with −Pσw. From now on, we assume that the arrangement is ascending, i.e., ρ(x,y) ≥ 0. The treatment of the other case is analogous. Writing x = w + Δx and y = Pσ^y = Pσw + PσΔ^y we obtain
| (7) |
Therefore, the transformation of x,y into the corresponding rank vectors can be thought of as a two-step process. First, ^y and x are transformed into the vector w with equally spaced components. The induced errors Δ^y and Δx are treated as noise and neglected. Next, the components of w are permuted with Pσ. The permutation is therefore the only property of the data set taken into account by the Spearman correlation. To put it differently, when using the Spearman correlation, we are de facto replacing the actual ordered vectors x and ^y by the vector w with equally spaced components.
Equation 7 suggests a way for assessing significance of using the difference ρ − P as a statistic. If one believes that the Spearman correlation is informative, then Pσ should encode useful information, while effects related to the nonuniform spacing are neglected. This suggests running a permutation test by fixing Pσ, arbitrarily permuting components of Δx and Δ^y, and calculating the resulting empirical (conditional) distribution of P (since ρ would be fixed). The empirical distribution can then be used to determine the likelihood of the observed value of P(x,y). In particular, such a test is useful for interpreting the case of low Spearman and high Pearson correlation.
Remark.
Although permutation of components preserves the mean and the norm of a vector, it may change its direction. Therefore, the norm of the sum of the fixed vector w and a permuted error vector may differ from 1. To enforce the unit norm constraint, the norm of the permuted error vectors may need to be adjusted by scaling. Denoting Δx̃ a vector obtained by permuting the components of Δx, we find the scaling coefficient k by solving |w + Δx| = |w + kΔx̃| = 1. The permuted and scaled error vector would then have the norm k|Δx̃|. This vector should be then added to w for computing P corresponding to the permutation. The treatment of the vector obtained by permuting the components of Δ^y is analogous.
Examples of Low |ρ| Combined with High |P| in the Data
Only three pairs of genes (0.9% of all distinct pairs) in our data satisfied the condition |P| > |ρ| + 0.5, considered as the criterion for the case of low |ρ| combined with high |P|. The measurements of all three pairs of genes came from the same subgroup (WT SD mice at ZT4), which is also a subgroup of the smallest size (5 animals). We ran the proposed permutation test for two of the pairs, Ada–IL1 and AcPb–IL1, to assess the likelihood of the observed values of P. The correlation coefficients and data structure in the other pair, TNF–Per1, were similar to those in Ada–IL1.
Example 1: genes Ada and IL1.
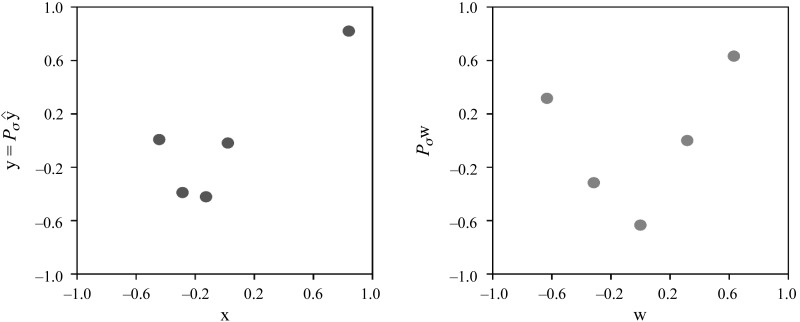
Figure 10 shows the data for the pair Ada–IL1, for which P = 0.85 and ρ = 0.3. The values for Ada and IL1 are represented by the x-axes and the y-axes, respectively. The left scatterplot shows their data vectors x (Ada) and y = Pσ^y (IL1), centered and scaled to have mean 0 and norm 1. The right scatterplot shows their analogously centered and scaled ranks w (Ada) and Pσw (IL1).
Fig. 10.
Ada (x-axes) against IL1 (y-axes) at zeitgeber time 4 in wild-type sleep deprivation mice. The left scatterplot shows the corresponding data vectors x and y = Pσ^y centered and scaled to have the mean of 0 and the norm of 1. The right scatterplot shows their respective ranks w and Pσw, centered and scaled analogously.
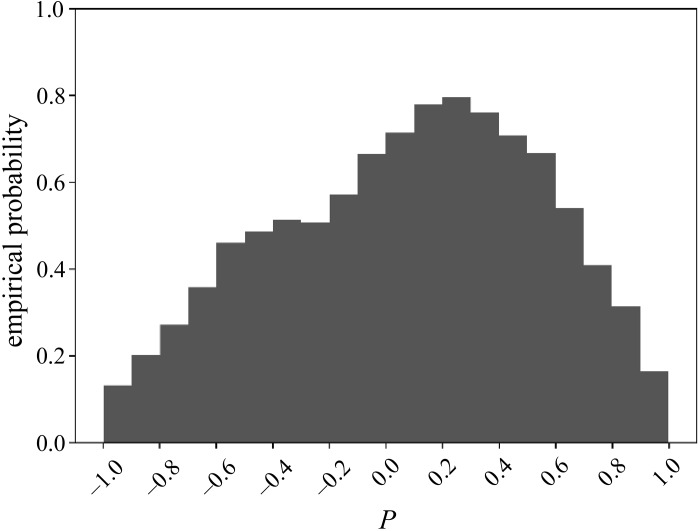
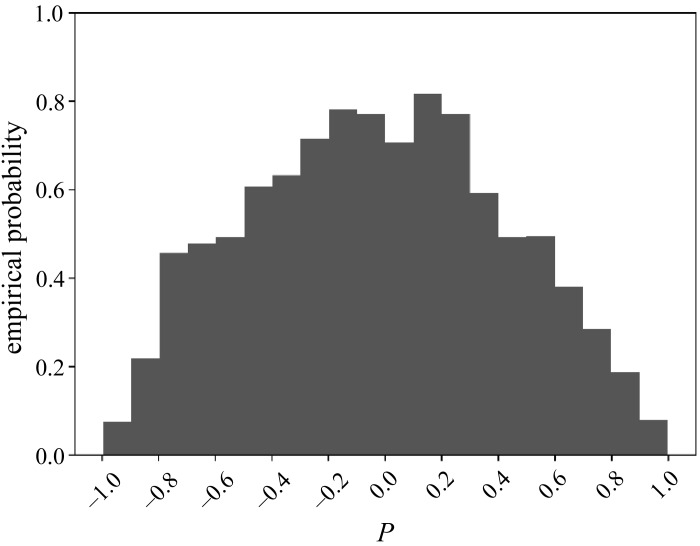
We computed the value of P for every permutation of the components of Δx = x − w together with every permutation of the components of Δ^y = ^y − w, as per the description of the permutation test above. Figure 11 shows the resulting empirical distribution of P, with its range [−1,1] binned into 20 intervals of width 0.1 each. It follows that the empirical probability of the observed P = 0.85 ∈ [0.8,0.9) is 0.3111.
Fig. 11.
Empirical distribution of Pearson’s correlation P for the pair Ada–IL1.
Example 2: genes AcPb and IL1.
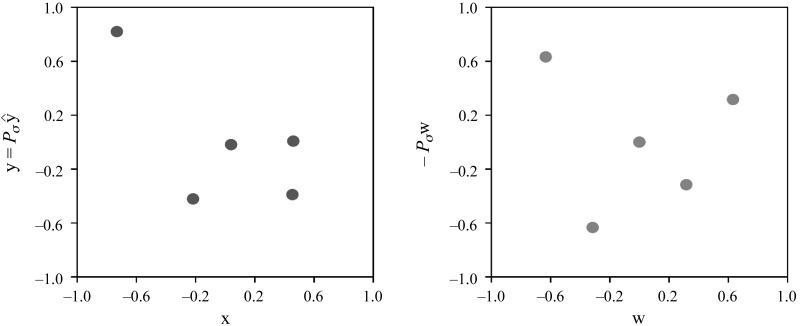
Figure 12 shows the data for the pair AcPb–IL1, for which P = −0.68 and ρ = −0.1. The values for AcPb and IL1 are represented by the x-axes and the y-axes, respectively. The left scatterplot shows their data vectors x (AcPb) and y = Pσ^y (IL1), centered and scaled to have mean 0 and norm 1. We note that ρ < 0, and therefore the components of ŷ are arranged in descending order. The right scatterplot shows their analogously centered and scaled ranks w (AcPb) and −Pσw (IL1).
Fig. 12.
AcPb (x-axes) against IL1 (y-axes) at zeitgeber time 4 in wild-type sleep deprivation mice. The left scatterplot shows the corresponding data vectors x and y = Pσ^y, centered and scaled to have the mean of 0 and the norm of 1. The right scatterplot shows their respective ranks w and y = −Pσw, centered and scaled analogously.
We computed the value of P for every permutation of the components of Δx = x − w together with every permutation of the components of Δ^y = ^y + w, as per the description of the permutation test above. Figure 13 shows the resulting empirical distribution of P, with its range [−1,1] binned into 20 intervals of width 0.1 each. It follows that the empirical probability of the observed P = −0.68 ∈ [−0.7,−0.6) is 0.4854.
Fig. 13.
Empirical distribution of Pearson’s correlation P for the pair AcPb–IL1.
Conclusions
The permutation test shows that the chance to observe the values of Pearson correlation P in both examples was <50%. We conclude that the observed values of P are affected by the noise and should be ignored, whereas the Spearman correlation captures regular (nonnoisy) features of the data.
GRANTS
This work was supported in part by National Institutes of Health Grant NS-025378 to J.M.K. and National Science Foundation CAREER Award 1553067 to I.K.
DISCLOSURES
No conflicts of interest, financial or otherwise, are declared by the authors.
AUTHOR CONTRIBUTIONS
V.O., A.P., and J.M.K. conceived and designed research; M.S., C.M.G., and J.T.N. performed experiments; V.O., K.M.S.K., C.J.D.-A., M.S., and A.P. analyzed data; V.O., C.J.D.-A., I.K., and J.M.K. interpreted results of experiments; V.O. and K.M.S.K. prepared figures; V.O., C.J.D.-A., I.K., A.P., and J.M.K. drafted manuscript; K.M.S.K., C.J.D.-A., M.S., J.T.N., I.K., and A.P. edited and revised manuscript; V.O., K.M.S.K., C.J.D.-A., M.S., C.M.G., J.T.N., I.K., A.P., and J.M.K. approved final version of manuscript.
REFERENCES
- 1.Alam MN, McGinty D, Bashir T, Kumar S, Imeri L, Opp MR, Szymusiak R. Interleukin-1beta modulates state-dependent discharge activity of preoptic area and basal forebrain neurons: role in sleep regulation. Eur J Neurosci 20: 207–216, 2004. doi: 10.1111/j.1460-9568.2004.03469.x. [DOI] [PubMed] [Google Scholar]
- 2.Arentsen T, Qian Y, Gkotzis S, Femenia T, Wang T, Udekwu K, Forssberg H, Diaz Heijtz R. The bacterial peptidoglycan-sensing molecule Pglyrp2 modulates brain development and behavior. Mol Psychiatry 22: 257–266, 2017. doi: 10.1038/mp.2016.182. [DOI] [PMC free article] [PubMed] [Google Scholar]
- 3.Bandarabadi M, Vassalli A, Tafti M. Sleep as a default state of cortical and subcortical networks. Curr Opin Physiol 15: 60–67, 2020. doi: 10.1016/j.cophys.2019.12.004. [DOI] [Google Scholar]
- 4.Bjorness TE, Kelly CL, Gao T, Poffenberger V, Greene RW. Control and function of the homeostatic sleep response by adenosine A1 receptors. J Neurosci 29: 1267–1276, 2009. doi: 10.1523/JNEUROSCI.2942-08.2009. [DOI] [PMC free article] [PubMed] [Google Scholar]
- 5.Blanco-Centurion C, Luo S, Spergel DJ, Vidal-Ortiz A, Oprisan SA, Van den Pol AN, Liu M, Shiromani PJ. Dynamic network activation of hypothalamic MCH neurons in REM sleep and exploratory behavior. J Neurosci 39: 4986–4998, 2019. doi: 10.1523/JNEUROSCI.0305-19.2019. [DOI] [PMC free article] [PubMed] [Google Scholar]
- 6.Cavadini G, Petrzilka S, Kohler P, Jud C, Tobler I, Birchler T, Fontana A. TNF-alpha suppresses the expression of clock genes by interfering with E-box-mediated transcription. Proc Natl Acad Sci USA 104: 12843–12848, 2007. doi: 10.1073/pnas.0701466104. [DOI] [PMC free article] [PubMed] [Google Scholar]
- 7.Chen L, Taishi P, Majde JA, Peterfi Z, Obal F Jr, Krueger JM. The role of nitric oxide synthases in the sleep responses to tumor necrosis factor-alpha. Brain Behav Immun 18: 390–398, 2004. doi: 10.1016/j.bbi.2003.12.002. [DOI] [PubMed] [Google Scholar]
- 8.Churchill L, Rector DM, Yasuda K, Fix C, Rojas MJ, Yasuda T, Krueger JM. Tumor necrosis factor alpha: activity dependent expression and promotion of cortical column sleep in rats. Neuroscience 156: 71–80, 2008. doi: 10.1016/j.neuroscience.2008.06.066. [DOI] [PMC free article] [PubMed] [Google Scholar]
- 9.Churchill L, Taishi P, Wang M, Brandt J, Cearley C, Rehman A, Krueger JM. Brain distribution of cytokine mRNA induced by systemic administration of interleukin-1beta or tumor necrosis factor alpha. Brain Res 1120: 64–73, 2006. doi: 10.1016/j.brainres.2006.08.083. [DOI] [PubMed] [Google Scholar]
- 10.Corner MA, Baker RE, van Pelt J. Physiological consequences of selective suppression of synaptic transmission in developing cerebral cortical networks in vitro: differential effects on intrinsically generated bioelectric discharges in a living ‘model’ system for slow-wave sleep activity. Neurosci Biobehav Rev 32: 1569–1600, 2008. doi: 10.1016/j.neubiorev.2008.06.008. [DOI] [PubMed] [Google Scholar]
- 11.Davis CJ, Clinton JM, Jewett KA, Zielinski MR, Krueger JM. Delta wave power: an independent sleep phenotype or epiphenomenon? J Clin Sleep Med 7, Suppl: S16–S18, 2011. doi: 10.5664/JCSM.1346. [DOI] [PMC free article] [PubMed] [Google Scholar]
- 12.Davis CJ, Dunbrasky D, Oonk M, Taishi P, Opp MR, Krueger JM. The neuron-specific interleukin-1 receptor accessory protein is required for homeostatic sleep and sleep responses to influenza viral challenge in mice. Brain Behav Immun 47: 35–43, 2015. doi: 10.1016/j.bbi.2014.10.013. [DOI] [PMC free article] [PubMed] [Google Scholar]
- 13.Diessler S, Jan M, Emmenegger Y, Guex N, Middleton B, Skene DJ, Ibberson M, Burdet F, Götz L, Pagni M, Sankar M, Liechti R, Hor CN, Xenarios I, Franken P. A systems genetics resource and analysis of sleep regulation in the mouse. PLoS Biol 16: e2005750, 2018. doi: 10.1371/journal.pbio.2005750. [DOI] [PMC free article] [PubMed] [Google Scholar]
- 14.Dziarski R, Gupta D. Review: Mammalian peptidoglycan recognition proteins (PGRPs) in innate immunity. Innate Immun 16: 168–174, 2010. doi: 10.1177/1753425910366059. [DOI] [PubMed] [Google Scholar]
- 15.Erridge C, Attina T, Spickett CM, Webb DJ. A high-fat meal induces low-grade endotoxemia: evidence of a novel mechanism of postprandial inflammation. Am J Clin Nutr 86: 1286–1292, 2007. doi: 10.1093/ajcn/86.5.1286. [DOI] [PubMed] [Google Scholar]
- 16.Everson CA, Toth LA. Systemic bacterial invasion induced by sleep deprivation. Am J Physiol Regul Integr Comp Physiol 278: R905–R916, 2000. doi: 10.1152/ajpregu.2000.278.4.R905. [DOI] [PubMed] [Google Scholar]
- 17.Fang J, Wang Y, Krueger JM. Effects of interleukin-1beta on sleep are mediated by the type I receptor. Am J Physiol Regul Integr Comp Physiol 274: R655–R660, 1998. doi: 10.1152/ajpregu.1998.274.3.R655. [DOI] [PubMed] [Google Scholar]
- 18.Franken P, Dijk DJ. Circadian clock genes and sleep homeostasis. Eur J Neurosci 29: 1820–1829, 2009. doi: 10.1111/j.1460-9568.2009.06723.x. [DOI] [PubMed] [Google Scholar]
- 19.Garlanda C, Dinarello CA, Mantovani A. The interleukin-1 family: back to the future. Immunity 39: 1003–1018, 2013. doi: 10.1016/j.immuni.2013.11.010. [DOI] [PMC free article] [PubMed] [Google Scholar]
- 20.Gerashchenko D, Wisor JP, Burns D, Reh RK, Shiromani PJ, Sakurai T, de la Iglesia HO, Kilduff TS. Identification of a population of sleep-active cerebral cortex neurons. Proc Natl Acad Sci USA 105: 10227–10232, 2008. doi: 10.1073/pnas.0803125105. [DOI] [PMC free article] [PubMed] [Google Scholar]
- 21.Hallett H, Churchill L, Taishi P, De A, Krueger JM. Whisker stimulation increases expression of nerve growth factor- and interleukin-1beta-immunoreactivity in the rat somatosensory cortex. Brain Res 1333: 48–56, 2010. doi: 10.1016/j.brainres.2010.03.048. [DOI] [PMC free article] [PubMed] [Google Scholar]
- 22.Hinard V, Mikhail C, Pradervand S, Curie T, Houtkooper RH, Auwerx J, Franken P, Tafti M. Key electrophysiological, molecular, and metabolic signatures of sleep and wakefulness revealed in primary cortical cultures. J Neurosci 32: 12506–12517, 2012. doi: 10.1523/JNEUROSCI.2306-12.2012. [DOI] [PMC free article] [PubMed] [Google Scholar]
- 23.Huang Y, Smith DE, Ibáñez-Sandoval O, Sims JE, Friedman WJ. Neuron-specific effects of interleukin-1β are mediated by a novel isoform of the IL-1 receptor accessory protein. J Neurosci 31: 18048–18059, 2011. doi: 10.1523/JNEUROSCI.4067-11.2011. [DOI] [PMC free article] [PubMed] [Google Scholar]
- 24.Huber R, Ghilardi MF, Massimini M, Ferrarelli F, Riedner BA, Peterson MJ, Tononi G. Arm immobilization causes cortical plastic changes and locally decreases sleep slow wave activity. Nat Neurosci 9: 1169–1176, 2006. doi: 10.1038/nn1758. [DOI] [PubMed] [Google Scholar]
- 25.Imeri L, Opp MR. How (and why) the immune system makes us sleep. Nat Rev Neurosci 10: 199–210, 2009. doi: 10.1038/nrn2576. [DOI] [PMC free article] [PubMed] [Google Scholar]
- 26.Ingiosi AM, Raymond RM Jr, Pavlova MN, Opp MR. Selective contributions of neuronal and astroglial interleukin-1 receptor 1 to the regulation of sleep. Brain Behav Immun 48: 244–257, 2015. doi: 10.1016/j.bbi.2015.03.014. [DOI] [PubMed] [Google Scholar]
- 27.Jewett KA, Taishi P, Sengupta P, Roy S, Davis CJ, Krueger JM. Tumor necrosis factor enhances the sleep-like state and electrical stimulation induces a wake-like state in co-cultures of neurons and glia. Eur J Neurosci 42: 2078–2090, 2015. doi: 10.1111/ejn.12968. [DOI] [PMC free article] [PubMed] [Google Scholar]
- 28.Jiang P, Franklin KM, Duncan MJ, O’Hara BF, Wisor JP. Distinct phase relationships between suprachiasmatic molecular rhythms, cerebral cortex molecular rhythms, and behavioral rhythms in early runner (CAST/EiJ) and nocturnal (C57BL/6J) mice. Sleep 35: 1385–1394, 2012. doi: 10.5665/sleep.2120. [DOI] [PMC free article] [PubMed] [Google Scholar]
- 29.Kapsimalis F, Richardson G, Opp MR, Kryger M. Cytokines and normal sleep. Curr Opin Pulm Med 11: 481–484, 2005. doi: 10.1097/01.mcp.0000183062.98665.6b. [DOI] [PubMed] [Google Scholar]
- 30.Konadhode RR, Pelluru D, Shiromani PJ. Unihemispheric sleep: an enigma for current models of sleep-wake regulation. Sleep 39: 491–494, 2016. doi: 10.5665/sleep.5508. [DOI] [PMC free article] [PubMed] [Google Scholar]
- 31.Krueger JM. The role of cytokines in sleep regulation. Curr Pharm Des 14: 3408–3416, 2008. doi: 10.2174/138161208786549281. [DOI] [PMC free article] [PubMed] [Google Scholar]
- 32.Krueger JM, Clinton JM, Winters BD, Zielinski MR, Taishi P, Jewett KA, Davis CJ. Involvement of cytokines in slow wave sleep. Prog Brain Res 193: 39–47, 2011. doi: 10.1016/B978-0-444-53839-0.00003-X. [DOI] [PMC free article] [PubMed] [Google Scholar]
- 33.Krueger JM, Huang YH, Rector DM, Buysse DJ. Sleep: a synchrony of cell activity-driven small network states. Eur J Neurosci 38: 2199–2209, 2013. doi: 10.1111/ejn.12238. [DOI] [PMC free article] [PubMed] [Google Scholar]
- 34.Krueger JM, Obál F Jr. A neuronal group theory of sleep function. J Sleep Res 2: 63–69, 1993. doi: 10.1111/j.1365-2869.1993.tb00064.x. [DOI] [PubMed] [Google Scholar]
- 35.Krueger JM, Opp MR. Pro-inflammatory cytokines in sleep regulation: animal models. In: Primer of PsychoNeuroImmunology Research, edited by Opp MR. Los Angeles, CA: PsychoNeuroImmunology Research Society, 2016, p. 267–272. [Google Scholar]
- 36.Krueger JM, Opp MR. Sleep and Microbes. Int Rev Neurobiol 131: 207–225, 2016. doi: 10.1016/bs.irn.2016.07.003. [DOI] [PMC free article] [PubMed] [Google Scholar]
- 37.Krueger JM, Rector DM, Roy S, Van Dongen HP, Belenky G, Panksepp J. Sleep as a fundamental property of neuronal assemblies. Nat Rev Neurosci 9: 910–919, 2008. doi: 10.1038/nrn2521. [DOI] [PMC free article] [PubMed] [Google Scholar]
- 38.Krueger JM, Walter J, Dinarello CA, Wolff SM, Chedid L. Sleep-promoting effects of endogenous pyrogen (interleukin-1). Am J Physiol Regul Integr Comp Physiol 246: R994–R999, 1984. doi: 10.1152/ajpregu.1984.246.6.R994. [DOI] [PubMed] [Google Scholar]
- 39.Livak KJ, Schmittgen TD. Analysis of relative gene expression data using real-time quantitative PCR and the 2−ΔΔCT method. Methods 25: 402–408, 2001. doi: 10.1006/meth.2001.1262. [DOI] [PubMed] [Google Scholar]
- 40.Mackiewicz M, Sollars PJ, Ogilvie MD, Pack AI. Modulation of IL-1beta gene expression in the rat CNS during sleep deprivation. Neuroreport 7: 529–533, 1996. doi: 10.1097/00001756-199601310-00037. [DOI] [PubMed] [Google Scholar]
- 41.Mazzotti DR, Guindalini C, de Souza AA, Sato JR, Santos-Silva R, Bittencourt LR, Tufik S. Adenosine deaminase polymorphism affects sleep EEG spectral power in a large epidemiological sample. PLoS One 7: e44154, 2012. doi: 10.1371/journal.pone.0044154. [DOI] [PMC free article] [PubMed] [Google Scholar]
- 42.Mukhametov LM. Sleep in marine mammals. Exp Brain Res 8: 227–238, 1984. [Google Scholar]
- 43.Naylor E, Bergmann BM, Krauski K, Zee PC, Takahashi JS, Vitaterna MH, Turek FW. The circadian clock mutation alters sleep homeostasis in the mouse. J Neurosci 20: 8138–8143, 2000. doi: 10.1523/JNEUROSCI.20-21-08138.2000. [DOI] [PMC free article] [PubMed] [Google Scholar]
- 44.Nguyen J, Gibbons CM, Dykstra-Aiello C, Ellingsen R, Koh KM, Taishi P, Krueger JM. Interleukin-1 receptor accessory proteins are required for normal homeostatic responses to sleep deprivation. J Appl Physiol (1985) 127: 770–780, 2019. doi: 10.1152/japplphysiol.00366.2019. [DOI] [PMC free article] [PubMed] [Google Scholar]
- 45.Nguyen JT, Sahabandu D, Taishi P, Xue M, Jewett K, Dykstra-Aiello C, Roy S, Krueger JM. The neuron-specific interleukin-1 receptor accessory protein alters emergent network state properties in Vitro. Neurobiol Sleep Circadian Rhythms 6: 35–43, 2019. doi: 10.1016/j.nbscr.2019.01.002. [DOI] [PMC free article] [PubMed] [Google Scholar]
- 46.Obal F Jr, Krueger JM. Biochemical regulation of non-rapid-eye-movement sleep. Front Biosci 8: d520–d550, 2003. doi: 10.2741/1033. [DOI] [PubMed] [Google Scholar]
- 47.Opp MR, Krueger JM. Anti-interleukin-1 beta reduces sleep and sleep rebound after sleep deprivation in rats. Am J Physiol Regul Integr Comp Physiol 266: R688–R695, 1994. doi: 10.1152/ajpregu.1994.266.3.R688. [DOI] [PubMed] [Google Scholar]
- 48.Opp MR, Krueger JM. Interleukin 1-receptor antagonist blocks interleukin 1-induced sleep and fever. Am J Physiol Regul Integr Comp Physiol 260: R453–R457, 1991. doi: 10.1152/ajpregu.1991.260.2.R453. [DOI] [PubMed] [Google Scholar]
- 49.Opp MR, Krueger JM. Interleukin-1 is involved in responses to sleep deprivation in the rabbit. Brain Res 639: 57–65, 1994. doi: 10.1016/0006-8993(94)91764-7. [DOI] [PubMed] [Google Scholar]
- 50.Opp MR, Obal F Jr, Krueger JM. Interleukin 1 alters rat sleep: temporal and dose-related effects. Am J Physiol Regul Integr Comp Physiol 260: R52–R58, 1991. doi: 10.1152/ajpregu.1991.260.1.R52. [DOI] [PubMed] [Google Scholar]
- 51.Pabst MJ, Beranova-Giorgianni S, Krueger JM. Effects of muramyl peptides on macrophages, monokines, and sleep. Neuroimmunomodulation 6: 261–283, 1999. doi: 10.1159/000026384. [DOI] [PubMed] [Google Scholar]
- 52.Pappenheimer JR, Koski G, Fencl V, Karnovsky ML, Krueger J. Extraction of sleep-promoting factor S from cerebrospinal fluid and from brains of sleep-deprived animals. J Neurophysiol 38: 1299–1311, 1975. doi: 10.1152/jn.1975.38.6.1299. [DOI] [PubMed] [Google Scholar]
- 53.Pigarev IN, Nothdurft HC, Kastner S. Evidence for asynchronous development of sleep in cortical areas. Neuroreport 8: 2557–2560, 1997. doi: 10.1097/00001756-199707280-00027. [DOI] [PubMed] [Google Scholar]
- 54.Quercia A, Zappasodi F, Committeri G, Ferrara M. Local use-dependent sleep in wakefulness links performance errors to learning. Front Hum Neurosci 12: 122, 2018. doi: 10.3389/fnhum.2018.00122. [DOI] [PMC free article] [PubMed] [Google Scholar]
- 55.Rath MF, Rovsing L, Møller M. Circadian oscillators in the mouse brain: molecular clock components in the neocortex and cerebellar cortex. Cell Tissue Res 357: 743–755, 2014. doi: 10.1007/s00441-014-1878-9. [DOI] [PubMed] [Google Scholar]
- 56.Rattenborg NC, Lima SL, Lesku JA. Sleep locally, act globally. Neuroscientist 18: 533–546, 2012. doi: 10.1177/1073858412441086. [DOI] [PubMed] [Google Scholar]
- 57.Rector DM, Topchiy IA, Carter KM, Rojas MJ. Local functional state differences between rat cortical columns. Brain Res 1047: 45–55, 2005. doi: 10.1016/j.brainres.2005.04.002. [DOI] [PubMed] [Google Scholar]
- 58.Rehman A, Taishi P, Fang J, Majde JA, Krueger JM. The cloning of a rat peptidoglycan recognition protein (PGRP) and its induction in brain by sleep deprivation. Cytokine 13: 8–17, 2001. doi: 10.1006/cyto.2000.0800. [DOI] [PubMed] [Google Scholar]
- 59.Rockstrom MD, Chen L, Taishi P, Nguyen JT, Gibbons CM, Veasey SC, Krueger JM. Tumor necrosis factor alpha in sleep regulation. Sleep Med Rev 40: 69–78, 2018. doi: 10.1016/j.smrv.2017.10.005. [DOI] [PMC free article] [PubMed] [Google Scholar]
- 60.Saberi-Moghadam S, Simi A, Setareh H, Mikhail C, Tafti M. In vitro cortical network firing is homeostatically regulated: a model for sleep regulation. Sci Rep 8: 6297, 2018. doi: 10.1038/s41598-018-24339-6. [DOI] [PMC free article] [PubMed] [Google Scholar]
- 61.Shiromani PJ, Xu M, Winston EM, Shiromani SN, Gerashchenko D, Weaver DR. Sleep rhythmicity and homeostasis in mice with targeted disruption of mPeriod genes. Am J Physiol Regul Integr Comp Physiol 287: R47–R57, 2004. doi: 10.1152/ajpregu.00138.2004. [DOI] [PubMed] [Google Scholar]
- 62.Smith DE, Hanna R, Friend D, Moore H, Chen H, Farese AM, MacVittie TJ, Virca GD, Sims JE. The soluble form of IL-1 receptor accessory protein enhances the ability of soluble type II IL-1 receptor to inhibit IL-1 action. Immunity 18: 87–96, 2003. doi: 10.1016/S1074-7613(02)00514-9. [DOI] [PubMed] [Google Scholar]
- 63.Smith DE, Lipsky BP, Russell C, Ketchem RR, Kirchner J, Hensley K, Huang Y, Friedman WJ, Boissonneault V, Plante MM, Rivest S, Sims JE. A central nervous system-restricted isoform of the interleukin-1 receptor accessory protein modulates neuronal responses to interleukin-1. Immunity 30: 817–831, 2009. doi: 10.1016/j.immuni.2009.03.020. [DOI] [PMC free article] [PubMed] [Google Scholar]
- 64.Stenberg D, Litonius E, Halldner L, Johansson B, Fredholm BB, Porkka-Heiskanen T. Sleep and its homeostatic regulation in mice lacking the adenosine A1 receptor. J Sleep Res 12: 283–290, 2003. doi: 10.1046/j.0962-1105.2003.00367.x. [DOI] [PubMed] [Google Scholar]
- 65.Taishi P, Bredow S, Guha-Thakurta N, Obál F Jr, Krueger JM. Diurnal variations of interleukin-1beta mRNA and beta-actin mRNA in rat brain. J Neuroimmunol 75: 69–74, 1997. doi: 10.1016/S0165-5728(97)00002-7. [DOI] [PubMed] [Google Scholar]
- 66.Taishi P, Churchill L, De A, Obal F Jr, Krueger JM. Cytokine mRNA induction by interleukin-1beta or tumor necrosis factor alpha in vitro and in vivo. Brain Res 1226: 89–98, 2008. doi: 10.1016/j.brainres.2008.05.067. [DOI] [PMC free article] [PubMed] [Google Scholar]
- 67.Taishi P, Churchill L, Wang M, Kay D, Davis CJ, Guan X, De A, Yasuda T, Liao F, Krueger JM. TNFalpha siRNA reduces brain TNF and EEG delta wave activity in rats. Brain Res 1156: 125–132, 2007. doi: 10.1016/j.brainres.2007.04.072. [DOI] [PMC free article] [PubMed] [Google Scholar]
- 68.Taishi P, Davis CJ, Bayomy O, Zielinski MR, Liao F, Clinton JM, Smith DE, Krueger JM. Brain-specific interleukin-1 receptor accessory protein in sleep regulation. J Appl Physiol (1985) 112: 1015–1022, 2012. doi: 10.1152/japplphysiol.01307.2011. [DOI] [PMC free article] [PubMed] [Google Scholar]
- 69.Takahashi S, Fang J, Kapás L, Wang Y, Krueger JM. Inhibition of brain interleukin-1 attenuates sleep rebound after sleep deprivation in rabbits. Am J Physiol 273: R677–R682, 1997. doi: 10.1152/ajpregu.1997.273.2.R677. [DOI] [PubMed] [Google Scholar]
- 70.Tobler I, Borbély AA, Schwyzer M, Fontana A. Interleukin-1 derived from astrocytes enhances slow wave activity in sleep EEG of the rat. Eur J Pharmacol 104: 191–192, 1984. doi: 10.1016/0014-2999(84)90391-1. [DOI] [PubMed] [Google Scholar]
- 71.Ursin R, Bjorvatn B. Sleep-wake and EEG effects following adenosine a1 agonism and antagonism: similarities and interactions with sleep-wake and EEG effects following a serotonin reuptake inhibitor in rats. Sleep Res Online 1: 119–127, 1998. [PubMed] [Google Scholar]
- 72.Vyazovskiy VV, Olcese U, Hanlon EC, Nir Y, Cirelli C, Tononi G. Local sleep in awake rats. Nature 472: 443–447, 2011. doi: 10.1038/nature10009. [DOI] [PMC free article] [PubMed] [Google Scholar]
- 73.Williams RH, Vazquez-DeRose J, Thomas AM, Piquet J, Cauli B, Kilduff TS. Cortical nNOS/NK1 receptor neurons are regulated by cholinergic projections from the basal forebrain. Cereb Cortex 28: 1959–1979, 2018. doi: 10.1093/cercor/bhx102. [DOI] [PMC free article] [PubMed] [Google Scholar]
- 74.Williams-Woods J, González-Escalona N, Burkhardt W 3rd. Direct sequencing of hepatitis A virus and norovirus RT-PCR products from environmentally contaminated oyster using M13-tailed primers. J Virol Methods 178: 253–257, 2011. doi: 10.1016/j.jviromet.2011.09.014. [DOI] [PubMed] [Google Scholar]
- 75.Wisor JP, Pasumarthi RK, Gerashchenko D, Thompson CL, Pathak S, Sancar A, Franken P, Lein ES, Kilduff TS. Sleep deprivation effects on circadian clock gene expression in the cerebral cortex parallel electroencephalographic differences among mouse strains. J Neurosci 28: 7193–7201, 2008. doi: 10.1523/JNEUROSCI.1150-08.2008. [DOI] [PMC free article] [PubMed] [Google Scholar]
- 76.Yasuda T, Yoshida H, Garcia-Garcia F, Kay D, Krueger JM. Interleukin-1beta has a role in cerebral cortical state-dependent electroencephalographic slow-wave activity. Sleep 28: 177–186, 2005. doi: 10.1093/sleep/28.2.177. [DOI] [PubMed] [Google Scholar]
- 77.Zielinski MR, Kim Y, Karpova SA, McCarley RW, Strecker RE, Gerashchenko D. Chronic sleep restriction elevates brain interleukin-1beta and tumor necrosis factor-alpha and attenuates brain-derived neurotrophic factor expression. Neurosci Lett 580: 27–31, 2014. doi: 10.1016/j.neulet.2014.07.043. [DOI] [PMC free article] [PubMed] [Google Scholar]


