Abstract
Cerebral subdural hematomas due to trauma can easily worsen suddenly due to the rupture of blood vessels in the brain after the condition is stabilized. Therefore, continuous monitoring of the size of cerebral subdural hematomas has important clinical significance. To achieve fast, real-time, noninvasive, and accurate monitoring of subdural hematomas, a cerebral subdural hematoma monitoring method combining brain magnetic resonance imaging (MRI) image guidance, diffusion optical tomography technology, and deep learning is proposed in this manuscript. First, an MRI brain image is segmented to obtain a three-dimensional multi-layer brain model with structures and parameters matching a real brain. Then, a near-infrared light source and detectors (source-detector separations ranging from 0.5 to 6.5 cm) were placed on the model to achieve fast, real-time and noninvasive acquisition of intracranial hematoma information. Finally, a deep learning method is used to obtain accurate reconstructed images of cerebral subdural hematomas. The experimental results show that the reconstruction effect of stacked auto-encoder with the mean volume error of 0.1 ml is better than the result reconstructed by algebraic reconstruction techniques with the mean volume error of 0.9 ml. Under different signal-to-noise ratios, the curve fitting R2 between the actual blood volume of a simulated hematoma and a reconstructed hematoma is more than 0.95. We conclude that the proposed monitoring method can realize fast, noninvasive, real-time, and accurate monitoring of subdural hematomas, and can provide a technical basis for continuous wearable subdural hematoma monitoring equipment.
1. Introduction
External forces acting on the head can often cause intracranial hemorrhage leading to subdural hematomas. Changes in the size of the hematomas cause blood pressure to rise or fall, causing changes in the condition of the patient. A typical feature of consciousness changes in patients with a cerebral subdural hematoma is the process of losing consciousness, waking and then losing consciousness again i.e. there is an intermediate period when the patient is awake. The intermediate awake period is confusing and can easily result in people ignoring the possible loss of consciousness again. Therefore, patients with cerebral subdural hematomas should firstly undergo magnetic resonance imaging (MRI) or computerized tomography (CT) examinations, and then stay in hospital for a week for observation. During this time, real-time monitoring of subdural hematoma patients is required. The main methods used for cerebral subdural hematoma detection are imaging methods such as CT and MRIs. These imaging methods are called the gold standard for cerebral subdural hematoma detection due to their good imaging quality. However, for real-time monitoring requirements of cerebral subdural hematoma patients, current clinical imaging technology cannot continuously monitor the condition of cerebral subdural hematoma patients for a long time.
To achieve rapid, real-time, noninvasive, and accurate monitoring of cerebral subdural hematoma size [1–5], this article uses brain MRI images as a guide for patients with cerebral subdural hematomas admitted for preliminary examination and obtains a sample data set using diffuse optical tomography (DOT) [6–10] to perform optical simulation. The NIRFAST Slicer software is used to segment the MRI image of the brain into a three-dimensional (3D) multi-layer tissue model. A monitoring structure of Single-Source Multi-Detectors [11] is then established based on DOT technology to obtain information on the position and size of the subdural hematoma in the brain image. Finally, the size and position of the subdural hematoma are reconstructed using a stacked auto-encoder (SAE) deep learning network [12,13].
The introduction of brain MRI images not only provide a priori information such as the hematoma location and the initial size of the hematoma, but also combines the NIRFAST Slicer software in the model simulation to build a 3D multi-layer tissue model. This allows the simulation model to structurally fit the real structure of the human brain. DOT technology is a detection method that uses near-infrared light as a light source to detect internal information of biological tissues. It can quickly and noninvasively obtain hematoma information through its Single-Source Multi-Detectors exploration mode. Deep learning networks [14–17] have improved the accuracy of reconstructed images in various medical image reconstructions [18,19]. In [20], a reconstruction method based on an SAE network can significantly reduce the ill-posedness of the inverse problem of image reconstruction. We also compared the SAE network reconstruction algorithm with the traditional algebraic reconstruction technique (ART) algorithm. ART algorithm is the most typical and basic one in algebraic iterative reconstruction algorithm. ART algorithm, like other algebraic iterative methods, has the advantages of strong noise immunity and not being limited by the model of the problem being processed. However, the large amount of calculation takes up a lot of space and memory, resulting in a slow reconstruction speed. Compared with the traditional ART algorithm, this method can more clearly reconstruct the edges of heterogeneous bodies and obtain a highly-accurate reconstruction of the image. Based on this, this manuscript has selected the SAE network for reconstruction of hematoma monitoring images. The combination of brain MRI images, DOT technology, and the SAE network enables fast, noninvasive, real-time and accurate monitoring of subdural hematomas. This study provides medical staff with effective auxiliary monitoring technology and effectively prevents deterioration of the patient's condition due to negligent monitoring of hematomas in subdural hematoma patients.
2. Establishment of a brain multi-layer tissue model
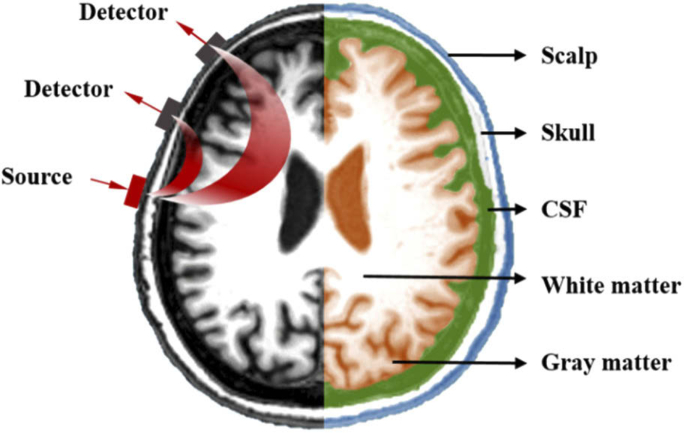
The 3D multi-layer tissue model in this manuscript was established based on MRI images of the human brain, using NIRFAST Slicer software [21] as an auxiliary tool. This software can segment 3D medical images (DICOMS) to create numerical models for optical calculations or image reconstruction. Figure 1 shows an image of a real human head obtained from an MRI scan. It is divided into five layers based on the anatomy of the human brain: scalp, skull, cerebrospinal fluid, gray matter and white matter. The optical parameters of each layer of the brain are shown in Table 1, which shows the optical parameters of the brain under near-infrared light at a wavelength of 850 nm [22], where μa is the absorption coefficient, μs is the scattering coefficient and g is the anisotropy factor. After using the NIRFAST Slicer to build a numerical model of the image, the NIRFAST software package can be used to place light source and detectors on the model for near-infrared simulation experiments. The light source and detector placement diagram is shown on the left of Fig. 1.
Fig. 1.
Hierarchical structure of the head model.
Table 1. Optical parameters of human head.
| Tissue | μa(mm−1) | μs(mm−1) | g |
|---|---|---|---|
| Scalp | 0.019 | 6.400 | 0.900 |
| Skull | 0.014 | 8.400 | 0.900 |
| CSF | 0.004 | 3.000 | 0.900 |
| Gray matter | 0.019 | 6.730 | 0.900 |
| White matter | 0.021 | 10.110 | 0.900 |
The scalp layer and the skull layer are the outer protective structures of the brain with large scattering coefficients and small absorption coefficients. The cerebrospinal fluid layer is a liquid medium between the gray matter layer and the skull layer. Its properties are similar to those of plasma and lymphoid tissues and the absorption coefficient and scattering coefficient are small. The gray matter layer and the white matter layer are composed of nerve cells inside the brain and are important parts of the central nervous system. Based on the structure and optical parameters of the brain, for the optical simulation, the brain has been divided into three layers. The specific optical parameters of the three-layer brain structure are shown in Table 2. The scalp layer and the skull layer have been combined into a single layer due to their similar role in the brain, adjacent locations and similar optical parameters. The gray matter and white matter have also been combined into one layer, since it is difficult for near-infrared light to reach the white matter layer. Near-infrared light at 700 nm ∼ 900 nm has good penetrability to human tissue and can penetrate the skin by a few centimeters, but only a small amount of light in the brain can reach the white matter layer.
Table 2. Optical parameters of a human head model.
| Tissue | μa(mm−1) | μs(mm−1) | g |
|---|---|---|---|
| Scalp & Skull | 0.016 | 7.400 | 0.900 |
| CSF | 0.004 | 3.000 | 0.900 |
| Gray matter & White matter | 0.020 | 8.420 | 0.900 |
| hematoma | 0.300 | 4.000 | 0.900 |
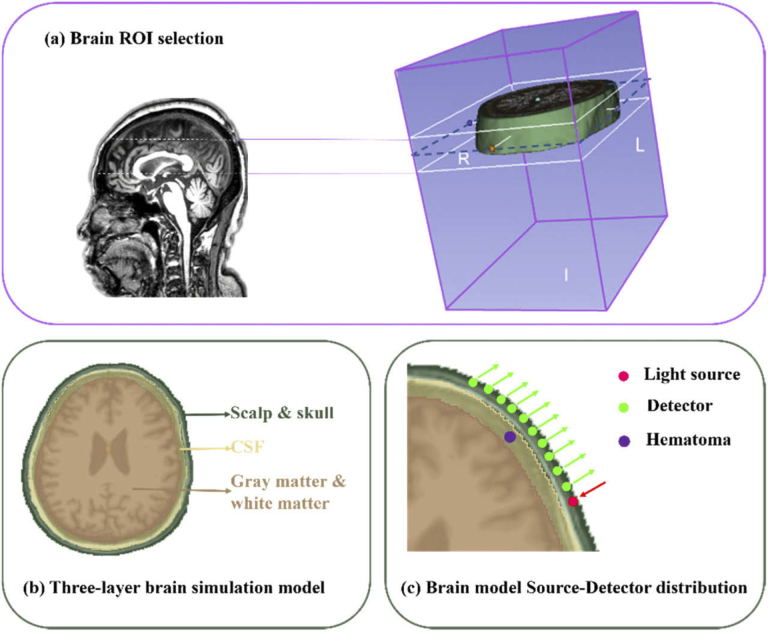
In this manuscript, we have used the finite element method of NIRFAST to divide the model into finite element meshes. This method places near-infrared light source and detectors on the model for optical simulation. A schematic diagram of the simulation model is shown in Fig. 2. Figure 2(a) shows the location of the region of interest (ROI) in the simulation model. Since multiple areas of hematomas are above the brow bone of brain, this study used NIRFAST Slicer software to select the ROI of the brain MRI image and capture a stereo image of the brow bone of brain. Figure 2(b) shows a three-layer brain simulation model. NIRFAST Slicer software was used to divide the brain into three layers according to the real brain structure obtained by the MRI images of the brain: (1) the scalp & skull layer, (2) the cerebrospinal fluid (CSF) layer, and (3) the gray matter & white matter layer. The thickness of the scalp & skull layer is about 1.7 cm, the CSF layer is about 0.2 cm and the gray matter & white matter layer is about 3.8 cm. Finally, a segmentation unit with a size of 2.5 mm was used to divide the parts into a finite element mesh composed of 37802 points and 207761 tetrahedrons. The optical parameters of each layer are shown in Table 2. Figure 2(c) shows the Source-Detector (SD) location in the simulation model. A light source and ten detectors were placed on the edge of the first layer of the brain model (source-detector separations ranging from 0.5 to 6.5 cm), and a subdural hematoma was placed on the second layer of the brain model. A hematoma contains abundant hemoglobin, which has a strong absorption effect on near-infrared light. Under normal circumstances, the absorption of near-infrared light at the subdural hematoma location will be more than ten times stronger than in the surrounding normal tissues. Therefore, the optical parameters of the subdural hematoma were set to μa = 0.3 mm−1 and μs = 4.0 mm−1. The size of the hematoma was changed in such a way that the edge of the hematoma was tangent to the edge of the Scalp & Skull layer and then expands toward the center of the circle. The size of the hematoma was varied between a minimum radius of 3 mm and a maximum radius of 15 mm, at a step size of 0.1 mm and 121 groups of hematoma samples with different radii were finally obtained.
Fig. 2.
Schematic diagram of the brain model. (a) Brain ROI selection; (b) three-layer brain simulation model; (c) brain model Single-source Multi-Detector distribution.
3. Stacked auto-encoder network model
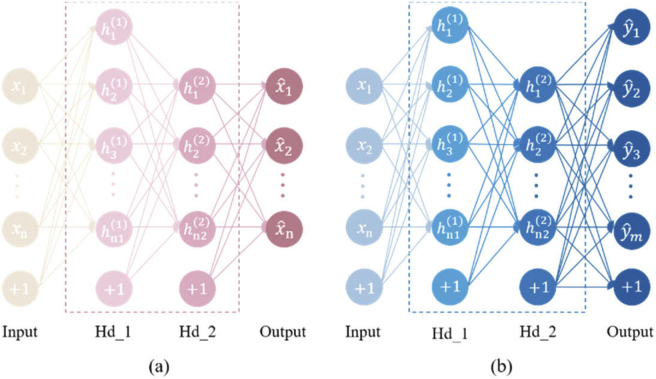
To achieve accurate reconstruction of the subdural hematoma size and location, a classic SAE network was used. An SAE network is a neural network model composed of a series of auto-encoders (AEs). Each auto-encoder is a three-layer neural network consisting of an input layer x, a hidden layer h and an output layer. The neurons between layers are completely connected to each other and contain the characteristic information of the learning network. Its basic structure is shown in Fig. 3.
Fig. 3.
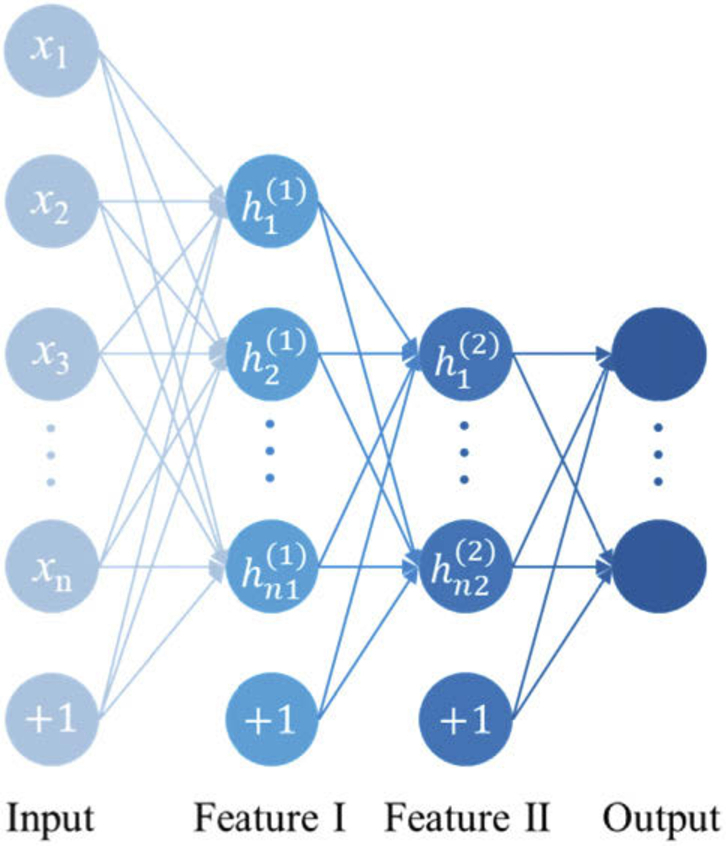
Structure of the auto-encoder.
The SAE network consists of unsupervised pre-training and supervised NN-training for parameter fine-tuning. The pre-training is based on the unsupervised learning characteristics of an SAE network. The same input and output values are used to train the network weights and biases. The first AE trains the parameters of the first hidden layer by encoding and decoding and the output of the first AE is used as the input of the next AE. The parameters of each layer are trained in the same way. The NN-training uses the weights and biases obtained by the pre-training as the initial values of the Back-propagation (BP) network. The neural network is trained by the BP network using forward conduction and a backpropagation algorithm is then used for fine-tuning to obtain the optimized neural network parameters for a network with two hidden layers. The SAE network structure is shown in Fig. 4. After some SAE network selection pre-experimentation, a double hidden layer SAE network was chosen to be used in this study with a four-layer network structure. The input layer is the output light intensity detected by 10 detectors and the output layer is the absorption coefficient values of the 37802 segmented units. There are 156 neurons and 2427 neurons in the first and second layers, respectively. There were 121 samples used for the experiment, 100 samples for the training datasets and 21 samples for the testing datasets. The epoch was 100, the iteration was 10, the batch size was 10 and the activation function was sigmoid.
Fig. 4.
SAE network structure. (a) Pre-training network structure; (b) NN-training network structure.
4. Results and analysis
4.1. Comparison of the reconstruction effect with SAE and traditional ART
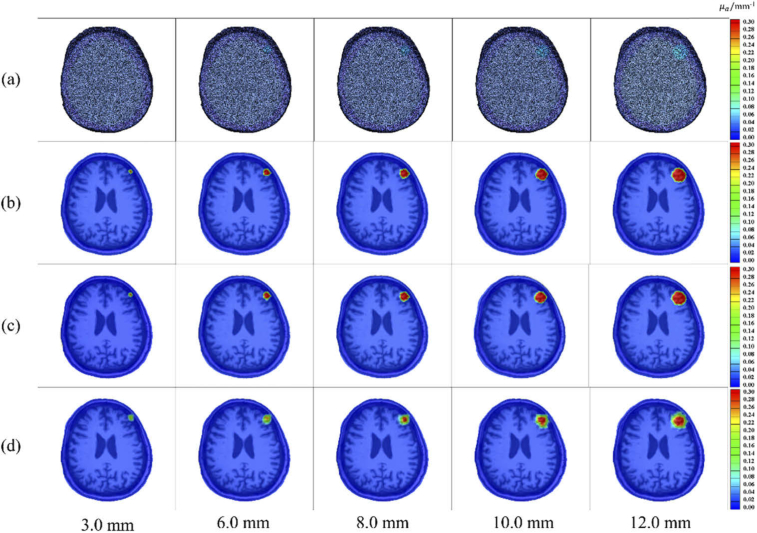
This study conducted a comparison experiment to review the accuracy of subdural hematoma reconstruction based on the SAE network versus the traditional ART algorithm. On a CPU configured with an Intel (R) Core (TM) i5-8400 computer, the subdural hematoma reconstruction of the two algorithms takes about 15s and about 3 minutes, respectively. The comparison results of the two reconstruction algorithms are shown in Fig. 5 for four groups of reconstructed images with a radius of 3.0 mm, 6.0 mm, 8.0 mm, 10.0 mm and 12.0 mm.
Fig. 5.
Comparison of reconstruction effect based on SAE and traditional ART. (a) 3D rendering visualized images of real subdural hematomas; (b) slice images of real subdural hematoma; (c) subdural hematoma slice images reconstructed by the SAE network; (d) subdural hematoma slice images reconstructed by the ART algorithm.
To quantitatively analyze the reconstruction effectiveness of the subdural hematoma location, a barycenter error (BCE) method was used in this study to analyze the network reconstruction results. The BCE function is given by:
| (1) |
| (2) |
| (3) |
| (4) |
Since the method used to solve the barycenter is the same for both the real image and the reconstructed image, the formula for solving the barycenter of the real image is used here for explanation purposes. (Cxi, Cyi, Czi) represent the coordinate points of the barycenter of the real image, i = 1, 2… 37802 and (Cxj, Cyj, Czj) represent the coordinate points of the barycenter of the reconstructed image, j = 1, 2… 37802. Vi represents the absorption coefficient value corresponding to the real image coordinate points. (Dxi, Dyi, Dzi) represent the coordinate points of the real image. BCE is equal to the two-norm calculation solution value of the real image barycenter coordinate points and the reconstructed image barycenter coordinate points. The BCE analysis results are shown in Table 3.
Table 3. BCE analysis of the SAE algorithm and the ART algorithm for reconstruction of the subdural hematoma.
| SAE BCE/mm | ART BCE/mm | |
|---|---|---|
| Minimum | 0.041 | 0.099 |
| Mean | 0.196 | 0.737 |
| Maximum | 0.599 | 1.998 |
In Table 3, the mean BCE, the maximum BCE, and the minimum BCE of the SAE network are all smaller than the BCEs of the ART algorithm, which indicates that the SAE network is more accurate than the ART reconstruction algorithm for the reconstruction of the subdural hematoma location.
• The mean BCE between the SAE network reconstructed hematomas and the real hematomas is only 0.196 mm and the maximum BCE < 0.599 mm.
• The mean BCE is 12 times smaller than the brain segmentation unit size used in the experiment, which is 2.5 mm.
• The BCE of the ART algorithm reconstructed hematomas is smaller than 2.5 mm. However, compared with the ART algorithm, the SAE network reconstruction algorithm reduces the average BCE of the position reconstruction error by 3.7 times.
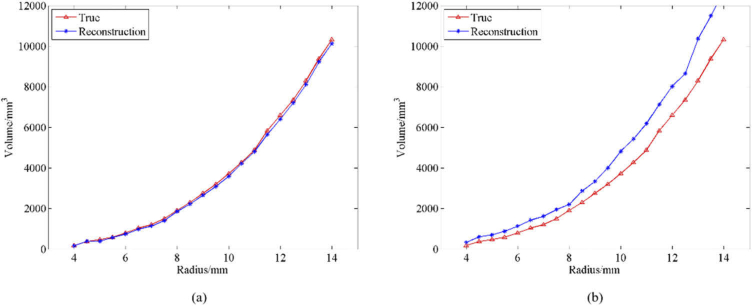
To analyze the effectiveness of the hematoma size reconstruction, this study used the volume error (VE) analysis method i.e. the deviation between the volume of the real hematoma and the volume of the reconstructed hematoma. Figure 6(a) shows the VE analysis results of the true volume of the subdural hematoma and the volume of the reconstructed hematoma based on the SAE network. The mean VE was 0.10 ml, the standard deviation VE was 0.06 ml and the mean relative VE was 4.60%. Figure 6(b) shows the VE analysis results of the volume of the real hematoma and the volume of the reconstructed hematoma based on the ART algorithm. The mean VE was 0.90 ml and the mean relative VE was 33.15%. These results show that the SAE network is superior to the ART algorithm for reconstructing hematoma size.
Fig. 6.
VE analysis of real subdural hematoma and reconstructed subdural hematoma. (a) Comparison of real subdural hematoma volumes and reconstructed subdural hematoma volumes based on SAE with different radii; (b) Comparison of real subdural hematoma volumes and reconstructed subdural hematoma volumes based on ART with different radii.
4.2. Subdural hematoma reconstruction results and analysis under different SNRs
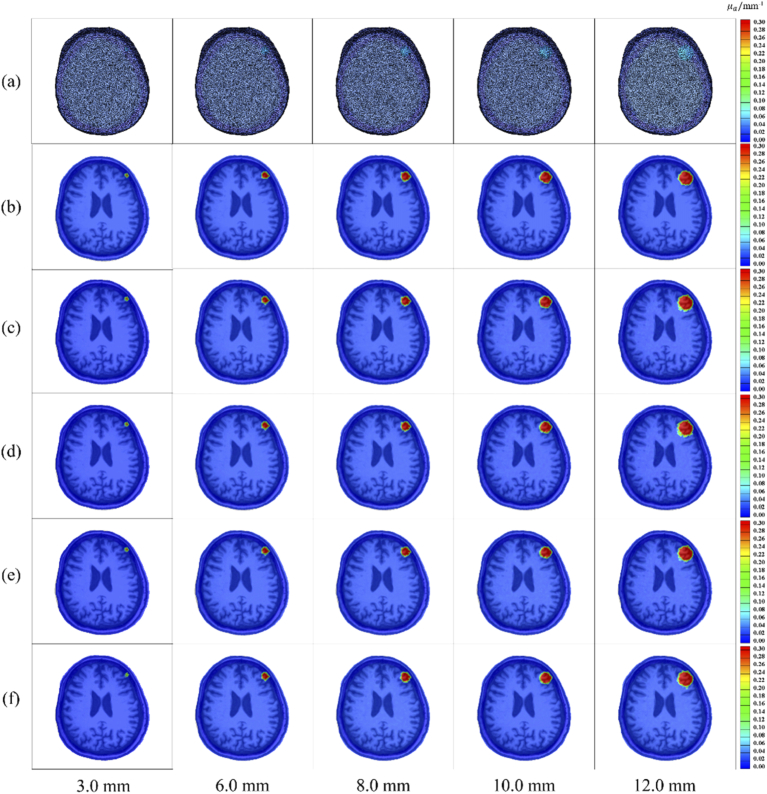
In this manuscript, we also study the reconstruction effectiveness of subdural hematoma reconstruction methods based on SAE networks under different signal-to-noise ratios (SNR) of 50 dB, 40 dB, 30 dB and 20 dB. Consider the noise (shot noise, read noise and dark noise) present during system acquisition [23]. Therefore, we added different SNR to the light intensity signals collected by the detectors. Figure 7 shows the reconstruction diagrams for different SNR with radii of 3.0 mm, 6.0 mm, 8.0 mm, 10.0 mm, and 12.0 mm.
Fig. 7.
Reconstruction effect of SAE network under different SNRs. (a) 3D visualization images of a real cerebral subdural hematoma; (b) slice images of real cerebral subdural hematomas; (c) cerebral subdural hematoma slice images reconstructed with 50 dB SNR; (d) cerebral subdural hematoma slice images reconstructed with 40 dB SNR; (e) cerebral subdural hematoma slice images reconstructed with 30 dB SNR; (f) cerebral subdural hematoma slice images reconstructed with 20 dB SNR.
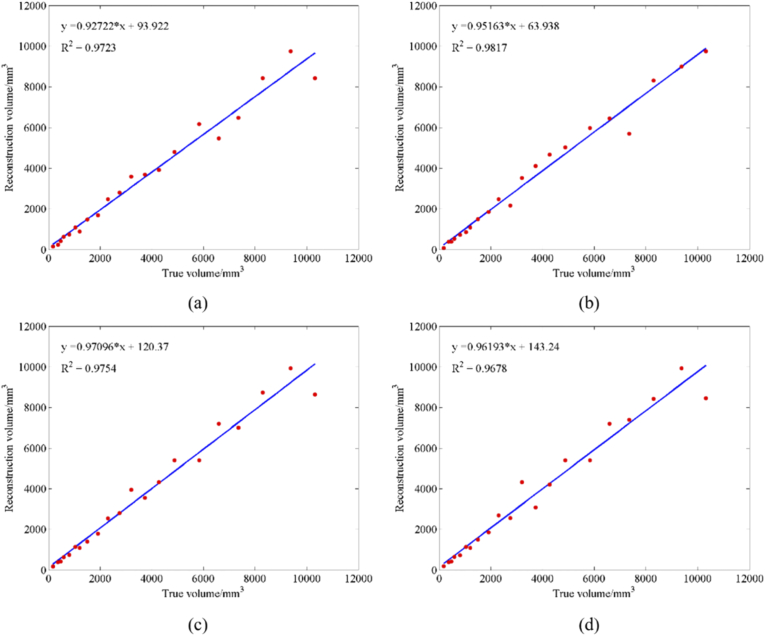
Figure 7 shows that the SAE network can successfully reconstruct hematomas of different sizes under different SNR conditions. Table 4 provides the VE analysis of a real hematoma and the hematoma reconstructed with the SAE network under different SNRs. Figure 8 shows the curve fitting of the real volume and the reconstructed volume with the SAE network under different SNRs. The experimental results under different SNRs show that the mean VE between the volume of real hematoma and the volume of reconstructed hematoma does not exceed 1 ml, and the mean relative VE does not exceed 10%. Therefore, the curve fitting R2 is above 0.95. The analysis also shows that when there are high noise levels, the reconstruction of cerebral hematomas based on an SAE network with high noise is still highly accurate. Thus, this method can effectively monitor cerebral hematomas.
Table 4. VE analysis of real cerebral subdural hematoma and SAE-reconstructed cerebral subdural hematoma under different SNRs.
| SNR/dB | mean VE/ml | mean relative VE/ml | standard deviation VE/ml |
|---|---|---|---|
| 50 | 0.32 | 9.90% | 0.42 |
| 40 | 0.27 | 9.96% | 0.39 |
| 30 | 0.30 | 7.84% | 0.40 |
| 20 | 0.34 | 9.63% | 0.47 |
Fig. 8.
Curve fitting figures of real volume and reconstructed volume of SAE. (a) SNR under 50 dB; (b) SNR under 40 dB; (c) SNR under 30 dB; (d) SNR under 20 dB.
Table 5 provides the BCE analysis of a real hematoma and an SAE network reconstructed hematoma under different SNRs. It concluded from Table 5 that the minimum BCE was 0.05 mm under different SNRs, the mean BCE value did not exceed 0.50 mm. The maximum BCE was 1.20 mm, and also smaller than the size of the segmentation unit. This conclusion proved that the reconstruction of hematoma position based on SAE network can meet the needs of hematoma monitoring under different SNRs.
Table 5. BCE analysis of real cerebral subdural hematoma and SAE network reconstruction cerebral subdural hematoma under different SNRs.
| SNR/dB | max BCE/mm | mean BCE/mm | min BCE/mm |
|---|---|---|---|
| 50 | 0.87 | 0.37 | 0.06 |
| 40 | 0.96 | 0.41 | 0.05 |
| 30 | 0.87 | 0.34 | 0.06 |
| 20 | 1.20 | 0.41 | 0.05 |
5. Discussion
The computational time is an important consideration for translating this technique to clinical application. In this study, the model creation time is 3 hours, and the reconstruction time based on SAE model is about 15s (the laptop is configured with a CPU of the Intel (R) Core (TM) i5-8400). If a higher configured computer or a workstation is to be used for computing, the time will be reduced greatly. Also, our team is trying to build a calculation structure based on web cloud server. The raw data will be sent to the cloud server by 5G network, and the results will be sent back within 5s to meet the requirement of clinical use.
At present, in this study the model was built based on the individual MRI data to achieve a more accuracy of cerebral hematoma monitoring. Under the guidance of MRI images, we can obtain a three-layer brain model with suitable thickness and optical parameters, and obtain initial information about the location and size of the hematoma. The future research direction will be to establish a general model based on huge enough database with different brain models and different hematoma situations to reduce time to create model.
The effective detection depth and effective detection size based on the near-infrared method are also an important consideration for promoting this technique to clinical application. In adults, the thickness of the scalp layer is about 0.7 cm, the skull layer is 0.3 to 1.1 cm, the CSF layer is about 0.2 cm. The gray matter layer is about 0.4 cm. The thickness of the four layer head model without the white matter layer (the white matter layer is about 3.4 cm) is 1.6-2.4 cm. The hematoma we monitored in the manuscript has a maximum radius of 15 mm, which indicates that the near-infrared light can achieve this depth of hematoma monitoring. However, the near- infrared light has a certain penetration depth, the accuracy of hematoma monitoring at different depths will vary. In the simulation, we chose a source detector distance of 0.5 to 6.5 cm, trying to find out what will happen under these wide situations, because the greater the source detection distance, the deeper the detectable depth. However, the distance between the light source and the detector cannot be too large because of laser power limit for safety and sensitivity limitation of detectors (For example, 6.5 cm may not be feasible in real situation). Considering the monitoring of subdural hematoma in the future clinical application, it may not be necessary to include extremely large source-detector separations. In the future, the effect of limiting source detector separations to realistically achievable values will be explored.
Existing hematoma detection equipment, such as Infrascanner [24], currently the world's most widely used device for the detection of cerebral hematoma at the emergency site and battlefield, sports events, can detect hematomas 3.5 cm below the epidermis, the minimum detectable bleeding volume is 3.5 ml. The operation time is 3 min. However, this device can only detect the presence or absence of a hematoma, and cannot image or locate the hematoma. Therefore, there are some restrictions on clinical use. In the study, the monitoring algorithm we studied can detect a hematoma with a minimum radius of 3 mm.
In this study, we demonstrated the feasibility of the continuous monitoring algorithm for subdural hematoma to achieve real-time, non-invasive and accurate monitoring of hematoma. However, the research direction from simulation to clinical needs improvements. In the future, we will investigate the following directions.
• Exploring the effect of different wavelengths and multiple wavelengths on the accuracy of hematoma monitoring. The light source used in this study is near-infrared light at 850 nm, but a single light source provides not enough information. Multi-wavelength light sources can improve detection accuracy.
• It would be interesting to see if there is any improvement in the results using time-resolved (TR) detection (i.e., pulsed light source and single photon counting). In general TR provides better depth sensitivity, which could improve the reconstruction of the hematoma.
• It would be valuable to run the simulations with different μa values for the hematoma and assess the accuracy of SAE.
• Exploring the role of different source-detector separations in detecting hematomas, the contribution of different separations to the reconstruction effect, and the short separations to reduce the effect of the extracerebral layers.
6. Conclusion
This study proposed to obtain a priori information of the size of the cerebral subdural hematoma position based on the MRI image of the brain, and used finite element segmentation to select the ROI of MRI image, so that the simulation model approached the real brain structure to the greatest extent. Then, the DOT of Single-Source Multi-Detectors can quickly and noninvasively obtain the internal information of cerebral subdural hematoma. Finally, the volume error of the reconstruction based on the SAE network is less than 0.34 ml for position and size reconstruction under different SNRs. It is worth mentioning that this accuracy rate was achieved when the size of the finite element segmentation unit of the model was 2.5 mm. Based on the current experimental results, we expect that if the size of the segmentation unit is reduced, a higher accuracy rate will be obtained. The method proposed in this study has been shown to achieve rapid, noninvasive, real-time and accurate monitoring of cerebral subdural hematomas. Thus, this method can be used as an effective auxiliary method for monitoring patients’ cerebral subdural hematomas in clinical trials.
Funding
Natural Science Foundation of Tianjin City10.13039/501100006606 (19JCQNJC13000); National Natural Science Foundation of China10.13039/501100001809 (81901789).
Disclosures
The authors declare no conflicts of interest.
References
- 1.Robertson C. S., Gopinath S. P., Chance B., “A New Application for Near-Infrared Spectroscopy: Detection of Delayed Intracranial Hematomas after Head Injury,” J Neurotraum 12(4), 591–600 (1995). 10.1089/neu.1995.12.591 [DOI] [PubMed] [Google Scholar]
- 2.Ghalenoui H., Saidi H., Azar M., Yahyavi S. T., “Near-Infrared Laser Spectroscopy as a Screening Tool for Detecting Hematoma in Patients with Head Trauma,” Prehosp. Disaster med. 23(6), 558–561 (2008). 10.1017/S1049023X00006415 [DOI] [PubMed] [Google Scholar]
- 3.Robertson C. S., Zager E. L., Narayan R. K., Handly N., “Clinical Evaluation of a Portable Near-Infrared Device for Detection of Traumatic Intracranial Hematomas,” J Neurotraum 27(9), 1597–1604 (2010). 10.1089/neu.2010.1340 [DOI] [PubMed] [Google Scholar]
- 4.Xu L., Tao X., Liu W., Li Y., “Portable near-infrared rapid detection of intracranial hemorrhage in Chinese population,” J. Clin. Neurosci. 40, 136–146 (2017). 10.1016/j.jocn.2017.02.056 [DOI] [PubMed] [Google Scholar]
- 5.Wang J., Lin J., Chen Y., Welle C. G., Pfefer T. J., “Phantom-based evaluation of near-infrared intracranial hematoma detector performance,” J. Biomed. Opt. 24(4), 1 (2019). 10.1117/1.JBO.24.4.045001 [DOI] [PMC free article] [PubMed] [Google Scholar]
- 6.Alayed M., Naser M. A., Aden-Ali I., Jamal Deen M., “Time-resolved diffuse optical tomography system using an accelerated inverse problem solver,” Opt. Express 26(2), 963 (2018). 10.1364/OE.26.000963 [DOI] [PubMed] [Google Scholar]
- 7.Proskurin S., “Using late arriving photons for diffuse optical tomography of biological objects,” Quantum Electron. 41(5), 402–406 (2011). 10.1070/QE2011v041n05ABEH014597 [DOI] [Google Scholar]
- 8.Lu W., Daniel Lighter S., Styles I. B., “L1-norm Based Nonlinear Reconstruction Improves Quantitative Accuracy of Spectral Diffuse Optical Tomography,” Biomed. Opt. Express 9(4), 1423 (2018). 10.1364/BOE.9.001423 [DOI] [PMC free article] [PubMed] [Google Scholar]
- 9.Zhao H., Cooper R. J., “Review of recent progress toward a fiberless, whole-scalp diffuse optical tomography system,” Neurophotonics 5(1), 011012 (2017). 10.1117/1.NPh.5.1.011012 [DOI] [PMC free article] [PubMed] [Google Scholar]
- 10.Ancora D., Qiu L., Zacharakis G., Spinelli L., “Noninvasive optical estimation of CSF thickness for brain-atrophy monitoring,” Biomed. Opt. Express 9(9), 4094 (2018). 10.1364/BOE.9.004094 [DOI] [PMC free article] [PubMed] [Google Scholar]
- 11.Wang H., Ren L., Zhao Z., Wang J., “Fast localization method of an anomaly in tissue based on differential optical density,” Biomed. Opt. Express 9(5), 2018–2026 (2018). 10.1364/BOE.9.002018 [DOI] [PMC free article] [PubMed] [Google Scholar]
- 12.Jiang L., Ge Z., Song Z., “Semi-supervised fault classification based on dynamic Sparse Stacked auto-encoders model,” Chemom. Intell. Lab. Syst. 168, 72–83 (2017). 10.1016/j.chemolab.2017.06.010 [DOI] [Google Scholar]
- 13.Li P., Chen Z., Yang L. T., Gao J., “An improved stacked auto-encoder for network traffic flow classification,” IEEE Network 32(6), 22–27 (2018). 10.1109/MNET.2018.1800078 [DOI] [Google Scholar]
- 14.Adler J., Öktem O., “Solving ill-posed inverse problems using iterative deep neural networks,” Inverse Problems 33(12), 124007 (2017). 10.1088/1361-6420/aa9581 [DOI] [Google Scholar]
- 15.Cai C., Deng K., Ma C., Luo J., “End-to-end deep neural network for optical inversion in quantitative photoacoustic imaging,” Opt. Lett. 43(12), 2752–2755 (2018). 10.1364/OL.43.002752 [DOI] [PubMed] [Google Scholar]
- 16.Kang E., Min J., Ye J. C., “A deep convolutional neural network using directional wavelets for low-dose X-ray CT reconstruction,” Med. Phys. 44(10), e360–e375 (2017). 10.1002/mp.12344 [DOI] [PubMed] [Google Scholar]
- 17.Gao Y., Wang K., An Y., Jiang S., Meng H., Tian J., “Nonmodel-based bioluminescence tomography using a machine-learning reconstruction strategy,” Optica 5(11), 1451–1454 (2018). 10.1364/OPTICA.5.001451 [DOI] [Google Scholar]
- 18.Guo L., Liu F., Cai C., Liu J., Zhang G., “3D deep encoder–decoder network for fluorescence molecular tomography,” Opt. Lett. 44(8), 1892–1895 (2019). 10.1364/OL.44.001892 [DOI] [PubMed] [Google Scholar]
- 19.Sun Y., Xia Z., Kamilov U. S., “Efficient and accurate inversion of multiple scattering with deep learning,” Opt. Express 26(11), 14678–14688 (2018). 10.1364/OE.26.014678 [DOI] [PubMed] [Google Scholar]
- 20.Wang H., Wu N., Cai Y., Ren L., Zhao Z., Han G., Wang J., “Optimization of Reconstruction Accuracy of Anomaly Position Based on Stacked Auto-Encoder Neural Networks,” IEEE Access 7, 116578–116584 (2019). 10.1109/ACCESS.2019.2931995 [DOI] [Google Scholar]
- 21.Jermyn M., Ghadyani H., Mastanduno M. A., Turner W., Davis S. C., Dehghani H., Pogue B. W., “Fast segmentation and high-quality three-dimensional volume mesh creation from medical images for diffuse optical tomography,” J. Biomed. Opt. 18(8), 086007 (2013). 10.1117/1.JBO.18.8.086007 [DOI] [PMC free article] [PubMed] [Google Scholar]
- 22.Tian F., Liu H., “Depth-compensated diffuse optical tomography enhanced by general linear model analysis and an anatomical atlas of human head,” NeuroImage 85, 166–180 (2014). 10.1016/j.neuroimage.2013.07.016 [DOI] [PMC free article] [PubMed] [Google Scholar]
- 23.Wang H., Feng X., Shi B., Liang W., Chen Y., Wang J., Li X., “Signal-to-noise ratio analysis and improvement for fluorescence tomography imaging,” Rev. Sci. Instrum. 89(9), 093114 (2018). 10.1063/1.5045511 [DOI] [PMC free article] [PubMed] [Google Scholar]
- 24.Ayaz H., Dor B. B., Solt D., Onaral B., “Infrascanner: Cost Effective, Mobile Medical Imaging System for Detecting Hematomas,” J. Med. Devices 5(2), 027540 (2011). 10.1115/1.3591407 [DOI] [Google Scholar]


