Key Points
Low expression of SETD2 predicts poor prognosis in MDS, and loss of Setd2 accelerates MDS-associated leukemogenesis in NHD13 mice.
Setd2 deficiency impairs S100a9-mediated self-renewal and differentiation of HSPCs in NHD13 mice.
Abstract
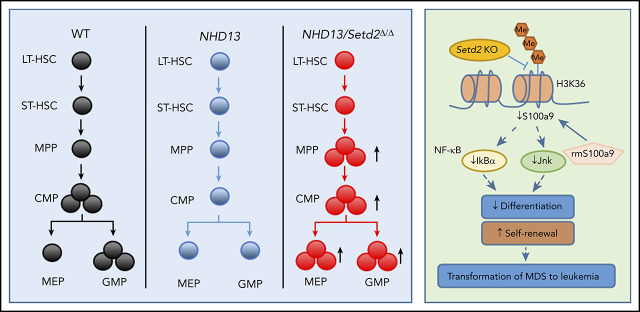
SETD2, the histone H3 lysine 36 methyltransferase, previously identified by us, plays an important role in the pathogenesis of hematologic malignancies, but its role in myelodysplastic syndromes (MDSs) has been unclear. In this study, low expression of SETD2 correlated with shortened survival in patients with MDS, and the SETD2 levels in CD34+ bone marrow cells of those patients were increased by decitabine. We knocked out Setd2 in NUP98-HOXD13 (NHD13) transgenic mice, which phenocopies human MDS, and found that loss of Setd2 accelerated the transformation of MDS into acute myeloid leukemia (AML). Loss of Setd2 enhanced the ability of NHD13+ hematopoietic stem and progenitor cells (HSPCs) to self-renew, with increased symmetric self-renewal division and decreased differentiation and cell death. The growth of MDS-associated leukemia cells was inhibited though increasing the H3K36me3 level by using epigenetic modifying drugs. Furthermore, Setd2 deficiency upregulated hematopoietic stem cell signaling and downregulated myeloid differentiation pathways in the NHD13+ HSPCs. Our RNA-seq and chromatin immunoprecipitation–seq analysis indicated that S100a9, the S100 calcium-binding protein, is a target gene of Setd2 and that the addition of recombinant S100a9 weakens the effect of Setd2 deficiency in the NHD13+ HSPCs. In contrast, downregulation of S100a9 leads to decreases of its downstream targets, including Ikba and Jnk, which influence the self-renewal and differentiation of HSPCs. Therefore, our results demonstrated that SETD2 deficiency predicts poor prognosis in MDS and promotes the transformation of MDS into AML, which provides a potential therapeutic target for MDS-associated acute leukemia.
Visual Abstract
Medscape Continuing Medical Education online

In support of improving patient care, this activity has been planned and implemented by Medscape, LLC and the American Society of Hematology. Medscape, LLC is jointly accredited by the Accreditation Council for Continuing Medical Education (ACCME), the Accreditation Council for Pharmacy Education (ACPE), and the American Nurses Credentialing Center (ANCC), to provide continuing education for the healthcare team.
Medscape, LLC designates this Journal-based CME activity for a maximum of 1.00 AMA PRA Category 1 Credit(s)™. Physicians should claim only the credit commensurate with the extent of their participation in the activity.
Successful completion of this CME activity, which includes participation in the evaluation component, enables the participant to earn up to 1.0 MOC points in the American Board of Internal Medicine's (ABIM) Maintenance of Certification (MOC) program. Participants will earn MOC points equivalent to the amount of CME credits claimed for the activity. It is the CME activity provider's responsibility to submit participant completion information to ACCME for the purpose of granting ABIM MOC credit.
All other clinicians completing this activity will be issued a certificate of participation. To participate in this journal CME activity: (1) review the learning objectives and author disclosures; (2) study the education content; (3) take the post-test with a 75% minimum passing score and complete the evaluation at http://www.medscape.org/journal/blood; and (4) view/print certificate. For CME questions, see page 2326.
Disclosures
Associate Editor Margaret A. Goodell, CME questions author Laurie Barclay, freelance writer and reviewer, Medscape, LLC, and the authors declare no relevant financial relationships.
Learning objectives
Upon completion of this activity, participants will be able to:
Describe the role of SETD2 in the progression of myelodysplastic syndrome (MDS) to acute myeloid leukemia (AML), according to study results of SETD2 expression in patients with MDS and of the effects of decitabine on SETD2 levels in cluster of differentiation 34 (CD34)–positive bone marrow cells of patients with MDS
Determine the role of SETD2 in the progression of MDS to AML, according to the effect of knockout of Setd2 in the NUP98-HOXD13 (NHD13) transgenic mouse model, which phenocopies human MDS
Identify clinical and research implications of the role of Setd2 in the progression of MDS to AML, according to human and knockout mice studies
Release date: June 18, 2020; Expiration date: June 18, 2021
Introduction
Myelodysplastic syndrome (MDS) is one of the most common myeloid malignancies characterized by bone marrow (BM) dysplasia, inefficient hematopoiesis, cytopenia, and a risk of progression to acute myeloid leukemia (AML).1,2 Several mouse models have been developed to mimic human MDS, and the NUP98-HOXD13 (NHD13) transgenic mouse is probably the most accurate, in which NHD13 is driven by the Vav1 promoter to express in hematopoietic cells.3 The NHD13 mice show anemia, neutropenia, and lymphopenia with hypercellular/normocellular BM, suggesting ineffective hematopoiesis. It is also an excellent model for the study of MDS progression to leukemia, as approximately one-third of NHD13 mice with MDS develop leukemia, most commonly AML, which mimics disease progression in MDS patients.3,4 Mutations in epigenetic modifiers, such as DNMT3A, TET2, EZH2, ASXL1, and BCOR, are commonly found in, and contribute to, MDS.5-9 Thus, MDS appears to be an epigenetic malignancy, consistent with its response to DNA demethylating drugs.10-12 For example, decitabine, the hypomethylating agent, has been the standard of MDS treatment for more than a decade.13
We had identified the histone methyltransferase SETD2 as the only enzyme that catalyzes histone H3 lysine 36 trimethylation (H3K36me3) in mammals.14,15 SETD2 binds to elongating RNA polymerase II and generates H3K36-trimethylated nucleosomes in the gene body regions of active genes, which provides docking sites for many important chromatin regulators, including DNMT3A/B.14,16 We have studied the role of Setd2 in embryonic development and normal hematopoiesis using genetically modified mouse models. We reported that Setd2 constitutive knockout mice exhibit embryonic lethality related to defects in embryonic vasculargenesis,15 and we and others also established that hematopoiesis-specific Setd2 deficiency impairs self-renewal and differentiation of hematopoietic stem cells (HSCs).17,18
SETD2 has been found to be mutated in different types of acute leukemia, including ∼6% of AML cases and ∼10% of cases of acute lymphoid leukemia.19-21 A particularly high frequency (22%) of SETD2 mutation is associated with MLL-rearranged leukemia.20 SETD2 genetic polymorphisms are also associated with AML prognosis.22 In the MLL-fusion–driven mouse BM transplantation models of AML, loss of a single allele of Setd2 or knockdown of Setd2 increases the growth of AML cells and shortens disease latency.20,23,24 However, it has also been observed that a complete loss of Setd2 (eg, by deletion of both alleles of Setd2) blocks development of leukemia.23-25 These studies indicate a pivotal but complicated role of Setd2 in the pathogenesis of acute leukemia.
Some studies have shown that NHD13-induced MDS/leukemia is controlled by epigenetic regulators (eg, MLL1, NSL, and p300), transcription factors (eg, p53 and Lmo2/Lyl1), HSC regulators (eg, MSI2 and Flt3), and apoptosis-related proteins (eg, Bcl2, PKR, and Puma). However, the role of SETD2 in the pathogenesis of NHD13 MDS/AML is unknown. Consistent with the above-described evidence implicating Setd2 as a tumor suppressor, we recently found that the Mx1-Cre–driven Setd2-knockout mice develop MDS when aged, indicating the causal function of SETD2 in myeloid malignancies.17 Both nonsense and frameshift-deletion mutations of SETD2 have been identified in MDS patients.26 Our clinical analysis showed that low expression of SETD2 was associated with shorter survival in MDS patients, and thus we hypothesized that SETD2 plays a vital role in the progression of MDS to AML.
Materials and methods
MDS patients
The microarray data, which contains data of 183 MDS patients and 17 control samples, are available at GEO (GSE19429).27 The cDNA, BM paraffin-embedded sections, and BM cells of MDS patients and samples from healthy subjects were collected from Shanghai Children’s Medical Center by J.S.
Mice
The NHD13 transgenic mice were purchased from Jackson Laboratory, and the Setd2flox/flox (Setd2f/f) mice were bred as described previously.17 The Mx1-Cre mice and CD45.1 B6SJL mice were purchased from Shanghai Research Center for Model Organisms. The NHD13 mice were crossed with Mx1-Cre/Setd2f/f or Setd2f/f mice, and Setd2 was deleted by injection of poly(I:C) into Mx1-Cre/NHD13/Setd2f/f mice, relative to control NHD13/Setd2f/f mice. All mice used in the experiments were on a pure C57BL/6 genetic background. The mice were used according to animal care standards, and animal studies were approved by the Committee of Animal Use at Shanghai Institute of Nutrition and Health.
Results
Low expression of SETD2 predicts poor prognosis in MDS
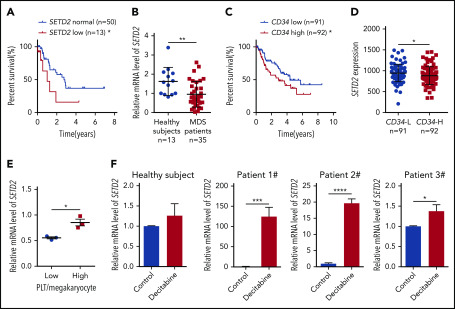
To investigate the role of SETD2 in MDS, we first used microarray-based gene expression profiling data of primary BM CD34+ cells from 183 MDS patients27 to learn whether the expression of SETD2 is associated with prognosis. The results showed that, in refractory anemia with excess blasts, a high-risk subtype of MDS, patients with low SETD2 expression had a significantly worse overall survival than the patients with normal SETD2 expression (Figure 1A), whereas the high-SETD2 group showed no significant difference (supplemental Figure 1A; available on the Blood Web site). We then performed quantitative polymerase chain reaction (qPCR) analysis of our MDS patient samples, and the results showed that the expression of SETD2 was significantly lower in the MDS patient samples than in those from healthy subjects (Figure 1B). Given the association of high CD34 expression with short survival in MDS patients (Figure 1C), we further analyzed the microarray data of the MDS patient samples, and we found that the expression of SETD2 correlated negatively with CD34 expression (Figure 1D). SETD2 is the only enzyme responsible for H3K36me3, and we therefore performed immunohistochemical analysis of MDS patient BM samples, using anti-H3K36me3 or CD34 antibodies. The results showed that H3K36me3 correlated negatively with CD34 expression (supplemental Figure 1B-C), consistent with the microarray analysis. In addition, the MDS patients with a low platelet/megakaryocyte ratio showed less SETD2 expression than those with a higher platelet/megakaryocyte ratio (Figure 1E). We did not observe a correlation of low expression of SETD2 with known MDS-associated gene mutations such as NF1, PTPN11, KRAS, NRAS, RUNX1, or SH2B3, in the analyzed MDS patient samples (supplemental Figure 1D). Low expression of SETD2 is associated with short survival in MDS, and we hypothesized that SETD2 expression could be altered by therapeutic drug treatments. To test this hypothesis, we used decitabine, a demethylating agent commonly used in MDS therapy, to treat BM CD34+ cells from MDS patients. qPCR analysis showed that SETD2 expression was upregulated significantly by decitabine, albeit with variable fold change, in the MDS samples, but not in the samples from healthy subjects (Figure 1F). The variable fold change was not related to the basic level of SETD2 expression (supplemental Figure 1E). As expected, decitabine significantly reduced the number of colonies produced by the primary MDS cells in the colony-forming unit (CFU) assay (supplemental Figure 1F-G). Thus, the increased expression of SETD2 may indicate a good response to decitabine treatment in MDS patients. Altogether, our clinical sample analysis suggests that low expression of SETD2 indicates a poor prognosis in MDS patients.
Figure 1.
Low expression of SETD2 predicts a poor outcome in MDS patients. (A) Overall survival of patients with refractory anemia with excess blasts, a subtype of MDS, was stratified by SETD2 expression into SETD2 low (z score < −0.9; n = 13; median survival, 1.0 year) and normal (−0.9 ≤ z score ≤ 0.9; n = 50; median survival, 2.8 years) groups. Statistical significance was evaluated by log-rank test. (B) qPCR analysis of expression of SETD2 in BM mononuclear cells from healthy subjects (n = 13) and MDS patients (n = 35). (C) Overall survival of the MDS patients stratified by CD34 expression. The absolute average of relative CD34 expression was used as the criterion to stratify the patients into CD34 low (n = 91; median survival, 4.4 years) and high (n = 92; median survival, 2.9 years) groups. (D) Differential expression of SETD2 in the CD34+ cells of MDS patients with CD34 low (L) and high (H) expression. The same criterion was used to stratify the patients as in panel C. (E) qPCR analysis of SETD2 expression in the BM CD34+ cells of the MDS patients with low or high platelet (PLT)/megakaryocyte counts. (F) qPCR analysis of SETD2 expression in the primary BM CD34+ cells treated with 5 nM decitabine or vehicle control for 48 hours. The patient samples in panels A, C, and D are from GEO (GSE19429) expression microarrays, and those in the other panels are from our own samples. *P < .05; **P < .01; ***P < .001; ****P < .0001.
Setd2 deficiency accelerates the transformation of MDS to AML in the NHD13 mice
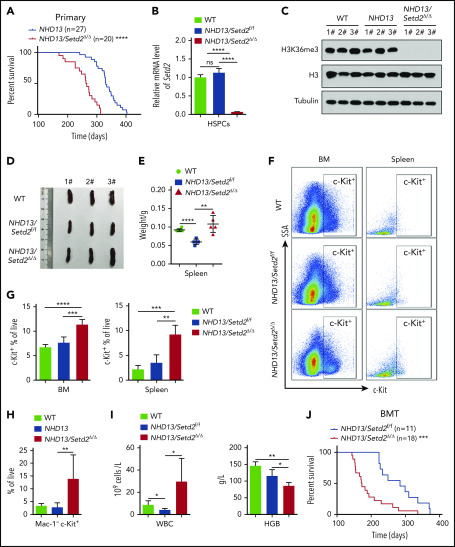
To examine whether Setd2 is crucial for MDS progression to AML, we crossed NHD13 mice with Setd2 conditional knockout mice (supplemental Figure 2A-B). The NHD13/Setd2Δ/Δ mice developed AML with a shorter median survival (267 days) than that of the NHD13 mice (333 days; P < .0001; Figure 2A; supplemental Table 1). The expression of Setd2 decreased significantly in the NHD13/Setd2Δ/Δ BM cells (Figure 2B), and H3K36me3 was abolished by Setd2 deletion (Figure 2C), whereas the H3K36me2 level was not changed (supplemental Figure 2C). The spleens of the NHD13/Setd2Δ/Δ mice were enlarged compared with those of the NHD13 and wild-type (WT) mice (Figure 2D-E). Phenotypically, all the NHD13/Setd2Δ/Δ mice had an increased percentage of c-Kit+ cells in the BM and spleen compared with the NHD13 mice (Figure 2F-G). At the leukemia stage, the percentage of Mac-1−c-Kit+ cells in the NHD13/Setd2Δ/Δ mice was higher than in the NHD13 mice (Figure 2H), which was consistent with our morphology analysis results showing that the NHD13/Setd2Δ/Δ AML cells had less myeloid differentiation (supplemental Figure 2D). The leukemic NHD13/Setd2Δ/Δ mice had enlarged spleens and livers (supplemental Figure 2E) and extensive extramedullary hematopoiesis and infiltration of myeloblasts in multiple organs (supplemental Figure 2F), as well as increased white blood cell (WBC) counts and decreased hemoglobin (HGB) levels compared with age-matched NHD13 mice (Figure 2I). Notably, analyses of the mice at relatively early, nonleukemic stages showed that the deletion of Setd2 could modify the NHD13-driven phenotypes in a short period (supplemental Figure 2G-H), indicating a direct rather than secondary effect. In addition, single-allele deletion of Setd2 could not accelerate leukemia progression in the NHD13 mice (supplemental Figure 3A), although it caused spleen and liver enlargement (supplemental Figure 3B) and a relatively high number of myeloblasts (supplemental Figure 3C-D). These observations imply that Setd2 plays a unique role in NHD13–associated, relative to MLL-fusion–associated, leukemia models.
Figure 2.
Deletion of Setd2 accelerates the transformation of MDS to AML in the NHD13 mouse model. (A) Survival curves of NHD13 (n = 27; median survival, 333 days) and NHD13/Setd2Δ/Δ (n = 20; median survival, 267 days) mice. Poly(I:C) was injected into 6- to 8-week-old Mx1-Cre/NHD13/Setd2f/f mice. (B) qPCR analysis of Setd2 expression in the BM HSPCs of the WT, NHD13, and NHD13/Setd2Δ/Δ mice. (C) Western blot analysis showing the abolishment of H3K36me3, which reflected the knockout efficiency of Setd2, in the BM cells isolated from the NHD13/Setd2Δ/Δ mice compared with the NHD13 and WT mice. (D-E) Different size and weight of the spleens of the NHD13/Setd2Δ/Δ, NHD13, and WT mice (n = 5). (F-G) Representative flow cytometry profiles (F) and quantification of the frequencies (G) of the c-Kit+ cells in the BM and spleen of the indicated mice at 4 weeks after poly(I:C) injection. (H) Frequencies of the Mac-1−c-Kit+ cells in the BM of the NHD13/Setd2Δ/Δ mice during the leukemia stage, compared with the NHD13 and WT mice. (I) Complete blood count (CBC) analysis of the WT, NHD13, and NHD13/Setd2Δ/Δ mice at 6 months after poly(I:C) injection. (J) Survival curves of the mice receiving NHD13/Setd2f/f (n = 11; median survival, 284 days) and Mx1-Cre/NHD13/Setd2f/f (n = 18; median survival, 172 days) BM cells. The mice were injected with poly(I:C) at 4 weeks after transplantation. *P < .05; **P < .01; ***P < .001; ****P < .0001.
To further study the effect of Setd2 on MDS-associated leukemia, NHD13 and NHD13/Setd2Δ/Δ BM cells were transplanted into lethally irradiated recipient mice, and Setd2 was deleted in the recipient mice at 4 weeks after transplantation by poly(I:C) injection (supplemental Figure 4A-B). Consistent with the observations in the primary mice, Setd2 deficiency accelerated the development of AML and shortened survival in the transplant-recipient mice, as well (Figure 2J). Whereas the NHD13 mice died of MDS/leukemia, with a median survival of 284 days, all the NHD13/Setd2Δ/Δ recipient mice died of AML, with a median survival of 172 days (Figure 2J). The leukemic mice receiving transplants of NHD13/Setd2Δ/Δ BM cells had significantly enlarged spleens (supplemental Figure 4C) and had more leukemia blast cells in spleen and liver in the histology analysis (supplemental Figure 4D) than did the NHD13-recipient mice.
Deletion of Setd2 expands the HSPC population and enhances HSPC self-renewal in NHD13 mice
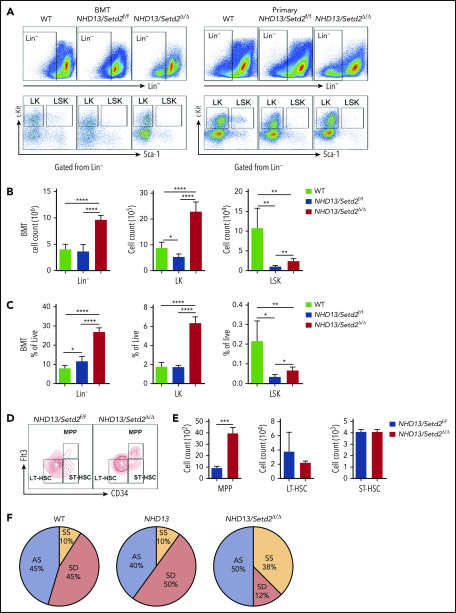
To further understand the rapid development of leukemia observed in the NHD13/Setd2Δ/Δ mice, we analyzed the BM HSPC compartment in the mice receiving NHD13 or NHD13/Setd2Δ/Δ BM cell transplants. We found that loss of Setd2 did not severely impair BM cellularity (Figure 3A; supplemental Figure 5A), but rapidly altered the BM compartment of the recipient mice with a marked expansion of the Lin−, Lin−c-Kit+Sca-1− (LK), and Lin−c-Kit+Sca-1+ (LSK) cells (Figure 3A-C).
Figure 3.
Loss of Setd2 promotes self-renewal of HSCs in the NHD13 mouse model. (A) Representative flow cytometry profiles of the Lin−, LK, and LSK cells in the BM of the transplant-recipient mice (left) and the primary BM cells (right) of the NHD13/Setd2f/f or Mx1-Cre/NHD13/Setd2f/f mice at 4 weeks after poly(I:C) injection. (B-C) Quantification of the numbers (B) and frequencies (C) of the Lin−, LK, and LSK cells in the BM of the transplant-recipient mice. (D-E) Representative flow cytometry profiles (D) and quantification of the frequencies (E) of the MPPs, LT-HSCs, and ST-HSCs of the NHD13/Setd2f/f and NHD13/Setd2Δ/Δ mice at 4 weeks after poly(I:C) injection. (F) The paired daughter cell assay analysis of the LSK cells isolated from BM of the NHD13/Setd2f/f or NHD13/Setd2Δ/Δ mice at 4 weeks after poly(I:C) injection. *P < .05; **P < .01; ***P < .001; ****P < .0001. AS, asymmetric self-renewal division; SD, symmetric commitment division; SS, symmetric self-renewal division.
To avoid the potential effect of BM ablation caused by irradiation, we analyzed the HSPCs of the primary mice at pre-MDS stage (2 months of age). The results showed that the Lin− and LK cell populations were significantly expanded in the NHD13/Setd2Δ/Δ mice compared with those in the WT and NHD13 mice (Figure 3A; supplemental Figure 5B-C), whereas the LSK cells seemed not to be dramatically affected (supplemental Figure 5B-C). However, a more detailed analysis by separating the LSK cells into multipotential progenitors (MPPs), long-term HSCs (LT-HSCs), and short-term HSCs (ST-HSCs), based on their Flt3 and CD34 expression levels, showed that the deletion of Setd2 increased MPPs, but not LT-HSCs or ST-HSCs, in the NHD13 mice (Figure 3D-E). This expansion of HSPCs by Setd2 deficiency in the NHD13 mice was in sharp contrast to the previous observations that Setd2 knockout in normal mice decreased HSPCs, including MPP and LSK cells,17,18 thus suggesting differential regulation of MDS/AML and normal hematopoiesis by Setd2.
To investigate whether the expansion of the NHD13/Setd2Δ/Δ HSPCs was related to enhanced self-renewal, we used the sorted LSK cells to perform the paired daughter cell assay, which could quantify different types of symmetric and asymmetric cell divisions of individual cells by determining combinations of differentiation potentials of their daughter cells.28 The results showed that the symmetric self-renewal division frequency of the NHD13/Setd2Δ/Δ LSK cells (38%) was much higher than that of the NHD13 (10%) and WT (10%) LSK cells, whereas the symmetric commitment divisions were dominant in the NHD13 LSK cells (50%) compared with the NHD13/Setd2Δ/Δ (12%) LSK cells (Figure 3F). Thus, our results suggest an important role of Setd2 in regulating the balance between the stem cell–depleting divisions and the symmetric stem cell self-renewing divisions in the NHD13 mouse model.
Loss of Setd2 impairs myeloid differentiation and dysregulates the cell cycle in NHD13 mice
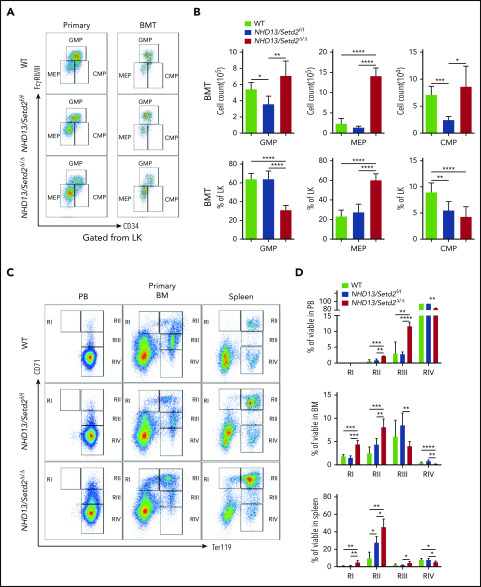
We further analyzed the multipotent hematopoietic progenitors, including megakaryocyte erythroid progenitors (MEPs), granulocyte and monocyte progenitors (GMPs), and common myeloid progenitors (CMPs), in the BM of the primary mice and those receiving WT, NHD13, and NHD13/Setd2Δ/Δ BM cell transplants. We found that the MEPs were most dramatically increased in both the primary mice and NHD13/Setd2Δ/Δ BM-recipient mice compared with the counterpart NHD13-recipient mice (Figure 4A-B; supplemental Figure 5B-C). The effects of Setd2 deletion on the frequencies and number of GMPs and CMPs were relatively marginal or variable (Figure 4A-B; supplemental Figure 5B-C). Thus, these results suggest that the loss of Setd2 affects erythroid and megakaryocyte differentiation to a greater degree than it affects granulocyte and monocyte differentiation.
Figure 4.
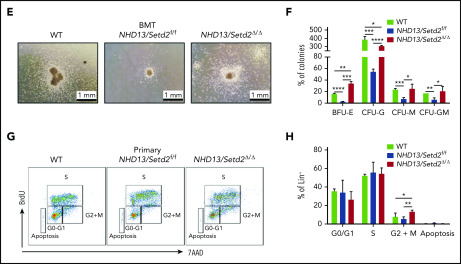
Deletion of Setd2 affects the myeloid differentiation and cell cycle in the NHD13 mouse model. (A-B) Representative flow cytometry profiles (A) and quantification of the cells counts and frequencies (B) of the GMP, MEP, and CMP cells of the mice receiving NHD13/Setd2f/f or Mx1-Cre/NHD13/Setd2f/f BM cells. (C-D) Representative flow cytometry profiles (C) and quantification of the frequencies (D) of the PB, BM, and spleen cells of the WT, NHD13/Setd2f/f, and NHD13/Setd2Δ/Δ mice at the indicated erythroid differentiation stages (RI, proerythroblasts; RII, basophilic erythroblasts; RII, chromatophilic erythroblasts; RIV, orthochromatophilic erythroblasts). (E) CFU assays analyzing the HSPCs isolated from the mice receiving NHD13/Setd2f/f or Mx1-Cre/NHD13/Setd2f/f BM cells. The representative images of CFUs are shown. Cells (3 × 10³) were plated for each assay. (F) Quantification of the number of colonies of burst-forming unit-erythroid (BFU-E), colony-forming unit-granulocyte (CFU-G), colony-forming unit-macrophage (CFU-M), and colony-forming unit-granulocyte, macrophage (CFU-GM) cells. (G) Representative flow cytometry results of the BrdU incorporation assay and (H) quantification of the frequencies of the BM Lin− cells of the NHD13/Setd2f/f or NHD13/Setd2Δ/Δ mice at the indicated cell cycle stages. The cells were collected at 4 weeks after poly(I:C) injection. *P < .05; **P < .01; ***P < .001; ****P < .0001.
To investigate the role of Setd2 in terminal differentiation of the NHD13-expressing cells, we examined erythroid differentiation in the peripheral blood (PB), BM, and spleen of the primary WT, NHD13, and NHD13/Setd2Δ/Δ mice. Flow cytometry analysis of cells double stained with Ter119 and CD71 was used to distinguish different erythroid developmental stages including proerythroblasts, basophilic erythroblasts, chromatophilic erythroblasts, and orthochromatophilic erythroblasts.29,30 We observed altered erythroid differentiation stages with increased frequencies of the immature erythroid cells in the PB, BM, and spleen of the NHD13/Setd2Δ/Δ mice, compared with the WT and NHD13 mice (Figure 4C-D). These results suggest that the deletion of Setd2 inhibits erythroid differentiation of the NHD13-expressing cells, which could accelerate the progression of MDS to leukemia.
To further understand the basis of the expansion and differentiation impairment of the NHD13/Setd2Δ/Δ HSPCs, we performed a CFU assay, using HSPCs isolated from the transplant-recipient NHD13 and NHD13/Setd2Δ/Δ mice. We found that, whereas the NHD13 HSPCs formed very few colonies, the NHD13/Setd2Δ/Δ HSPCs showed enhanced self-renewal and gave rise to an increased number of erythroid colonies (BFU-E; Figure 4E-F). These results suggest that the improved HSPC expansion and the anemia in the NHD13/Setd2Δ/Δ mice were caused by elevated self-renewal and defects in producing erythroid progenitors. Next, we analyzed the cell cycle status of the NHD13 and NHD13/Setd2Δ/Δ HSPCs and found that loss of Setd2 increased the percentage of cells in the G2/M phase and reduced cell death (Figure 4G-H; supplemental Figure 5D-E). Altogether, these results suggest that loss of Setd2 accumulates more activated HSPCs and maintains a more aggressive myeloid malignancy.
Loss of Setd2 promotes maintenance of MDS-derived leukemia
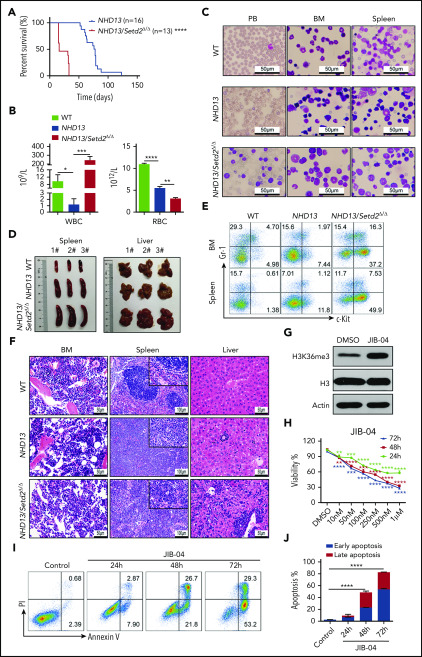
To examine the effect of Setd2 deficiency on the maintenance of NHD13-driven AML, we performed secondary BM transplantation by transplanting the NHD13-expressing WT or Setd2Δ/Δ BM cells collected from the primary leukemic mice into sublethally irradiated recipient mice. We found that, although these leukemias were all transplantable, the secondarily transplanted NHD13/Setd2Δ/Δ group had a significantly shorter survival, with higher WBC and lower red blood cell counts, compared with the NHD13 group (Figure 5A-B). The spleens and livers of the NHD13/Setd2Δ/Δ leukemic mice were significantly enlarged and massively infiltrated with myeloblasts (Figure 5C-D; supplemental Figure 6A). Flow cytometry analysis showed more c-Kit+Gr1+ and c-Kit+Mac1+ cells in the BM and spleen compared with counts in the NHD13 or WT mice (Figure 5E; supplemental Figure 6B-D). We also observed more leukemic blasts in the BM and spleen of the NHD13/setd2Δ/Δ mice (Figure 5C-F). Thus, loss of Setd2 significantly promoted aggressiveness of NHD13-driven AML, which suggests that Setd2 deficiency accelerates not only the transformation of MDS to AML, but also the progression of leukemia.
Figure 5.
Setd2 deficiency accelerates leukemia progression in secondary transplantation and JIB-04 regulates proliferation and apoptosis of SKM-1 cells. (A) Survival curves of the mice that underwent secondary BM transplantation from the NHD13 (n = 16; median survival, 77 days) or NHD13/Setd2Δ/Δ (n = 13; median survival, 16 days) leukemic mice. (B) Complete blood count (CBC) analysis of NHD13 and NHD13/Setd2Δ/Δ leukemic BM in the WT and secondary transplant-recipient mice. CBCs were obtained 16 days after transplantation. RBC, red blood cell. (C) Wright’s staining of PB, BM, and spleen cells isolated from mice receiving the NHD13 and NHD13/Setd2Δ/Δ leukemic BM for 16 days. (D) Images of the spleens and livers isolated from the mice receiving NHD13 or NHD13/Setd2Δ/Δ leukemic BM for 16 days. (E) Representative flow cytometry profiles of Gr-1 and c-Kit expression of the BM and spleen cells of the mice receiving NHD13 or NHD13/Setd2Δ/Δ leukemic BM for 16 days. (F) Hematoxylin and eosin staining of the BM, spleen, and liver of the mice receiving NHD13 or NHD13/Setd2Δ/Δ leukemic BM for 16 days. (G) Western blot analysis of H3K36me3 in the JIB-04 (1 μM) or dimethyl sulfoxide–treated SKM-1 cells. (H) MTT analysis of the JIB-04 (1 μM) or dimethyl sulfoxide–treated SKM-1 cells. (I-J) Representative flow cytometry analysis (I) and quantification of the frequencies (J) of the apoptotic SKM-1 cells. *P < .05; **P < .01; ***P < .001; ****P < .0001.
In considering that the decreased in H3K36me3 may contribute to leukemia maintenance, we tested a Jumonji histone demethylases inhibitor, JIB-04,31 to treat the SKM-1 cell line, which was derived from human MDS-associated leukemia.32 Western blot analysis showed that the JIB-04 treatment indeed increased H3K36me3 in the SKM-1 cells (Figure 5G). We treated the SKM-1 cells with different doses of JIB-04, and the results showed that JIB-04 significantly inhibited the growth of the SKM-1 cells in a dose-dependent manner (Figure 5H). Flow cytometry analysis showed that the JIB-04 treatment resulted in an increase in apoptosis of the SKM-1 cells (Figure 5I-J). Furthermore, we also used JIB-04 to treat the leukemia cells from the NHD13 and NHD13/Setd2Δ/Δ mice, and the results showed that NHD13/Setd2Δ/Δ cells were less sensitive to JIB-04 treatment than were the NHD13 cells (supplemental Figure 6E-F), probably because of the inability of the NHD13/Setd2Δ/Δ cells to increase H3K36me3. These results suggest that increasing H3K36me3 may be a strategy or an effective indicator in the treatment of MDS-associated leukemia.
RNA-seq and whole-genome bisulfate sequencing analysis reveal a unique gene signature in Setd2-deleted NHD13 HSPCs
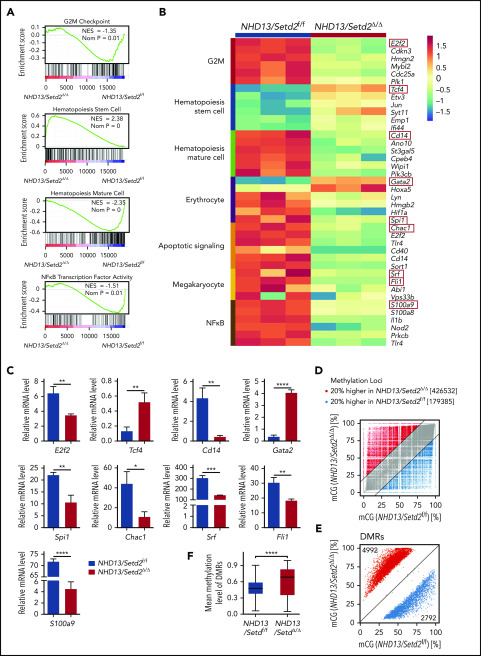
To understand how Setd2 deficiency promotes the transformation from MDS to leukemia, we performed comparative RNA-seq analysis of HSPCs from the NHD13 and NHD13/setd2Δ/Δ primary mice. Notably, a comparison with the previously reported data of Setd2 knockout in WT HSPCs17 showed that the majority (97.6%) of altered genes by Setd2 deletion in the NHD13 HSPCs were different from those in the WT, suggesting a context dependency of the Setd2 target genes (supplemental Figure 7A-B). Gene Set Enrichment Analysis revealed that at the G2/M checkpoint, NF-κB and hematopoiesis mature gene sets were depleted of NHD13/Setd2Δ/Δ HSPCs, whereas the HSC gene sets were enriched (Figure 6A), consistent with the phenotypic differences between the AML and MDS stages. Some genes that were dysregulated in the NHD13/Setd2Δ/Δ HSPCs (eg, S100a9, E2f2, Tcf4, Cd14, Chac1, Spi1, Gata2, Fli1, and Srf) have been shown to play important roles in regulating these pathways (Figure 6B). The altered expression of these genes was validated by qPCR (Figure 6C). Thus, these results further support and provide possible mechanistic explanations for the enhanced self-renewal, impaired differentiation, and cell cycle abnormalities of NHD13/Setd2Δ/Δ HSPCs.
Figure 6.
Gene expression profiling and whole genome methylation analysis of the Setd2-deleted NHD13 HSPCs. (A) RNA-seq and Gene Set Enrichment Analysis of the BM HSPCs of the WT, NHD13/Setd2f/f, and NHD13/Setd2Δ/Δ mice at 4 weeks after poly(I:C) injection. (B) Gene expression profiles revealing the differentially expressed genes in the pathways regulating the G2M checkpoint, HSC maintenance and differentiation, erythrocytes, megakaryocytes, apoptosis, and NF-κB targets. (C) qPCR analysis of representative genes of interest, which are labeled with red boxes in panel B. (D) Comparison of relative methylation differences between the BM HSPCs of the NHD13/Setd2f/f and NHD13/Setd2Δ/Δ mice at 4 weeks after poly(I:C) injection. Each dot represents a methylation locus that was detected >10 times. (E) Number of hypomethylated (2792) and hypermethylated (4992) DMRs. Each dot represents a DMR. (F) Comparison of average methylation levels of all DMRs between the NHD13/Setd2f/f and NHD13/Setd2Δ/Δ BM HSPCs. *P < .05; **P < .01; ***P < .001; ****P < .0001.
It has been reported that H3K36me3 can be recognized by Dnmt3a/b, suggesting that Setd2 could be functionally connected with Dnmt3a/b-mediated DNA methylation.33-35 Thus, we examined the change in DNA methylation by Setd2 deletion in the NHD13 mice. We performed whole-genome bisulfate sequencing (WGBS) analysis of the NHD13 and NHD13/Setd2Δ/Δ LSK cells, and we found that the NHD13/Setd2Δ/Δ cells had more hypermethylated loci than the NHD13 cells (2.4-fold; Figure 6D) and that their differentially methylated regions (DMRs) were also more enriched in the hypermethylated loci (1.8-fold; Figure 6E; supplemental Figure 7C). The mean methylation level of the DMRs was also significantly higher in the NHD13/Setd2Δ/Δ than the NHD13 cells (Figure 6F). Moreover, the DNA methylation profiling showed that the NHD13/Setd2Δ/Δ genome had decreased CpG methylation levels in the gene body regions but increased levels in the intergenic regions (supplemental Figure 7D-F), which may explain its overall hypermethylation state. Pathway analysis of the MDR-associated genes showed considerable overlaps with the gene expression profiles (supplemental Figure 7G-H). These results demonstrate the altered DNA methylation pattern that may be important for Setd2-regulated gene expression and the NHD13-expressing HSPC functions.
S100a9, a target gene of Setd2, rescues the phenotype of Setd2 deficiency in NHD13 HSPCs
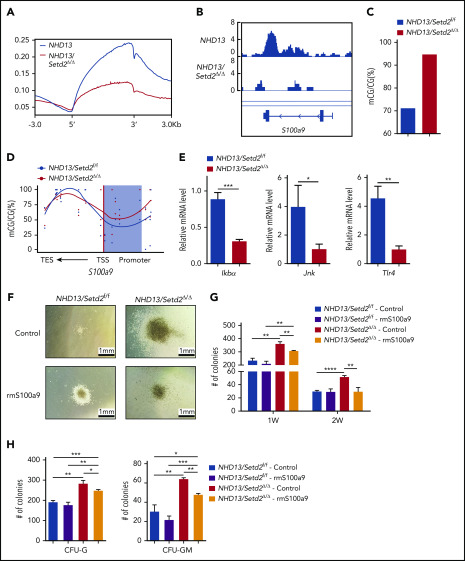
To identify functionally important Setd2 target genes and to understand the regulatory mechanism, we performed ChIP-seq analysis of the c-Kit+ cells of the NHD13 and NHD13/Setd2Δ/Δ mice with an anti-H3K36me3 antibody. A significant decrease in H3K36me3 on the gene body regions of active genes was detected in the NHD13/Setd2Δ/Δ cells compared with levels in the NHD13 controls (Figure 7A; supplemental Figure 8A-C). Given the important role of the cross talk between H3K36me3 and DNA methylation in leukemogenesis, we also surveyed the dysregulated genes that associate with the DMRs. We found that S100a9, which encodes a calcium-binding protein, was significantly downregulated by Setd2 deletion in the NHD13 mice (Figure 6B-C; supplemental Figure 8D-E), accompanied by a decreased H3K36me3 level (Figure 7B). Meanwhile, S100a9 fell into the category of genes with DMR-associated expression (Figure 7C-D). qPCR analysis of human MDS BM samples also showed a relatively lower expression of S100A9 compared with samples from healthy subjects (supplemental Figure 8F). Overexpression of SETD2 in SKM-1 cells upregulated S100A9 and S100A8 (supplemental Figure 8G) and decreased colony formation by the cells (supplemental Figure 8H-I). Thus, we identified S100a9 as a target gene of Setd2 based on RNA-seq, ChIP-seq, and whole-genome bisulfate sequencing (WGBS) analyses.
Figure 7.
S100a9 is directly regulated by Setd2, and restoration of S100a9 abrogates the effect of Setd2 deficiency on the NHD13 HSPCs. (A) A profile of H3K36me3 across the gene body and the upstream (5′) and downstream (3′) regions. ChIP-seq analyses were performed with spleen c-Kit+ cells isolated from the NHD13 and NHD13/Setd2Δ/Δ mice at leukemia stage. (B) A decrease occurred in H3K36me3 in the S100a9 gene locus of the NHD13/Setd2Δ/Δ cells relative to that in the NHD13 cells. (C-D) Different DNA methylation in the S100a9 promoter (C) and a profile of DNA methylation across the S100a9 gene locus (D) in the NHD13 and NHD13/Setd2Δ/Δ cells. TSS, transcription start sites; TES, transcription end sites; the shading denotes the promoter region. (E) qPCR analysis of Ikba, Jnk, and Tlr4 in the NHD13 and NHD13/Setd2Δ/Δ cells. (F) Micrographs of representative colonies in the CFU assays with the NHD13 and NHD13/Setd2Δ/Δ HSPCs. Cells (3 × 10³) were plated for each assay. Recombinant mouse S100a9 protein (rmS100a9) was added at a final concentration of 4 μg/mL. (G-H) The number of indicated colonies in the CFU assays. CFU-G and CFU-GM were counted 1 week after plating. *P < .05; **P < .01; ***P < .001; ****P < .0001.
S100a9 has been reported to trigger cell death of HSPCs, including MEPs, and to contribute to ineffective hematopoiesis in MDS.36-38 S100A9 has also been identified as a differentiation inducer in AML.39 Mechanistically, it has been shown that the activation of the JNK and NF-κB signaling pathways is essential in S100A9-induced AML differentiation through Toll-like receptor 4 in leukemia cells.39 We indeed found that the expression of Tlr4 and the Jnk/NF-κB pathway–related genes, such as Jnk and Ikba, was decreased in the NHD13/Setd2Δ/Δ HSPCs (Figure 7E), which is consistent with the Kyoto Encyclopedia of Genes and Genome analysis showing the MAPK signaling pathway to be significantly regulated by Setd2 in NHD13 HSPCs (supplemental Figure 7G). To understand the role of S100a9 in NHD13/Setd2Δ/Δ HSPCs, we performed a CFU assay using sorted HSPCs that were treated with 4 μg/mL recombinant mouse S100a9 protein (rmS100a9). We found that the rmS100a9 treatment reduced the promoted expansion of the NHD13/Setd2Δ/Δ HSPCs, including the capacity of generating various types of colonies (Figure 7F-H). Conversely, knockdown of S100a9 accelerated the progression of AML in the NHD13 mice (supplemental Figure 8G-I). Last, S100A9 could be upregulated in SKM-1 cells by treatment with JIB-04, especially when SETD2 was suppressed by shRNA-mediated knockdown (supplemental Figure 8M-N). Thus, the mimicking and rescue of the phenotypes of Setd2 deficiency in the MDS-associated HSPCs by manipulation of S100a9 suggests that S100a9 downregulation contributes to the increased self-renewal and defective myeloid differentiation in the NHD13/Setd2Δ/Δ mice.
Discussion
In this study, low expression of SETD2 predicted a poor outcome in MDS and identified a previously unrecognized function of Setd2 in an NHD13-driven MDS mouse model: controlling the progression of MDS to leukemia. Deletion of Setd2 significantly accelerated development of AML, indicating that Setd2 acts as an important tumor suppressor in the transformation of NHD13-driven MDS to AML. Mechanistically, loss of Setd2 enhanced self-renewal and impaired myeloid differentiation in the NHD13-expressing HSPCs. Early progression of MDS to AML in Setd2-deleted NHD13 mice was also associated with abnormal erythroid differentiation and reduced cell death. Symmetric self-renewal division was increased by Setd2 deletion in the NHD13-expressing HSCs, which may also account for the higher risk for the development of leukemia in the NHD13/Setd2Δ/Δ mice.40 The NHD13/Setd2Δ/Δ mice developed less differentiated AML, which may reflect differentiation blocking in the early stage and enhanced self-renewal of leukemia-initiating cells, induced by Setd2 deletion.
When MDS progressed to AML, there was increased cell survival and decreased cell death. Loss of Setd2 triggered a unique gene signature in the NHD13-expressing HSPCs at both the MDS and AML stages, including upregulation of the HSC pathway and downregulation of the myeloid cell differentiation pathway. It appears that elevated MAPK signaling induced by Setd2 deletion in the NHD13 BM cells confers a growth advantage to the preleukemic blasts. We identified S100a9 as a target gene of Setd2 in the NHD13 leukemic cells. S100A9 and S100A8 have been implicated in the pathology of RPS14-associated MDS and regulation of myeloid and erythroid differentiation,39,41 and, in particular, S100A9 can induce AML differentiation, whereas S100A8 inhibits differentiation induced by S100A9.39 In the NHD13 MDS model, S100a9 acts to prevent the transformation to AML. Although S100a9 and S100a8 are highly homologous, these 2 proteins may have opposite functions in NHD13-mediated leukemogenesis.
We observed different effects of Setd2 deletion in the HSPCs of MDS/AML relative to that of normal hematopoiesis. Setd2 exerts cellular context–specific effects in HSPCs, as the decrease in LSK and MPP cells was found in the Setd2Δ/Δ mice, but not in the NHD13/Setd2Δ/Δ mice. The NHD13/Setd2Δ/Δ mice had an increased WBC count and decreased HGB, but the Setd2Δ/Δ mice had a decreased WBC count and normal HGB. Intriguingly, the Setd2-regulated genes including S100a9 are significantly different in the NHD13 and WT cells, which may cause the genetic background–specific effects of Setd2. Thus, our experiments showed that Setd2 deletion–induced transformation differs in WT and NHD13 HSPCs.
Altogether, our results suggest that deficiency in Setd2 function promotes the progression of MDS to AML. Moreover, the low expression of SETD2 correlates strongly with the survival of patients with MDS. Our findings indicate that promoting SETD2 function or activating downstream effects of SETD2 may be helpful in elimination of MDS-associated leukemia.
Supplementary Material
The online version of this article contains a data supplement.
Acknowledgments
The authors thank Dangsheng Li for critical reading and helpful comments on the manuscript and Y. Zhai, X. Miao, S. Yan, Y. Chen, K. Wang, and Y. Wang (Shanghai Institute of Nutrition and Health core facilities) for technical support.
This work was supported by National Key Research and Development Plan of China grants 2018YFA0107200, 2018YFA0800203 (L.W.), and 2018YFA0107802 (X.-J.S.); National Natural Science Foundation of China (NSFC) General Program grants 81670122, 81970150 (L.W.), and 81670094 (X.-J.S.); NSFC Excellent Young Scholar Program grant 81622003 (L.W.); CAS Bureau of Major R&D Program grant XDA12020376 (L.W.); the CAS Bureau of Frontier Sciences and Education Program grant QYZDBSSWSMC027 (L.W.); Shanghai Municipal Education Commission-Gaofeng Clinical Medicine grant 20152506 (X.-J.S.); Shanghai Collaborative Innovation Program on Regenerative Medicine and Stem Cell Research 2019CXJQ01 (S.-J.C., X.-J.S.); Innovative Research Team of High-Level Local Universities in Shanghai (X.-J.S.); Shanghai Guangci Translational Medical Research Development Foundation; and the Samuel Waxman Cancer Research Foundation.
Footnotes
The RNA-seq, ChIP-seq, and WGBS data reported in this article were deposited in the Gene Expression Omnibus database (accession number GSE129691).
The publication costs of this article were defrayed in part by page charge payment. Therefore, and solely to indicate this fact, this article is hereby marked “advertisement” in accordance with 18 USC section 1734.
Authorship
Contribution: L.W., X.-J.S., and B.-Y.C. designed the research, analyzed the data, and wrote the paper; B.-Y.C., J.S., C.-L.H., S.-B.C., Q.Z., J.-C.W., D.H., M.S., N.L., P.-C.Y., P.L., J.-Y.Z., and R.-F.D. performed the research; and S.-J.C., Z.C., S.D.N., Q.Z., C.-H.X. Y.-L.Z., S.-J.Z., F.L., L.-J.Z., and Q.-H.H. analyzed the data and contributed new tools.
Conflict-of-interest disclosure: The authors declare no competing financial interests.
Correspondence: Lan Wang, Shanghai Institute of Nutrition and Health, Shanghai Institutes for Biological Sciences, Chinese Academy of Sciences, Shanghai 200031, China; e-mail: lwang@sibs.ac.cn; and Xiao-Jian Sun, Shanghai Institute of Hematology, Ruijin Hospital, Shanghai Jiao Tong University School of Medicine, Shanghai 200025, China; e-mail: xjsun@sibs.ac.cn.
REFERENCES
- 1.Sperling AS, Gibson CJ, Ebert BL. The genetics of myelodysplastic syndrome: from clonal haematopoiesis to secondary leukaemia. Nat Rev Cancer. 2017;17(1):5-19. [DOI] [PMC free article] [PubMed] [Google Scholar]
- 2.Corey SJ, Minden MD, Barber DL, Kantarjian H, Wang JC, Schimmer AD. Myelodysplastic syndromes: the complexity of stem-cell diseases. Nat Rev Cancer. 2007;7(2):118-129. [DOI] [PubMed] [Google Scholar]
- 3.Lin YW, Slape C, Zhang Z, Aplan PD. NUP98-HOXD13 transgenic mice develop a highly penetrant, severe myelodysplastic syndrome that progresses to acute leukemia. Blood. 2005;106(1):287-295. [DOI] [PMC free article] [PubMed] [Google Scholar]
- 4.Xu H, Menendez S, Schlegelberger B, et al. . Loss of p53 accelerates the complications of myelodysplastic syndrome in a NUP98-HOXD13-driven mouse model. Blood. 2012;120(15):3089-3097. [DOI] [PMC free article] [PubMed] [Google Scholar]
- 5.Abdel-Wahab O, Adli M, LaFave LM, et al. . ASXL1 mutations promote myeloid transformation through loss of PRC2-mediated gene repression. Cancer Cell. 2012;22(2):180-193. [DOI] [PMC free article] [PubMed] [Google Scholar]
- 6.Haferlach T, Nagata Y, Grossmann V, et al. . Landscape of genetic lesions in 944 patients with myelodysplastic syndromes. Leukemia. 2014;28(2):241-247. [DOI] [PMC free article] [PubMed] [Google Scholar]
- 7.Sashida G, Harada H, Matsui H, et al. . Ezh2 loss promotes development of myelodysplastic syndrome but attenuates its predisposition to leukaemic transformation. Nat Commun. 2014;5(1):4177. [DOI] [PubMed] [Google Scholar]
- 8.Xu L, Gu ZH, Li Y, et al. . Genomic landscape of CD34+ hematopoietic cells in myelodysplastic syndrome and gene mutation profiles as prognostic markers. Proc Natl Acad Sci USA. 2014;111(23):8589-8594. [DOI] [PMC free article] [PubMed] [Google Scholar]
- 9.Cao Q, Gearhart MD, Gery S, et al. . BCOR regulates myeloid cell proliferation and differentiation. Leukemia. 2016;30(5):1155-1165. [DOI] [PMC free article] [PubMed] [Google Scholar]
- 10.Maegawa S, Gough SM, Watanabe-Okochi N, et al. . Age-related epigenetic drift in the pathogenesis of MDS and AML. Genome Res. 2014;24(4):580-591. [DOI] [PMC free article] [PubMed] [Google Scholar]
- 11.Bejar R, Stevenson K, Abdel-Wahab O, et al. . Clinical effect of point mutations in myelodysplastic syndromes. N Engl J Med. 2011;364(26):2496-2506. [DOI] [PMC free article] [PubMed] [Google Scholar]
- 12.Cheng G, Liu F, Asai T, et al. . Loss of p300 accelerates MDS-associated leukemogenesis. Leukemia. 2017;31(6):1382-1390. [DOI] [PMC free article] [PubMed] [Google Scholar]
- 13.Santini V. How I treat MDS after hypomethylating agent failure. Blood. 2019;133(6):521-529. [DOI] [PubMed] [Google Scholar]
- 14.Sun XJ, Wei J, Wu XY, et al. . Identification and characterization of a novel human histone H3 lysine 36-specific methyltransferase. J Biol Chem. 2005;280(42):35261-35271. [DOI] [PubMed] [Google Scholar]
- 15.Hu M, Sun XJ, Zhang YL, et al. . Histone H3 lysine 36 methyltransferase Hypb/Setd2 is required for embryonic vascular remodeling. Proc Natl Acad Sci USA. 2010;107(7):2956-2961. [DOI] [PMC free article] [PubMed] [Google Scholar]
- 16.Licht JD. SETD2: a complex role in blood malignancy. Blood. 2017;130(24):2576-2578. [DOI] [PMC free article] [PubMed] [Google Scholar]
- 17.Zhang YL, Sun JW, Xie YY, et al. . Setd2 deficiency impairs hematopoietic stem cell self-renewal and causes malignant transformation. Cell Res. 2018;28(4):476-490. [DOI] [PMC free article] [PubMed] [Google Scholar]
- 18.Zhou Y, Yan X, Feng X, et al. . Setd2 regulates quiescence and differentiation of adult hematopoietic stem cells by restricting RNA polymerase II elongation. Haematologica. 2018;103(7):1110-1123. [DOI] [PMC free article] [PubMed] [Google Scholar]
- 19.Patnaik MM, Abdel-Wahab O. SETD2: linking stem cell survival and transformation. Cell Res. 2018;28(4):393-394. [DOI] [PMC free article] [PubMed] [Google Scholar]
- 20.Zhu X, He F, Zeng H, et al. . Identification of functional cooperative mutations of SETD2 in human acute leukemia. Nat Genet. 2014;46(3):287-293. [DOI] [PMC free article] [PubMed] [Google Scholar]
- 21.Mar BG, Bullinger LB, McLean KM, et al. . Mutations in epigenetic regulators including SETD2 are gained during relapse in paediatric acute lymphoblastic leukaemia. Nat Commun. 2014;5(1):3469. [DOI] [PMC free article] [PubMed] [Google Scholar]
- 22.Wang S, Yuan X, Liu Y, et al. . Genetic polymorphisms of histone methyltransferase SETD2 predicts prognosis and chemotherapy response in Chinese acute myeloid leukemia patients. J Transl Med. 2019;17(1):101. [DOI] [PMC free article] [PubMed] [Google Scholar]
- 23.Mar BG, Chu SH, Kahn JD, et al. . SETD2 alterations impair DNA damage recognition and lead to resistance to chemotherapy in leukemia. Blood. 2017;130(24):2631-2641. [DOI] [PMC free article] [PubMed] [Google Scholar]
- 24.Dong Y, Zhao X, Feng X, et al. . SETD2 mutations confer chemoresistance in acute myeloid leukemia partly through altered cell cycle checkpoints. Leukemia. 2019;33(11):2585-2598. [DOI] [PMC free article] [PubMed] [Google Scholar]
- 25.Skucha A, Ebner J, Schmöllerl J, et al. . MLL-fusion-driven leukemia requires SETD2 to safeguard genomic integrity. Nat Commun. 2018;9(1):1983. [DOI] [PMC free article] [PubMed] [Google Scholar]
- 26.Watatani Y, Nagata Y, Grossmann V, et al. . Two Novel Distinct Subtypes of Myeloid Neoplasms Molecularly Associated with Histone H3K36 Methylations [abstract]. Blood. 2015;126(23). Abstract 2841. [Google Scholar]
- 27.Pellagatti A, Cazzola M, Giagounidis A, et al. . Deregulated gene expression pathways in myelodysplastic syndrome hematopoietic stem cells. Leukemia. 2010;24(4):756-764. [DOI] [PubMed] [Google Scholar]
- 28.Takano H, Ema H, Sudo K, Nakauchi H. Asymmetric division and lineage commitment at the level of hematopoietic stem cells: inference from differentiation in daughter cell and granddaughter cell pairs. J Exp Med. 2004;199(3):295-302. [DOI] [PMC free article] [PubMed] [Google Scholar]
- 29.Socolovsky M, Nam H, Fleming MD, Haase VH, Brugnara C, Lodish HF. Ineffective erythropoiesis in Stat5a(-/-)5b(-/-) mice due to decreased survival of early erythroblasts. Blood. 2001;98(12):3261-3273. [DOI] [PubMed] [Google Scholar]
- 30.Mortensen M, Ferguson DJ, Edelmann M, et al. . Loss of autophagy in erythroid cells leads to defective removal of mitochondria and severe anemia in vivo. Proc Natl Acad Sci USA. 2010;107(2):832-837. [DOI] [PMC free article] [PubMed] [Google Scholar]
- 31.Wang L, Chang J, Varghese D, et al. . A small molecule modulates Jumonji histone demethylase activity and selectively inhibits cancer growth [published correction appears in Nat Commun. 2013;4:2639]. Nat Commun. 2013;4(1):2035. [DOI] [PMC free article] [PubMed] [Google Scholar]
- 32.Nakagawa T, Matozaki S, Murayama T, et al. . Establishment of a leukaemic cell line from a patient with acquisition of chromosomal abnormalities during disease progression in myelodysplastic syndrome. Br J Haematol. 1993;85(3):469-476. [DOI] [PubMed] [Google Scholar]
- 33.Dhayalan A, Rajavelu A, Rathert P, et al. . The Dnmt3a PWWP domain reads histone 3 lysine 36 trimethylation and guides DNA methylation. J Biol Chem. 2010;285(34):26114-26120. [DOI] [PMC free article] [PubMed] [Google Scholar]
- 34.Baubec T, Colombo DF, Wirbelauer C, et al. . Genomic profiling of DNA methyltransferases reveals a role for DNMT3B in genic methylation. Nature. 2015;520(7546):243-247. [DOI] [PubMed] [Google Scholar]
- 35.Neri F, Rapelli S, Krepelova A, et al. . Intragenic DNA methylation prevents spurious transcription initiation. Nature. 2017;543(7643):72-77. [DOI] [PubMed] [Google Scholar]
- 36.Chen X, Eksioglu EA, Zhou J, et al. . Induction of myelodysplasia by myeloid-derived suppressor cells. J Clin Invest. 2013;123(11):4595-4611. [DOI] [PMC free article] [PubMed] [Google Scholar]
- 37.Basiorka AA, McGraw KL, Eksioglu EA, et al. . The NLRP3 inflammasome functions as a driver of the myelodysplastic syndrome phenotype. Blood. 2016;128(25):2960-2975. [DOI] [PMC free article] [PubMed] [Google Scholar]
- 38.Cheng P, Eksioglu EA, Chen X, et al. . S100A9-induced overexpression of PD-1/PD-L1 contributes to ineffective hematopoiesis in myelodysplastic syndromes. Leukemia. 2019;33(8):2034-2046. [DOI] [PMC free article] [PubMed] [Google Scholar]
- 39.Laouedj M, Tardif MR, Gil L, et al. . S100A9 induces differentiation of acute myeloid leukemia cells through TLR4. Blood. 2017;129(14):1980-1990. [DOI] [PubMed] [Google Scholar]
- 40.Wu M, Kwon HY, Rattis F, et al. . Imaging hematopoietic precursor division in real time. Cell Stem Cell. 2007;1(5):541-554. [DOI] [PMC free article] [PubMed] [Google Scholar]
- 41.Schneider RK, Schenone M, Ferreira MV, et al. . Rps14 haploinsufficiency causes a block in erythroid differentiation mediated by S100A8 and S100A9. Nat Med. 2016;22(3):288-297. [DOI] [PMC free article] [PubMed] [Google Scholar]
Associated Data
This section collects any data citations, data availability statements, or supplementary materials included in this article.


