

Abstract
The Sustainable Development Goals (SDGs) 6.1 and 6.2 measure the progress of urban and rural populations in their access to different levels of water, sanitation and hygiene (WASH) services, based on multiple sources of information. Service levels add up to 100%; therefore, they are compositional data (CoDa). Despite evidence of zero value, missing data and outliers in the sources of information, the treatment of these irregularities with different statistical techniques has not yet been analyzed for CoDa in the WASH sector. Thus, the results may present biased estimates, and the decisions based on these results will not necessarily be appropriate. In this article, we therefore: i) evaluate methodological imputation alternatives that address the problem of having either zero values or missing values, or both simultaneously; and ii) propose the need to complement the point-to-point identification of the WHO/UNICEF Joint Monitoring Program (JMP) with other robust alternatives, to deal with outliers depending on the number of data points. These suggestions have been considered here using statistics for CoDa with isometric log-ratio (ilr) transformation. A selection of illustrative cases is presented to compare performance of different alternatives.
Keywords: Outliers, Global monitoring, Robust regression, Mahalanobis distance
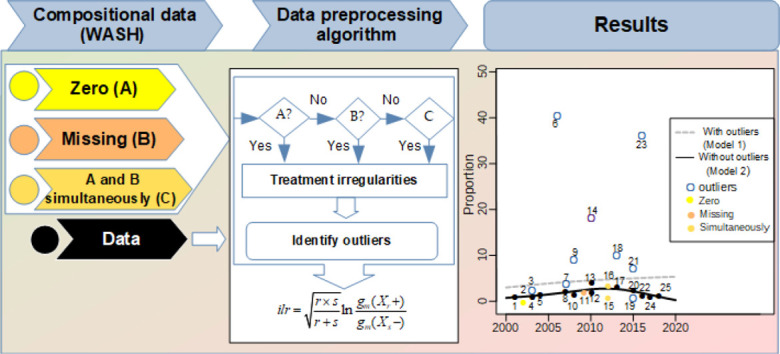
Graphical abstract
1. Introduction
Monitoring access to WASH services is a multiscale process involving bodies from the local level —to support the planning (Giné-Garriga et al., 2013, Giné-Garriga et al., 2015) and implementation of government public policies (Jiménez Fdez. de Palencia and Pérez-Foguet, 2011)— to the international level (WHO/UNICEF, 2017). WASH monitoring has evolved substantially over the last 15 years. A key point is the movement from the use of single indicators of performance (such as coverage of water and sanitation by improved and unimproved technologies) to multidimensional frameworks that understand WASH in relationship with concepts such as poverty (Giné-Garriga and Pérez-Foguet, 2013a, Giné-Garriga and Pérez-Foguet, 2019) and human rights (Baquero et al., 2015; Giné-Garriga et al., 2017), or from the perspective of vulnerable and marginalized groups (Redman-Maclaren et al., 2018; Ezbakhe et al., 2019; Anthonj et al., 2020a). Integrating these concepts leads to a much higher complexity than simple coverage of a population by one technical solution or another.
This multidimensional nature was first measured through aggregated indicators such as the WASH poverty index (Giné-Garriga and Pérez-Foguet, 2013a, Giné-Garriga and Pérez-Foguet, 2013b) that extended the seminal proposal of the Water Poverty Index (Sullivan, 2002; Sullivan et al., 2003; Giné-Garriga and Pérez-Foguet, 2010; Pérez-Foguet and Giné-Garriga, 2011). Likewise, some limitations of aggregated indicators, such as the compensability between dimensions and the lack of mechanisms to consider cross-influences between dimensions, has been tackled with different techniques (Ezbakhe and Pérez-Foguet, 2018; Giné-Garriga et al., 2018), mostly within the approach of supporting specific decision making processes.
Some of these ideas are currently integrated into the international WASH ladder monitoring driven by the JMP, which has moved from a coverage perspective to a service level approach. Here, a safe management category for water and for sanitation, and the hygiene ladder, are as main novelties. However, the basic framework for local and international monitoring still needs trend analysis of the percentage of population expressed by single categories (e.g., the primary indicators; WHO/UNICEF, 2018), whose particular characteristic is that they describe the parts of a whole with a sum of 100% (or 1, if they are proportions). This approach overlooks that data are compositional and require a particular statistical approach (Aitchison, 1986; Egozcue and Pawlowsky-Glahn, 2005; Lloyd et al., 2012; Pérez-Foguet et al., 2017; Ezbakhe and Pérez-Foguet, 2019). Further, the compositional nature of data is not addressed in the proposed alternatives for multidimensional monitoring or by the JMP for global WASH monitoring (WHO/UNICEF, 2018), which may lead to spurious correlations between the parties (Pérez-Foguet et al., 2017).
Fuller et al. (2016) classified the temporal evolution of access to water and sanitation according to the linearity or non-linearity of trends and proposed the use of Generalized Additive Models (GAM) when data are at a minimum. The compositional nature of the population percentages is included in the analysis presented by Pérez-Foguet et al. (2017), which concluded that using GAM for the isometric log-ratio (ilr) transformations of the usual follow-up variables is suitable. In this way, the non-linearity of the sum restrictions equal to constant is adequately treated. This is especially relevant when parts of the total tend to values near the extremes of all or nothing. However, the proposal does not address common situations, such as the presence of values reported as zero, or missing data in parts of the total, thereby preventing a direct application of the compositional approach.
Data with a value of zero are commonly presented in countries that have made significant progress in the provision of improved water and sanitation services; as a consequence, populations with access to unimproved sources have been drastically reduced, with the number in many cases at or near zero. The ilr transformations in the data therefore cannot be carried out if the zero values are not first excluded or imputed. Exclusion is an easy alternative to address the problem, but if the amount of data in the sector is low, this can affect the predictive capacity of the models. Thus, in the literature, alternatives have been proposed for the imputation of zero values in each situation according to the CoDa properties, including rounded zeros (Palarea-Albaladejo et al., 2007; Palarea-Albaladejo and Martín-Fernández, 2008; Martín-Fernández et al., 2012; Templ et al., 2016; Chen et al., 2018), count zeros (Martín-Fernández et al., 2015) and essential zeros (Aitchison and Kay, 2003).
The techniques related to rounded zeros are the more convenient imputation alternatives for the WASH sector, given that even in more developed countries, there are likely to be at least small percentages of populations that do not have access to any kind of water services. Simple replacement and multiplicative replacement have already been addressed in previous studies of the sector (Pérez-Foguet et al., 2017; Ezbakhe and Pérez-Foguet, 2019). Despite their simplicity in the application, these methods tend to underestimate the variability of data; therefore, it is advisable that they are only used when the presence of zeros is low (Palarea-Albaladejo and Martín-Fernández, 2008). In the presence of large amounts of zero values, other imputation alternatives are recommended, according to the variability of data that exist in the time series.
The lack of data defining the composition is also a topic of special importance in the sector, as it affects some categories of analysis. For example, according to the national survey (PNAD17) in the rural sector of Brazil, 88.4% of the population have access to improved drinking water sources (and 82.7%, by pipe), but no information is given about access by surface sources (WHO/UNICEF, 2019a). The lack of one or more data points for a specific year means that the ilr transformation cannot be applied directly, so that the information of that year is lost in the follow-up of all parts (Quispe-Coica and Pérez-Foguet, 2018). A first alternative is to exclude incomplete data from the analysis, but this can lead to biases (Strike et al., 2001), severe loss of information, inaccurate estimates that do not help managers make the best decisions, etc. There are different alternatives based on completing the missing data, including a multiplicative replacement by Martín-Fernández et al. (2003), a modified EM alr-algorithm by Palarea-Albaladejo and Martín-Fernández (2008) and a classic and robust method imputation by Hron et al. (2010); however, the most appropriate techniques for the specific cases of the WASH sector have not yet been determined.
Finally, the quality of available data can be classified in many cases as low or very low. The JMP validates data and metadata (data source information) one-by-one to determine what can be used. Discrepancies between data are not per se a reason for exclusion. To cite one example, the percentage of the population with access to piped water in rural Indonesia was reported to be 6.6% by the National Socio-economic survey in 2016, but another source of information reported that it was 41.5% (Performance Monitoring and Accountability; PMA16) (WHO/UNICEF, 2019b). This stems from the use of multiple sources of information and is not easily remedied automatically, yet it directly influences the estimates obtained under any model. Recently, Ezbakhe and Pérez-Foguet (2019) proposed a method to deal with uncertainties that originate in statistical sampling, using compositional models of trends as applied to water and sanitation data. However, completing the punctual validation of the JMP with techniques and procedures for the detection of outliers or other data errors other than sampling (Bain et al., 2018) is still pending. Therefore, evaluating identification alternatives for the sector's CoDa is necessary.
When working with CoDa, outliers cannot be identified for a variable independently of the rest. Multivariate analysis methods are necessary to facilitate the adequate detection of outliers and to enable data with evident errors to be identified, which can alter the estimates (Filzmoser and Hron, 2008; Filzmoser et al., 2009, Filzmoser et al., 2012). Filzmoser and Hron (2008) proposed the use of robust identification techniques based on the Mahalanobis distance (MD). The proposal applies to general regression models, such as GAM. Nevertheless, the low amount of data that some countries have can limit the use of this application. Other alternatives, such as ordinary least squares (OLS) regression, provide a better option in those cases. However, direct application of OLS is not convenient, as it can be negatively influenced by the presence of outliers. Therefore, it is necessary to apply robust estimators for linear regression models. Several methods for this exist in the literature, including M-estimation and S-estimation (Rousseeuw and Yohai, 1984), MM-estimation (Yohai, 1987; Koller and Stahel, 2011) and others (see overview in Maronna et al., 2019). In this study, the MM-type estimators are applied, based on the good results obtained with them in other studies. It should be added that robust estimates do not necessarily exclude outliers, but rather modulate their influence on the calibrated model, which gives it a strong advantage for use with limited data.
This work proposes and analyzes different coupled strategies for the treatment of zeros, missing data and outliers in compositional trend models, as applied to the international monitoring of the WASH sector, completing the previous work in this regard and facilitating its practical application to the available data. Specifically, it addresses the following objectives:
-
-
Evaluate alternatives for the treatment of zeros or missing data, or both simultaneously, using robust methods;
-
-
Identify and treat outliers by robust methods in a differentiated way for contexts with few or many (more than six) different temporal data, according to the Fuller et al. (2016) classification.
For this, a set of twelve trends has been selected, with different characteristics, that are internationally representative and within the set of situations in the sector for both urban and rural WASH settings.
2. Method
The algorithm proposed and shown in Fig. 1 follows statistical procedures and techniques for CoDa that can be easily applied and replicated in any sector or area of analysis. To understand them, one must first know some basic concepts, such as: i) CoDa represent vectors, with D representing strictly positive components, and the sum is a constant “k”, as shown in Eq. (1); ii) its sample space is the simplex S D; for statistical analysis, it is necessary to move to the Euclidean space using ilr transforms, which requires that D components be passed to (D–1).
| (1) |
Fig. 1.

Statistical analysis for CoDa of the WASH sector.
k: can be 1, 100, or any other positive constant.
These concepts and terms, although they seem simple, are not common in the WASH sector. Therefore, it is necessary to be clear about them, to understand the method of analysis in CoDa.
-
STEP I.
Preparation of compositional data (CoDa)
If the information is in population (P) units, the proportions of the service categories are formed according to Eq. (2). Subsequently, vectors are constructed with the parts, in which the sum is a constant “k” (100% if it is given as a percentage, or 1 if given in proportions). In vectors for which data are missing, “NA” is used.
| (2) |
| (3) |
| (4) |
Indicators are formed according to Table 1 . Water and sanitation are represented in Eq. (3) and each comprise four parts, while hygiene indicators are represented in Eq. (4) and comprise three parts.
Table 1.
Composition indicators for water (W) and sanitation (S).
Water (W): piped, other improved, surface or other unimproved.
Sanitation (S): sewer, other improved, open defecation or other unimproved.
| Services | Indicator | ||
|---|---|---|---|
| Water and sanitation | Improved (I) | X1 (piped or sewer) | X1 |
| X2 (other improved; W or S) | I - X1 | ||
| Unimproved (U) | X3 (surface or open defecation) | X3 | |
| X4 (other unimproved; W or S) | U-X3 | ||
| Hygiene | Handwashing facility on premises (H) | Xh1 (basic services) | Xh1 |
| Xh2 (limited services) | H - Xh1 | ||
| No handwashing facility | Xh3 (no services) | 100 - H | |
The composition vectors that present irregular data (e.g., that are zero, missing, or both zero and missing data simultaneously) and outliers are treated with functions that involve ilr transformations according to Eq. (5) of Egozcue et al. (2003), each with particularities in the balances V. This procedure is also applied to generate the models.
| (5) |
r = number of positive variables in the balance V
s = number of negative variables in the balance V
gm(−) = geometric mean of variables
However, to illustrate the behavior of the models in the transformed data, a type of balance is carried out, consistent with the usual form of analysis in the WASH sector. For example, global monitoring is based on the classification of access to improved and unimproved water and sanitation services, which are subsequently subdivided into service categories (WHO/UNICEF, 2017; Turman-Bryant et al., 2018); likewise, both inequalities in access to water and sanitation (Yang et al., 2013; Bain et al., 2014; UNICEF/WHO, 2019; Anthonj et al., 2020b; Chitonge et al., 2020) as well as studies of access to WASH and its relation to health (Prüss-Ustün et al., 2014; Freeman et al., 2017; Ashole Alto et al., 2020; Hasan and Alam, 2020; Patel et al., 2020) imply in one way or another the classification of improved and unimproved services. Therefore, the order of the balances (Egozcue and Pawlowsky-Glahn, 2005) is defined under this criterion (see Fig. 2 ), with the breakdown of each part as follows:
Fig. 2.

Balances in WASH: water and sanitation (V1) and hygiene (Vh1).
The water and sanitation balances each comprise four parts and follow the same procedure (V 1), with the balance carried out between the proportion of the population:
-
i.
with access to improved (X1 × X2) and unimproved (X3 × X4) services;
-
ii.
next, with access to network services (X1) and other improved (X2) forms of access;
-
iii.
finally, with access to services (X3) and other unimproved (X4) forms of access.
Hygiene balances comprise three parts and are performed under the following procedure (V h1), with the balance carried out between the proportion of the population:
-
i.
with a handwashing facility on premises (Xh1 × Xh2) and no handwashing facility (no service) (Xh3);
-
ii.
next, with access to basic services (Xh1) and limited service (Xh2).
The results of balances and transformations are shown in Table 2 .
-
STEP II.
Treatment of values of zero, missing data and zero plus missing data simultaneously
Table 2.
Transformations ilr.
| A. Water and sanitation | B. Hygiene |
|---|---|
|
|
|
Countries with data that include values of zero, missing values or values of zero plus missing values simultaneously are approached in a differentiated way with robust statistical techniques, as the low quality of data from the sector can influence the imputations (Hron et al., 2010; Martín-Fernández et al., 2012; Maronna et al., 2019). For the three cases mentioned, two treatment alternatives are compared. The number of zeros is denoted by NZ, and the number of missing values, by NM.
-
i)
NZ = 0, NM = 0: no pre-processing of data is performed.
-
ii)
NZ > 0, NM = 0: treatment of zero values with two variants of the log-ratio expectation-maximization (EM) algorithm; lrEM function (Palarea-Albaladejo and Martín-Fernández, 2015) and impRZilr (Templ et al., 2019).
-
iii)
NZ = 0, NM > 0: treatment of missing values through least trimmed squares (LTS) (Hron et al., 2010), implemented in the impCoda function, or with the same log-ratio EM algorithm used for the case (ii) (NZ > 0 and NM = 0); lrEM function.
-
iv)
NZ > 0, NM > 0: treatment of zero and missing values simultaneously, also with two alternatives. One is to consider zero values as a special type of missing values (Palarea-Albaladejo and Martín-Fernández, 2008; Martín-Fernández et al., 2011) and apply the same LTS algorithm as before (e.g., the impCoda function). The opposite should not be considered because the missing values are not necessarily zero values. The other alternative is using the extended version of the log-ratio EM algorithm, the lrEMplus function, presented by Palarea-Albaladejo and Martin-Fernandez (2020).
-
STEP III.
Models and estimates
Countries are classified into two groups according to the amount of data, with six being the separation limit. This classification is described in Fuller et al. (2016). However, as the low quality of data also affects the predictive capacity of the models, we opted to carry out robust models in both groups as detailed below:
For countries with data points < 6: the models are built using the robust OLS regression method on transformed data from Table 2B, for which the lmrob function is used, which calculates a regression estimator of the MM type as previously described (Yohai, 1987; Yohai et al., 1991; Koller and Stahel, 2011). Evaluation of the influence of outliers in linear regression models is carried out using robustness weights. On the other hand, standard linear regression models are added to transformed and non-transformed data, for comparison with the robust alternative.
Countries with data points ≥ 6: the model-fitting procedure combines the outlier identification method as part of the preprocessing and then excludes these data from the analysis to generate robust models, as described below:
-
i.
Outliers in multivariate data are identified by calculating the robust Mahalanobis distance (Eq. (6)) in isometric log-ratio coordinates of Eq. (5). For the computational calculation, the outCoDa function is applied (Templ et al., 2011).
| (6) |
where T and C are estimators of location and the covariance, respectively (Mahalanobis, 1936). Robustness is achieved by exchanging T and C for the minimum covariance determinant (MCD), which are robust estimators (Filzmoser and Hron, 2008). Potential outliers are those that have robust MD (square) greater than the cut-off value, which is the 0.975 quantile of the χ D−1 2 distribution with D-1 degrees of freedom (Rousseeuw and van Zomeren, 1990). In the case of water and sanitation, the degree of freedom of the chi-square distribution is three, and the cut-off value is 3.0575. Points that are above the threshold distance are not taken into account in subsequent estimates (MD(Y i)2 > χ 3, 0.975 2).
-
ii.
After identifying outliers, regression models are constructed with GAM, with four degrees of freedom (k = 4), on the transformed data in Table 2A. The analysis is performed for data both with and without the presence of outliers. The predictive capacity of the model between the two is compared with the adjusted coefficient of determination (R-adj); values near to one the predictive capacity of the model is better. The computational calculation to generate the models is done with the gam function.
STEP IV. Inverse transformation
The interpolation or extrapolation values in the transformed data are returned to the simplex space, for which the inverse transformation is performed with Eq. (7).
| (7) |
For the WASH sector, it is important to see the interpolations and extrapolations of the models in the different categories of access to WASH. Therefore, performing an inverse transformation is mandatory.
STEP V. Results and quality test
The whole process of the algorithm described up to STEP IV allows the interpolations and extrapolations of the different alternatives in the categories of access to WASH to be evaluated and compared, using quality metrics. In order to see the impact of the alternatives in STEP II on the scale of data, the root mean square error (RMSE) metric is applied to models expressed in terms of X. On the other hand, the evaluation of the predictive capacity of the models in the data is carried out through the non-dimensional indicator goodness of fit of Nash Sutcliffe efficiency (NSE) (Nash and Sutcliffe, 1970) applied to the observed and estimated X of the model. If NSE = 1, the fit of the model is perfect, while NSE < 1 suggests that the observed mean is a better predictor than the model (Ritter and Muñoz-Carpena, 2013).
The statistical computation of Fig. 1 is performed through R Core Team (2020) (v.3.6.3). Preprocess of data and integration of each calculation stage are presented in Quispe-Coica and Pérez-Foguet (2020). The following packages are used: robCompositions (v2.2.1) by Templ et al. (2011) for impRZilr, impCoda, and outCoDa; zCompositions (v1.3.4) by Palarea-Albaladejo and Martín-Fernández (2015)) for lrEM and lrEMplus; robustbase (0.93–5) by Maechler et al. (2019) for lmrob; mgcv (v1.8-31) of Wood (2019) for gam; and compositions (v1.40-3) by van den Boogaart et al. (2019).
3. Data features
To test the algorithm proposed in Fig. 1, we selected ten different countries for data on access to water and sanitation, and two countries for the hygiene case. Annual data are extracted from the JMP database from 2000 to 2019, in which both the amount of data and the presence or absence of irregularities vary in different proportions, allowing the various situations that arise in the WASH sector to be covered (see Table 3 ). Appendix A illustrates the implication in the correlation matrix of not using adequate techniques for CoDa.
Table 3.
Access to water, sanitation and hygiene (WASH).
| Region | Country | Sector | Service | Data points (X)a | Zero value | Missing value |
|---|---|---|---|---|---|---|
| Sub-Saharan Africa | South Africa | Rural | Sanitation | 30 (×4) | 0.00% | 1.67% |
| Latin America and the Caribbean | Brazil | Urban | Water | 27 (×4) | 0.00% | 44.44% |
| Eastern and south-eastern Asia | Indonesia | Rural | Water | 26 (×4) | 0.00% | 0.00% |
| Sub-Saharan Africa | Nigeria | Rural | Water | 22 (×4) | 1.14% | 0.00% |
| Latin America and the Caribbean | Paraguay | Urban | Water | 21 (×4) | 7.14% | 0.00% |
| Central and Southern Asia | Bangladesh | Rural | Sanitation | 20 (×4) | 1.25% | 30.00% |
| Sub-Saharan Africa | Zambia | Rural | Sanitation | 16 (×4) | 0.00% | 6.25% |
| Northern Africa and Western Asia | Egypt | Urban | Water | 15 (×4) | 10.00% | 30.00% |
| Latin America and the Caribbean | Uruguay | Urban | Water | 15 (×4) | 15.00% | 3.33% |
| Sub-Saharan Africa | Benin | Rural | Sanitation | 10 (×4) | 0.00% | 10.00% |
| Sub-Saharan Africa | Benin | Rural | Hygiene | 5 (×3) | 0.00% | 0.00% |
| Sub-Saharan Africa | Ghana | Rural | Hygiene | 4 (×3) | 0.00% | 0.00% |
The year's data points are represented by three or four levels of WASH service to which the population has access.
The countries that do not present data irregularities are represented by Benin and Ghana for access to hygiene, and by Indonesia for access to rural water. For hygiene, the low amount of data is mainly due to the recent incorporation of this into the Sustainable Development Goals (SDG 6.2) as part of the monitoring indicators (Craven et al., 2013); in contrast, access to water and sanitation has been monitored since 1990 (Bartram et al., 2014). In this type of data, STEP II of the algorithm does not apply.
Data with irregularities are presented in three different forms:
-
i)
The first case is represented by Nigeria and Paraguay, which have values of zero in the data, of 1.14% and 7.14%, respectively. The categories of Paraguay reveal that this occurs when the provision of water services by improved sources is high (Fig. 3A); consequently, indicators of access to unimproved water have zero trends or zero values. Another peculiarity that can be seen in Paraguay is that the zero value is presented only in the X3 indicator, while in Egypt, it is presented in X3 and X4.
-
ii)
The second case concerns countries with missing values in data and are represented by South Africa, Zambia, Brazil and Benin. Brazil has the highest percentage of missing values (of 44.44%), which are distributed in the same proportions in the X3 and X4 indicators (Fig. 3B).
-
iii)
The third case refers to countries with both values of zero and missing values in data and are represented by Bangladesh, Egypt and Uruguay. Egypt is shown as an example in Fig. 3C for data with zero values, and in Fig. 3D for data with missing values. In both graphs, data with zero values and missing values are in the categories of X3 and X4.
Fig. 3.

A) Paraguay: patterns of zero values. B) Brazil: patterns of missing values. (C and D) Egypt: zero values and missing values simultaneously, with values of zero shown in C), and missing values shown in D).
Data irregularities must be addressed in STEP II, by using the imputation functions most appropriate for each case.
4. Results and discussion
In this section, we discuss and compare work alternatives to treating values of zero, missing values and values of zero and missing values simultaneously that are usually present in the data. Subsequently, we analyze the influence of outliers on the model.
4.1. Countries with values of zero, missing values or values of zero and missing values simultaneously in the data
Of the different characteristics of the data presented in Section 3, countries with irregular data have gone through differentiated treatment methods in STEP II. For instance, Paraguay and Nigeria have zero values of zero in their data, of 7.14% and 1.14%, respectively (Table 4A). The analysis under the RMSE metric of the imputation functions lrEM and impRZilr that replace the zero values with small values do not show any significant differences that would allow us to discard any of the two alternatives completely; therefore, both functions can be applicable, as either of them helps to overcome the problem of not being able to perform the ilr transformations of Eq. (5).
Table 4.
Quality metrics to select the method.
| Country | Sector | Service | Zero value | Missing value | Method – RMSE (%) |
Selected method | |||
|---|---|---|---|---|---|---|---|---|---|
| impCoda | lrEM | lrEMplus | impRZilr | ||||||
| A. Case II: Data with zero values | |||||||||
| Paraguay | Urban | Water | 7.14% | 0.00% | – | 0.0026 | – | 0.0027 | lrEM |
| Nigeria | Rural | Water | 1.14% | 0.00% | – | 0.0060 | – | 0.0033 | impRZilr |
| B. Case III: Data with missing values | |||||||||
| Benin | Rural | Sanitation | 0.00% | 10.00% | 1.826 | 3.094 | – | – | impCoda |
| Brazil | Urban | Water | 0.00% | 44.44% | 0.648 | 0.321 | – | – | lrEM |
| South Africa | Rural | Sanitation | 0.00% | 1.67% | 0.015 | 0.026 | – | – | impCoda |
| Zambia | Rural | Sanitation | 0.00% | 6.25% | 8.435 | 8.227 | – | – | lrEM |
| C. Case IV: Data with zero values and missing values simultaneously | |||||||||
| Bangladesh | Rural | Sanitation | 1.25% | 30.00% | 7.621a | – | 8.690 | – | impCoda |
| Egypt | Urban | Water | 10.00% | 30.00% | 0.254a | – | 0.269 | – | impCoda |
| Uruguay | Urban | Water | 15.00% | 3.33% | 0.052a | – | 0.048 | – | lrEMplus |
Data with values of zero are considered missing values (“0” → “NA”); therefore, imputation methods with the impCoda function are applied.
Nevertheless, when dealing with the missing values in data (Table 4B), differences in the metrics should be taken into account, which makes us choose the impCoDa function or the lrEM function depending on the country of analysis. For example, metrics in the impCoDa function are better for Benin and South Africa, while the lrEM function is better for Brazil; in contrast, no significant differences between either function (impCoda or lrEM) are present for Zambia.
On the other hand, in countries with values of zero and missing values simultaneously (see Table 4C), the alternative of replacing zero values with “NA” and addressing them as “missing values” with the impCoda function gives better results for Bangladesh and Egypt. This occurs when there is a higher percentage of data with missing values than zero values. However, the opposite situation occurs in the data set from Uruguay, which has 15% of zero values and 3.33% of missing values, and for which the lrEMplus function is a better alternative.
Finally, while it is true that any of the methods evaluated is adequate for at least one of the cases (depending on each case), the methods are all already better than the multiplicative imputation alternatives or other simple alternatives, as they allow variability to exist in the imputed data. This advantage is more significant when the data points show a higher percentage of these irregularities. If no alternative is applied (either simple or one of those shown in this paper), many countries in the sector should be excluded from the analysis. This is especially important if the loss of information is significant (as happens in South American countries; Quispe-Coica and Pérez-Foguet, 2018). On the other hand, once the new Sustainable Development Goals were agreed upon (United Nations General Assembly, 2015; UN Water, 2016), each country assumed the responsibility of reducing the population's access to unimproved services of WASH. To this end, many countries are defining and implementing public policies that close these gaps, in which case data will tend to go to extreme values, making it even more necessary to use imputation alternatives for zero values.
4.2. Outliers
4.2.1. Countries with data points < 6
This section addresses the case of countries with little data, where the influence of outliers is penalized in the coupled model. The access of rural populations to the different levels of hygiene services in Benin and Ghana illustrates this situation. In Fig. 4A and B, we present the model fit in data transformed by standard and robust linear regression. The regression lines of both methods are similar in the transformations of ilr2, and differ for both methods in ilr1 (with more drastic changes in Fig. 4E). The difference is mainly due to the fact that, in the robust method, points 1 and 5 of Ghana and Benin, respectively, have a strong degree of negative influence on the model, so that it assigns zero value robustness weights.
Fig. 4.

Model and estimations in CoDa of hygiene. (A, E) Two different models are fitted in transformed data: i) standard OLS (blue and black solid lines) and ii) robust OLS (blue and black dashed lines). (B–D, F–H) Three different models are fitted in CoDa: i) standard OLS in original data (black solid line), ii) inverse of standard OLS of transformed data (blue solid line) and iii) inverse of robust OLS of transformed data (blue dashed line). (For interpretation of the references to colour in this figure legend, the reader is referred to the web version of this article.)
How the influence of data is modulated creates significant differences in the estimates of the categories of hygiene services that the population accesses. In the case of Ghana, the effect in each category is even greater if we compare it with the other alternatives (Fig. 4F–H). Likewise, in both Benin and Ghana, the curve generated by robust OLS (ilr) best fits the data. On the other hand, looking at the results qualitatively, it is more reasonable to exclude point 1 in Ghana and point 5 in Benin, which supports the affirmation that the robust linear regression alternative is an excellent alternative for regression models in the presence of data with outliers.
Another feature to consider is that with OLS (ilr) or robust OLS (ilr), extrapolations of the service categories in 2000 and 2017 never exceeded the extreme limits of 0 and 100% (Table 5 ). This happens because the inverse transformation has a closing value (Eq. (4)) that allows estimates to be made in the time series without restrictions. The opposite occurs when extrapolation is performed with standard OLS. Here, the negative values of Benin (−0.726) and Ghana (−1.594) in the basic service category of the year 2000 exemplify this situation; in these cases, the JMP applies restrictions of 0 (WHO/UNICEF, 2018).
Table 5.
Comparison of estimated values with different methods.
| Hygiene country | Method | Estimation year (2000) |
Estimation year (2017) |
||||
|---|---|---|---|---|---|---|---|
| Basic service | Limited service | No service | Basic service | Limited service | No service | ||
| Benin | OLS (ilr) | 0.162 | 2.740 | 97.098 | 13.862 | 13.868 | 72.270 |
| OLS (ilr)-robust | 0.105 | 1.752 | 98.142 | 27.959 | 28.968 | 43.073 | |
| OLS a | −0.726 | 3.638 | 97.088 | 6.466 | 17.351 | 76.183 | |
| JMP website b | 0.000 | 2.912 | 97.088 | 6.043 | 16.544 | 77.413 | |
| Ghana | OLS (ilr) | 4.712 | 36.629 | 58.659 | 23.431 | 32.464 | 44.104 |
| OLS (ilr)-robust | 0.009 | 0.069 | 99.923 | 33.675 | 46.319 | 20.006 | |
| OLS a | −1.594 | 44.893 | 56.701 | 24.890 | 30.010 | 45.100 | |
| JMP website b | NA | NA | NA | 36.576 | 43.491 | 19.933 | |
OLS regression on untransformed data.
Data available at JMP website (Benin and Ghana, Excel tab “Regressions”). Negative values are underlined. NA: not available.
On the other hand, the results of the 2017 estimates with robust OLS (ilr) differ significantly from the other linear alternatives in all Benin categories. In Ghana, only robust OLS (ilr) and JMP regression give very similar results in all three categories. Although the estimation alternatives differ, there is a high percentage of the rural population that does not have handwashing facility (specifically, 43.07% in Benin, and 20% in Ghana), if we take into account the results of robust OLS (ilr). In both countries, this rate is expected to decrease, given the positive effects of handwashing with soap and water in the reduction and prevention of diseases, such as diarrhea, coronavirus disease 2019 (COVID-19), acute respiratory infection and impetigo, among others (Luby et al., 2005; Cairncross et al., 2010; Hirai et al., 2017; Prüss-Ustün et al., 2019; Brauer et al., 2020; Ma et al., 2020).
4.2.2. Countries with data points ≥ 6
The possible reasons for outliers in data can be diverse. However, in the data analyzed here, it is evident that outliers commonly occur when there are different sources of information. To better illustrate this point, we present the case of the rural population of South Africa, for which information for the sewer categories in 2011 comes from three different sources: the Census (CEN) reported 6.03% access, the Income and Expenditure of Homes survey (IES) reported 44.16% access, and the General Household survey (GHS) reported 5.07% access. Based on the significant difference between data from IES and that from the other two sources of information (CEN and GHS), it is normal to assume that it is an outlier without needing to apply any validation methods. On the other hand, as the census data and the EEG survey only differ by 0.96%, it is difficult to know if either value is atypical or not.
Given the doubt that is generated, robust MD can apply to the country's time series. The results obtained show that only the IES data point is an outlier (Fig. 5A.2), which confirms the previous assumption. The punctual validation carried out by the JMP (2019) (see Excel tab “Data Summary/Sanitation for 2011”) identifies and excludes the CEN and IES data points from the model. These differences in identification that are manifested for a specific country and year can also occur for other countries when a time series is analyzed.
Fig. 5.

(A.2, B.2 and C.2) Robust Mahalanobis distance. Distances greater than the cut-off value (dashed lines) are considered outliers. (A.3, B.3 and C.3) Two different models are fitted in transformed data: i) GAM with outliers (solid lines) and ii) GAM without outliers (dashed lines).
The coherence and contradictions in the number of outliers identified through the two methods, the robust MD and the JMP, are shown in Table 6 . The number of outliers identified by the robust MD is higher than that identified by JMP in nine of ten countries, with Paraguay showing the greatest difference, while the opposite is seen for Zambia in categories X1 and X3. In contrast, in both South Africa and Zambia, the number of identified outliers is the same between the two alternatives (robust MD and JMP) in categories X1 and improved, respectively.
Table 6.
Identification of outliers in WASH.
| Country | Sector | Service | Data points (X) | Method |
|||
|---|---|---|---|---|---|---|---|
| RMD a | JMP b |
||||||
| Improved | X1 | X3 | |||||
| South Africa | Rural | Sanitation | 30 | 7 | 3 | 7 | 3 |
| Brazil | Urban | Water | 27 | 1 | 0 | 0 | 0 |
| Indonesia | Rural | Water | 26 | 9 | 3 | 4 | 3 |
| Nigeria | Rural | Water | 22 | 3 | 1 | 0 | 1 |
| Paraguay | Urban | Water | 21 | 8 | 0 | 1 | 0 |
| Bangladesh | Rural | Sanitation | 20 | 7 | 2 | 1 | 2 |
| Zambia | Rural | Sanitation | 16 | 3 | 3 | 6 | 5 |
| Egypt | Urban | Water | 15 | 1 | 0 | 0 | 0 |
| Uruguay | Urban | Water | 15 | 4 | 1 | 1 | 1 |
| Benin | Rural | Sanitation | 10 | 3 | 0 | 0 | 0 |
Robust Mahalanobis distance represents all parts at a single point, and those that exceed the threshold are considered outliers.
The JMP performs the punctual validation of data for each country. Data available at the JMP website (Country/Excel tab “Data Summary”).
These differences suggest that identifying outliers under the usual JMP analysis method is insufficient and requires additional tools. Therefore, the robust MD method both reinforces and complements the usual form of analysis. Furthermore, it allows current and other atypical values to be methodically identified, which reduces the identification bias. The disadvantage of the MD method is that the calculated distance represents the four parts (see Fig. 5A.2, B.2 and C.2), and therefore the exclusion of points that exceed the threshold leads to the loss of information for all four categories of the year. This does not happen with either the JMP method or the univariate statistics identification methods.
Following the sequence of the algorithm (Fig. 1), STEP III can be applied (Fig. 5). In Indonesia and South Africa, exclusion of outliers improved the quality of the models of all transformed data (Fig. 5A.3 and B.3). R-adjusted quality metrics confirm this affirmation. However, in Uruguay, quality metrics only improved in ilr3 transformations; this demonstrates the flexibility of GAM, which seeks to adjust to the data, regardless of whether it has outliers or not. On the other hand, although the models are generated in transformed data, it is more important in the WASH sector to see the quality of the predictive capacity in each category of analysis. Therefore, it is necessary to return the interpolations and extrapolations of the model to the space of the simplex, without ruling out that everything that happens in the transformed data will influence the results of the different levels of service.
The results of applying the inverse transformation in STEP IV of the algorithm are shown in Fig. 6 . The presence of outliers influenced the fit of the models in a differentiated way; this affected the estimates. In Indonesia, the estimate of the percentage of rural population that have access to piped water in 2020 is 10.8% if the model was generated with data that includes outliers; however, this value decreased to 5.7% if outliers were excluded from the analysis, resulting in a 5.1% difference between the two estimates. In South Africa, this difference increased to 7.2% if we analyzed the category of the rural population that has access to sanitation through other improved forms.
Fig. 6.

(D, E and F) Two different models are fitted in CoDa: i) Inverse of GAM transformed data with outliers (dashed lines) and ii) inverse of GAM transformed data without outliers (solid lines).
For the 2020 estimates for Uruguay, there is no significant difference between the two alternatives (models with outliers included and without outliers). For example, for the category of access to piped water service, the difference between the two models was 0.004%. The remaining three categories also did not differ from these statements. It appears that in countries that have covered almost all water service provision, modeling and comparison are no longer relevant. Nonetheless, it cannot be ruled out that modeling is necessary for trend data to extreme values, as small proportions passed to population units can have significant effects, such as in China and India. On the other hand, we must emphasize two things: i) the estimates cannot exceed the extreme values of 0 and 100% in any service category; and ii) it is very important to use adequate statistical techniques, such as in STEP II, to treat values of zero, according to the variability of the time series data, as this allows models to be built without excluding data.
The quality metrics in Table 7 reinforce the hypothesis that outliers influence the quality of the models. The metrics of the four indicators are the same or better when outliers are excluded in six of the ten countries (namely, South Africa, Brazil, Indonesia, Nigeria, Uruguay and Benin). Of these countries, South Africa, Indonesia and Uruguay have NSE2 metrics near to 1, which indicates the high predictive capacity of the models in these countries, according to the indicator. The opposite is seen in Egypt, where the observed average is a better predictor than the model in the four analysis categories, in both models with or without outliers. In Bangladesh, Paraguay and Zambia, the improvement was only present in some categories.
Table 7.
Quality metrics estimates for access to water and sanitation.

NSE2 values less than NSE1 are shown in gray; negative values are underlined.
On the other hand, the temporal trends of the service categories show the inequalities that exist in access to water and sanitation between the urban and rural sectors. In Indonesia and South Africa, access to water and sanitation by other improved forms is increasing (Fig. 6D.2 and E.2); however, in Uruguay, this category tends towards values of zero (Fig. 6F.2). If we compare only Indonesia and Uruguay, the rural–urban gap in the category of access to piped water is further increased, mirroring the world situation reported in the literature with respect to disparities that exist in access to water and sanitation in both sectors (Bain et al., 2014; Chitonge et al., 2020). That said, and in the context of the SDGs that seeks to ensure that no one is left behind (United Nations General Assembly, 2015), the rural sector in both Indonesia and South Africa is faced with a greater challenge in the provision and safe management of water and sanitation services.
Finally, after outliers have been identified, it is not recommended to eliminate them automatically, as this can lead to loss of relevant information that helps explain the specific situation or time series of the country. Additionally, there are other factors that the analyst does not value when excluding data (such as the cost of obtaining data through a survey, census or other alternatives that is representative of the country); therefore, the essential thing before excluding outliers would be to understand why the values are anomalous. An alternative that would help to understand the presence of these data could be to consult the institutions of origin for the information sources. Nevertheless, obtaining answers becomes complicated when it depends on third-party institutions (for instance, for reports to the SDG, the associated countries generally have statistical or other specialized institutions that are responsible for collecting, processing, and sharing information to interested parties). In these cases, exclusion is simply a necessity because of the improvements it brings to the models.
5. Conclusions
The existence of values of zero, missing values or both simultaneously makes it necessary to treated data in a differentiated manner, for which distinct treatment options are available. While these options are not equivalent, no clear criteria exist for choosing exactly which one to use, with all alternatives potentially equally good. Further, these options are suitable for analyzing data with variations in temporal evolution, which is not possible if we apply the multiplicative replacement (Martín-Fernández et al., 2003).
In countries with low amounts of data, we concluded that robust linear regression (robust OLS (ilr)) is suitable for the analysis of WASH sector data, since it limits the influence of outliers on the calibrated model. Both quantitatively and qualitatively, the declaration of outliers can be validated.
In countries with ≥6 data points, the identification of outliers with the robust Mahalanobis distance tends to give us more than the qualitative classification made with the JMP (and specifically, for nine of the ten countries evaluated), which reinforces the usual classification of the JMP. However, we must bear in mind that, in the robust Mahalanobis distance method, all parts of the year are excluded, while in JMP, only part of the composition is likely to be excluded. This conclusion goes hand in hand with the GAM adjustments to data, for which excluding outliers from the analysis generally leads to a higher reliability of the interpolation and extrapolations results.
Furthermore, for all cases (e.g., < 6 or ≥ 6 data points), interpolation and extrapolation of the models in the service categories can never exceed the limit value of 0 or 100%. This affirmation concurs with and extends the conclusion obtained by Pérez-Foguet et al. (2017), as we now have analyzed a wide range of data with different irregularities and include analysis of access to hygiene.
Finally, the algorithm proposal that integrates models for a wide range of linear and non-linear data, with outliers included, is expected to contribute to improving data analysis in the sector, and especially those for which sources of information are different. This work complements the proposal made by Pérez-Foguet et al. (2017) and continued by Ezbakhe and Pérez-Foguet (2019), on the statistical analysis for CoDa in the WASH sector.
CRediT authorship contribution statement
Alejandro Quispe-Coica: Conceptualization, Methodology, Formal analysis, Writing - original draft, Writing - review & editing, Data curation, Software, Visualization. Agustí Pérez-Foguet: Conceptualization, Methodology, Formal analysis, Writing - original draft, Writing - review & editing, Supervision.
Declaration of competing interest
The authors declare that they have no known competing financial interests or personal relationships that could have appeared to influence the work reported in this paper.
Acknowledgments
This research was developed within the framework of a grant from the Peruvian government (Reference PRONABEC-President of the Republic Scholarship), through a full scholarship awarded to Alejandro Quispe Coica, and was partially funded by the Ministry of Science, Innovation and Universities of Spain (Ref: RTI2018-095518-B-C22) and by the Agència de Gestió d'Ajuts Universitaris i de Recerca de la Generalitat de Catalunya (Ref. 2017 SGR 1496).
Editor: Damia Barcelo
Appendix A. Spurious correlation
As already discussed previously (Pérez-Foguet et al., 2017; Ezbakhe and Pérez-Foguet, 2019), the statistical techniques applied for international monitoring of WASH are performed using CoDa. The peculiarities of this type of data suggest that there may be a spurious correlation if the appropriate statistical techniques are not applied in the analysis. However, in the WASH sector, this statement has not yet been tested. Thus, a correlation analysis of the population with access to different levels of WASH services should be carried out, as exemplified by the following situation.
Two external organizations want to know the access of a population to water or to rural sanitation with different levels of services in Indonesia and South Africa, respectively. For this, organization A requests population data from the four categories [X1, X2, X3, X4], while organization B only needs to know data for three of the four categories [X1*, X3*, X4*]. With the information obtained, organization A makes proportions to visualize the percentage of the population that each category represents in the composition. Organization B follows a similar procedure for all three categories of services. Subsequently, each organization performs a correlation analysis of the selected categories, reaching consistent and contradictory conclusions, according to the category of analysis.
Table A1.
Correlation matrix of data on access to water and sanitation.
| 1) Water | ||||||||
|---|---|---|---|---|---|---|---|---|
| A | X1 | X2 | X3 | X4 | B | X1* | X3* | X4* |
| X1 | 1.00 | −0.82 | 0.27 | −0.52 | X1* | 1.00 | −0.75 | −0.99 |
| X2 | 1.00 | −0.70 | −0.07 | X3* | 1.00 | 0.67 | ||
| X3 | 1.00 | 0.53 | X4* | 1.00 | ||||
| X4 | 1.00 | |||||||
| 2) Sanitation | ||||||||
|---|---|---|---|---|---|---|---|---|
| A | X1 | X2 | X3 | X4 | B | X1* | X3* | X4* |
| X1 | 1.00 | −0.59 | −0.03 | −0.36 | X1* | 1.00 | −0.52 | −0.66 |
| X2 | 1.00 | −0.71 | −0.36 | X3* | 1.00 | −0.30 | ||
| X3 | 1.00 | 0.40 | X4* | 1.00 | ||||
| X4 | 1.00 | |||||||
Notes: The analysis category for water and sanitation is the same as in Table 1. The correlation matrix is performed with data from the country's time series before pre-processing.
From Table A1-1, organization A infers that the correlation of the categories of access to water between X1w and X3w is positive and low (correlation = 0.27), while organization B concludes that the correlation between X1w* and X3w* has a high degree of relationship, but negative (correlation = −0.75). For the population with access to sanitation (Table A1-2), an analysis similar to that described, organization A concludes that the relationship between X3s and X4s is positive (correlation = 0.40), and organization B, that it is negative (correlation = −0.30). Therefore, for the same categories of analyses of both cases, the different methods of analysis give different conclusions.
Table A2.
Composition and subcomposition of WASH data.
| Category | Source | Full composition “A” |
Ratio |
Subcomposition “B” |
Ratio |
||
|---|---|---|---|---|---|---|---|
| [X1, X2, X3, X4] | X1 / X3 | X4 / X3 | [X1*, X3*, X4*] | X1* / X3* | X4* / X3* | ||
| Water a | SUS01 | [6.51, 60.45, 5.72, 27.32] | 1.14 | 4.78 | [16.46, 14.46, 69.08] | 1.14 | 4.78 |
| SUS02 | [6.17, 62.31, 5.46, 26.06] | 1.13 | 4.77 | [16.37, 14.49, 69.14] | 1.13 | 4.77 | |
| DHS03 | [7.90, 57.09, 6.00, 29.01] | 1.32 | 4.83 | [18.41, 13.98, 67.61] | 1.32 | 4.83 | |
| Sanitation a | IES00 | [5.95, 46.93, 25.23, 21.88] | 0.24 | 0.87 | [11.21, 47.55, 41.24] | 0.24 | 0.87 |
| CEN01 | [7.10, 47.23, 27.70, 17.97] | 0.26 | 0.65 | [13.45, 52.49, 34.05] | 0.26 | 0.65 | |
| WHS03 | [30.59, 43.49, 13.00, 12.92] | 2.35 | 0.99 | [54.13, 23.00, 22.86] | 2.35 | 0.99 |
To exemplify both water and sanitation, only data from the first three rows are shown.
On the other hand, when ratios are compared between categories for both organization A and organization B, the result is the same (Table A2). For example, for water access data, the ratio of [X4w/X3w] equals [X4w*/X3w*], and the same is true with the ratios of access to sanitation. Therefore, the alternatives for statistical analysis of CoDa are based on a log-ratio relationship approach (Aitchison, 1986; Egozcue et al., 2003), each with its own particularities. As the WASH sector is familiar with the assumptions made, the application of adequate statistics for CoDa becomes mandatory.
References
- Aitchison J. Probability; Chapman and Hall, London (UK): 1986. The Statistical Analysis of Compositional Data. Monographs on Statistics and Applied. [Google Scholar]
- Aitchison J., Kay J.W. In Proceedings of CoDaWork’03, The 1st Compositional Data Analysis Workshop. University of Girona; Girona (Spain): 2003. Possible solutions of some essential zero problems in compositional data analysis. [Google Scholar]
- Anthonj C., Setty K.E., Ezbakhe F., Manga M., Hoeser C. A systematic review of water, sanitation and hygiene among Roma communities in Europe: situation analysis, cultural context, and obstacles to improvement. Int. J. Hyg. Environ. Health. 2020 doi: 10.1016/j.ijheh.2020.113506. [DOI] [PubMed] [Google Scholar]
- Anthonj C., Tracy J.W., Fleming L., Shields K.F., Tikoisuva W.M., Kelly E., Thakkar M.B., Cronk R., Overmars M., Bartram J. Geographical inequalities in drinking water in the Solomon Islands. Sci. Total Environ. 2020;712 doi: 10.1016/j.scitotenv.2019.135241. [DOI] [PubMed] [Google Scholar]
- Ashole Alto A., Godana W., Gedamu G. Impact of community-led total sanitation and hygiene on prevalence of diarrheal disease and associated factors among under-five children: a comparative cross-sectional study in selected Woredas of Gamo Gofa Zone, Southern Ethiopia. Adv. Public Heal. 2020;2020 [Google Scholar]
- Bain R.E.S., Wright J.A., Christenson E., Bartram J.K. Rural:urban inequalities in post 2015 targets and indicators for drinking-water. Sci. Total Environ. 2014;490:509–513. doi: 10.1016/j.scitotenv.2014.05.007. [DOI] [PubMed] [Google Scholar]
- Bain R., Johnston R., Mitis F., Chatterley C., Slaymaker T. Establishing sustainable development goal baselines for household drinking water, sanitation and hygiene services. Water. 2018;10:1711. doi: 10.3390/w10121711. [DOI] [Google Scholar]
- Baquero Ó.F., Jiménez Fdez. de Palencia A., Pérez-Foguet A. Reporting progress on the human right to water and sanitation through JMP and GLAAS. J. Water Sanit. Hyg. Dev. 2015;5:310–321. doi: 10.2166/washdev.2015.151. [DOI] [Google Scholar]
- Bartram J., Brocklehurst C., Fisher M., Luyendijk R., Hossain R., Wardlaw T., Gordon B. Global monitoring of water supply and sanitation: history, methods and future challenges. Int. J. Environ. Res. Public Health. 2014;11:8137–8165. doi: 10.3390/ijerph110808137. [DOI] [PMC free article] [PubMed] [Google Scholar]
- Brauer M., Zhao J.T., Bennitt F.B., Stanaway J.D. 2020. Global Access to Handwashing: Implications for COVID-19 Control in Low-income Countries. medRxiv 2020.04.07.20057117. [DOI] [PMC free article] [PubMed] [Google Scholar]
- Cairncross S., Hunt C., Boisson S., Bostoen K., Curtis V., Fung I.C.C.H., Schmidt W.-P. Water, sanitation and hygiene for the prevention of diarrhoea. Int. J. Epidemiol. 2010;39:i193–i205. doi: 10.1093/ije/dyq035. [DOI] [PMC free article] [PubMed] [Google Scholar]
- Chen J., Zhang X., Hron K., Templ M., Li S. Regression imputation with Q-mode clustering for rounded zero replacement in high-dimensional compositional data. J. Appl. Stat. 2018;45:2067–2080. doi: 10.1080/02664763.2017.1410524. [DOI] [Google Scholar]
- Chitonge H., Mokoena A., Kongo M. Springer; Cham: 2020. Water and Sanitation Inequality in Africa: Challenges for SDG 6; pp. 207–218. [DOI] [Google Scholar]
- Craven J., Giné-Garriga R., Jiménez Fdez. de Palencia A., Pérez-Foguet A. Loughborough University; 2013. Introducing Hygiene Elements into Sanitation Monitoring. [Google Scholar]
- Egozcue J.J., Pawlowsky-Glahn V. Groups of parts and their balances in compositional data analysis. Math. Geol. 2005;37:795–828. doi: 10.1007/s11004-005-7381-9. [DOI] [Google Scholar]
- Egozcue J.J., Pawlowsky-Glahn V., Mateu-Figueras G., Barceló-Vidal C. Isometric Logratio transformations for compositional data analysis. Math. Geol. 2003;35:279–300. doi: 10.1023/A:1023818214614. [DOI] [Google Scholar]
- Ezbakhe F., Pérez-Foguet A. Multi-criteria decision analysis under uncertainty: two approaches to incorporating data uncertainty into water, sanitation and hygiene planning. Water Resour. Manag. 2018;32:5169–5182. doi: 10.1007/s11269-018-2152-9. [DOI] [Google Scholar]
- Ezbakhe F., Pérez-Foguet A. Estimating access to drinking water and sanitation: the need to account for uncertainty in trend analysis. Sci. Total Environ. 2019;696 doi: 10.1016/J.SCITOTENV.2019.133830. [DOI] [PubMed] [Google Scholar]
- Ezbakhe F., Giné-Garriga R., Pérez-Foguet A. Leaving no one behind: evaluating access to water, sanitation and hygiene for vulnerable and marginalized groups. Sci. Total Environ. 2019;683:537–546. doi: 10.1016/j.scitotenv.2019.05.207. [DOI] [PubMed] [Google Scholar]
- Filzmoser P., Hron K. Outlier detection for compositional data using robust methods. Math. Geosci. 2008;40:233–248. doi: 10.1007/s11004-007-9141-5. [DOI] [Google Scholar]
- Filzmoser P., Hron K., Reimann C. Univariate statistical analysis of environmental (compositional) data: problems and possibilities. Sci. Total Environ. 2009;407:6100–6108. doi: 10.1016/J.SCITOTENV.2009.08.008. [DOI] [PubMed] [Google Scholar]
- Filzmoser P., Hron K., Reimann C. Interpretation of multivariate outliers for compositional data. Comput. Geosci. 2012;39:77–85. doi: 10.1016/J.CAGEO.2011.06.014. [DOI] [Google Scholar]
- Freeman M.C., Garn J.V., Sclar G.D., Boisson S., Medlicott K., Alexander K.T., Penakalapati G., Anderson D., Mahtani A.G., Grimes J.E.T., Rehfuess E.A., Clasen T.F. The impact of sanitation on infectious disease and nutritional status: a systematic review and meta-analysis. Int. J. Hyg. Environ. Health. 2017;220:928–949. doi: 10.1016/j.ijheh.2017.05.007. [DOI] [PubMed] [Google Scholar]
- Fuller J.A., Goldstick J., Bartram J., Eisenberg J.N.S. Tracking progress towards global drinking water and sanitation targets: a within and among country analysis. Sci. Total Environ. 2016;541:857–864. doi: 10.1016/j.scitotenv.2015.09.130. [DOI] [PubMed] [Google Scholar]
- Giné-Garriga R., Pérez-Foguet A. Improved method to calculate a water poverty index at local scale. J. Environ. Eng. 2010;136:1287–1298. doi: 10.1061/(ASCE)EE.1943-7870.0000255. [DOI] [Google Scholar]
- Giné-Garriga R., Pérez-Foguet A. Water, sanitation, hygiene and rural poverty: issues of sector monitoring and the role of aggregated indicators. Water Policy. 2013;15:1018–1045. doi: 10.2166/wp.2013.037. [DOI] [Google Scholar]
- Giné-Garriga R., Pérez-Foguet A. Unravelling the linkages between water, sanitation, hygiene and rural poverty: the WASH poverty index. Water Resour. Manag. 2013;27:1501–1515. doi: 10.1007/s11269-012-0251-6. [DOI] [Google Scholar]
- Giné-Garriga R., Pérez-Foguet A. Monitoring and targeting the sanitation poor: a multidimensional approach. Nat. Resour. Forum. 2019;43:82–94. doi: 10.1111/1477-8947.12171. [DOI] [Google Scholar]
- Giné-Garriga R., Jiménez Fdez. de Palencia A., Pérez-Foguet A. Water–sanitation–hygiene mapping: an improved approach for data collection at local level. Sci. Total Environ. 2013;463–464:700–711. doi: 10.1016/j.scitotenv.2013.06.005. [DOI] [PubMed] [Google Scholar]
- Giné-Garriga R., Jiménez Fdez. de Palencia A., Pérez-Foguet A. Improved monitoring framework for local planning in the water, sanitation and hygiene sector: from data to decision-making. Sci. Total Environ. 2015;526:204–214. doi: 10.1016/j.scitotenv.2015.04.078. [DOI] [PubMed] [Google Scholar]
- Giné-Garriga R., Flores-Baquero Ó., Jiménez Fdez de Palencia A., Pérez-Foguet A. Monitoring sanitation and hygiene in the 2030 Agenda for Sustainable Development: a review through the lens of human rights. Sci. Total Environ. 2017;580:1108–1119. doi: 10.1016/j.scitotenv.2016.12.066. [DOI] [PubMed] [Google Scholar]
- Giné-Garriga R., Requejo D., Molina J.L., Pérez-Foguet A. A novel planning approach for the water, sanitation and hygiene (WaSH) sector: the use of object-oriented bayesian networks. Environ. Model. Softw. 2018;103:1–15. doi: 10.1016/j.envsoft.2018.01.021. [DOI] [Google Scholar]
- Hasan M.M., Alam K. Inequality in access to improved drinking water sources and childhood diarrhoea in low- and middle-income countries. Int. J. Hyg. Environ. Health. 2020;226 doi: 10.1016/j.ijheh.2020.113493. [DOI] [PubMed] [Google Scholar]
- Hirai M., Roess A., Huang C., Graham J.P. Exploring the link between handwashing proxy measures and child diarrhea in 25 countries in sub-Saharan Africa: a cross-sectional study. J. Water Sanit. Hyg. Dev. 2017;7:312–322. doi: 10.2166/washdev.2017.126. [DOI] [Google Scholar]
- Hron K., Templ M., Filzmoser P. Imputation of missing values for compositional data using classical and robust methods. Comput. Stat. Data Anal. 2010;54:3095–3107. doi: 10.1016/J.CSDA.2009.11.023. [DOI] [Google Scholar]
- Jiménez Fdez. de Palencia A., Pérez-Foguet A. Implementing pro-poor policies in a decentralized context: the case of the Rural Water Supply and Sanitation Program in Tanzania. Sustain. Sci. 2011;6:37–49. doi: 10.1007/s11625-010-0121-1. [DOI] [Google Scholar]
- JMP . WHO/UNICEF; URL: 2019. Joint Monitoring Programme for Water Supply, Sanitation, and Hygiene: Estimates on the Use of Water, Sanitation and Hygiene in South Africa.https://washdata.org/data [Google Scholar]
- Koller M., Stahel W.A. Sharpening Wald-type inference in robust regression for small samples. Comput. Stat. Data Anal. 2011;55:2504–2515. doi: 10.1016/j.csda.2011.02.014. [DOI] [Google Scholar]
- Lloyd C.D., Pawlowsky-Glahn V., Egozcue J.J. Compositional data analysis in population studies. Ann. Assoc. Am. Geogr. 2012;102:1251–1266. doi: 10.1080/00045608.2011.652855. [DOI] [Google Scholar]
- Luby S.P., Agboatwalla M., Feikin D.R., Painter J., Billhimer W., Altaf A., Hoekstra R.M. Effect of handwashing on child health: a randomised controlled trial. Lancet. 2005;366:225–233. doi: 10.1016/S0140-6736(05)66912-7. [DOI] [PubMed] [Google Scholar]
- Ma Q.-X., Shan H., Zhang H.-L., Li G.-M., Yang R.-M., Chen J.-M. Potential utilities of mask-wearing and instant hand hygiene for fighting SARS-CoV-2. J. Med. Virol. 2020 doi: 10.1002/jmv.25805. [DOI] [PMC free article] [PubMed] [Google Scholar]
- Maechler M., Rousseeuw P., Croux C., Todorov V., Ruckstuhl A., Salibian-Barrera M., Verbeke T., Koller M., Conceicao E.L.T., Anna di Palma M. 2019. robustbase: Basic Robust Statistics. [Google Scholar]
- Mahalanobis P.C. On the generalized distance in statistics. Proc. Natl. Inst. Sci. India. 1936;2:49–55. [Google Scholar]
- Maronna R.A., Martin R.D., Yohai V.J., Salibián-Barrera M. John Wiley & Sons; 2019. Robust Statistics: Theory and Methods (With R) [Google Scholar]
- Martín-Fernández J.A., Barceló-Vidal C., Pawlowsky-Glahn V. Dealing with zeros and missing values in compositional data sets using nonparametric imputation. Math. Geol. 2003;35:253–278. doi: 10.1023/A:1023866030544. [DOI] [Google Scholar]
- Martín-Fernández J.A., Palarea-Albaladejo J., Olea R.A. Compositional Data Analysis. John Wiley & Sons, Ltd; Chichester, UK: 2011. Dealing with zeros; pp. 43–58. [DOI] [Google Scholar]
- Martín-Fernández J.A., Hron K., Templ M., Filzmoser P., Palarea-Albaladejo J. Model-based replacement of rounded zeros in compositional data: classical and robust approaches. Comput. Stat. Data Anal. 2012;56:2688–2704. doi: 10.1016/J.CSDA.2012.02.012. [DOI] [Google Scholar]
- Martín-Fernández J.-A., Hron K., Templ M., Filzmoser P., Palarea-Albaladejo J. Bayesian-multiplicative treatment of count zeros in compositional data sets. Stat. Model. An Int. J. 2015;15:134–158. doi: 10.1177/1471082X14535524. [DOI] [Google Scholar]
- Nash J.E., Sutcliffe J.V. River flow forecasting through conceptual models part I — a discussion of principles. J. Hydrol. 1970;10:282–290. doi: 10.1016/0022-1694(70)90255-6. [DOI] [Google Scholar]
- Palarea-Albaladejo J., Martín-Fernández J.A. A modified EM alr-algorithm for replacing rounded zeros in compositional data sets. Comput. Geosci. 2008;34:902–917. doi: 10.1016/J.CAGEO.2007.09.015. [DOI] [Google Scholar]
- Palarea-Albaladejo J., Martín-Fernández J.A. zCompositions — R package for multivariate imputation of left-censored data under a compositional approach. Chemom. Intell. Lab. Syst. 2015;143:85–96. doi: 10.1016/J.CHEMOLAB.2015.02.019. [DOI] [Google Scholar]
- Palarea-Albaladejo J., Martin-Fernandez J.A. 2020. Treatment of Zeros, Left-Censored and Missing Values in Compositional Data Sets. [Google Scholar]
- Palarea-Albaladejo J., Martín-Fernández J.A., Gómez-García J. A parametric approach for dealing with compositional rounded zeros. Math. Geol. 2007;39:625–645. doi: 10.1007/s11004-007-9100-1. [DOI] [Google Scholar]
- Patel S.K., Pradhan M.R., Patel S. Water, sanitation, and hygiene (WASH) conditions and their association with selected diseases in urban India. J. Popul. Soc. Stud. 2020;28:103–115. doi: 10.25133/JPSSv28n2.007. [DOI] [Google Scholar]
- Pérez-Foguet A., Giné-Garriga R. Analyzing water poverty in basins. Water Resour. Manag. 2011;25:3595–3612. doi: 10.1007/s11269-011-9872-4. [DOI] [Google Scholar]
- Pérez-Foguet A., Giné-Garriga R., Ortego M.I.I. Compositional data for global monitoring: the case of drinking water and sanitation. Sci. Total Environ. 2017;590–591:554–565. doi: 10.1016/j.scitotenv.2017.02.220. [DOI] [PubMed] [Google Scholar]
- Prüss-Ustün A., Bartram J., Clasen T., Colford J.M., Cumming O., Curtis V., Bonjour S., Dangour A.D., De France J., Fewtrell L., Freeman M.C., Gordon B., Hunter P.R., Johnston R.B., Mathers C., Mäusezahl D., Medlicott K., Neira M., Stocks M., Wolf J., Cairncross S. Burden of disease from inadequate water, sanitation and hygiene in low- and middle-income settings: a retrospective analysis of data from 145 countries. Trop. Med. Int. Heal. 2014;19:894–905. doi: 10.1111/tmi.12329. [DOI] [PMC free article] [PubMed] [Google Scholar]
- Prüss-Ustün A., Wolf J., Bartram J., Clasen T., Cumming O., Freeman M.C., Gordon B., Hunter P.R., Medlicott K., Johnston R. Burden of disease from inadequate water, sanitation and hygiene for selected adverse health outcomes: an updated analysis with a focus on low- and middle-income countries. Int. J. Hyg. Environ. Health. 2019;222:765–777. doi: 10.1016/j.ijheh.2019.05.004. [DOI] [PMC free article] [PubMed] [Google Scholar]
- Quispe-Coica A., Pérez-Foguet A. XXXVI Congreso Interamericano de Ingeniería Sanitaria y Ambiental. AIDIS, Guayaquil-Ecuador. 2018. Evolución del Acceso al Agua y Saneamiento en América del Sur Mediante Técnicas Estadísticas Composicionales; pp. 753–757. [Google Scholar]
- Quispe-Coica A., Pérez-Foguet A. Preprocessing alternatives for WASH estimates (R code) Zenodo. 2020 doi: 10.5281/zenodo.3909303. [DOI] [PMC free article] [PubMed] [Google Scholar]
- R Core Team . 2020. R: A Language and Environment for Statistical Computing. [Google Scholar]
- Redman-Maclaren M., Barrington D.J., Harrington H., Cram D., Selep J., Maclaren D. Water, sanitation and hygiene systems in pacific island schools to promote the health and education of girls and children with disability: a systematic scoping review. J. Water Sanit. Hyg. Dev. 2018 doi: 10.2166/washdev.2018.274. [DOI] [Google Scholar]
- Ritter A., Muñoz-Carpena R. Performance evaluation of hydrological models: statistical significance for reducing subjectivity in goodness-of-fit assessments. J. Hydrol. 2013;480:33–45. doi: 10.1016/J.JHYDROL.2012.12.004. [DOI] [Google Scholar]
- Rousseeuw P.J., van Zomeren B.C. Unmasking multivariate outliers and leverage points. J. Am. Stat. Assoc. 1990;85:633–639. doi: 10.2307/2289995. [DOI] [Google Scholar]
- Rousseeuw P., Yohai V. Robust and Nonlinear Time Series Analysis. Springer; New York, NY: 1984. Robust regression by means of S-estimators; pp. 256–272. [DOI] [Google Scholar]
- Strike K., El Emam K., Madhavji N. Software cost estimation with incomplete data. IEEE Trans. Softw. Eng. 2001;27:890–908. doi: 10.1109/32.962560. [DOI] [Google Scholar]
- Sullivan C.A. Calculating a water poverty index. World Dev. 2002;30:1195–1210. doi: 10.1016/S0305-750X(02)00035-9. [DOI] [Google Scholar]
- Sullivan C.A., Meigh J.R., Giacomello A.M., Fediw T., Lawrence P., Samad M., Mlote S., Hutton C., Allan J.A., Schulze R.E., Dlamini D.J.M., Cosgrove W., Delli Priscoli J., Gleick P., Smout I., Cobbing J., Calow R., Hunt C., Hussain A., Acreman M.C., King J., Malomo S., Tate E.L., O’Regan D., Milner S., Steyl I. The water poverty index: development and application at the community scale. Nat. Resour. Forum. 2003;27:189–199. doi: 10.1111/1477-8947.00054. [DOI] [Google Scholar]
- Templ M., Hron K., Filzmoser P. Compositional Data Analysis: Theory and Applications. John Wiley & Sons, Ltd; Chichester, UK: 2011. robCompositions: an R-package for robust statistical analysis of compositional data; pp. 341–355. [DOI] [Google Scholar]
- Templ M., Hron K., Filzmoser P., Gardlo A. Imputation of rounded zeros for high-dimensional compositional data. Chemom. Intell. Lab. Syst. 2016;155:183–190. doi: 10.1016/J.CHEMOLAB.2016.04.011. [DOI] [Google Scholar]
- Templ M., Hron K., Filzmoser P., Facevicova K., Kynclova P., Walach J., Pintar V., Chen J., Miksova D., Meindl B., Menafoglio A., Di Blasi A., Pavone F., Zeni G. 2019. Package “robCompositions.”. [Google Scholar]
- Turman-Bryant N., Clasen T.F., Fankhauser K., Thomas E.A. Measuring progress towards sanitation and hygiene targets: a critical review of monitoring methodologies and technologies. Waterlines. 2018;37:229–247. doi: 10.3362/1756-3488.18-00008. [DOI] [Google Scholar]
- UN Water . 2016. Monitoring Water and Sanitation in the 2030 Agenda for Sustainable Development. An Introd. Geneva, Switz. [Google Scholar]
- UNICEF/WHO . United Nations Children’s Fund (UNICEF) and World Health Organization; New York: 2019. Progress on Household Drinking Water, Sanitation and Hygiene 2000–2017: Special Focus on Inequalities, WHO. [Google Scholar]
- United Nations General Assembly . 2015. General Assembly Resolution A/RES/70/1. Transforming our World: The 2030 Agenda for Sustainable Development. [Google Scholar]
- van den Boogaart K.G., Tolosana-Delgado R., Bren M. 2019. Compositions: Compositional Data Analysis. [Google Scholar]
- WHO/UNICEF . World Health Organization; Geneva: 2017. Progress on Drinking Water, Sanitation and Hygiene: 2017 Update and SDG Baselines, World Health Organization and UNICEF. [Google Scholar]
- WHO/UNICEF . 2018. JMP Methodology 2017 Update & Sdg Baselines. [Google Scholar]
- WHO/UNICEF . JMP; 2019. Joint Monitoring Programme for Water Supply, Sanitation, and Hygiene: Estimates on the Use of Water, Sanitation and Hygiene in Brazil.https://washdata.org/data URL. [Google Scholar]
- WHO/UNICEF . JMP; 2019. Joint Monitoring Programme for Water Supply, Sanitation, and Hygiene: Estimates on the Use of Water, Sanitation and Hygiene in Indonesia.https://washdata.org/data URL. [Google Scholar]
- Wood S. 2019. “Mgcv”: Mixed GAM Computation Vehicle With Automatic Smoothness Estimation. [Google Scholar]
- Yang H., Bain R., Bartram J., Gundry S., Pedley S., Wright J. Water safety and inequality in access to drinking-water between rich and poor households. Environ. Sci. Technol. 2013;47:1222–1230. doi: 10.1021/es303345p. [DOI] [PubMed] [Google Scholar]
- Yohai V.J. High breakdown-point and high efficiency robust estimates for regression. Ann. Stat. 1987;15:642–656. doi: 10.1214/aos/1176350366. [DOI] [Google Scholar]
- Yohai V.J., Stahel W.A., Zamar R.H. Directions in Robust Statistics and Diagnostics. Springer; New York, New York, NY: 1991. A procedure for robust estimation and inference in linear regression; pp. 365–374. [DOI] [Google Scholar]