Abstract
β Cell apoptosis and dedifferentiation are 2 hotly debated mechanisms underlying β cell loss in type 2 diabetes; however, the molecular drivers underlying such events remain largely unclear. Here, we performed a side-by-side comparison of mice carrying β cell–specific deletion of ER-associated degradation (ERAD) and autophagy. We reported that, while autophagy was necessary for β cell survival, the highly conserved Sel1L-Hrd1 ERAD protein complex was required for the maintenance of β cell maturation and identity. Using single-cell RNA-Seq, we demonstrated that Sel1L deficiency was not associated with β cell loss, but rather loss of β cell identity. Sel1L-Hrd1 ERAD controlled β cell identity via TGF-β signaling, in part by mediating the degradation of TGF-β receptor 1. Inhibition of TGF-β signaling in Sel1L-deficient β cells augmented the expression of β cell maturation markers and increased the total insulin content. Our data revealed distinct pathogenic effects of 2 major proteolytic pathways in β cells, providing a framework for therapies targeting distinct mechanisms of protein quality control.
Keywords: Cell Biology, Metabolism
Keywords: Beta cells, Diabetes, Protein misfolding
Introduction
Type 2 diabetes (T2D) is a heterogeneous multicomponent disease, in which disease initiation and progression are triggered and propelled by pancreatic β cell dysfunction and death. Recent studies have suggested that β cells may undergo dedifferentiation into progenitor-like cells (1), losing the expression of maturation markers, such as musculoaponeurotic fibrosarcoma oncogene family, protein A (MafA) (2) and urocortin 3 (Ucn3) (3), while increasing the expression of endocrine progenitor cell markers, such as aldehyde dehydrogenase 1A3 (Aldh1a3) (4) and neurogenin 3 (Ngn3) (5). In both mouse diabetic models and humans with T2D, β cell dedifferentiation may represent an early and reversible cause of β cell loss (1, 4, 6, 7); however, its significance in disease pathogenesis remains under debate (4, 8–10). Recent studies have shown that disruption of TGF-β signaling, either genetically or pharmacologically, increases the expression of β cell maturation markers (11, 12) and reverses β cell dedifferentiation (3). These exciting findings have reignited the hope for early intervention of β cell loss in the treatment of diabetes; however, our understanding of the molecular events leading to β cell dedifferentiation remains limited (8).
The ubiquitin-proteasome system and autophagy are the 2 major intracellular proteolytic pathways. Unlike autophagy, which mediates bulk protein degradation in different cellular compartments, ER-associated degradation (ERAD) is the principal mechanism that targets ER-resident proteins for degradation by the cytosolic ubiquitin-proteasome system (13, 14). The Sel1L-Hrd1 protein complex represents the most evolutionarily conserved ERAD machinery (15), in which the single-span ER-transmembrane protein Sel1L is an obligatory cofactor for the ER-resident E3 ligase Hrd1 (16–19). Using cell type–specific animal models, recent studies from several groups, including ours, have shown that mammalian Sel1L-Hrd1 ERAD mediates indispensable homeostatic processes, such as immune cell development, systemic water balance, food intake, and energy metabolism, in a largely substrate-specific manner (20–28). However, the physiological significance of ERAD in β cells has remained largely unclear. Here, we report a surprising finding linking Sel1L-Hrd1 ERAD to the maintenance of β cell identity through suppression of TGF-β signaling, without affecting β cell survival and proliferation.
Results
ERAD expression in β cells.
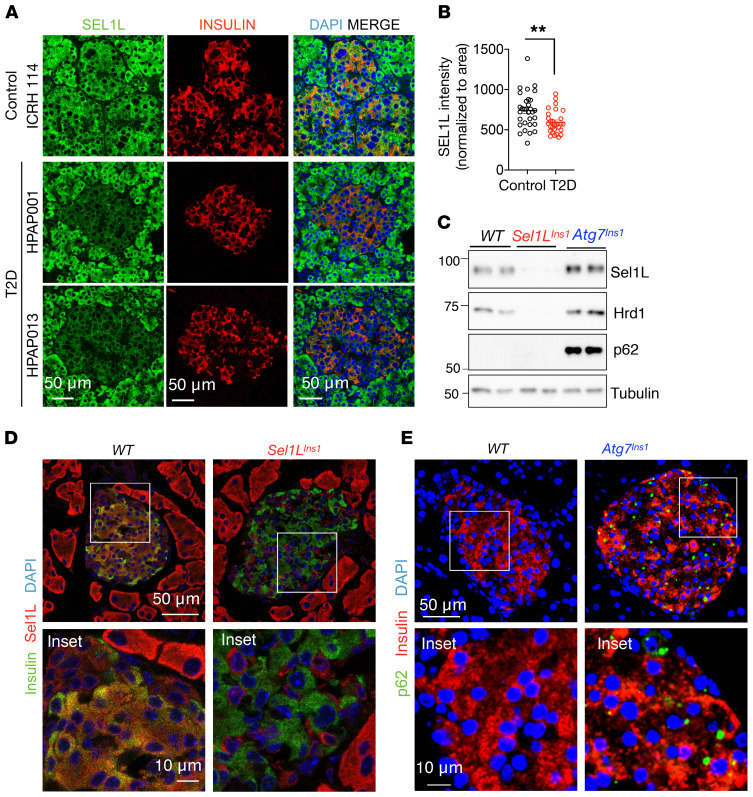
Sel1L and Hrd1 (encoded by the Syvn1 gene) were ubiquitously expressed among different islet cell types, including α, β, δ, and γ cells, as revealed by single-cell RNA-Seq (scRNA-Seq) analysis of WT mouse islets (Supplemental Figure 1, A and B; supplemental material available online with this article; https://doi.org/10.1172/JCI134874DS1). Both Sel1L and Hrd1 proteins were detected in insulin-positive murine β cells (Supplemental Figure 1, C and D). In human pancreas, Sel1L expression was lower in T2D islets than in healthy islets (Figure 1, A and B, with patient information in Supplemental Table 1).
Figure 1. SEL1L expression in human β cells and generation of β cell–specific Sel1L- and Atg7-deficient mice.
(A and B) Representative immunofluorescence images of SEL1L (A) in human pancreas obtained from healthy and T2D donors (n = 4 sample each) and quantified (B, each dot represents an islet). (C) Western blot analyses in primary islets (n = 2 mice for each genotype). Tubulin was used as loading control. (D and E) Representative immunofluorescence images of Sel1L and insulin (D) and p62 and insulin (E) in pancreatic sections (n = 2 mice for each genotype). Insets are shown in the lower panels. Values are shown as mean ± SEM. **P < 0.01, unpaired Student’s t test.
Generation of β cell–specific Sel1L-knockout mice.
To elucidate the physiological role of Sel1L-Hrd1 ERAD in β cells, we generated β cell–specific Sel1L-knockout (Sel1LIns1) mice by crossing Sel1L-floxed (Sel1Lfl/fl) mice (16) with Ins1-Cre–knockin mice (29). Sel1L protein level was largely abolished in β cells of Sel1LIns1 mice as was Hrd1 protein (Figure 1, C and D), which was indicative of compromised Sel1L-Hrd1 ERAD function in Sel1LIns1 β cells. To assess the relative importance of ERAD in β cells, we performed a side-by-side comparison of Sel1LIns1 mice with β cell–specific autophagy-deficient mice (Atg7Ins1), generated using the same breeding strategy. The known autophagy substrate p62 was highly elevated in Atg7Ins1 islets, as detected by Western blot (Figure 1C) and immunostaining (Figure 1E). In the studies below, age- and sex-matched Sel1LIns1 and Atg7Ins1 mice were compared with their own Sel1Lfl/fl and Atg7fl/fl littermates (collectively named as the WT cohort for simplicity, as there was no difference between them).
Progressive hyperglycemia and glucose intolerance of Sel1LIns1 and Atg7Ins1 mice.
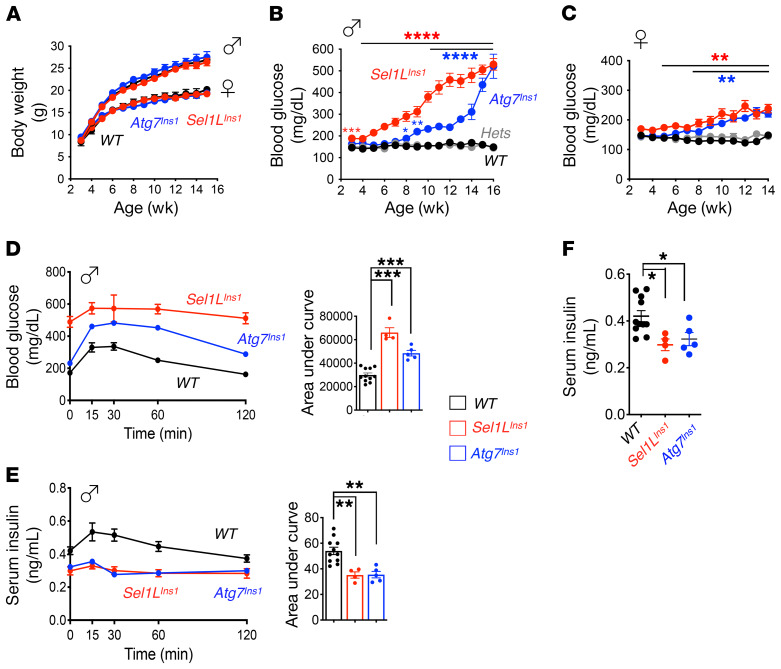
Although indistinguishable from their WT littermates in appearance (including body weight; Figure 2A), both male and female Sel1LIns1 mice progressively developed hyperglycemia after weaning (Figure 2, B and C). In line with previous studies in which the RIP-Cre line was used (30, 31), Atg7 deletion in β cells also had no effect on body weight, but both sexes of such animals developed progressive hyperglycemia starting at 8 to 9 weeks of age (Figure 2, A–C). The onset of hyperglycemia in these mice was delayed by approximately 1 month in comparison with that in Sel1LIns1 mice. Of note, both sexes of heterozygous Sel1Lf/+;Ins1-Cre (Sel1LIns1/+) or Atg7Ins1/+ littermates, collectively termed hets, remained normoglycemic with age, similarly to WT littermates (Figure 2, B and C), thus excluding the possible effects of Sel1L, Atg7, or Ins1 haploinsufficiency in β cell function in vivo.
Figure 2. Similarly to what occurs in Atg7 deficiency, β cell–specific deletion of Sel1L leads to early onset progressive hyperglycemia and glucose intolerance.
(A) Growth curves of male and female mice (n = 12 mice per group per sex per time point). (B and C) Weekly measurements of ad libitum blood glucose in male (B) and female (C) mice (n = 12 mice per group per time point). (D and E) Intraperitoneal glucose tolerance test in 10-week-old male mice showing glucose (D) and insulin (E) levels at indicated times (n = 4–8 mice each group), with quantitation of AUC shown on the right. (F) Fasting serum insulin levels in 10-week-old male mice (n = 4–8 mice each group). Values are shown as mean ± SEM. *P < 0.05; **P < 0.01; ***P < 0.001; ****P < 0.0001, 1-way ANOVA.
In line with the trend of progressive hyperglycemia, Sel1LIns1 mice developed glucose intolerance several weeks earlier than Atg7Ins1 mice (Supplemental Figure 2, A and B). By 10 weeks of age, both Sel1LIns1 and Atg7Ins1 mice were glucose intolerant (Figure 2D and Supplemental Figure 2, C and D), with reduced in vivo glucose-stimulated insulin secretion (Figure 2E) and lower fasting serum insulin levels (Figure 2F). Peripheral tissues, such as liver, white adipose tissue (WAT), and brown adipose tissue (BAT), all appeared indistinguishable from that in WT cohorts (Supplemental Figure 3). Thus, similar to autophagy, Sel1L-Hrd1 ERAD is also indispensable for cell function; however, the onset of hyperglycemia and glucose intolerance in Sel1LIns1 mice precedes that in Atg7Ins1 mice.
Sel1L-Hrd1 ERAD is dispensable for β cell survival.
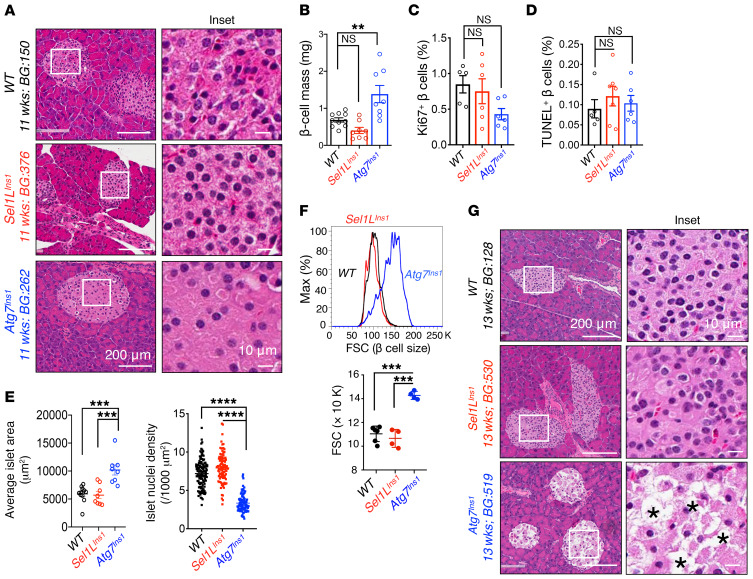
To understand the mechanism underlying β cell dysfunction in these animal models, we first evaluated islet histology in cohorts with mild hyperglycemia (~200–300 mg/dL glucose level). Morphometric analysis of islets revealed no significant changes in Sel1LIns1 islets in terms of morphology and β cell mass, while Atg7Ins1 mice had increased β cell mass (Figure 3, A and B). However, cell proliferation and apoptosis, as measured by Ki67+ and TUNEL+ β cells, respectively, were comparable among the 3 cohorts (Figure 3, C and D, and Supplemental Figure 4, A and B). In contrast, unlike Sel1LIns1 islets, Atg7Ins1 islets had a markedly expanded cell size, with increased nucleus-to-nucleus distance (i.e., reduced nuclear density) in islets (Figure 3, A and E), indicative of cytoplasmic swelling or cell hypertrophy rather than hyperplasia in the absence of autophagy. This surprising finding was further confirmed using flow cytometry measurements of the forward scatter (FSC), i.e., cell size (Figure 3F), and immunostaining with cell surface marker E-cadherin (Supplemental Figure 4C). Moreover, when blood glucose reached levels indicating severe hyperglycemia, Atg7Ins1 mice exhibited extensive vacuolization and β cell loss (Figure 3G), as previously described (30, 31). In contrast, even under severe hyperglycemia, Sel1LIns1 islets did not exhibit vacuolization or β cell loss (Figure 3G).
Figure 3. Unlike Atg7 deficiency, loss of Sel1L does not lead to β cell loss.
(A) Representative H&E images of pancreatic sections obtained from mice with mild hyperglycemia (n = 5–6 for each genotypes). Age and blood glucose (BG) for the particular samples shown are indicated. (B) Quantitation of β cell mass at 8 to 12 weeks of age (n = 8–10 mice per group). Quantitation of (C) Ki67+ and (D) TUNEL+ cells per insulin-positive β cells (n = 5–6 mice per group). (E) Quantitation of islet area (left, n = 8–11 mice per group) and nuclear density (right, n = 150–200 islets from 5 mice each) at 8 to 11 weeks of age. Each dot represents 1 mouse (left) or an islet (right). (F) Flow cytometric analysis of β cell size as indicated by FSC (n = 4–6 mice per group). Quantitation shown below. (G) Representative H&E images of pancreatic sections obtained from mice with severe hyperglycemia (>500 mg/dL) (n = 5–6 for each genotypes); Asterisks indicate vacuolization. Values are shown as mean ± SEM. **P < 0.01; ***P < 0.001; ****P < 0.0001, 1-way ANOVA.
Lack of cell death in Sel1LIns1 islets prompted us to assess the activation of the IRE1α branch of the unfolded protein response (UPR), a key regulator of β cell survival and function (32–34). In line with our previous finding that the UPR sensor IRE1α is a substrate of Sel1L-Hrd1 ERAD (25), IRE1α protein accumulated by 3- to 4-fold in Sel1LIns1 islets (Supplemental Figure 5A); however, no significant activation of IRE1α was observed in Sel1LIns1 islets, as measured by levels of IRE1α phosphorylation using the Phos-tag approach (refs. 35, 36, and Supplemental Figure 5B) and Xbp-1 mRNA splicing (Supplemental Figure 5C). The modest effect of Sel1L deletion on ER homeostasis was likely due to the induction of ER chaperones, such as BiP and calnexin (Supplemental Figure 5A), leading to cellular adaptation as previously reported (20, 21).
Recent in vitro studies using β cell lines suggested that Sel1L-Hrd1 ERAD may be involved in proinsulin degradation and maturation (37, 38). Much to our surprise, in contrast to what these studies showed, we did not observe any significant changes in proinsulin maturation in Sel1LIns1 islets, as demonstrated by the pulse-chase labeling of primary islets to follow nascent proinsulin biogenesis (Supplemental Figure 5D). Immunofluorescence colabeling of proinsulin with the ER chaperone BiP further showed that proinsulin was able to mature beyond the ER (Supplemental Figure 5E). Moreover, although insulin content in primary islets was lower, glucose-stimulated insulin secretion in vitro was not defective in Sel1LIns1 islets (Supplemental Figure 5, F and G). After normalizing for insulin content, insulin secretion was even slightly elevated in Sel1LIns1 islets (Supplemental Figure 5H). Hence, the Sel1L effect in β cells is uncoupled from cell survival, ER stress, and insulin secretion.
Downregulation of mature β cell markers in Sel1LIns1 mice.
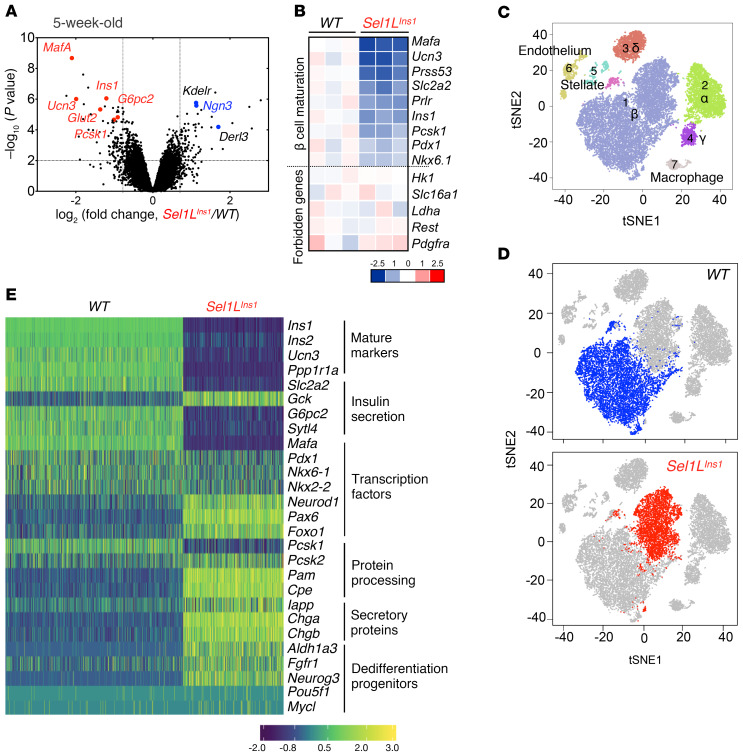
To explore how Sel1L deficiency caused β cell dysfunction, we next performed nonbiased genome-wide cDNA microarray of purified primary islets from 5-week-old mice. Unexpectedly, the endocrine progenitor cell marker Ngn3 was among the top upregulated genes, while β cell–specific maturation markers, such as MafA (39), Ucn3 (40), Glut2, Ins1, and Ins2, were among the top downregulated genes (Figure 4, A and B), indicative of immature β cells. In comparison, forbidden or disallowed genes known to prevent inappropriate insulin release, such as Hk1, Slc16a1, Ldha, Rest, and Pdgfra (41), were unchanged in Sel1LIns1 islets (Figure 4B).
Figure 4. Nonbiased sequencing analyses establish the importance of Sel1L-Hrd1 ERAD in β cell identity.
(A and B) Results from cDNA microarray analysis of islets from 5-week-old mice (n = 3 mice each group). (A) Volcano plot depicting transcriptomics data with dotted line marking P = 0.05 on y axis and fold change of greater than 2 on x axis. (B) Heatmap showing log-fold change of mature β cell markers and forbidden genes. (C–E) Results from scRNA-Seq of islets from 7-week-old male mice (n = 2 mice each group). (C and D) Visualization of t-SNE plots generated by unsupervised clustering analysis presented as merged (C) or individual (D) data sets. In D, β cell population is highlighted. Each dot corresponds to a single cell. (E) Gene expression changes of representative β cell markers associated with different processes.
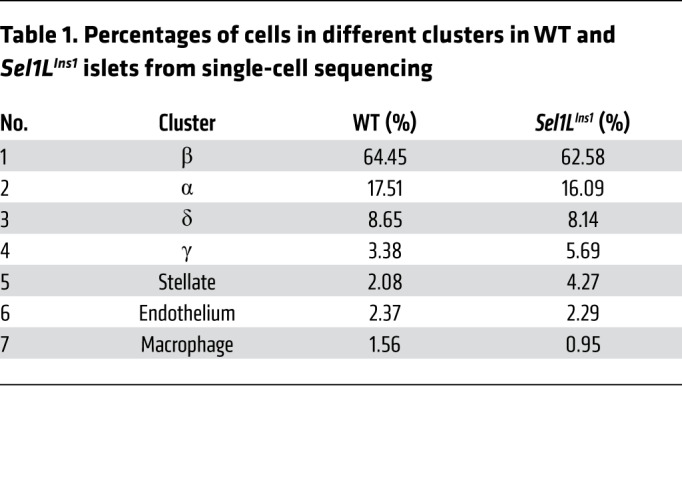
To further define the impact of Sel1L deficiency at the single-cell level, we performed scRNA-Seq analysis of islets from 7-week-old littermates. Unbiased projection of the single-cell transcriptome data identified 7 unique cell clusters, with β, α, δ, and pancreatic polypeptide (γ) cells as the major clusters (Supplemental Figure 6, A and B). The percentages of β cells were comparable (at approximately 62%–64%) between Sel1LIns1 and WT islets (Table 1). Dramatically, the bulk of Sel1LIns1 β cells clustered as a distinct population from WT β cells, indicating significant changes in the transcriptional landscape in the absence of Sel1L (Figure 4, C and D). Expression of mature β cell markers, such as Ins1, Ins2, Ucn3, and MafA, were reduced in the Sel1LIns1 β cell cluster, with concomitant increase in expression of dedifferentiation markers, such as Aldh1a3 and the progenitor marker Ngn3 (Figure 4E).
Table 1. Percentages of cells in different clusters in WT and Sel1LIns1 islets from single-cell sequencing.
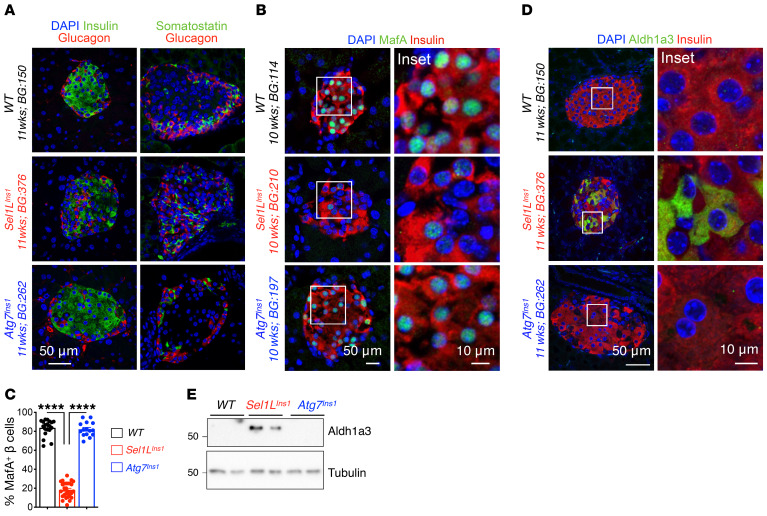
We next confirmed the changes in β cell identity in Sel1LIns1 islets using immunofluorescence staining and Western blotting. Insulin staining was reduced in Sel1LIns1 islets, with glucagon-positive α and somatostatin-positive δ cells scattered within the core of adult Sel1LIns1 islets in contrast to their peripheral localization in WT islets (Figure 5A). Both MafA and Ucn3 were significantly reduced in Sel1LIns1 β cells compared with those of WT littermates (Figure 5, B and C, and Supplemental Figure 7). On the other hand, expression of Aldh1a3, a marker of endocrine progenitor cells and dedifferentiated β cells in mice (6), was highly elevated in Sel1LIns1 islets (Figure 5, D and E). These changes were specific for Sel1LIns1 islets and absent in Atg7Ins1 islets (Figure 5 and Supplemental Figure 7).
Figure 5. Sel1L deficiency leads to downregulation of maturation markers and upregulation of immature markers in adult β cells.
(A) Representative immunofluorescence image showing major islet hormones (insulin, glucagon, and somatostatin; DAPI in blue) in pancreatic sections of WT, Sel1LIns1, and Atg7Ins1 mice (n = 3 mice each). (B–D) Representative immunofluorescence image showing staining of (B) maturation marker MafA with quantitation in C (n = 3 mice, each dot represents an islet), and (D) dedifferentiation marker Aldh1a3 in indicated genotypes. (E) Western blot analysis of Aldh1a3 in primary islets. Values are shown as mean ± SEM. ****P < 0.0001, 1-way ANOVA.
β Cell development is not affected in Sel1LIns1 mice.
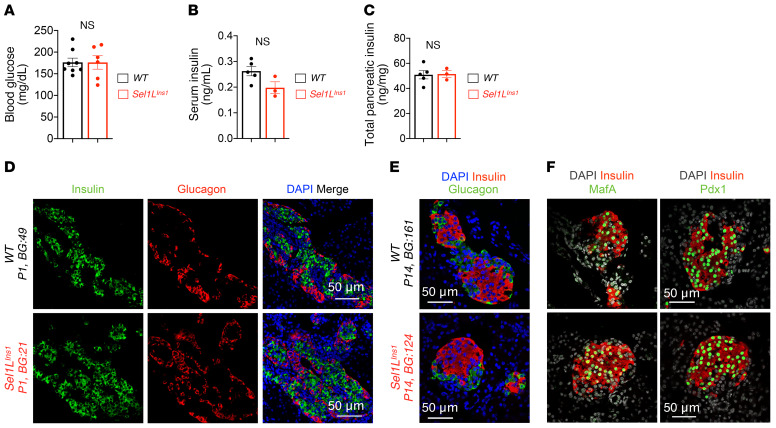
We next asked whether Sel1L deficiency triggered a β cell developmental defect. At P14, blood glucose, serum insulin, and total pancreatic insulin content in Sel1LIns1 mice were comparable to those of WT littermates (Figure 6, A–C). Moreover, the expression of insulin and glucagon in Sel1LIns1 islets was robust at both P1 and P14 (Figure 6, D and E). Similarly to what occurred with WT littermates, Sel1LIns1 islets at P14 had normal islet architecture, with α cells at the periphery (Figure 6E). Furthermore, expression and localization of transcription factors MafA and Pdx1 were comparable between the cohorts at P14 (Figure 6F). Hence, β cell development is unaffected by Sel1L deficiency.
Figure 6. Sel1L deficiency does not affect β cell development.
(A) Blood glucose, (B) serum insulin, and (C) total pancreatic insulin content in P14 pups. (D and E) Representative immunofluorescence images of insulin and glucagon at P1 (D) and P14 (E) (DAPI in blue, n = 3 mice for each genotype). (F) Representative immunofluorescence images of β cell transcription factors MafA and Pdx1 in P14 pups (DAPI in gray, n = 3 mice for each genotype). Values are shown as mean ± SEM. NS, not significant by unpaired Student’s t test.
Elevated TGF-β signaling in Sel1LIns1 β cells.
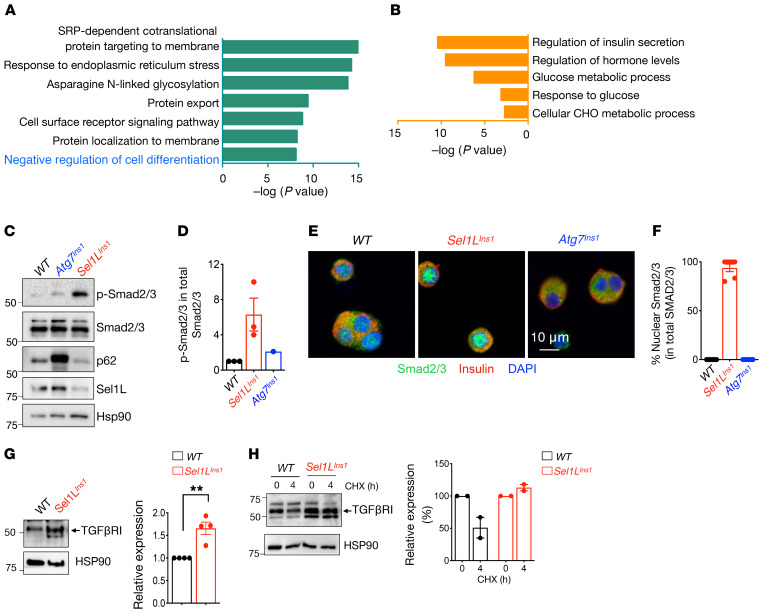
To further delineate the link between ERAD and β cell dedifferentiation, we performed pathway analysis of significantly up- and downregulated genes in both scRNA-Seq and cDNA profiling data sets. Consistent with the notion of resetting ER homeostasis or adaptation to Sel1L deficiency, genes associated with protein processing, folding, and export in the ER were highly upregulated in Sel1LIns1 β cells (Figure 7A). In contrast, genes associated with regulation of insulin secretion and glucose metabolism were among the most downregulated (Figure 7B). Intriguingly, we noted a significant enrichment of negative regulation of cell differentiation pathways, including TGF-β and WNT signaling pathways, among the upregulated genes in scRNA-Seq (Figure 7A) and TGF-β signaling pathways in bulk cDNA microarray analyses (Supplemental Figure 8A). Indeed, expression of TGF-β–activated genes, such as Nedd9 and Smurf1, was increased while that of TGF-β–repressed genes, such as Cited2 and Plat, was reduced in Sel1LIns1 β cells (Supplemental Figure 8B).
Figure 7. Elevated TGF-β signaling in Sel1L-deficient islets.
(A and B) GO analyses of scRNA-Seq data showing significantly upregulated (A) and downregulated (B) pathways in Sel1LIns1 versus Sel1Lfl/fl β cells. (C) Western blot analysis of total and phosphorylated Smad2/3 in primary islets (with quantitation in D, n = 3 independent repeats for Sel1LIns1 and 1 experiment for Atg7Ins1). (E) Representative confocal microscopic images of Smad2/3 in β cells from primary islets (with quantitation in F, 2 independent repeats). (G) Western blot analysis of TGF-βRI in isolated WT and Sel1LIns1 islets (with quantification on the right, n = 4 mice). **P < 0.01, unpaired Student’s t test. (H) Cyclohexamide (CHX) chase of TGF-βRI protein in isolated islets following 4 hours of chase (with quantitation on the right, 2 independent repeats, data shown as normalized to basal 0 hour levels).
TGF-β binding to its receptors triggers the phosphorylation and nuclear translocation of its downstream effectors Smad2/3 (42). Indeed, both phosphorylation and nuclear localization of Smad2/3 were elevated in Sel1LIns1 islets (Figure 7, C–F). These data strongly support the notion of increased TGF-β signaling in Sel1LIns1 islets. In comparison, Atg7Ins1 islets did not show significant changes in Smad2/3 phosphorylation or nuclear translocation (Figure 7, C–F), indicating that increased TGF-β signaling is specific to Sel1L deficiency in β cells.
TGF-β receptor 1 is an endogenous ERAD substrate in β cells.
To explore the possible mechanism underlying increased TGF-β signaling in Sel1L-deficient β cells, we measured the levels of TGF-β receptor 1 (TGF-βRI) in isolated islets and found that TGF-βRI protein levels and stability were increased in the absence of Sel1L (Figure 7, G and H). In vitro, Hrd1 readily interacted with TGF-βRI and also ubiquitinated TGF-βRI in an E3 ligase activity–dependent manner (Supplemental Figure 8C). Hence, Sel1L-Hrd1 ERAD may regulate TGF-β signaling in β cells, at least in part via targeting TGF-βRI for proteasomal degradation.
TGF-β signaling links Sel1L to dedifferentiation.
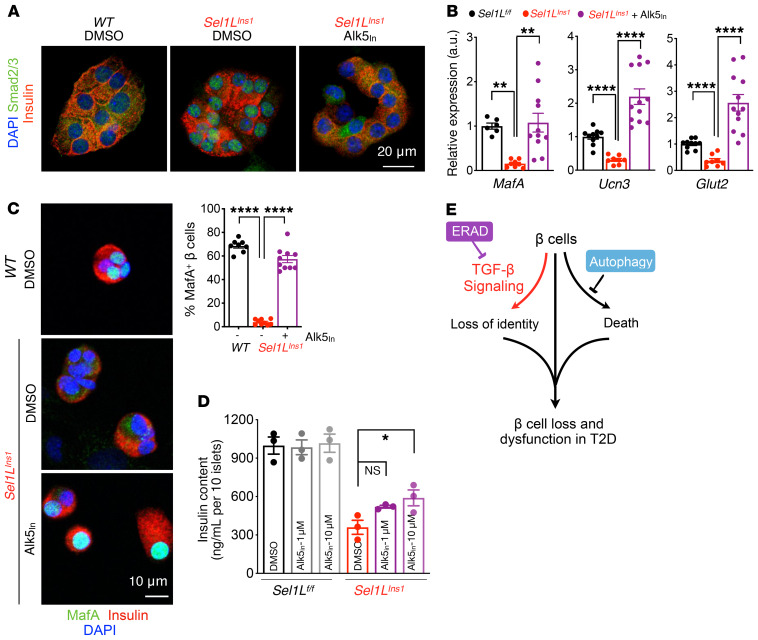
To establish the causal relationship between altered TGF-β signaling and β cell dedifferentiation in Sel1LIns1 islets, we next treated isolated Sel1LIns1 islets with TGF-βRI–specific inhibitor (ALK5 inhibitor II [Alk5in]). Inhibition of TGF-βRI caused a significant reduction in the levels of phospho-Smad2/3 (Supplemental Figure 9A) and nuclear exclusion of Smad2/3 proteins in Sel1LIns1 islets (Figure 8A). Moreover, inhibition of TGF-βRI significantly increased the gene expression of maturation markers, such as MafA, Glut2, and Ucn3, in Sel1LIns1 islets (Figure 8B), and protein levels of MafA (Figure 8C and Supplemental Figure 9B). Indeed, a short-term treatment with the TGF-βRI inhibitor increased insulin content in Sel1LIns1 islets (Figure 8D). Thus, Sel1L-Hrd1 ERAD regulates β cell identity by suppressing TGF-β signaling in β cells.
Figure 8. TGF-β signaling links Sel1L to β cell identity.
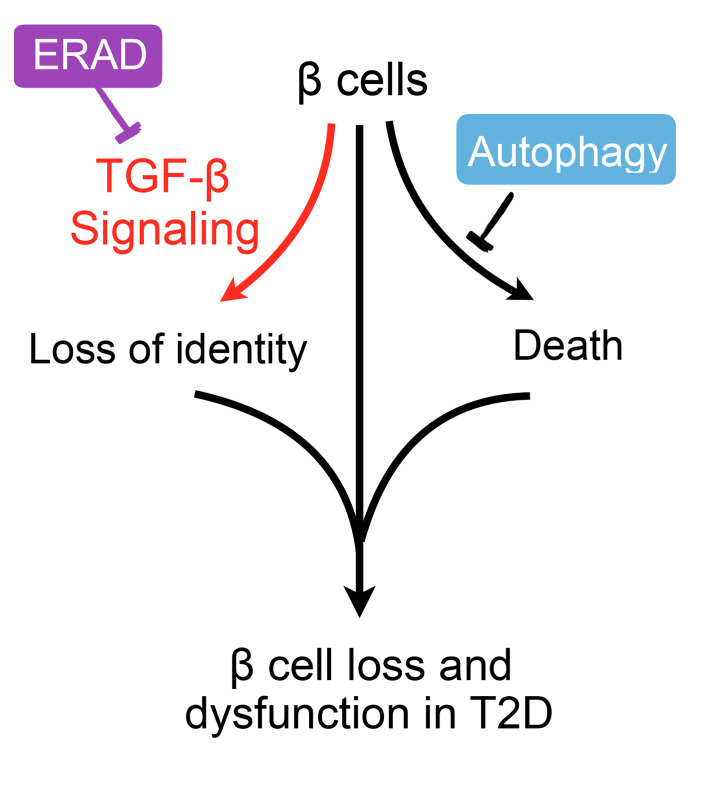
(A and B) Representative immunofluorescence images of Smad2/3 and insulin (2 independent repeats) (A) and qRT-PCR analysis of β cell gene expression (B) in primary islets treated with vehicle or 10 μM TGF-βRI inhibitor (Alk5in) for 24 hours. qRT-PCR data normalized to WT vehicle controls, from n = 3 biological replicates per genotype. (C) Representative confocal microscopic images of MafA in dispersed primary islets treated with vehicle (DMSO) or TGF-βRI inhibitor Alk5in (2 independent experiments, wider field of view shown in Supplemental Figure 9B). **P < 0.01; ****P < 0.0001, 1-way ANOVA. (D) Insulin content in primary islets following treatment with either DMSO or indicated dose of TGF-βRI inhibitor for 24 hours (n = 3). *P < 0.05, 2-way ANOVA. (E) Model for distinct effects of ERAD and autophagy in β cell failure in T2D pathogenesis: while autophagy controls cell survival, ERAD maintains β cell identity by suppressing TGF-β signaling. Values are shown as mean ± SEM.
Discussion
Cellular proteostasis has been implicated in the maintenance of β cell function and the pathogenesis of diabetes (43). The current paradigm of the field states that disturbance of ER homeostasis is causally linked to proinsulin maturation defects and β cell death (44). However, our data demonstrate that, unlike autophagy and UPR (32–34, 45, 46), ERAD is required for maintenance of β cell identity while having no significant effect on cell survival. Hence, these principal quality-control mechanisms, ERAD, UPR, and autophagy, play distinct roles in β cells in T2D pathogenesis (Figure 8E).
Loss of β cell identity or dedifferentiation is an emerging concept in the pathogenesis of diabetes (8). It has been proposed that β cells may undergo dedifferentiation as a result of persistent hyperglycemia (47). However, another recent study showed that lowering hyperglycemia in a db/db model fails to reverse β cell dedifferentiation (48). Here, our data show that Sel1L-Hrd1 ERAD plays a key role in the maintenance of β cell identity by suppressing the TGF-β signaling pathway. Inhibition of TGF-β signaling in Sel1L-deficient β cells enhances the expression of β cell maturation markers and insulin content. In direct contrast, despite being severely hyperglycemic, autophagy-deficient mice do not exhibit markers of dedifferentiation. Together, these data suggest that β cell dedifferentiation in the absence of Sel1L-Hrd1 ERAD is causally linked to elevated TGF-β signaling and is not merely a result of an adaptive response to hyperglycemia.
Our data demonstrate that ER protein degradation by ERAD represents a primary mechanism in the maintenance of β cell identity rather than β cell loss (which is more prominent with autophagy deficiency). Boosting the activity of SEL1L-HRD1 ERAD, in combination with modulating autophagy, may represent a superior strategy for protecting β cells in the treatment of T2D. We speculate that downregulation of SEL1L in human T2D islets may allow β cells to undergo dedifferentiation. Future investigation into this question will inevitably advance this exciting line of research.
Methods
Mice.
Sel1Lfl/fl mice (16) and Atg7fl/fl (49) mice on a C57BL/6J background were crossed with B6(Cg)-Ins1tm1.1(cre)Thor/J (Ins1Cre, JAX 026801) (29) mice on a C57BL/6J background to generate β cell–specific Sel1L (Sel1LIns1) and Atg7-deficient (Atg7Ins1) mice with respective control littermates (Sel1Lfl/fl and Atg7fl/fl). Atg7fl/fl mice were provided by Rajat Singh (Albert Einstein College of Medicine, New York, New York, USA) with the permission of Masaaki Komatsu and Keiji Tanaka (Tokyo Metropolitan Institute of Medical Science, Tokyo, Japan). Ins1Cre mice were provided by Scott Soleimanpour (University of Michigan). For some experiments, heterozygous Sel1LIns1/+ and Atg7Ins/+ mice were also generated as littermates for Sel1LIns1 and Atg7Ins1 mice. For Figure 2, data from both Sel1Lfl/fl and Atg7fl/fl control littermates were compiled for the WT control littermates and data from Sel1LIns1/+ and Atg7Ins/+ were compiled for the heterozygous control. All mice were housed in an ambient temperature room with a 12-hour light/12-hour dark cycle and fed a normal-chow diet (13% fat, 57% carbohydrate, and 30% protein; LabDiet, 5LOD). Weekly measurements of body weight and glucose were performed at the same time of the day for consistency.
Human samples and quantification.
Paraffin-embedded pancreatic sections from cadaveric donors, including nondiabetic controls and T2D patients, were obtained from the Human Islet Resource Center at the University of Pennsylvania. Donor information is presented in Supplemental Table 1. The intensity of SEL1L fluorescence was quantified using Fiji software (NIH). In brief, we delimited the area of the islet using the plugin ROI manager. In each islet, the SEL1L signal was extracted from the green channel as integrated fluorescence intensity. We divided the integrated intensity by the area of the ROI to estimate the fluorescent intensity.
Generation of Sel1L-specific antibody.
The cDNA sequence corresponding to the truncated human SEL1L (hSEL1L; amino acids 20 to 260) was subcloned into the pET28a(+) plasmid to allow for the expression of the recombinant His6-hSEL1L proteins in BL21(DE3) bacterial cells upon IPTG induction at 16°C for 16 hours. Recombinant His6-hSEL1L proteins were purified using Ni-NTA column chromatography followed by Superdex 200 size exclusion column chromatography. The polyclonal antibody was generated by immunizing rabbits with the recombinant hSEL1L proteins and further affinity purified using the same antigen coupled to cyanogen bromide–activated sepharose.
Glucose tolerance tests and in vivo glucose-stimulated insulin secretion.
Mice were fasted for 6 hours before the experiment. For intraperitoneal glucose tolerance test, blood was taken via tail nick. Basal blood glucose was sampled and glucose administered intraperitoneally at a dose of 1.5 mg/kg body weight. Blood glucose was then measured at 15, 30, 60, and 120 minutes after glucose administration using OneTouch Ultra glucose strips. Serum was collected at the same time for insulin measurements using ultrasensitive ELISA (Crystal Chem, 90080) per the manufacturer’s instruction.
Pancreatic insulin content.
Pancreata were isolated, weighed, placed into 2 mL of acid-ethanol solution (1.5% HCl in 75% [v/v] ethanol in water), and homogenized for 30 seconds. The homogenate was rotated for 24 hours at 4°C for insulin extraction. After centrifugation at 1800 g for 30 minutes at 4°C, supernatant was diluted and insulin content was measured as above.
H&E staining and morphometric analyses of islets.
Pancreata were isolated, fixed in 10% neutral buffered formalin (VWR 95042-908) overnight at 4°C, and processed by the University of Michigan Comprehensive Cancer Center for paraffin embedding, sectioning, and H&E staining. Slides were imaged and analyzed using the Aperio Scanscope (Leica Biosystems). For β cell mass, 5 randomly selected sections at least 200 μm apart per pancreas were used. Insulin-stained pancreatic sections were imaged at ×20 using a Nikon A1 wide-field microscope at the University of Michigan Morphology and Image Analysis Core. Total insulin-positive area measured using the thresholding feature by ImageJ (NIH) was then divided by the total pancreas area and multiplied by the weight of the pancreas to obtain β cell mass. To analyze islet area, islet size was measured manually based on morphology using the Aperio scanscope and expressed as average islet area. For islet nuclei density, total number of nuclei were quantified in 150 to 200 islets from 5 mice of each genotype. Islet nuclear density was expressed as the number of nuclei per 1000 μm2 area. All areas and cell quantification were processed with ImageJ software.
Proliferation and TUNEL assay.
Paraffin-embedded pancreas sections were costained with Ki67 (Abcam, 15580; 1:100) and insulin (Bio-Rad, 5330-0104G; 1:100), as previously described (50). TUNEL assay was performed per the manufacturer’s protocol using the In-Situ Cell Death Detection Kit (Roche, 11684795910). Insulin costaining was performed to identify β cells. Images were acquired using a Nikon A1 confocal microscope at the University of Michigan Morphology and Image Analysis Core from 45 to 80 islets per animal, which represented 1500 to 3000 β cells per mouse. β Cell proliferation and apoptosis were calculated as percentages of Ki67- and TUNEL-positive cells, respectively, per total number of insulin-positive cells.
Immunofluorescence staining.
Paraffin-embedded pancreas sections were deparaffinized in xylene and rehydrated using graded ethanol series (100%, 90%, 70%), followed by rinse in distilled water. Antigen retrieval was performed by boiling the slides in a microwave in either sodium citrate or EDTA. Sections were then incubated in a blocking solution (5% donkey serum, 0.3% Triton X-100 in PBS) for 1 hour at room temperature and with primary antibodies overnight at 4°C in a humidifying chamber. For MafA staining, cryosections were used. For staining with primary islets, purified islets were dissociated into single-cell suspension using trypsin for 3 to 5 minutes at 37°C and seeded in an 8-well chamber (Nunc Lab-Tek II chamber slide; 12-565-8) for 24 hours before fixation. Cells were fixed in 4% PFA (EMS 15710) for 20 minutes and permeabilized in 0.3% PBST for 10 minutes, followed by blocking in 5% donkey serum for 1 hour at room temperature. The following primary antibodies were used: Sel1L (1:200), p62 (Enzo, catalog BML-PW9860; 1:500), insulin (Bio-Rad, catalog 5330-0104G; 1:5000), glucagon (MilliporeSigma, catalog G2654; 1:500), somatostatin (Abcam, catalog ab30788; 1:200), Aldh1a3 (Novus Biologicals, catalog NBP2-15339; 1:100), MafA (Novus Biologicals, catalog NBP1-00121; 1:100), Ucn3 (provided by Mark Huising (University of California, Davis, Davis, CA, USA); 1:1000), Pdx1 (Cell Signaling Technology, catalog 5679; 1:100) Smad2/3 (Cell Signaling Technology, catalog 8685; 1:1000), proinsulin (DSHB, catalog GS-9A8; 1:100), E-Cadherin (BD 610181; 1:500), and BiP (Abcam, catalog 21685; 1:500). Hrd1 antibody (1:200) was provided by Richard Wojcikiewicz (State University of New York Upstate Medical University, Syracuse, New York, USA). The next day, following 3 washes with PBST (0.03% Triton X-100 in PBS), slides were incubated with the respective Alexa Fluor–conjugated to secondary antibodies (Jackson ImmunoResearch; dilution 1:500) for 1 hour at room temperature, followed by mounting with VECTASHIELD mounting medium containing DAPI (Vector Laboratories, H-1500). Images were captured using a Nikon A1 confocal microscope at the University of Michigan Morphology and Image Analysis Core.
Islet isolation and inhibitor treatments.
Pancreatic islets were isolated from mice as previously described (50). Briefly, mice were sacrificed by cervical dislocation and immediately processed for pancreatic perfusion. The pancreas was distended via the intraductal injection of 3 mL of Liberase and incubated at 37°C for 12 minutes in an additional 1 mL of digestion solution. Liberase solution was prepared by dissolving 5 mg Liberase TL (Roche, 5401020001) in 20 mL of serum-free RPMI (Fisher, 11875-085). Digestion was stopped by adding cold media containing 10% FBS. After gentle shaking for complete dissociation and brief centrifugation, the digested suspension was passed through a nylon mesh and islets were isolated by density gradient centrifugation on a Histopaque gradient (1.077 g/mL density; MilliporeSigma) for 20 minutes at 900 g without braking. Islets were then collected from the interface, washed, and hand-picked under a dissecting microscope. Isolated islets were recovered overnight in RPMI 1640 medium in a humidified incubator (95% air, 5% CO2) at 37°C. For experiments with the TGF-βRI inhibitor, islets from 5- to 6-week-old mice were cultured with Alk5 inhibitor II (10 μM; Cayman, 14794) or vehicle (DMSO) for 24 hours.
Flow cytometry.
Mouse islets were isolated and cultured with RPMI 1640 medium overnight, then dissociated with 0.5% Trypsin-EDTA. Cells were washed with PBS, fixed in 4% PFA at 4°C for 15 minutes, and permeabilized with a BD Cytofix/Cytoperm kit according to the manufacturer’s protocol. Cells were stained with anti-glucagon antibody (MilliporeSigma, clone K79bB10; 1:100), followed by Alexa Fluor–conjugated secondary antibody (Jackson ImmunoResearch; 1:200). Samples were analyzed using a BD LSR cell analyzer at the Vision Research Core Facility at the University of Michigan Medical School. The glucagon-negative cell population was gated to analyze cell size. Data were analyzed using CellQuest software (BD Biosciences) and FlowJo.
Western blot.
Following an overnight recovery, islets were lysed in lysis buffer (50 mM Tris/Cl pH 7.4, 1 mM EDTA, 1× complete protease inhibitor [MilliporeSigma], 1× PhosSTOP [MilliporeSigma]), followed by brief sonication. Protein concentrations were determined using the Pierce BCA Protein Assay Kit (Thermo Fisher Scientific). Proteins were heat denatured at 65°C for 10 minutes in NuPAGE LDS sample buffer (Thermo Fisher Scientific), resolved by SDS-PAGE, and transferred to PVDF membranes (Bio-Rad). The membranes were incubated overnight at 4°C with antibodies prepared in 2% BSA (MilliporeSigma). The antibodies used were as follows: α-tubulin (Santa Cruz Biotechnology Inc., catalog sc-5286; 1:2000); Sel1L (Abcam, catalog ab78298; 1:1000); BiP (Abcam, catalog ab21685; 1:5000), Calnexin (Cell Signaling Technology, catalog 2679; 1:1000), Aldh1a3 (Novus Biologicals, catalog NBP2-15339; 1:1000), Hrd1 (Richard Wojcikiewicz, 1:300), Smad2/3 (Cell Signaling Technology, catalog 8685; 1:1000), pSmad2/3 (Cell Signaling Technology, catalog 138D4 and 9520; 1:1000), p62 (Enzo, catalog BML-PW9860; 1:5000), TGF-βRI (Abcam, catalog ab31013; 1:1000), Hsp90 (Abcam, catalog ab13492; 1:2000), and insulin (Bio-Rad, catalog 5330-0104G, 1:5000). Secondary antibodies were goat anti-rabbit IgG-HRP and anti-mouse IgG-HRP (1:5000; Bio-Rad). Phos-tag analysis of IRE1α phosphorylation was performed as previously described (35, 51).
RNA extraction, microarray, cDNA synthesis, and qPCR analysis.
Islets were collected from 5-week-old mice and recovered overnight before RNA extraction. RNA was extracted using RNeasy Micro Kit (QIAGEN), including a column for elimination of genomic DNA as per the manufacturer’s instructions. RNA concentration was determined using the NanoDrop 2000 UV-Vis Spectrophotometer. The quality and concentration were determined using the RNA 6000 Nano Kit on an Agilent 2100 bioanalyzer. The microarray was performed as previously described (25). Reverse-transcriptase PCR (RT-PCR) for Xbp1 mRNA splicing and quantitative PCR (qPCR) analysis were performed as previously described (52). All PCR data were normalized to the ribosomal L32 and Actin gene expression levels. qPCR primer sequences were as follows: Actin, forward: CCCGCGAGTACAACCTTCT, reverse: CGTCATCCATGGCGAACT; L32, forward: GAGCAACAAGAAAACCAAGCA, reverse: TGCACACAAGCCATCTACTCA; MafA, forward: ATCTGTACTGGATGAGCGGG, reverse: AGAGTGATGATGGTGGGCAG; Glut2, forward: CTGCACCATCTTCATGTCGG, reverse: AATTGCAGACCCAGTTGCTG; Ucn3, forward: TGATGCCCACCTACTTCCTG, reverse: GGTGCGTTTGGTTGTCATCT; and Xbp1s, forward: TTACGAGAGAAAACTCATGGGC, reverse: GGGTCCAACTTGTCCAGAATGC.
scRNA-Seq.
Islets were harvested from 7-week-old mice and recovered overnight. Cell suspension was prepared by trypsinization of islets in trypsin (Corning, 25-053-Cl) diluted in calcium-free PBS containing 1 mM EDTA for 15 minutes and immediately submitted for library preparation. A total of 26,061 pancreatic islet cells isolated from 2 Sel1Lfl/fl and 2 Sel1LIns1 mice were processed using 10× Genomics CHROMIUM Single Cell 3′ Solution at the sequencing core at the University of Michigan following the manufacturer’s guidelines. Libraries were sequenced using the Illumina HiSeq 4000 platform. Sequencing raw reads were processed through demultiplexing, mapping, and analysis by the pipeline in Cell Ranger, version 3.0.0. A total of over 2 billion (2,352,307,194 reads) reads with an average of 90,261 reads per cell were obtained. Approximately 78.8% of the sequence reads were confidently mapped to the mouse transcriptome. Seurat package (version 2.3.4) was used to further analyze scRNA-seq data (53). After removing doublets and cells with low quality (high mitochondrial content or low sequencing depth), 18,612 cells that expressed more than 500 genes and 19,074 genes with transcripts detected in more than 3 cells were used for further analysis. Unique sequencing reads for each gene were normalized to total unique molecular identifiers (UMIs) in each cell to obtain normalized UMI values. Unsupervised clustering was applied at a resolution of 0.2 using the top 17 dimensions of PCA. Cell cluster identification was based on the prior knowledge of marker genes. The t-distributed stochastic neighbor embedding plots, violin plots, feature plots, and heatmaps were generated by R 3.5.3 software. All original microarray and RNA-Seq data were deposited in the NCBI’s Gene Expression Omnibus database (GEO GSE143757 and GSE137785, respectively).
For additional information, see Supplemental Methods.
Statistics.
Results are expressed as mean ± SEM unless otherwise stated. Statistical analyses were performed using GraphPad Prism (GraphPad Software Inc.). Comparisons between 2 groups were made by unpaired 2-tailed Student’s t test. One-way ANOVA followed by Bonferroni’s post test was used to determine statistical significance for more than 2 groups with 2 factors. P values of less than 0.05 were considered statistically significant. All experiments were repeated at least twice or performed with several independent biological samples, and representative data are shown.
Study approval.
All animal procedures were approved by and done in accordance with protocols of the IACUC at the University of Michigan Medical School (PRO00008989).
Author contributions
NS designed and performed most of the experiments. TL and JDL performed scRNA-Seq data analysis and contributed discussion. XL and ML performed pulse chase of proinsulin. YJ made the initial crosses of Sel1L-knockout mice and performed flow cytometry. RBR performed some confocal microscopy experiments and provided helpful discussions. MT performed the experiment with Phos-tag gels. MZ performed some data quantification. SK performed microarray analyses. CL and AN provided human pancreatic sections and performed immunostaining on 1 set of human samples. CCAH and CHAT generated the SEL1L antibody. PA provided discussion and key reagents and was involved in the experimental design. LQ designed and supervised the project. LQ and NS wrote the manuscript. All other authors edited and approved the manuscript.
Supplementary Material
Acknowledgments
We thank Richard Wojcikiewicz, Mark Huising, Alnawaz Rehemtulla, Rajat Singh, Masaaki Komatsu, Keiji Tanaka, and Scott Soleimanpour for reagents and members of the Qi/Arvan laboratories for comments and technical assistance. Human sample analysis was performed with funding provided by the Human Pancreas Analysis Program (HPAP) (http://hpap.pmacs.upenn.edu/citation) (supported by the National Institute of Diabetes and Digestive and Kidney Diseases [NIDDK]) as part of the Human Islet Research Network (HIRN, RRID:SCR_014393; http://hirnetwork.org) (grant UC4 DK112217 to AN). Confocal microscopy and image analysis were completed at the Michigan Diabetes Research Center’s Microscopy, Imaging and Cellular Physiology Core, supported by NIH NIDDK grant P30DK020572. This work was supported by NIH grants 1R01CA163910 (to CCAH), 1R24DK110973 (to PA), 1R01DK11174 (to PA and LQ), R01DK110047, and R01DK117639; Juvenile Diabetes Research Foundation grant 2-SRA-2018-539-A-B (to PA and LQ); and American Diabetes Association (ADA) grant 1-19-IBS-235 (to LQ). YJ is in part supported by American Heart Association Scientist Development grant 17SDG33670192 and Michigan Nutrition Obesity Research Center (MNORC) Pilot/Feasibility grant (P30DK089503). RBR is supported by the Training Program in Endocrinology and Metabolism (5T32DK007245). MT was supported in part by the Pew Latin American Postdoctoral Fellowship. LQ is the recipient of Junior Faculty and Career Development Awards from the ADA.
Version 1. 03/17/2020
In-Press Preview
Version 2. 05/26/2020
Electronic publication
Version 3. 07/01/2020
Print issue publication
Footnotes
Conflict of interest: The authors have declared that no conflict of interest exists.
Copyright: © 2020, American Society for Clinical Investigation.
Reference information: J Clin Invest. 2020;130(7):3499–3510.https://doi.org/10.1172/JCI134874.
Contributor Information
Neha Shrestha, Email: nsstha@med.umich.edu.
Tongyu Liu, Email: ltongyu@umich.edu.
Yewei Ji, Email: ywji@umich.edu.
Mauricio Torres, Email: mtorresg@med.umich.edu.
Xin Li, Email: xinlium@umich.edu.
Maria Zhang, Email: marszha@umich.edu.
Chih-Hang Anthony Tang, Email: ctang@wistar.org.
Chih-Chi Andrew Hu, Email: chu@wistar.org.
Chengyang Liu, Email: chliu@mail.med.upenn.edu.
Ali Naji, Email: ali.naji@uphs.upenn.edu.
Ming Liu, Email: mingli@umich.edu.
Jiandie D. Lin, Email: jdlin@umich.edu.
Sander Kersten, Email: Sander.kersten@wur.nl.
Peter Arvan, Email: parvan@umich.edu.
Ling Qi, Email: lingq@med.umich.edu.
References
- 1.Talchai C, Xuan S, Lin HV, Sussel L, Accili D. Pancreatic β cell dedifferentiation as a mechanism of diabetic β cell failure. Cell. 2012;150(6):1223–1234. doi: 10.1016/j.cell.2012.07.029. [DOI] [PMC free article] [PubMed] [Google Scholar]
- 2.Guo S, et al. Inactivation of specific β cell transcription factors in type 2 diabetes. J Clin Invest. 2013;123(8):3305–3316. doi: 10.1172/JCI65390. [DOI] [PMC free article] [PubMed] [Google Scholar]
- 3.Blum B, et al. Reversal of β cell de-differentiation by a small molecule inhibitor of the TGFβ pathway. Elife. 2014;3:e02809. doi: 10.7554/eLife.02809. [DOI] [PMC free article] [PubMed] [Google Scholar]
- 4.Cinti F, et al. Evidence of β-cell dedifferentiation in human type 2 diabetes. J Clin Endocrinol Metab. 2016;101(3):1044–1054. doi: 10.1210/jc.2015-2860. [DOI] [PMC free article] [PubMed] [Google Scholar]
- 5.Diedisheim M, et al. Modeling human pancreatic beta cell dedifferentiation. Mol Metab. 2018;10:74–86. doi: 10.1016/j.molmet.2018.02.002. [DOI] [PMC free article] [PubMed] [Google Scholar]
- 6.Kim-Muller JY, et al. Aldehyde dehydrogenase 1a3 defines a subset of failing pancreatic β cells in diabetic mice. Nat Commun. 2016;7:12631. doi: 10.1038/ncomms12631. [DOI] [PMC free article] [PubMed] [Google Scholar]
- 7.Wang YJ, et al. Single-cell transcriptomics of the human endocrine pancreas. Diabetes. 2016;65(10):3028–3038. doi: 10.2337/db16-0405. [DOI] [PMC free article] [PubMed] [Google Scholar]
- 8.Weir GC, Aguayo-Mazzucato C, Bonner-Weir S. β-cell dedifferentiation in diabetes is important, but what is it? Islets. 2013;5(5):233–237. doi: 10.4161/isl.27494. [DOI] [PMC free article] [PubMed] [Google Scholar]
- 9.Butler AE, et al. β-Cell deficit in obese type 2 diabetes, a minor role of β-cell dedifferentiation and degranulation. J Clin Endocrinol Metab. 2016;101(2):523–532. doi: 10.1210/jc.2015-3566. [DOI] [PMC free article] [PubMed] [Google Scholar]
- 10.Md Moin AS, Dhawan S, Cory M, Butler PC, Rizza RA, Butler AE. Increased frequency of hormone negative and polyhormonal endocrine cells in lean individuals with type 2 diabetes. J Clin Endocrinol Metab. 2016;101(10):3628–3636. doi: 10.1210/jc.2016-2496. [DOI] [PMC free article] [PubMed] [Google Scholar]
- 11.Lin HM, et al. Transforming growth factor-beta/Smad3 signaling regulates insulin gene transcription and pancreatic islet beta-cell function. J Biol Chem. 2009;284(18):12246–12257. doi: 10.1074/jbc.M805379200. [DOI] [PMC free article] [PubMed] [Google Scholar]
- 12.Rezania A, et al. Production of functional glucagon-secreting α-cells from human embryonic stem cells. Diabetes. 2011;60(1):239–247. doi: 10.2337/db10-0573. [DOI] [PMC free article] [PubMed] [Google Scholar]
- 13.Guerriero CJ, Brodsky JL. The delicate balance between secreted protein folding and endoplasmic reticulum-associated degradation in human physiology. Physiol Rev. 2012;92(2):537–576. doi: 10.1152/physrev.00027.2011. [DOI] [PMC free article] [PubMed] [Google Scholar]
- 14.Hampton RY, Sommer T. Finding the will and the way of ERAD substrate retrotranslocation. Curr Opin Cell Biol. 2012;24(4):460–466. doi: 10.1016/j.ceb.2012.05.010. [DOI] [PubMed] [Google Scholar]
- 15.Hampton RY, Gardner RG, Rine J. Role of 26S proteasome and HRD genes in the degradation of 3-hydroxy-3-methylglutaryl-CoA reductase, an integral endoplasmic reticulum membrane protein. Mol Biol Cell. 1996;7(12):2029–2044. doi: 10.1091/mbc.7.12.2029. [DOI] [PMC free article] [PubMed] [Google Scholar]
- 16.Sun S, et al. Sel1L is indispensable for mammalian endoplasmic reticulum-associated degradation, endoplasmic reticulum homeostasis, and survival. Proc Natl Acad Sci U S A. 2014;111(5):E582–E591. doi: 10.1073/pnas.1318114111. [DOI] [PMC free article] [PubMed] [Google Scholar]
- 17.Gardner RG, et al. Endoplasmic reticulum degradation requires lumen to cytosol signaling. Transmembrane control of Hrd1p by Hrd3p. J Cell Biol. 2000;151(1):69–82. doi: 10.1083/jcb.151.1.69. [DOI] [PMC free article] [PubMed] [Google Scholar]
- 18.Mueller B, Lilley BN, Ploegh HL. SEL1L, the homologue of yeast Hrd3p, is involved in protein dislocation from the mammalian ER. J Cell Biol. 2006;175(2):261–270. doi: 10.1083/jcb.200605196. [DOI] [PMC free article] [PubMed] [Google Scholar]
- 19.Christianson JC, et al. Defining human ERAD networks through an integrative mapping strategy. Nat Cell Biol. 2011;14(1):93–105. doi: 10.1038/ncb2383. [DOI] [PMC free article] [PubMed] [Google Scholar]
- 20.Qi L, Tsai B, Arvan P. New insights into the physiological role of endoplasmic reticulum-associated degradation. Trends Cell Biol. 2017;27(6):430–440. doi: 10.1016/j.tcb.2016.12.002. [DOI] [PMC free article] [PubMed] [Google Scholar]
- 21.Hwang J, Qi L. Quality control in the endoplasmic reticulum: crosstalk between ERAD and UPR pathways. Trends Biochem Sci. 2018;43(8):593–605. doi: 10.1016/j.tibs.2018.06.005. [DOI] [PMC free article] [PubMed] [Google Scholar]
- 22.Shi G, et al. ER-associated degradation is required for vasopressin prohormone processing and systemic water homeostasis. J Clin Invest. 2017;127(10):3897–3912. doi: 10.1172/JCI94771. [DOI] [PMC free article] [PubMed] [Google Scholar]
- 23.Kim GH, et al. Hypothalamic ER-associated degradation regulates POMC maturation, feeding, and age-associated obesity. J Clin Invest. 2018;128(3):1125–1140. doi: 10.1172/JCI96420. [DOI] [PMC free article] [PubMed] [Google Scholar]
- 24.Ji Y, et al. The Sel1L-Hrd1 endoplasmic reticulum-associated degradation complex manages a key checkpoint in B cell development. Cell Rep. 2016;16(10):2630–2640. doi: 10.1016/j.celrep.2016.08.003. [DOI] [PMC free article] [PubMed] [Google Scholar]
- 25.Sun S, et al. IRE1α is an endogenous substrate of endoplasmic-reticulum-associated degradation. Nat Cell Biol. 2015;17(12):1546–1555. doi: 10.1038/ncb3266. [DOI] [PMC free article] [PubMed] [Google Scholar]
- 26.Sun S, et al. Epithelial Sel1L is required for the maintenance of intestinal homeostasis. Mol Biol Cell. 2016;27(3):483–490. doi: 10.1091/mbc.e15-10-0724. [DOI] [PMC free article] [PubMed] [Google Scholar]
- 27.Bhattacharya A, et al. Hepatic Sel1L-Hrd1 ER-associated degradation (ERAD) manages FGF21 levels and systemic metabolism via CREBH. EMBO J. 2018;37(22):e99277. doi: 10.15252/embj.201899277. [DOI] [PMC free article] [PubMed] [Google Scholar]
- 28.Bhattacharya A, Qi L. ER-associated degradation in health and disease - from substrate to organism. J Cell Sci. 2019;132(23):jcs232850. doi: 10.1242/jcs.232850. [DOI] [PMC free article] [PubMed] [Google Scholar]
- 29.Thorens B, Tarussio D, Maestro MA, Rovira M, Heikkilä E, Ferrer J. Ins1(Cre) knock-in mice for beta cell-specific gene recombination. Diabetologia. 2015;58(3):558–565. doi: 10.1007/s00125-014-3468-5. [DOI] [PMC free article] [PubMed] [Google Scholar]
- 30.Jung HS, et al. Loss of autophagy diminishes pancreatic beta cell mass and function with resultant hyperglycemia. Cell Metab. 2008;8(4):318–324. doi: 10.1016/j.cmet.2008.08.013. [DOI] [PubMed] [Google Scholar]
- 31.Ebato C, et al. Autophagy is important in islet homeostasis and compensatory increase of beta cell mass in response to high-fat diet. Cell Metab. 2008;8(4):325–332. doi: 10.1016/j.cmet.2008.08.009. [DOI] [PubMed] [Google Scholar]
- 32.Lee AH, Heidtman K, Hotamisligil GS, Glimcher LH. Dual and opposing roles of the unfolded protein response regulated by IRE1alpha and XBP1 in proinsulin processing and insulin secretion. Proc Natl Acad Sci U S A. 2011;108(21):8885–8890. doi: 10.1073/pnas.1105564108. [DOI] [PMC free article] [PubMed] [Google Scholar]
- 33.Hassler JR, et al. The IRE1α/XBP1s pathway is essential for the glucose response and protection of β cells. PLoS Biol. 2015;13(10):e1002277. doi: 10.1371/journal.pbio.1002277. [DOI] [PMC free article] [PubMed] [Google Scholar]
- 34.Xu T, et al. The IRE1α-XBP1 pathway regulates metabolic stress-induced compensatory proliferation of pancreatic β-cells. Cell Res. 2014;24(9):1137–1140. doi: 10.1038/cr.2014.55. [DOI] [PMC free article] [PubMed] [Google Scholar]
- 35.Yang L, Xue Z, He Y, Sun S, Chen H, Qi L. A Phos-tag-based approach reveals the extent of physiological endoplasmic reticulum stress. PLoS One. 2010;5(7):e11621. doi: 10.1371/journal.pone.0011621. [DOI] [PMC free article] [PubMed] [Google Scholar]
- 36.Qi L, Yang L, Chen H. Detecting and quantitating physiological endoplasmic reticulum stress. Meth Enzymol. 2011;490:137–146. doi: 10.1016/B978-0-12-385114-7.00008-8. [DOI] [PMC free article] [PubMed] [Google Scholar]
- 37.Xu B, et al. Estrogens promote misfolded proinsulin degradation to protect insulin production and delay diabetes. Cell Rep. 2018;24(1):181–196. doi: 10.1016/j.celrep.2018.06.019. [DOI] [PMC free article] [PubMed] [Google Scholar]
- 38.Hu Y, et al. Endoplasmic reticulum-associated degradation (ERAD) has a critical role in supporting glucose-stimulated insulin secretion in pancreatic β-cells. Diabetes. 2019;68(4):733–746. doi: 10.2337/db18-0624. [DOI] [PubMed] [Google Scholar]
- 39.Hang Y, et al. The MafA transcription factor becomes essential to islet β-cells soon after birth. Diabetes. 2014;63(6):1994–2005. doi: 10.2337/db13-1001. [DOI] [PMC free article] [PubMed] [Google Scholar]
- 40.Blum B, Hrvatin S, Schuetz C, Bonal C, Rezania A, Melton DA. Functional beta-cell maturation is marked by an increased glucose threshold and by expression of urocortin 3. Nat Biotechnol. 2012;30(3):261–264. doi: 10.1038/nbt.2141. [DOI] [PMC free article] [PubMed] [Google Scholar]
- 41.Schuit F, et al. β-cell-specific gene repression: a mechanism to protect against inappropriate or maladjusted insulin secretion? Diabetes. 2012;61(5):969–975. doi: 10.2337/db11-1564. [DOI] [PMC free article] [PubMed] [Google Scholar]
- 42.Massagué J. TGFβ signalling in context. Nat Rev Mol Cell Biol. 2012;13(10):616–630. doi: 10.1038/nrm3434. [DOI] [PMC free article] [PubMed] [Google Scholar]
- 43.Herbert TP, Laybutt DR. A reevaluation of the role of the unfolded protein response in islet dysfunction: maladaptation or a failure to adapt? Diabetes. 2016;65(6):1472–1480. doi: 10.2337/db15-1633. [DOI] [PubMed] [Google Scholar]
- 44.Ghosh R, Colon-Negron K, Papa FR. Endoplasmic reticulum stress, degeneration of pancreatic islet β-cells, and therapeutic modulation of the unfolded protein response in diabetes. Mol Metab. 2019;27S:S60–S68. doi: 10.1016/j.molmet.2019.06.012. [DOI] [PMC free article] [PubMed] [Google Scholar]
- 45.Zhang W, Feng D, Li Y, Iida K, McGrath B, Cavener DR. PERK EIF2AK3 control of pancreatic beta cell differentiation and proliferation is required for postnatal glucose homeostasis. Cell Metab. 2006;4(6):491–497. doi: 10.1016/j.cmet.2006.11.002. [DOI] [PubMed] [Google Scholar]
- 46.Tsuchiya Y, et al. IRE1-XBP1 pathway regulates oxidative proinsulin folding in pancreatic β cells. J Cell Biol. 2018;217(4):1287–1301. doi: 10.1083/jcb.201707143. [DOI] [PMC free article] [PubMed] [Google Scholar]
- 47.Wang Z, York NW, Nichols CG, Remedi MS. Pancreatic β cell dedifferentiation in diabetes and redifferentiation following insulin therapy. Cell Metab. 2014;19(5):872–882. doi: 10.1016/j.cmet.2014.03.010. [DOI] [PMC free article] [PubMed] [Google Scholar]
- 48.Ishida E, Kim-Muller JY, Accili D. Pair feeding, but not insulin, phloridzin, or rosiglitazone treatment, curtails markers of β-cell dedifferentiation in db/db mice. Diabetes. 2017;66(8):2092–2101. doi: 10.2337/db16-1213. [DOI] [PMC free article] [PubMed] [Google Scholar]
- 49.Komatsu M, et al. Impairment of starvation-induced and constitutive autophagy in Atg7-deficient mice. J Cell Biol. 2005;169(3):425–434. doi: 10.1083/jcb.200412022. [DOI] [PMC free article] [PubMed] [Google Scholar]
- 50.Ji Y, et al. Toll-like receptors TLR2 and TLR4 block the replication of pancreatic β cells in diet-induced obesity. Nat Immunol. 2019;20(6):677–686. doi: 10.1038/s41590-019-0396-z. [DOI] [PMC free article] [PubMed] [Google Scholar]
- 51.Kinoshita E, Kinoshita-Kikuta E, Takiyama K, Koike T. Phosphate-binding tag, a new tool to visualize phosphorylated proteins. Mol Cell Proteomics. 2006;5(4):749–757. doi: 10.1074/mcp.T500024-MCP200. [DOI] [PubMed] [Google Scholar]
- 52.Sha H, et al. The IRE1alpha-XBP1 pathway of the unfolded protein response is required for adipogenesis. Cell Metab. 2009;9(6):556–564. doi: 10.1016/j.cmet.2009.04.009. [DOI] [PMC free article] [PubMed] [Google Scholar]
- 53.Satija R, Farrell JA, Gennert D, Schier AF, Regev A. Spatial reconstruction of single-cell gene expression data. Nat Biotechnol. 2015;33(5):495–502. doi: 10.1038/nbt.3192. [DOI] [PMC free article] [PubMed] [Google Scholar]
Associated Data
This section collects any data citations, data availability statements, or supplementary materials included in this article.


