Abstract
This study investigated the effects of culture time on phenotype stability of canine articular chondrocytes (CACs) in non-passaged long-term monolayer culture. Third passage (P3) CACs isolated from four cartilage samples were seeded at three different initial seeding densities (0.2 × 10⁴, 1.0 × 10⁴ and 5.0 × 10⁴ cells/cm2) and maintained in monolayer condition up to 8 weeks without undergoing subculture after confluence. The characteristic changes of chondrocytes during the culture period were evaluated based on the cell morphology, cell proliferation, glycosaminoglycans (GAGs) content, DNA quantification, mRNA expression and ultrastructure of chondrocytes. Chondrocytes maintained under post-confluence condition exhibited a capability to grow and proliferate up to 4 weeks. Alcian blue staining and Dimethylmethylene blue (DMMB) assay revealed that the extracellular matrix (ECM) synthesis was increased in a time-dependent manner from 2 to 8 weeks. The chondrocyte mRNA expression profile was dramatically affected by prolonged culture time, with a significant downregulation of collagen type I, whereas the expression of collagen type II, aggrecan, Sox9 and matrix metalloproteinase 13 (MMP-13) were significantly upregulated. In addition, transmission electron microscopy (TEM) result indicated dilation of rough endoplasmic reticulum (RER) in these long-term monolayer cultured chondrocytes. These findings demonstrate that the chondrocytes phenotype could be partially redifferentiated through the spontaneous redifferentiation process in long-term cultures using standard culture medium without the addition of chondrogenic supplements or tissue-culture scaffolds.
Keywords: articular chondrocyte, chondrocyte redifferentiation, long-term culture, monolayer culture, tissue engineering
Articular cartilage is hyaline cartilage, which is composed of few cellular components and dense extracellular matrix (ECM) comprising of water, collagens, glycosaminoglycans (GAGs), proteoglycans and other non-collagenous proteins. Cartilage has a unique structure that lacks blood vessels and nerve supply, while consisting of only a single type of cellular component called chondrocytes [2, 41]. Chondrocytes are low proliferative cells responsible for cartilage homeostasis by regulating and producing ECM contents [35, 46]. This unique and complex structure of cartilage has resulted in limited self-regeneration capacity, where traumatic injuries or diseases could cause a permanent defect on cartilage. Furthermore, the effective treatment or restoration of defect cartilage is currently very limited [20, 28]. Tissue engineering is a prospective strategy whose primary objective is to provide an alternative solution to restore the structure and function of cartilage defects. Currently, cell-based approaches used in the treatment of cartilage defects include microfracture, autografts and autologous chondrocyte implantation [12, 29, 30].
The cultivation of chondrocytes plays a vital role in both therapeutic interventions and research purposes, particularly in cell-based therapy, which requires a large number of cultured chondrocytes [7]. Chondrocytes cultured in two-dimensional (2D) monolayer may be the most common method for cell expansion in-vitro, as it is simple, less time consuming and a large amount of cell could be obtained. However, a large scale of the cell expansion process involves an extended culture period and multiple passaging which is directly related to the dedifferentiation process of chondrocytes [7, 11, 22, 42]. As a result of this dedifferentiation process, chondrocytes grown in monolayer are unable to maintain their phenotype and rapidly dedifferentiate to a fibroblastic-like phenotype. After repeated passaging in monolayer cultures, chondrocytes appearance changes from round or polygonal to a fibroblastic-like morphology [32, 44]. The expression of important ECM components particularly collagen type II and aggrecan are drastically reduced, while the expression of collagen type I is increased [7, 11, 22, 32]. This dedifferentiation process of chondrocytes is a significant limitation on their use in tissue engineering applications.
To overcome the limitation of conventional 2D monolayer culture, high-density monolayer and three-dimensional (3D) cultures have been used as alternative culture models. It is well documented that high density and 3D cultures are beneficial to decelerate the dedifferentiation process as well as support the redifferentiation process of dedifferentiated chondrocytes [7, 14, 22, 32, 45]. Although various culture techniques and tissue scaffolds have been established and used in tissue engineering approaches, the principle behind these methods is similar. The culture condition of these models is capable of promoting cell-cell and cell-matrix interactions, which mimic the microenvironment of chondrocytes in native articular cartilage [15, 38, 43]. However, 3D culture requires more handling technique, needs an additional cost and may limit cell number due to lower capability to promote chondrocytes proliferation, compared to conventional 2D culture [29, 32, 44]. Thus, expanded chondrocytes from 2D culture are commonly redifferentiated through 3D culture to maximize both the quality and quantity of cultured chondrocytes.
The present study focused on a strategy of expanding isolated canine articular chondrocytes (CACs) in conventional 2D culture using self-synthesis ECM and high density of cells to provide a cartilage-like condition in-vitro. This culture system imitates the microenvironment of native articular cartilage, which is more suitable for redifferentiation process of proliferated chondrocytes. In general, cultured cells should be passaged during the log phase, prior to reaching confluence. However, this study attempts to prolong the culture period beyond the confluence condition to generate high density pack of cells and an accumulation of ECM. We hypothesized that long-term culture of CACs in conventional 2D monolayer could redifferentiate the dedifferentiated chondrocytes back to their low proliferative phenotypically stable nature and ECM-rich. The purpose of this study was to investigate the effect of culture time on phenotype of cultured articular chondrocytes using CACs in non-passaged long-term monolayer culture.
MATERIALS AND METHODS
Isolation and expansion of CACs
Canine articular cartilage samples were isolated with owners’ formal consent from the femoral head of four dogs (age range 2–11 years, mean ± SD 6.3 ± 4.9; breed: 2 Beagle, 1 Pomeranian and 1 Shetland sheepdog) at Hokkaido University Veterinary Hospital. The 2 Beagles were experimental dogs that were euthanized at the end of an experimental study not related to this study, while Pomeranian and Shetland sheepdog were undergoing femoral head and neck ostectomy due to traumatic coxofemoral luxation. The use animal samples were in accordance with Hokkaido University Institutional Animal Care and Use Committee guidelines (approval #12-0059). Chondrocytes were released from articular cartilage by dissection and digestion in Dulbecco’s Modified Eagle’s Medium (DMEM; Gibco, Grand Island, NY, USA) supplemented with 0.3% collagenase type I (Wako Pure Chemicals Industries, Osaka, Japan) for 18 hr. The released chondrocytes were filtered through a nylon filter, then primary chondrocytes were expanded at a density of 1.0 × 10⁴ cells/cm2. The culture medium used for all cultures in this study was DMEM containing 10 mM HEPES (Dojindo, Kumamoto, Japan), 25 mM NaHCO3 (Wako), 100 U/ml penicillin G potassium (Wako), 73 U/ml streptomycin sulphate (Wako) and supplemented with 10% fetal bovine serum (Nichirei Biosciences Inc., Tokyo, Japan). Chondrocytes were passaged at 80–90% confluence by washing with phosphate-buffered saline (PBS) and released from culture dishes using 0.05% trypsin (Wako) in PBS.
Chondrocytes culture
In this study, third passage (P3) CACs were seeded and cultured as monolayer at different initial seeding densities of 0.2 × 10⁴ (Low seeding density; LD), 1.0 × 10⁴ (Normal seeding density; ND) and 5.0 × 10⁴ cells/cm2 (High seeding density; HD) in 12-well polystyrene culture plates (Corning, Lowell, MA, USA) at 37°C and 5% CO2 with DMEM containing 10% fetal bovine serum. The culture medium was changed twice per week and cultures were maintained under these conditions up to 8 weeks without subculturing. To confirm proliferative activity of the cells after 8 weeks, chondrocytes were subcultured once to forth passage (P4) at 1.0 × 10⁴ cells/cm2. Total cell count and cell viability were evaluated by trypan blue staining every 4 weeks. Cell morphology and confluency of cultured chondrocytes were observed under a light microscope.
Chondrocyte growth curve
The growth curve of cultured chondrocytes was evaluated by 3-(4,5-dimehylthiazolyl-2) 2,5-diphenyltetrazolium bromide (MTT; Dojindo) colorimetric assay. Chondrocytes were seeded in 96-well polystyrene culture plates (Corning) and cultured up to 168 hr. MTT assay was performed every 24 hr as follows: the cells were washed with PBS and replaced with MTT solution (0.5 mg/ml) prepared in DMEM, then culture plates were incubated for 4 hr at 37°C. The solution was then aspirated and dimethyl sulfoxide (Wako) was added to dissolve formazan crystals. The absorbance of each well was quantified at 570 nm using a microplate reader (Multiskan FC, Thermo Scientific, Vantaa, Finland). Each sample was assessed in quintuplicate at each time point.
Biochemical analysis
Cell lysates of cultured chondrocytes were collected from 12-well polystyrene culture plates every 2 weeks during the culture period for quantification of total DNA and GAGs content. After culture media was removed and washed with PBS, papain solution containing 300 µg/ml papain (Sigma-Aldrich, St. Louis, MO, USA) in 20 mM Na2HPO4 (Wako), 2 mM dithiothreitol (Wako) and 1 mM EDTA (Dojindo) was added to perform cell digestion. Digested chondrocytes were incubated with papain solution for 18 hr at 60°C. The total DNA content was quantified by Hoechst 33258 assay (Wako) with a calf thymus DNA as a standard (Sigma-Aldrich) and detected with 350/460 nm filter set. Total GAGs content quantification was performed with cell lysate and culture media to evaluate both GAGs accumulation and GAGs released in culture media. Dimethylmethylene blue (DMMB) assay (Sigma-Aldrich) was used with chondroitin sulphate as a standard (Wako) and absorbance was measured at 525 nm, then normalized with DNA content. Microplate reader (Infinite M200 Pro, Tecan, Männedorf, Switzerland) was used for measurement in both assays.
Identification of ECM
Alcian blue staining was performed in 12-well polystyrene culture plates every 2 weeks during the culture period. After culture media was removed and washed with PBS, cells were fixed with 4% formaldehyde (Wako) for 30 min. The solution of 1% alcian blue (Sigma-Aldrich) dissolved in distilled water was added into culture plates and incubated for 30 min. The staining solution was removed, cells were washed thrice with 0.1 N HCl (Wako) and once with distilled water to neutralize the acidity of HCl. A stained ECM of cultured chondrocytes was observed on both visual inspection and under a light microscope.
Gene expression analysis
Total RNA was extracted from cultured chondrocytes every week up to 8 weeks using TRIZol reagent (Invitrogen, Carlsbad, CA, USA), according to the manufacturer’s instructions. Absorbance ratio at 260/280 and 260/230 nm were used to evaluate RNA concentration and purity. Complementary DNA was synthesized by using 1 µg of RNA and reverse transcribed with Oligo (dt) 15 primer using M-MLV RT kit (Invitrogen), according to manufacturer’s recommended protocol. Real-time quantitative PCR (qPCR) was performed on Rotor-gene Q instrument (Qiagen, Hilden, Germany) using KAPA SYBR FAST qPCR kit (KAPA Biosystems, Woburn, MA, USA). Glyceraldehyde-3-phosphate dehydrogenase (GAPDH) was used as a housekeeping gene. Collagen type I, collagen type II, aggrecan, Sox9 and matrix metalloproteinase 13 (MMP-13) were used to evaluate chondrocyte differentiation. The delta-delta Ct method of relative quantification was used to quantify the expression of each target gene. Primer sequences for all genes were designed according to the data published on the National Center for Biotechnology Information (NCBI) website using Primer-BLAST programs. Primer sequences, amplicon length and accession number are indicated in (Table 1).
Table 1. Sequence of primers used in the experiments.
| Name of gene | Primer sequence | Amplicon length (bp) | Accession number |
|---|---|---|---|
| GAPDH | Forward: 5′-CTGAACGGGAAGCTCACTGG-3′ | 129 | NM_001003142.1 |
| Reverse: 5′-CGATGCCTGCTTCACTACCT-3′ | |||
| Collagen type I | Forward: 5′-CATCCCAGCCAAGAACTGGT-3′ | 139 | NM_001003187.1 |
| Reverse: 5′-GAAGGCGAGTTGAGTAGCCA-3′ | |||
| Collagen type II | Forward: 5′-CACTGCCAACGTCCAGATGA-3′ | 215 | NM_001006951.1 |
| Reverse: 5′-GTTTCGTGCAGCCATCCTTC-3′ | |||
| Aggrecan | Forward: 5′-ACTTCCGCTGGTCAGATGGA-3′ | 111 | NM_001113455.1 |
| Reverse: 5′-TCTCGTGCCAGATCATCACC-3′ | |||
| Sox9 | Forward: 5′-GCCGAGGAGGCCACCGAACA-3′ | 179 | NM_001002978.1 |
| Reverse: 5′-CCCGGCTGCACGTCGGTTTT-3′ | |||
| MMP-13 | Forward: 5′-GGCTTAGAGGTCACTGGCAAAC-3′ | 118 | XM_022418390.1 |
| Reverse: 5′-TGGACCACTTGAGAGTTCGGG-3′ |
Analysis of chondrocyte ultrastructure
Chondrocyte ultrastructure was observed and compared in the ND group between week 1 and 8 of culture using a transmission electron microscope (TEM). Chondrocytes in 12-well polystyrene culture plates for TEM analysis were fixed with 2.5% glutaraldehyde (Wako) in 0.1M sodium cacodylate buffer (Wako) for 30 min and post fixed with 1% osmium tetra oxide (Wako) in the same buffer for 1 hr at 4°C. Fixed samples were then dehydrated through a series of ethanol solutions in ascending concentrations up to 99.5%. After dehydration, the samples were immersed in propylene oxide (Wako) and embedded in Epon resin (Nisshin EM, Tokyo, Japan) at 60°C for 48 hr. Ultrathin sections at 60 nm were obtained using an ultramicrotome (Reichert Ultracut S, Leica Microsystems, Vienna, Austria) and collected on 200 mesh copper grids (Nisshin). The sections were double-stained with uranyl acetate and lead citrate (Sigma-Aldrich) and examined under a TEM (JEM-1400 plus, JEOL Ltd., Tokyo, Japan) at 80 kV.
Statistical analysis
Quantitative data analysis was performed using GraphPad Prism software (GraphPad Software Inc., La Jolla, CA, USA). Friedman’s test and Dunn’s multiple comparison test were used to evaluate significant differences in the gene expression results, while all other statistical comparisons were performed using analysis of variance and Dunnett’s multiple comparison test. P-value <0.05 was considered significant. All quantitative results are presented as mean ± standard deviation (SD).
RESULTS
Effect of seeding density and culture time on the morphology of chondrocytes
Images for cell morphology and confluence level analysis of chondrocytes were captured under a light microscopy during the 8 weeks culture period (Fig. 1A). In HD, ND and LD seeding groups, chondrocytes reached 100% confluence at 4 (range 3–4), 8 (range 7–9) and 11 (range 10–12) days, respectively. Chondrocytes cultured in LD and ND group exhibited an elongated, fibroblast-like morphology from the beginning of culture, whereas chondrocytes in HD group exhibited a polygonal morphology (Fig. 1A). After week 4, there was no morphological difference in chondrocytes between the groups. The opaque spot which indicated an accumulation of ECM was more easily detected in ND and HD group (Fig. 1A). Wide opaque regions could be observed at week 8 in all groups with chondrocytes in all culture plates tightly packed and morphologically indistinct (Fig. 1A).
Fig. 1.
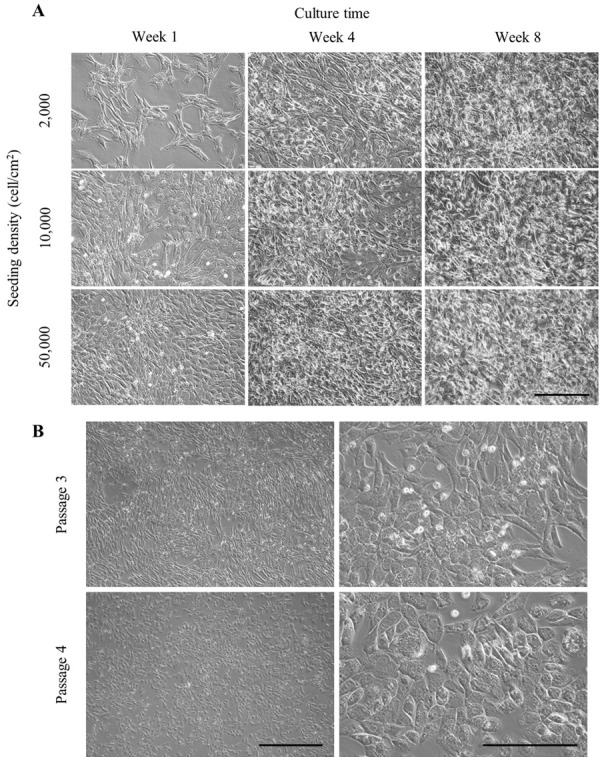
The light microscope was used to observe cell morphology and confluency condition of chondrocytes culture derived from 2 years old Beagle. (A) Monolayer culture of chondrocytes seeded with different initial densities; 0.2 × 10⁴, 1.0 × 10⁴ and 5.0 × 10⁴ cells/cm2 and maintained over a period of 8 weeks. Images were captured from chondrocytes cultured at week 1, 4 and 8 of culture. Opaque regions which indicated an accumulation of extracellular matrix (ECM) were observed at week 8 of culture. Scale bar=200 µm. (B) Third (P3) and forth passage (P4) (subculture from long-term culture) of chondrocytes monolayer culture seeded with 1.0 × 10⁴ cells/cm2 observed at week 1. The basal area of chondrocytes in P4 was drastically increased while exhibited a spherical or polygonal morphology. Scale bar=500 µm (left), 200 µm (right).
Long-term monolayer cultured CACs are able to resume proliferation after passage but have an altered morphology
Proliferation capability of P4 chondrocytes subculture from P3 long-term monolayer culture (8 weeks) was maintained (Fig. 1B). Compared to P3, P4 chondrocytes showed apparently morphological changes during the culture period. Chondrocytes in P3 showed a typical elongated, fibroblast-like morphology found in monolayer culture, whereas P4 chondrocytes exhibited a spherical or polygonal morphology. Furthermore, the basal area of chondrocytes in P4 was shown to be drastically increased compared to P3.
Chondrocytes cultured with different initial seeding densities exhibit a similar pattern of cell growth, while cell number was decreased under the post-confluent condition
The growth curve of chondrocytes cultured with different initial seeding densities as determined by MTT assay is shown in (Fig. 2). The curve shows a similar pattern of cell growth from day 1 to day 7 among chondrocytes cultured with different initial seeding densities. In addition, the total cell number was counted manually with hemocytometer at weeks 4 and 8. Results showed the highest cell number at week 4 which significantly decreased at week 8 in all groups (Fig. 3); LD (13.68 ± 0.57 decreased to 10.8 ± 0.66 × 10⁴ cells/cm2, P=0.009), ND (14.6 ± 0.93 decreased to 12.05 ± 0.5 × 10⁴ cells/cm2, P=0.02) and HD (16.88 ± 1.06 decreased to 14.3 ± 1.49 × 10⁴ cells/cm2, P=0.017). Furthermore, the cell number at week 4 increased at 68.4, 14.6 and 3.4-fold in LD, ND and HD group, respectively compared to initial seeding density.
Fig. 2.
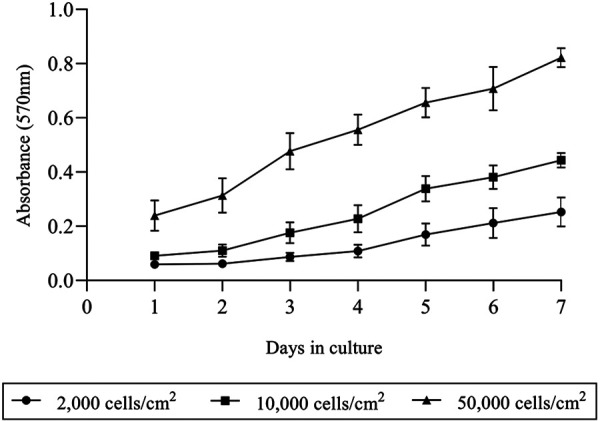
Growth curve of chondrocytes cultured in monolayer during the first 7 days. A similar trend of growth curve was observed from chondrocytes cultured seeded with 0.2 × 10⁴, 1.0 × 10⁴ and 5.0 × 10⁴ cells/cm2. The data are represented as the mean ± SD.
Fig. 3.
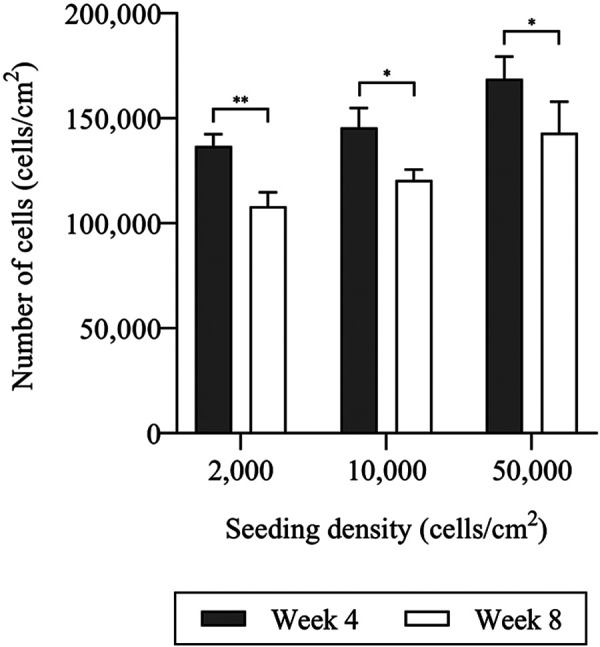
Number of chondrocytes (cells/cm2) in monolayer culture seeded with different initial densities; 0.2 × 10⁴, 1.0 × 10⁴ and 5.0 × 10⁴ cells/cm2 maintained under post-confluence condition at week 4 and 8 of culture. Number of chondrocytes was significantly decreased after week 4 in all groups. The data are represented as the mean ± SD (*P<0.05 and **P<0.01).
Quantification of total DNA and GAGs content of chondrocytes
The amount of DNA and GAGs as quantified by Hoechst 33258 and DMMB assay at every 2 weeks during the culture period demonstrated a similar pattern between chondrocytes cultured with different initial seeding densities (Fig. 4). DNA content in all groups was highest at week 4 then steadily decreased until week 8 with significant difference in DNA content found between week 2 and 4 in LD (7.85 ± 1.39 versus 11.08 ± 1.75 µg/ml, P=0.022) and HD (15.18 ± 0.97 versus 18.08 ± 3.37 µg/ml, P=0.008) groups (Fig. 4A). Total GAGs content measured in cell lysate was increased at week 6 and the highest content observed at week 8. There was significant difference in GAGs content between week 2 and 8 in all groups; LD (0.9 ± 0.14 versus 1.68 ± 0.73 µg/µg of DNA, P=0.001), ND (0.86 ± 0.11 versus 1.33 ± 0.43 µg/µg of DNA, P=0.003) and HD (0.55 ± 0.07 versus 1.23 ± 0.16 µg/µg of DNA, P=0.015) (Fig. 4B). For the total GAGs content measured in culture media, significant difference was observed only in LD group, between week 2 and 8 (0.66 ± 0.09 versus 0.92 ± 0.17 µg/µg of DNA, P<0.001) (Fig. 4C).
Fig. 4.
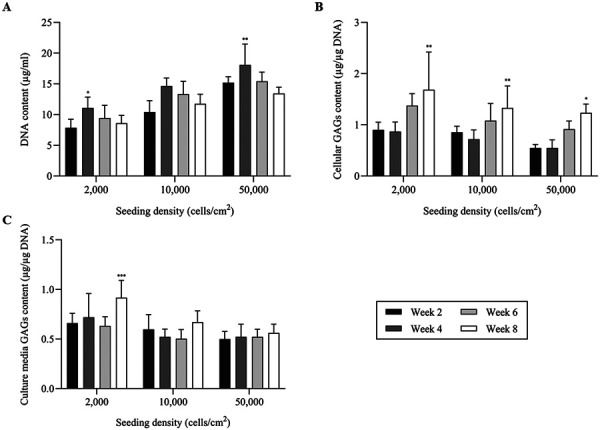
Biochemical analysis of long-term monolayer cultured chondrocytes seeded with different initial densities; 0.2 × 10⁴, 1.0 × 10⁴ and 5.0 × 10⁴ cells/cm2 and maintained over a period of 8 weeks. The analysis was performed every 2 weeks during the cultured period. (A) Quantification of DNA content in cell lysate by Hoechst assay, which indicates the highest DNA content at week 4, then steadily decreases until week 8. (B, C) Quantification of glycosaminoglycans (GAGs) content (normalized with DNA content) by dimethylmethylene blue (DMMB) assay in cell lysate and culture media, respectively. The data are represented as the mean ± SD (*P<0.05, ** P<0.01 and *** P<0.001).
Long-term monolayer cultured CACs synthesize abundant amount of ECM as determined by Alcian blue staining
Results from alcian blue staining for GAGs synthesis, which is an important ECM component of articular cartilage are shown in (Fig. 5). Accumulation of GAGs in monolayer cultured CACs indicated a gradual increase in staining intensities in a time-dependent manner from 2 to 8 weeks. After culture for 2 weeks, positive staining was detected in ND and HD group compared to chondrocytes cultured in LD group which showed weaker alcian blue stain. From week 4 until week 8, there was no difference in staining intensities between each group, although all groups at week 6 and 8 tended to have a strong alcian blue positive stain indicating increased GAGs deposition.
Fig. 5.
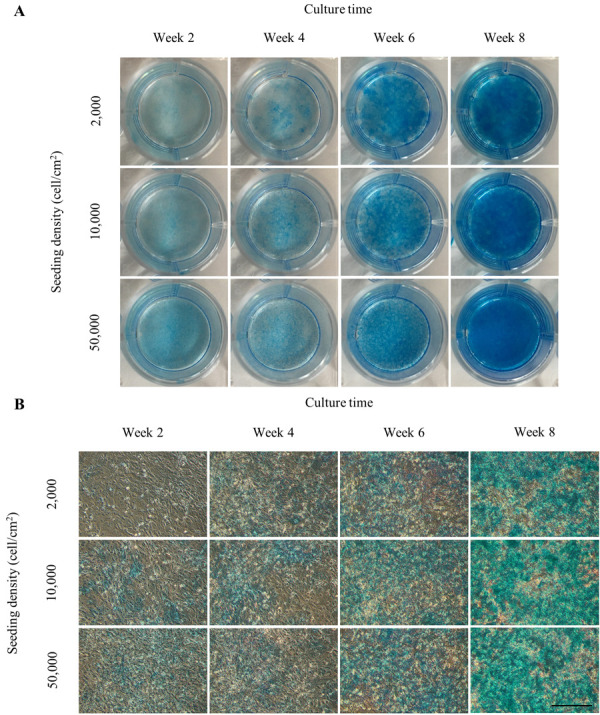
Alcian blue staining for glycosaminoglycans (GAGs) in long-term monolayer cultured chondrocytes seeded with different initial densities; 0.2 × 10⁴, 1.0 × 10⁴ and 5.0 × 10⁴ cells/cm2 and maintained over a period of 8 weeks. The chondrocytes were derived from 2 years old Beagle and the staining was performed in 12-well polystyrene culture plates every 2 weeks during the cultured period. Alcian blue stained images of long-term monolayer cultured chondrocytes (A) observed on culture plates and (B) observed under the light microscope. Alcian blue staining of GAGs was clearly observed from week 4 in all groups, while the staining intensities were gradually increased in a time-dependent manner. Scale bar=200 µm.
Alteration in gene expression of long-term monolayer cultured chondrocytes
The mRNA expression in each group was statistically compared to week 1 as the control. As shown in (Fig. 6), most genes exhibited higher expression when culture time was increased, except collagen type I. Collagen type I expression was downregulated after week 1 and showed the lowest expression during week 5 and 6, whereas in ND group at week 6, it was downregulated more than 8-fold (P=0.001) compared to week 1 (Fig. 6A). The mRNA expression level of matrix proteins; collagen type II and aggrecan were both upregulated in a time-dependent pattern with the highest expression observed in HD group. In fact, at week 8, collagen type II and aggrecan expression were upregulated more than 350-fold (P<0.001) and 40-fold (P=0.002), respectively compared to week 1 (Fig. 6B, 6C). In addition, the expression of Sox9 was highest at week 8 in ND group which was upregulated more than 180-fold (P<0.001) compared to week 1 (Fig. 6D). Interestingly, the expression pattern of MMP-13 was similar to that of matrix proteins with the highest expression observed in HD group by 1000-fold (P=0.03) in chondrocytes cultured at week 7 compared to week 1 (Fig. 6E).
Fig. 6.
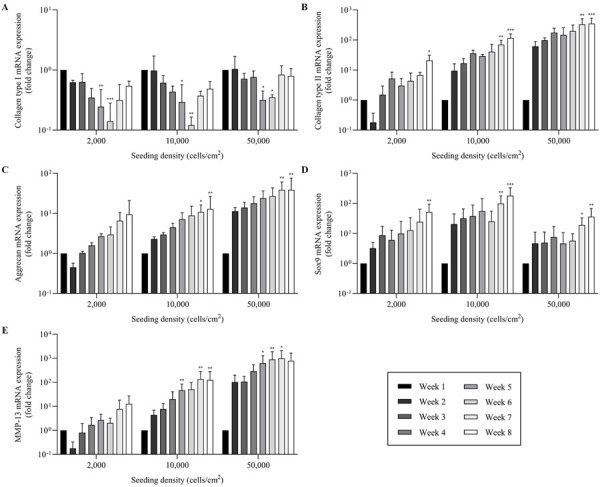
Relative mRNA expression of chondrocytes in long-term monolayer culture seeded with different initial densities; 0.2 × 10⁴, 1.0 × 10⁴ and 5.0 × 10⁴ cells/cm2 and maintained over a period of 8 weeks were analyzed with real-time quantitative PCR (qPCR). The relative expression of each gene was normalized to the housekeeping gene, Glyceraldehyde-3-phosphate dehydrogenase (GAPDH). The expression of (A) collagen type I was decreased, while the expression of (B) collagen type II (C) aggrecan (D) Sox9 and (E) matrix metalloproteinase 13 (MMP-13) were increased during the entire culture period. The data are represented as the mean ± SD (*P<0.05, **P<0.01 and ***P<0.001).
Ultrastructure of chondrocytes
The ultrastructure of chondrocytes cultured in monolayer as observed under TEM is shown in (Fig. 7). Chondrocytes from week 1 (Fig. 7A–C) and 8 (Fig. 7D–F) both contained abundant rough endoplasmic reticulum (RER) and mitochondria. Most of the chondrocytes from week 8 became hypertrophic, with an apparent increase in cell volume. Dilated RER was commonly observed in both week 1 and 8 chondrocytes cultures, whereas mildly dilated RER was observed in week 1 (Fig. 7B) and massively dilated RER was noted in week 8 chondrocytes cultures (Fig. 7E). Interestingly, autophagic vacuoles were normally observed in both chondrocytes at week 1 and 8 (Fig. 7B, 7E); however, the number and size of autophagic vacuoles was slightly increased in week 8 compared to week 1.
Fig. 7.
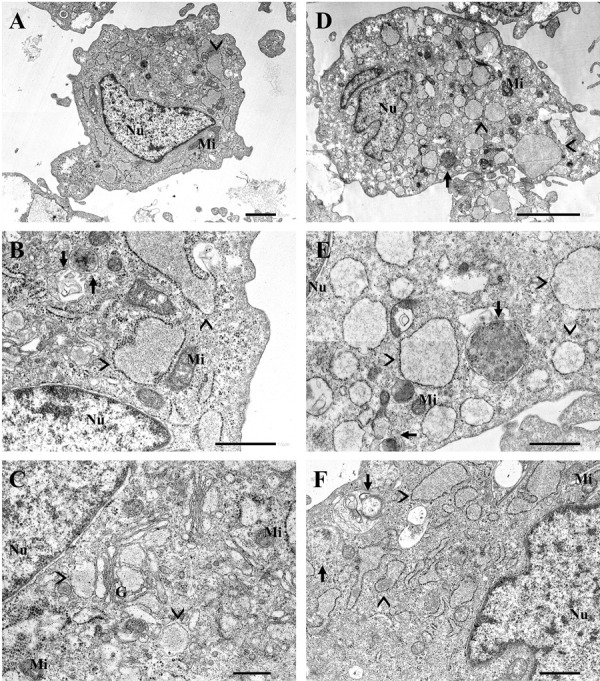
Transmission electron microscopy (TEM) analysis of chondrocytes ultrastructure in long-term monolayer culture seeded with 1.0 × 10⁴ cells/cm2 compared between week 1 (A–C) and 8 (D–F). The chondrocytes were derived from 2 years old Beagle. (A, D) Chondrocytes from both week 1 and 8 contained abundant rough endoplasmic reticulum (RER) (arrowhead) and mitochondria (Mi). Dilated RER was observed in both samples with different dilation degrees, whereas (B) mildly dilated RER was observed in week 1 and (E) massively dilated RER was observed in week 8. The autophagic activity of chondrocytes was indicated by the presence of an autophagic vacuoles (arrow). (E, F) Chondrocytes maintained in long-term culture showed an increasing in number and size of an autophagic vacuoles compared to chondrocytes in week 1. Other cellular organelles presented in the images are including, nucleus (Nu) and golgi apparatus (G). All images are from 60 nm-thick. Epon resin ultrathin section double-stained with uranyl acetate and lead citrate and examined under a TEM at 80 kV. Scale bar=2 µm (A); 1 µm (B, E, F); 500 nm (C); 5 µm (D).
DISCUSSION
Expansion of chondrocytes is an unavoidable process that plays a critical role in cartilage therapeutic interventions as well as to serve as a model for research purposes. However, a significant problem of chondrocytes cultured in monolayer after prolonged culture and serial passage is the dedifferentiation phenomenon, which is characterized by the gradual change from the chondrocyte phenotype to fibroblast-like phenotype [7, 11, 22, 32]. The present study describes the characteristic changes of chondrocytes during long-term culture in conventional 2D monolayer. Our findings demonstrate that the phenotypic loss of dedifferentiated chondrocytes cultured in conventional 2D monolayer could be spontaneously restored by an appropriate culture time in standard culture medium without the addition of known chondrogenic growth factors or using tissue-culture scaffolds.
Initial seeding density in chondrocytes culture is considered as an important factor in the phenotype stability of chondrocytes [14, 32, 45]. High initial cell number is able to reduce cell division rounds needed to reach confluence and support cell-cell interactions, which enhances the expression of cell adhesion molecules N-cadherin [9, 14, 23, 26, 45]. Although chondrocytes cultured with low initial cell number generally exhibit fibroblast-like morphology, our results showed no morphological difference of chondrocytes between high and low initial cell number after culture for 4 weeks. Chondrocytes cultured at different initial seeding densities resulted in a similar pattern of growth. Interestingly, MTT assay results from the HD group indicated cell growth even after confluence condition was observed by day 4. This is consistent with what has been reported in previous studies which demonstrated that chondrocytes in monolayer could culture stratify and form a layer under post-confluence condition [16, 19, 34]. However, our results show that chondrocytes maintained in 2D monolayer cultures have limited increase in cell number and DNA content by week 4, then gradually declines until week 8. Although the stratified culture was possible in the post-confluence condition, the high number of cells eventually triggers the contact inhibition phenomenon and terminates chondrocytes proliferation [21]. This finding indicates the possibility of stratified culture, the limit of cell proliferation and maximum cell number gain in monolayer culture.
Apart from achieving high cell numbers and densely packed chondrocytes, the post-confluence condition maintained in this study was intended to promote contact inhibition so as to completely terminate chondrocytes proliferation. This was done as an attempt to mimic the nature of articular chondrocytes embedded in cartilage matrix that are characterized by a post-mitotic status which aid to preserve their phenotype in long-term [17, 32]. Similar to a previous study [34], our results from DMMB assay and alcian blue stain confirms that an abundant amount of ECM is synthesized and accumulated during post-confluence culture, particularly after week 4, in which cell proliferation is terminated. This has been previously suggested to be due to proliferative and synthetic activities of chondrocytes being inversely related [32]. Surprisingly, chondrocytes subcultured from these long-term monolayer conditions were able to resume proliferation and exhibited a polygonal morphology instead of a fibroblast-like morphology. However, the basal area of these chondrocytes was observed to be drastically increased, which indicate hypertrophic differentiation [18].
The qPCR was used to evaluate the alteration in mRNA expression of chondrocytes under long-term culture. The results demonstrate that the mRNA expression profile of chondrocytes is dramatically affected by culture time, with downregulation of fibroblast marker (collagen type I) and upregulation of chondrocyte specific markers (collagen type II and aggrecan), chondrogenic marker (Sox9) and hypertrophic marker (MMP-13) [22, 25, 36]. Compared to conventional 2D monolayer culture, which is unable to maintain chondrocytes phenotype, long-term monolayer culture used in this study exhibited the remarkable capability to support the chondrocyte phenotype. This is consistent with a previous study which found that long-term post-confluence monolayer chondrocytes culture are capable of collagen type II upregulation [4]. The high expression of collagen type II and aggrecan, together with low expression of collagen type I corresponded with transcription factor Sox9 expression, which activates several chondrocyte specific markers, represses collagen type I and is considered as a crucial factor in cartilage formation [1, 7, 13, 14, 40]. Taken together, these findings indicate that prolonged culture under post-confluence condition allows chondrocytes to become stratified, despite the proliferation limit, which promotes more cell-cell interaction and enforce a rounded chondrocyte morphology [15, 38, 43]. Interestingly, increased cell basal area was correlated to MMP-13 mRNA which was highly expressed with increase in culture time. MMP-13 is the chondrocyte hypertrophic marker and major collagen type II degrading collagenase, which has been previously shown to be downregulated by the negative regulator of chondrocyte hypertrophy, Sox9 [13, 27]. The high expression of MMP-13 mRNA could be related to cellular response due to the vast amount of ECM deposited especially at week 6 and 8 in these cultures requiring remodeling to permit cell enlargement but could also be an indication of a mixed population of chondrocytes [10].
By TEM analysis, dilated RER was observed in both sub-confluent (week 1) and post-confluent (week 8) chondrocytes culture. Mildly dilated RER was observed in sub-confluent culture which has been shown to indicate the cellular activity of chondrocytes reflecting the synthesis function that generally occurs to some extent in healthy chondrocytes [33, 37, 39]. However, massively dilated RER that was mostly observed in long-term cultures compared to week 1 has been associated with hypertrophic chondrocytes found in the epiphyseal plate [3, 5, 31]. On the other hand, the observed autophagic vacuoles in chondrocytes indicates an autophagy activity, which is the physiological cellular mechanism that degrades macromolecules and organelles to sustain cellular metabolism. Constitutive autophagy is essential to maintain cellular function and survival, especially in the low turnover rate cell like chondrocytes [6, 8, 24]. Several studies suggest that a decrease in the autophagic activity of chondrocytes is related to osteoarthritis [6, 8]. Taken together, the present study suggests that chondrocytes in both short- and long-term 2D monolayer cultures can maintain autophagy activity.
It should be noted that while the results of the present study may be intriguing, there are a number of limitations that need to be highlighted. The results are based on a small sample size of only four dogs with a disparity in breed, age and clinical conditions, all of which can have an effect on cells response to culture conditions. This was evident from qPCR results which showed high standard deviations between the samples results. Furthermore, chondrocytes phenotype was evaluated only at mRNA level which not always correlate to active protein level.
In conclusion, the present study demonstrates that the alteration in characteristics of the CACs in monolayer culture mainly depends on culture time. Long-term 2D monolayer culture allows chondrocytes to proliferate to their maximum capacity leading to partial redifferentiation and phenotype stability as evidenced by mRNA expression and GAGs deposition profile. However, typical with monolayer cultured chondrocytes, some characteristics of hypertrophic differentiation were also observed in these long-term cultures. Interestingly, these long-term monolayer cultured chondrocytes can be subcultured and exhibit a decent proliferative capability displaying a polygonal as opposed to a typical fibroblastic-like morphology. Thus, long-term monolayer culture model might serve as an excellent in-vitro model for cartilage research due to the ECM-rich condition with non-proliferate chondrocytes.
CONFLICT OF INTERESTS
The authors declare that there is no conflict of interest.
REFERENCES
- 1.Akiyama H., Lyons J. P., Mori-Akiyama Y., Yang X., Zhang R., Zhang Z., Deng J. M., Taketo M. M., Nakamura T., Behringer R. R., McCrea P. D., de Crombrugghe B.2004. Interactions between Sox9 and β-catenin control chondrocyte differentiation. Genes Dev. 18: 1072–1087. doi: 10.1101/gad.1171104 [DOI] [PMC free article] [PubMed] [Google Scholar]
- 2.Akkiraju H., Nohe A.2015. Role of chondrocytes in cartilage formation, progression of osteoarthritis and cartilage regeneration. J. Dev. Biol. 3: 177–192. doi: 10.3390/jdb3040177 [DOI] [PMC free article] [PubMed] [Google Scholar]
- 3.Anderson H. C.1967. Electron microscopic studies of induced cartilage development and calcification. J. Cell Biol. 35: 81–101. doi: 10.1083/jcb.35.1.81 [DOI] [PMC free article] [PubMed] [Google Scholar]
- 4.Binette F., McQuaid D. P., Haudenschild D. R., Yaeger P. C., McPherson J. M., Tubo R.1998. Expression of a stable articular cartilage phenotype without evidence of hypertrophy by adult human articular chondrocytes in vitro. J. Orthop. Res. 16: 207–216. doi: 10.1002/jor.1100160208 [DOI] [PubMed] [Google Scholar]
- 5.Brian K. H.2012. Cartilage, volume 1: Structure, function, and biochemistry, Academic Press, New York. [Google Scholar]
- 6.Caramés B., Taniguchi N., Otsuki S., Blanco F. J., Lotz M.2010. Autophagy is a protective mechanism in normal cartilage, and its aging-related loss is linked with cell death and osteoarthritis. Arthritis Rheum. 62: 791–801. doi: 10.1002/art.27305 [DOI] [PMC free article] [PubMed] [Google Scholar]
- 7.Caron M. M. J., Emans P. J., Coolsen M. M. E., Voss L., Surtel D. A. M., Cremers A., van Rhijn L. W., Welting T. J. M.2012. Redifferentiation of dedifferentiated human articular chondrocytes: comparison of 2D and 3D cultures. Osteoarthritis Cartilage 20: 1170–1178. doi: 10.1016/j.joca.2012.06.016 [DOI] [PubMed] [Google Scholar]
- 8.Chang J., Wang W., Zhang H., Hu Y., Wang M., Yin Z.2013. The dual role of autophagy in chondrocyte responses in the pathogenesis of articular cartilage degeneration in osteoarthritis. Int. J. Mol. Med. 32: 1311–1318. doi: 10.3892/ijmm.2013.1520 [DOI] [PubMed] [Google Scholar]
- 9.Costa E., González-García C., Gómez Ribelles J. L., Salmerón-Sánchez M.2018. Maintenance of chondrocyte phenotype during expansion on PLLA microtopographies. J. Tissue Eng. 9: 2041731418789829. doi: 10.1177/2041731418789829 [DOI] [PMC free article] [PubMed] [Google Scholar]
- 10.D’Angelo M., Yan Z., Nooreyazdan M., Pacifici M., Sarment D. S., Billings P. C., Leboy P. S.2000. MMP-13 is induced during chondrocyte hypertrophy. J. Cell. Biochem. 77: 678–693. doi: [DOI] [PubMed] [Google Scholar]
- 11.Darling E. M., Athanasiou K. A.2005. Rapid phenotypic changes in passaged articular chondrocyte subpopulations. J. Orthop. Res. 23: 425–432. doi: 10.1016/j.orthres.2004.08.008 [DOI] [PubMed] [Google Scholar]
- 12.Davies R. L., Kuiper N. J.2019. Regenerative medicine: A review of the evolution of autologous chondrocyte implantation (ACI) therapy. Bioengineering (Basel) 6: 1–16. [DOI] [PMC free article] [PubMed] [Google Scholar]
- 13.Dreier R.2010. Hypertrophic differentiation of chondrocytes in osteoarthritis: the developmental aspect of degenerative joint disorders. Arthritis Res. Ther. 12: 216. doi: 10.1186/ar3117 [DOI] [PMC free article] [PubMed] [Google Scholar]
- 14.Gao Y., Liu S., Huang J., Guo W., Chen J., Zhang L., Zhao B., Peng J., Wang A., Wang Y., Xu W., Lu S., Yuan M., Guo Q.2014. The ECM-cell interaction of cartilage extracellular matrix on chondrocytes. BioMed Res. Int. 2014: 648459. doi: 10.1155/2014/648459 [DOI] [PMC free article] [PubMed] [Google Scholar]
- 15.García-Carvajal Z. Y., Garciadiego-Cázares D., Parra-Cid C., Aguilar-Gaytán R., Velasquillo C., Ibarra C., Castro Carmona J. S.2013. Cartilage tissue engineering: The role of extracellular matrix (ECM) and novel strategies. In: Regenerative Medicine and Tissue Engineering, InTech, pp. 365–397. [Google Scholar]
- 16.Gartland A., Mechler J., Mason-Savas A., MacKay C. A., Mailhot G., Marks S. C., Jr, Odgren P. R.2005. In vitro chondrocyte differentiation using costochondral chondrocytes as a source of primary rat chondrocyte cultures: an improved isolation and cryopreservation method. Bone 37: 530–544. doi: 10.1016/j.bone.2005.04.034 [DOI] [PubMed] [Google Scholar]
- 17.Gelse K., Ekici A. B., Cipa F., Swoboda B., Carl H. D., Olk A., Hennig F. F., Klinger P.2012. Molecular differentiation between osteophytic and articular cartilage—clues for a transient and permanent chondrocyte phenotype. Osteoarthritis Cartilage 20: 162–171. doi: 10.1016/j.joca.2011.12.004 [DOI] [PubMed] [Google Scholar]
- 18.Gratal P., Mediero A., Sánchez-Pernaute O., Prieto-Potin I., Lamuedra A., Herrero-Beaumont G., Largo R.2019. Chondrocyte enlargement is a marker of osteoarthritis severity. Osteoarthritis Cartilage 27: 1229–1234. doi: 10.1016/j.joca.2019.04.013 [DOI] [PubMed] [Google Scholar]
- 19.Hendriks J., Riesle J., Vanblitterswijk C. A.2006. Effect of stratified culture compared to confluent culture in monolayer on proliferation and differentiation of human articular chondrocytes. Tissue Eng. 12: 2397–2405. doi: 10.1089/ten.2006.12.2397 [DOI] [PubMed] [Google Scholar]
- 20.Henrotin Y., Sanchez C., Balligand M.2005. Pharmaceutical and nutraceutical management of canine osteoarthritis: present and future perspectives. Vet. J. 170: 113–123. doi: 10.1016/j.tvjl.2004.08.014 [DOI] [PubMed] [Google Scholar]
- 21.Isyar M., Yilmaz I., Yasar Sirin D., Yalcin S., Guler O., Mahirogullari M.2016. A practical way to prepare primer human chondrocyte culture. J. Orthop. 13: 162–167. doi: 10.1016/j.jor.2016.03.008 [DOI] [PMC free article] [PubMed] [Google Scholar]
- 22.Lin Z., Fitzgerald J. B., Xu J., Willers C., Wood D., Grodzinsky A. J., Zheng M. H.2008. Gene expression profiles of human chondrocytes during passaged monolayer cultivation. J. Orthop. Res. 26: 1230–1237. doi: 10.1002/jor.20523 [DOI] [PubMed] [Google Scholar]
- 23.López-Alcorocho J. M., Guillén-Vicente I., Rodríguez-Iñigo E., Guillén-Vicente M., Fernández-Jaén T. F., Caballero R., Casqueiro M., Najarro P., Abelow S., Guillén-García P.2019. Study of telomere length in preimplanted cultured chondrocytes. Cartilage 10: 36–42. doi: 10.1177/1947603517749918 [DOI] [PMC free article] [PubMed] [Google Scholar]
- 24.Luo P., Gao F., Niu D., Sun X., Song Q., Guo C., Liang Y., Sun W.2019. The role of autophagy in chondrocyte metabolism and osteoarthritis: A comprehensive research review. BioMed Res. Int. 2019: 5171602. doi: 10.1155/2019/5171602 [DOI] [PMC free article] [PubMed] [Google Scholar]
- 25.Mao Y., Hoffman T., Wu A., Kohn J.2018. An innovative laboratory procedure to expand chondrocytes with reduced dedifferentiation. Cartilage 9: 202–211. doi: 10.1177/1947603517746724 [DOI] [PMC free article] [PubMed] [Google Scholar]
- 26.Mara C. S., Sartori A. R., Duarte A. S., Andrade A. L. L., Pedro M. A. C., Coimbra I. B.2011. Periosteum as a source of mesenchymal stem cells: the effects of TGF-β3 on chondrogenesis. Clinics (São Paulo) 66: 487–492. doi: 10.1590/S1807-59322011000300022 [DOI] [PMC free article] [PubMed] [Google Scholar]
- 27.Martinez-Sanchez A., Dudek K. A., Murphy C. L.2012. Regulation of human chondrocyte function through direct inhibition of cartilage master regulator SOX9 by microRNA-145 (miRNA-145). J. Biol. Chem. 287: 916–924. doi: 10.1074/jbc.M111.302430 [DOI] [PMC free article] [PubMed] [Google Scholar]
- 28.Medvedeva E. V., Grebenik E. A., Gornostaeva S. N., Telpuhov V. I., Lychagin A. V., Timashev P. S., Chagin A. S.2018. Repair of damaged articular cartilage: Current approaches and future directions. Int. J. Mol. Sci. 19: 1–23. doi: 10.3390/ijms19082366 [DOI] [PMC free article] [PubMed] [Google Scholar]
- 29.Mhanna R., Kashyap A., Palazzolo G., Vallmajo-Martin Q., Becher J., Möller S., Schnabelrauch M., Zenobi-Wong M.2014. Chondrocyte culture in three dimensional alginate sulfate hydrogels promotes proliferation while maintaining expression of chondrogenic markers. Tissue Eng. Part A 20: 1454–1464. doi: 10.1089/ten.tea.2013.0544 [DOI] [PMC free article] [PubMed] [Google Scholar]
- 30.Nam Y., Rim Y. A., Lee J., Ju J. H.2018. Current therapeutic strategies for stem cell-based cartilage regeneration. Stem Cells Int. 2018: 8490489. doi: 10.1155/2018/8490489 [DOI] [PMC free article] [PubMed] [Google Scholar]
- 31.Oakes B. W., Handley C. J., Lisner F., Lowther D. A.1977. An ultrastructural and biochemical study of high density primary cultures of embryonic chick chondrocytes. J. Embryol. Exp. Morphol. 38: 239–263. [PubMed] [Google Scholar]
- 32.Otero M., Favero M., Dragomir C., Hachem K. E., Hashimoto K., Plumb D. A., Goldring M. B.2012. Human chondrocyte cultures as models of cartilage-specific gene regulation. Methods Mol. Biol. 806: 301–336. doi: 10.1007/978-1-61779-367-7_21 [DOI] [PubMed] [Google Scholar]
- 33.Ovalle W., Nahirney P.2013. Netter’s essential histology, Saunders, Philadelphia. [Google Scholar]
- 34.Patti A. M., Gabriele A., Della Rocca C.1999. Human chondrocyte cell lines from articular cartilage of metatarsal phalangeal joints. Tissue Cell 31: 550–554. doi: 10.1054/tice.1999.0069 [DOI] [PubMed] [Google Scholar]
- 35.Phull A. R., Eo S. H., Abbas Q., Ahmed M., Kim S. J.2016. Applications of chondrocyte-based cartilage engineering: An overview. BioMed Res. Int. 2016: 1879837. doi: 10.1155/2016/1879837 [DOI] [PMC free article] [PubMed] [Google Scholar]
- 36.Ripmeester E. G. J., Timur U. T., Caron M. M. J., Welting T. J. M.2018. Recent insights into the contribution of the changing hypertrophic chondrocyte phenotype in the development and progression of osteoarthritis. Front. Bioeng. Biotechnol. 6: 18. doi: 10.3389/fbioe.2018.00018 [DOI] [PMC free article] [PubMed] [Google Scholar]
- 37.Roy S., Meachim G.1968. Chondrocyte ultrastructure in adult human articular cartilage. Ann. Rheum. Dis. 27: 544–558. doi: 10.1136/ard.27.6.544 [DOI] [PMC free article] [PubMed] [Google Scholar]
- 38.Schulze-Tanzil G.2009. Activation and dedifferentiation of chondrocytes: implications in cartilage injury and repair. Ann. Anat. 191: 325–338. doi: 10.1016/j.aanat.2009.05.003 [DOI] [PubMed] [Google Scholar]
- 39.Schulze-Tanzil G., de Souza P., Villegas Castrejon H., John T., Merker H. J., Scheid A., Shakibaei M.2002. Redifferentiation of dedifferentiated human chondrocytes in high-density cultures. Cell Tissue Res. 308: 371–379. doi: 10.1007/s00441-002-0562-7 [DOI] [PubMed] [Google Scholar]
- 40.Shapiro F.2016. Pediatric orthopedic deformities, volume 1, Springer International Publishing, Cham. [Google Scholar]
- 41.Shi S., Wang C., Acton A. J., Eckert G. J., Trippel S. B.2015. Role of sox9 in growth factor regulation of articular chondrocytes. J. Cell. Biochem. 116: 1391–1400. doi: 10.1002/jcb.25099 [DOI] [PMC free article] [PubMed] [Google Scholar]
- 42.Sophia Fox A. J., Bedi A., Rodeo S. A.2009. The basic science of articular cartilage: structure, composition, and function. Sports Health 1: 461–468. doi: 10.1177/1941738109350438 [DOI] [PMC free article] [PubMed] [Google Scholar]
- 43.Stewart M. C., Saunders K. M., Burton-Wurster N., Macleod J. N.2000. Phenotypic stability of articular chondrocytes in vitro: the effects of culture models, bone morphogenetic protein 2, and serum supplementation. J. Bone Miner. Res. 15: 166–174. doi: 10.1359/jbmr.2000.15.1.166 [DOI] [PubMed] [Google Scholar]
- 44.Takahashi T., Ogasawara T., Asawa Y., Mori Y., Uchinuma E., Takato T., Hoshi K.2007. Three-dimensional microenvironments retain chondrocyte phenotypes during proliferation culture. Tissue Eng. 13: 1583–1592. doi: 10.1089/ten.2006.0322 [DOI] [PubMed] [Google Scholar]
- 45.Villar-Suárez V., Calles-Venal I., Bravo I. G., Fernández-Alvarez J. G., Fernández-Caso M., Villar-Lacilla J. M.2004. Differential behavior between isolated and aggregated rabbit auricular chondrocytes on plastic surfaces. J. Biomed. Biotechnol. 2004: 86–92. doi: 10.1155/S1110724304312039 [DOI] [PMC free article] [PubMed] [Google Scholar]
- 46.Watt F. M.1988. Effect of seeding density on stability of the differentiated phenotype of pig articular chondrocytes in culture. J. Cell Sci. 89: 373–378. [DOI] [PubMed] [Google Scholar]


