Abstract
Changes in left ventricular (LV) aggregate cardiomyocyte orientation and deformation underlie cardiac function and dysfunction. As such, in vivo aggregate cardiomyocyte “myofiber” strain (Eff) has mechanistic significance, but currently there exists no established technique to measure in vivo Eff. [1]
The objective of this work is to describe and validate a pipeline to compute in vivo Eff from magnetic resonance imaging (MRI) data. Our pipeline integrates LV motion from multi-slice Displacement Encoded with Stimulated Echoes (DENSE) MRI with in vivo LV microstructure from cardiac Diffusion Tensor Imaging (cDTI) data. The proposed pipeline is validated using an analytical deforming heart-like phantom. The phantom is used to evaluate 3D cardiac strains computed from a widely available, open-source DENSE Image Analysis Tool. Phantom validation showed that a DENSE MRI signal-to-noise ratio (SNR) ≥ 20 is required to compute Eff with near-zero median strain bias and within a strain tolerance of 0.04. Circumferential and longitudinal strains are also accurately measured under the same SNR requirements, however, radial strain exhibits a median epicardial bias of −0.10 even in noise-free DENSE data.
The validated framework is applied to experimental DENSE MRI and cDTI data acquired in eight (N = 8) healthy swine. The experimental study demonstrated that Eff has decreased transmural variability compared to radial and circumferential strains. The spatial uniformity and mechanistic significance of in vivo Eff make it a compelling candidate for characterization and early detection of cardiac dysfunction.
Index Terms: DENSE MRI, Diffusion Tensor Imaging, cardiac strain, myofiber strain, cardiac microstructure
I. Introduction
THE diagnosis of cardiovascular disease relies heavily on identifying abnormalities in the diastolic or systolic function of the left ventricle (LV). At the tissue level, microstructural remodeling, changes in electrophysiology, and excitation-contraction coupling all lead to compromised LV function and underlie many forms of heart failure (e.g., dilated cardiomyopathy [2], hypertrophic cardiomyopathy [3]), In the clinic, global metrics of LV function (e.g., ejection fraction (EF)) are mainstays in the diagnosis of heart failure, but provide no insights into the underlying tissue-linked causes of systolic cardiac dysfunction. Although aggregate cardiomyocyte (i.e. “myofiber”) strain (Eff) is the functional basis for gross contraction of the heart, there exists no established technique to measure in vivo performance of cardiomyocyte aggregates.
Regional systolic LV motion can be non-invasively characterized in great detail using magnetic resonance imaging (MRI) of the heart [4]. Among the many MRI sequences used to track LV wall motion, Displacement ENcoding with Stimulated Echoes (DENSE) MRI provides the most highly resolved maps of tissue movement. DENSE MRI encodes tissue displacement information into the phase of the complex MRI signal at each image voxel, from which regional LV motion and wall strains are computed [5]. These strains are computed in a geometry-dependent coordinate system, defined along the longitudinal (), circumferential (), and radial () directions of the LV myocardium [5]. While these geometrically defined strains are better predictors of cardiac events than EF [6], they are dependent on LV geometry, and are typically reported without consideration of underlying tissue microstructure. In some cases [7], “midwall fractional shortening” has been used as a surrogate for cardiomyocyte strain due to the roughly circumferential organization of midwall cardiomyocytes. However, this analysis cannot be extended to estimate Eff at the epicardial and endocardial layers.
A more mechanistic characterization of LV function can be achieved by combining strain and microstructural MRI. Recent work by Wang et al. [8] investigated Eff across the entire LV using a finite element framework, integrating LV motion with cardiomyocyte orientations from ex vivo diffusion tensor MRI. However, advances in cardiac diffusion tensor MRI (cDTI) [9]–[11] now enable imaging in vivo aggregate cardiomyocyte orientations in the beating heart. Here, the term “aggregate cardiomyocyte” is used since cDTI measures the ensemble orientation of cardiomyocytes within a voxel and not an individual cardiomyocyte’s orientation and because (although widely used) there are no “myofibers” in the heart. A framework was recently described that combines cDTI and a single slice of DENSE MRI to estimate Eff entirely from in vivo imaging data [12], thereby bypassing a complex image registration pipeline of in vivo motion with ex vivo microstructure. However, using only a single imaging slice of DENSE displacement data requires the incorporation of mathematical assumptions to compute Eff, which confounds in vivo measurements.
While the DENSE imaging and processing pipeline has been validated [13]–[15], these studies were not performed in the context of measuring Eff. It also remains unclear how realistically achievable signal-to-noise ratio (SNR) in DENSE MRI data propagates to errors in Eff and other cardiac strain estimates.
Herein, we present an image acquisition and analysis framework to estimate in vivo Eff from multi-slice DENSE MRI and cDTI data. Our objectives are to: 1) validate the cardiac motion and strain data obtained from the DENSE imaging and processing pipeline; 2) define the necessary DENSE SNR-level to achieve a strain tolerance of < 0.04 [16]; and 3) apply the proposed framework to compute in vivo Eff using experimental DENSE MRI and cDTI data.
II. Validation Using an Analytical Deforming Phantom
Previous work experimentally validated both displacements and strains from DENSE MRI using a simple rotating gel phantom [13] and with comparison to ‘gold standard’ myocardial tagging. Herein, a more detailed in silico analysis of the DENSE processing pipeline is used to evaluate the accuracy of computed strains under precise conditions for which displacement and strain fields that reproduce cardiac contraction are known analytically. The DENSE processing pipeline is comprised of many steps (e.g., interpolation from Eulerian-to-Lagrangian displacement description, spatial smoothing, and nth-order polynomial temporal fitting [17]). The exact impact of the pipeline on strains computed along the circumferential (), radial (), longitudinal (), and aggregate cardiomyocyte () directions remains unclear.
The cine DENSE MRI sequence evaluated in this work measures x, y, and z displacements through a balanced, four-point encoding scheme [13]. In this paradigm, the Eulerian Cartesian displacements are measured by encoding tissue motion along four gradient directions that are each a balanced sum of x, y, and z displacements. Although this encoding strategy has been proposed to minimize phase variance and maximize signal-to-noise ratio (SNR) in the acquired DENSE images, the required DENSE SNR needed to achieve a target strain bias and precision remains undefined, especially for Eff.
A. Deforming Analytical Cardiac Phantom
The challenge in validating LV motion and strain data from DENSE MRI is due, in part, to the inherent difficulty of obtaining a set of ground-truth strain measurements in the beating heart. In this work, ground-truth LV strains are obtained by means of a deforming analytical cardiac phantom, which is used to computationally evaluate the most widely used, open-source DENSE Image Analysis Tool [17], [18]. The analytic cardiac-like displacements are used to simulate DENSE imaging data assuming a balanced, four-point encoding scheme across a range of image SNRs.
The mid-ventricular phantom is constructed using an axial-symmetric deforming heart-like geometry. The time-resolved motion φ in the radial, circumferential, and longitudinal directions is described as a function of the initial reference point position X, i.e., φ(X). The endocardial and epicardial radii of the phantom at the beginning of systole were set to 25mm and 35mm, respectively, to represent a mid-ventricular section of the LV (Fig. 1a, blue). The height of the cylindrical phantom was set to 16mm, equivalent to the thickness of two short axis DENSE slices (Fig. 1b, blue). Cardiomyocyte microstructural orientations () were prescribed in ruled-based fashion using quadratic interpolation of transmural histological data. The prescribed epicardial, mid-, and endocardial cardiomyocyte angles were −45°, −9°, 37°, corresponding to the mean basal myofiber angles in [19] (Fig. 1c).
Fig. 1.
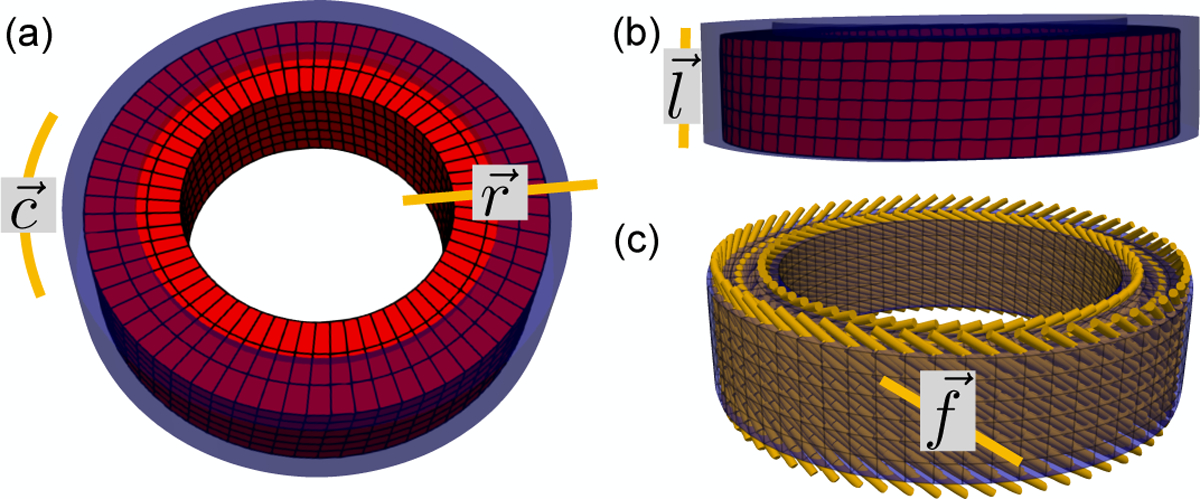
Analytic deforming phantom, (a) Axial and (b) longitudinal views of the analytic phantom at beginning (blue) and end (red) systole. Circumferential (), radial (), and longitudinal () directions are also shown, (c) Cardiomyocyte () directions were prescribed in the phantom according to a rule-based approach calibrated on histological data.
The coefficients of a polynomial governing the magnitude of the radial, circumferential, and longitudinal motion were computed to approximate, in the least-squares sense, a set of target peak systolic Eff, Ell, Ecc, and Err strains based on values reported in the literature [5], [16]. The optimization of the phantom displacement field also includes a target tissue incompressibility constraint based on data from ex vivo biaxial loading [20], and in vivo imaging studies [21]. The target tissue incompressibilty was defined as det(F) = 1, where F is the deformation gradient tensor, although this is an approximation since marginal (2–4%) myocardial compressibility is possible in vivo. The achieved phantom motion is shown in Fig. 1 and the ground truth peak systolic transmural strains are shown in Fig. 2.
Fig. 2.
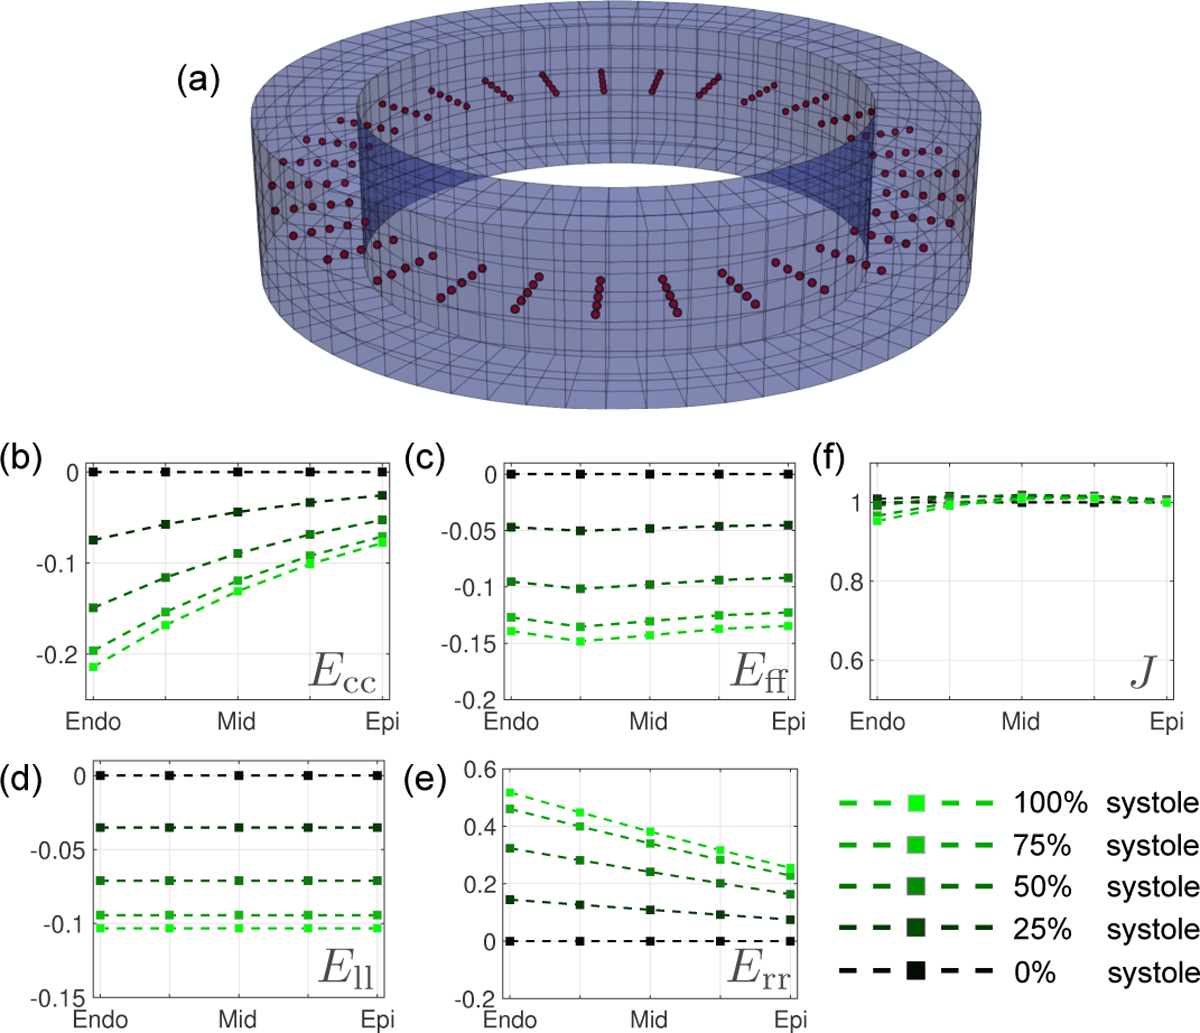
Strain results from the computational deforming phantom at peak systole, (a) Location of 200 co-planar mid-slice query points (Xq, red), where strain and displacement errors are measured. Analytic peak systolic transmural strain results across all Xq from endocardium to epicardium are shown for (b) Ecc, (c) Eff, (d) Ell, and (e) Err. (e) Transmural Jacobian results. The Jacobian describes the myocardium change in volume, i.e., the myocardium compressibility, 1 being perfectly incompressible.
B. Simulating DENSE Magnitude and Phase Data
To simulate the resolution of a typical in vivo DENSE imaging protocol, the analytical phantom was subdivided into a grid of 2.5 × 2.5 × 8mm voxels at two short-axis slice locations. To account for intravoxel dephasing and partial volume effects, tissue displacements were sampled at 12 points within each voxel. Intravoxel sampling points that fell inside the phantom annulus (i.e., the myocardium) were assigned a displacement according the analytical displacement field at that point, while points outside the annulus (i.e., air) were assigned zero displacement. For each voxel, the displacements from all intravoxel sampling points were averaged to generate a single bulk displacement vector.
Note, DENSE imaging directly measures tissue displacements u(x) with respect to a fixed imaging plane at location x. Therefore, in order to compute the voxel displacement as a function of x, the Lagrangian description of the phantom deformation mapping φ(X) was converted to an Eulerian description. First, the reference position X was computed so that in the current configuration φ(X) ≈ x
| (1) |
and subsequently u(x) is computed as:
| (2) |
To simulate the effect of noise in an experimental 3D DENSE protocol, the voxel-wise Cartesian phantom displacements u(x) were transformed to balanced four-point phase maps using the following encoding matrix outlined in Zhong et al. [13]:
| (3) |
where ke is the imposed displacement encoding strength, ui(x) is the displacement i-th component, ϕb is the background phase, and ϕ1 to ϕ4 are the balanced four-point phase maps. We assume that ground-truth ϕb = 0. ke was set to 0.08 cycles/mm, which is within the recommended range for in vivo DENSE imaging [22]. The signal magnitude of the simulated four-point images was computed as the average magnitude across all 12 intravoxel sampling points, assuming a signal of 0 for air and 1 for myocardium. Therefore, at voxels that encompass the air-myocardium boundary, the computed magnitude was between 0 and 1, reproducing partial volume effects. (Fig. 3a).
Fig. 3.
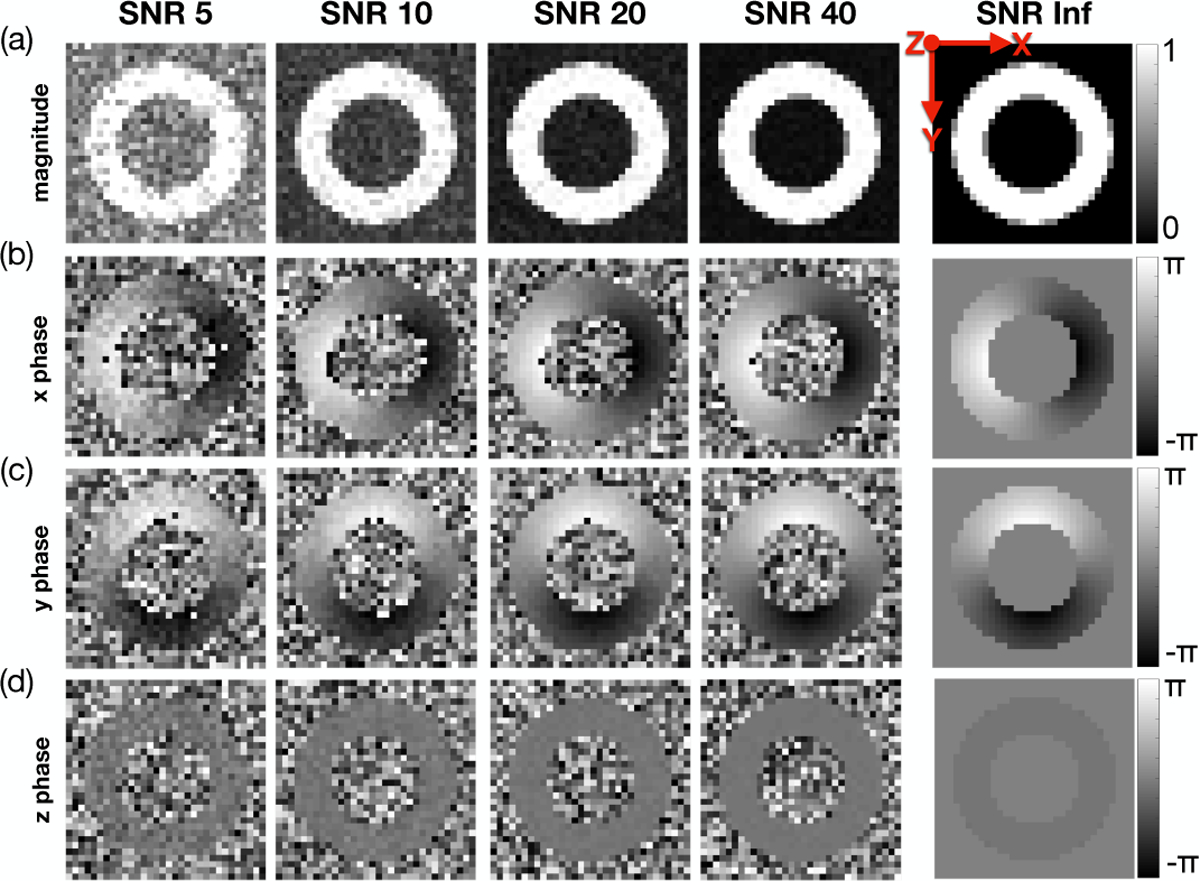
Simulated DENSE magnitude and phase images for a range of SNRs at peak systole. Results for (a) magnitude data, (b) x-phase data, (c) y-phase data, and (d) z-phase data are shown. These data show a single repetition for each SNR, but simulations were repeated five times for each SNR.
Complex valued Gaussian noise was added to all balanced four-point complex images at five different SNR levels: 5, 10, 20, 40, and ∞ (i.e., noise-free). SNR is typically measured using the magnitude of the DENSE image [15], which is reconstructed as an average of all four acquired images. To compare the phantom SNR results to other DENSE studies, we define the target SNR to be reflected in the averaged magnitude image. Therefore, the standard deviation for the Gaussian noise to be added to each four-point image is , where SNR is the target to be achieved in the averaged magnitude image. Finally, the signal phase from the noise-injected images was encoded back into the displacement field along x, y, and z according to:
| (4) |
where are the phase maps of the noise-injected four-point images at a target SNR, and are the corresponding noisy displacement components (Fig. 3b–d).
All resulting displacement and strain analyses were performed on five repetitions of each simulated SNR. This was done to compute the 95% confidence interval (95%-CI) of the strain bias introduced by the DENSE pipeline at a given SNR. More information about the calculation of strain and strain bias is included in the following section.
C. Computing Phantom Displacements and Strains
The position φαi of a phantom voxel a in x, y, and z (i = [1,2,3]) at two adjacent short-axis slice locations (Z = 4mm, 12mm) were extracted from the simulated DENSE signal phase using the DENSE Image Analysis Tool [17] (Fig. 4a). Systolic φaι was computed by segmenting [23], unwrapping and spatiotemporally fitting the time-resolved phantom x, y, and z phase data, exactly as is done in in vivo DENSE image processing. A Local Maximum-Entropy (LME) approximation scheme [24] was used to compute the deformation mapping φ(X) at 200 mid-ventricular, co-planar positions Xq in between two simulated DENSE slices (Fig. 2a). This was done to parallel the experimental setup where systolic motion is measured at two slice locations that surround an interleaved slice of in vivo microstructural data [25]. The deformation gradient F at Xq was then computed as:
| (5) |
where FiJ is the (iJ) component of F, m is the number of DENSE voxels (or nodes) a inside a search radius r from Xq, φai is the component i of node a deformation mapping, Na is the LME shape function at node a, and Na,J (Xq) is the derivative of Na in the J direction evaluated at Xq. At each Xq, the search radius r was chosen by increasing r until a minimum of 20 DENSE nodes were included in the search sphere. In the analyses presented in this work, the 20 node requirement guarantees that the LME approximation scheme was successfully computed at ~ 95% of all Xq. The LME scheme failed at a few boundary Xq, which may fall outside the convex hull defined by the considered set of DENSE nodes. In these cases, F(Xq) was computed as
| (6) |
where HJ is a vector whose component J is equal to h, which defines a small change in position. In our simulations, we set h = 0.1mm and computed φi (Xq ± HJ) using a trilinear interpolation function (Matlab scattered interpolant [26]).
Fig. 4.
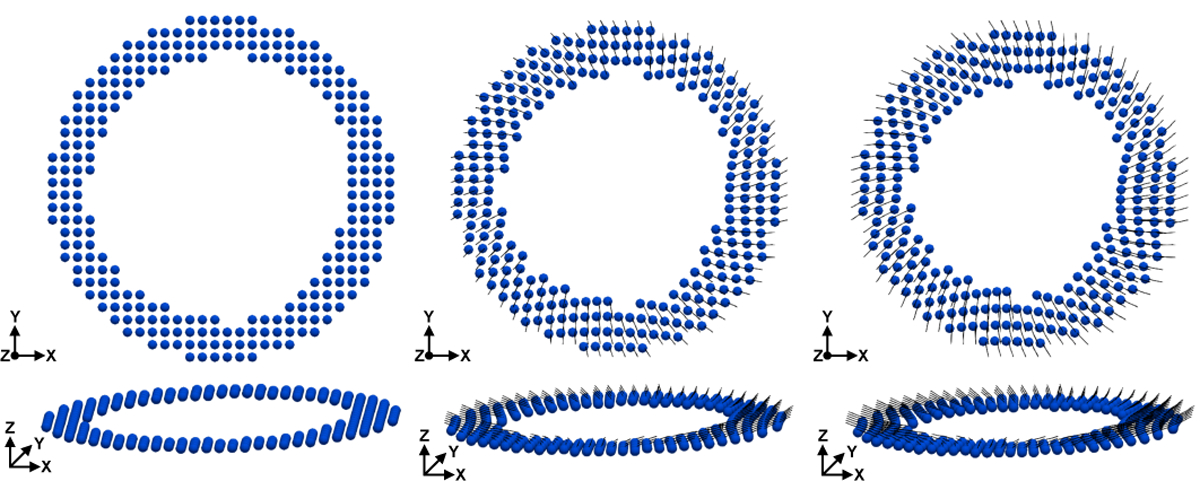
Example of voxel-wise phantom deformation reconstructed from a single slice of DENSE images at SNR = ∞ using the DENSE processing pipeline. Short-axis (top) and long-axis (bottom) views of DENSE-processed motion (φi (X)) at one longitudinal location. Displacements (black pathlines) are shown from beginning, to mid and peak systole (left to right).
Green-Lagrange strain components were evaluated at all Xq as:
| (7) |
where C is the right Cauchy-Green deformation tensor (C = FTF), and represents the direction along which the strain is computed, i.e., Ecc, Err, Ell, Eff (Fig. 1). The strain bias, ΔEvv, was computed at each Xq as:
| (8) |
where is evaluated using the DENSE pipeline and is the corresponding analytical (“ground truth”), strain.
Displacement bias in direction , Δuv, was also computed at each Xq as:
| (9) |
To determine the SNR requirements for DENSE MRI, the acceptable median ΔEvv was set to near-zero. Moore et al. [16] reported that the variation (defined as the standard deviation) of geometric strains across the LV in a healthy human population is ~ 0.04. Therefore, to remain sensitive to abnormal variations in strain, the target strain tolerance is achieved if the 95%-CI of ΔEvv falls within a range of 0.04 (i.e., ±0.20).
Strain and displacement bias were computed at all Xq along all geometrically defined axes (, , and ), and along the cardiomyocyte preferential orientation (). ΔEll, ΔErr, and ΔEff were characterized from epicardium to endocardium to quantify their transmural bias, while ΔEcc was reported along the circumferential direction to relate its changes to bias in uc.
D. Phantom Results
Displacement bias along the geometric axes are shown in gray in the top panels of Fig. 5. Median and 95%-CIs for Δuz, Δur, and Δuc all tend towards near-zero with increasing SNR. No significant improvements in Δuz, Δur, and Δuc were observed for SNR > 40. No displacements were perfectly reproduced, even at SNR = ∞, indicating an inherent bias produced by the imaging and/or analysis pipeline. uz had the lowest median bias with respect to the analytical phantom displacement field, which was only slightly overestimated at SNR = ∞ (Δuz = −0.020mm). Median Δur was the largest among geometric displacements. At SNR = ∞, median Δur was + 0.10mm at the endocardium, while remaining close to zero from midwall to epicardium (Fig. 5b, top). Δuc was computed along 32 segments around the circumference of the phantom (Fig. 5a, top). Although median Δuc increased to 0.06mm around segment 16 at SNR = ∞, the segment-to-segment variability remained low (0.007mm per segment).
Fig. 5.
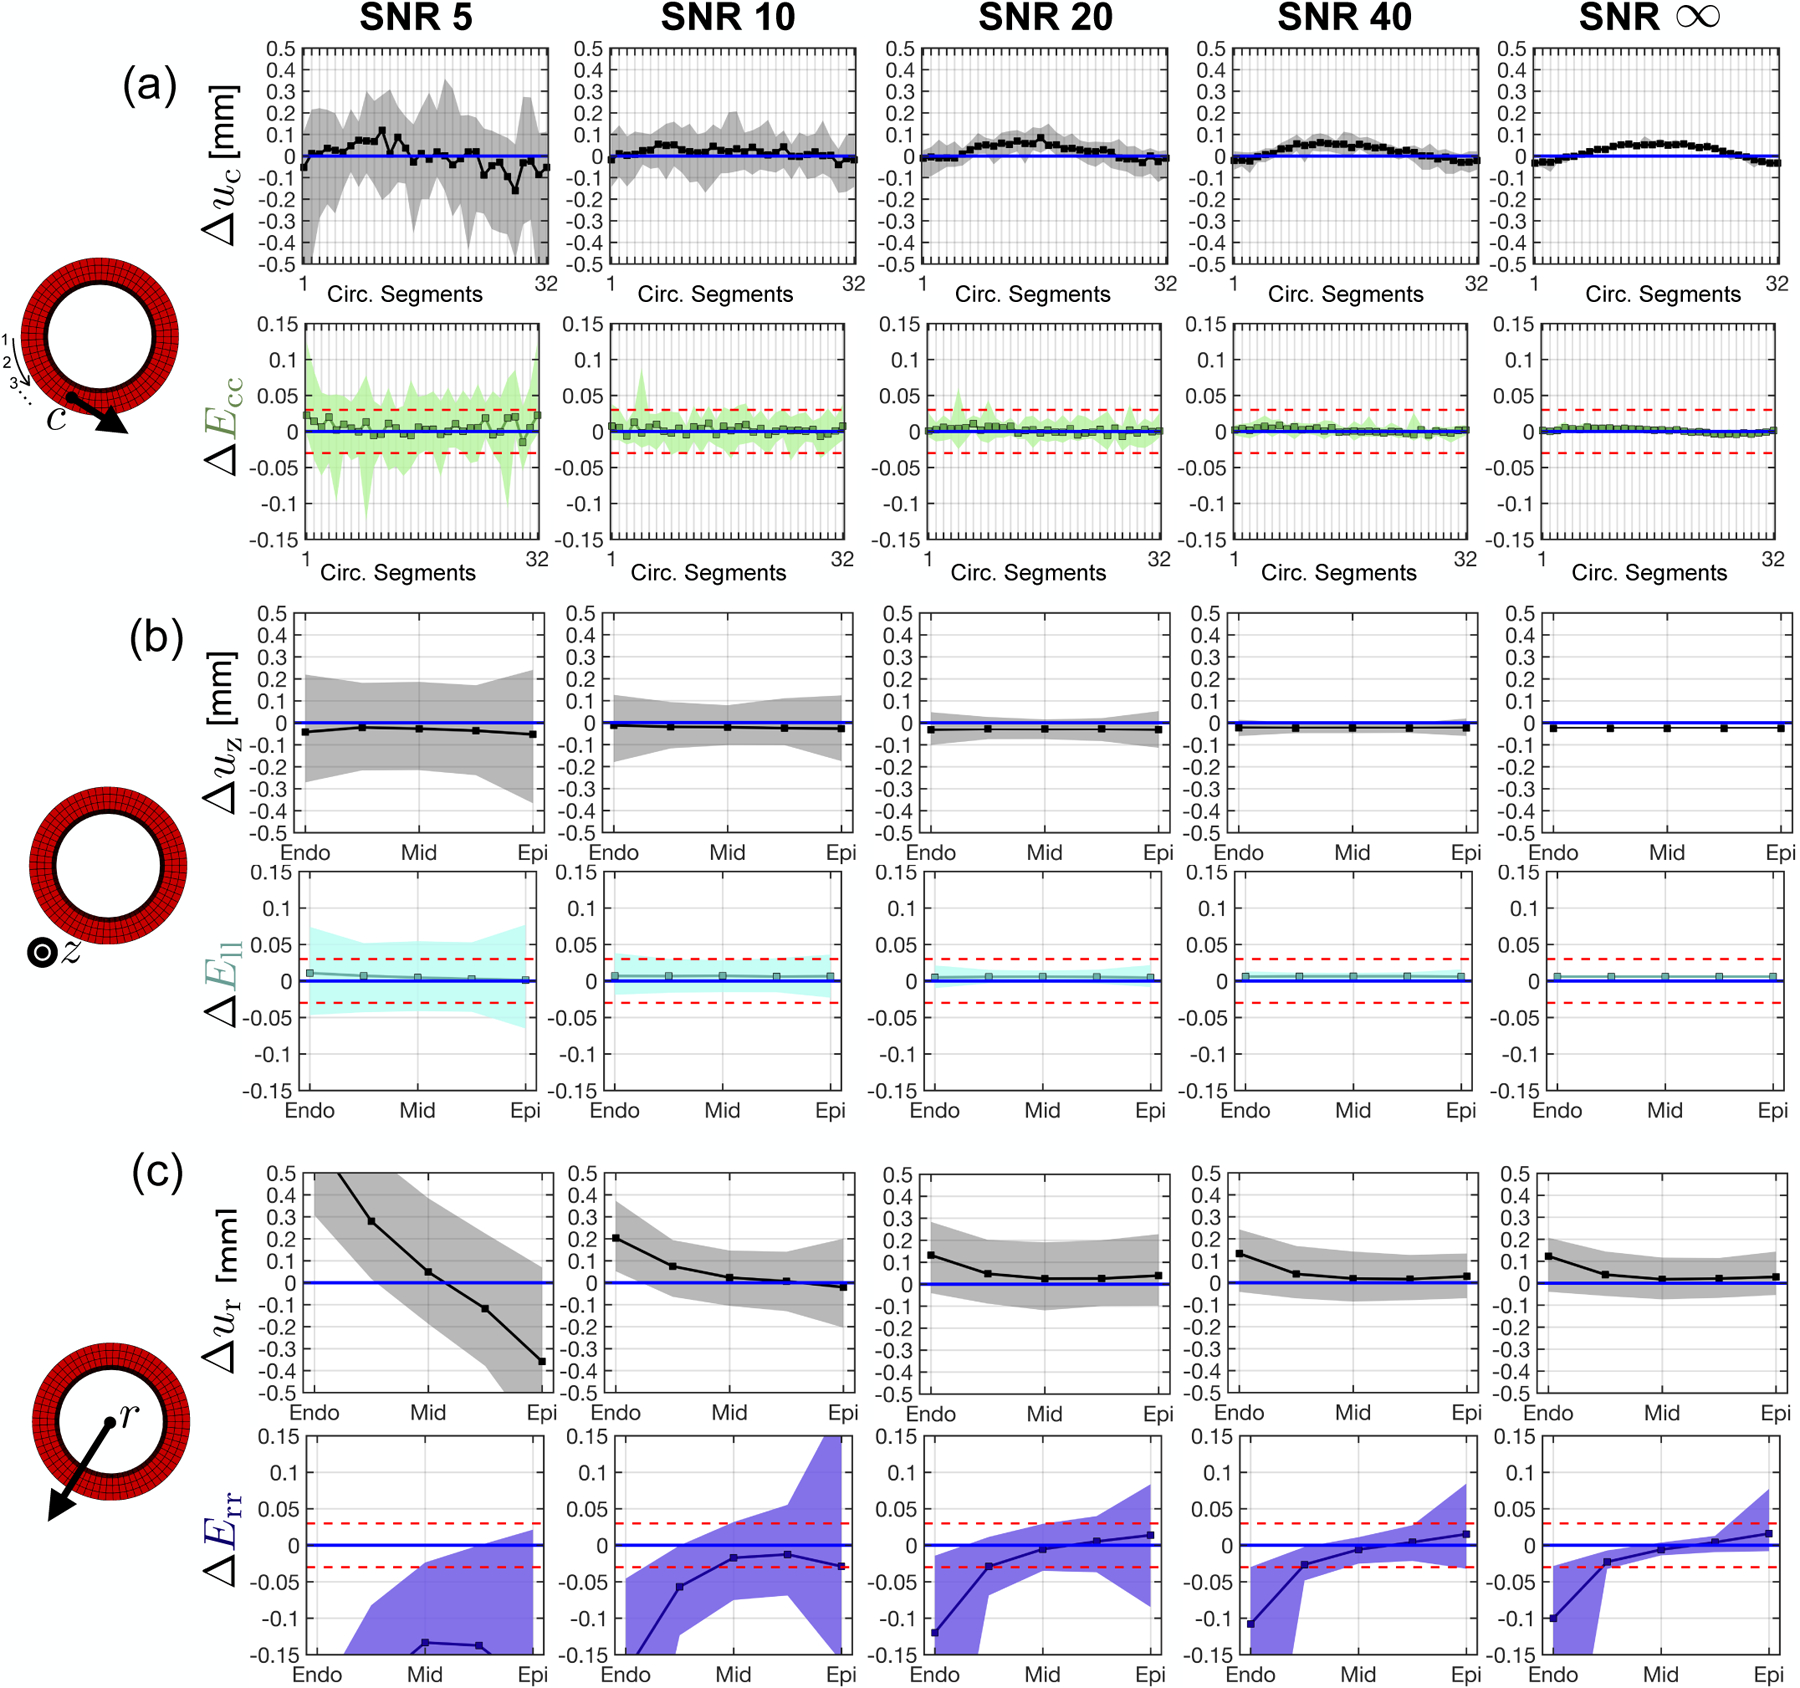
Strain and displacement bias in the radial, circumferential, and longitudinal directions across a range of SNRs. (a) Circumferential displacement (top) and strain (bottom) bias across 32 equal circumferential segments. The numbering of each segment is ordered in a counter-clockwise manner beginning at nine o’clock on the cylindrical phantom (left diagram), (b) Longitudinal displacement (top) and strain (bottom) bias from epicardium to endocardium, (c) Radial displacement (top) and strain (bottom) bias from epicardium to endocardium. Squares are strain bias medians and shaded regions are the 95%-CI of strain bias (i.e., the tolerance). Blue and red horizontal lines represent, respectively, 0 median strain bias and +0.020 to −0.020 strain tolerance.
Corresponding strain bias along the geometric axes are shown in color in the bottom panels of Fig. 5. ΔEll, ΔEcc, and mid-wall ΔErr show near-zero median strain bias across SNRs. Epicardial and endocardial ΔErr show a strain bias of −0.10 and +0.01 at the endocardium and epicardium, respectively. The 95%-CI for ΔEll, ΔEcc, and mid-wall ΔErr tightens to fall within the target tolerance of 0.04 for SNR > 20. 95%-CI for epicardial and endocardial ΔErr does not converge to within 0.04, even at SNR = ∞. Median ΔErr at the epicardium and endocardium tend towards zero when the simulated in-plane voxel size was decreased from 2.5 × 2.5mm to 2.0 × 2.0mm and 1.5 × 1.5mm (Supplemental Data).
The transmural course of ΔEff is shown in Fig. 6. Median ΔEff converges to zero and 95%-CI falls within the target tolerance for all SNR > 20.
Fig. 6.

Cardiomyocyte strain bias vs. wall depth computed at five equidistant transmural points. Squares are strain bias medians and shaded regions are the 95%-CI of strain bias (i.e., the tolerance). Blue and red horizontal lines represent 0 median strain bias and +0.020 to −0.020 strain tolerance, respectively.
III. In Vivo Image Acquisition and Analysis
Following the computational phantom validation, the same imaging and modeling framework was applied to a set of experimental MRI data to measure in vivo Eff. All MR imaging was acquired in healthy swine (N=8) at 3T (Prisma, Siemens) in agreement with animal research protocol ARC # 2015–124, approved by the UCLA Institutional Animal Care and use Committee.
A. In Vivo Imaging Protocol
1). cDTI Acquisition:
cDTI data was acquired in vivo at 10 short-axis locations at mid-systole (200 – 300ms trigger delay) using an M1–M2 nulled diffusion encoding gradient [9]. All cDTI data were acquired under free-breathing conditions using a prospective slice following motion correction technique [10]. A single mid-ventricular slice among the 10-slice stack was used in this work (Fig. 7a) as a proxy for the amount of data that can currently be acquired under clinical time constraints. A liver dome respiratory navigator with a tracking factor adjusted to 0.4 was used. Acquisition parameters were 2 × 2 × 8 mm, TE/TR = 74/10 * RR ms, Partial Fourier 6/8, Bandwidth 2085Hz/pixel, b-value = 0,350 s/mm2, Navg = 30, Ndir = 12. The scan time was nine minutes per imaged short-axis slice.
Fig. 7.
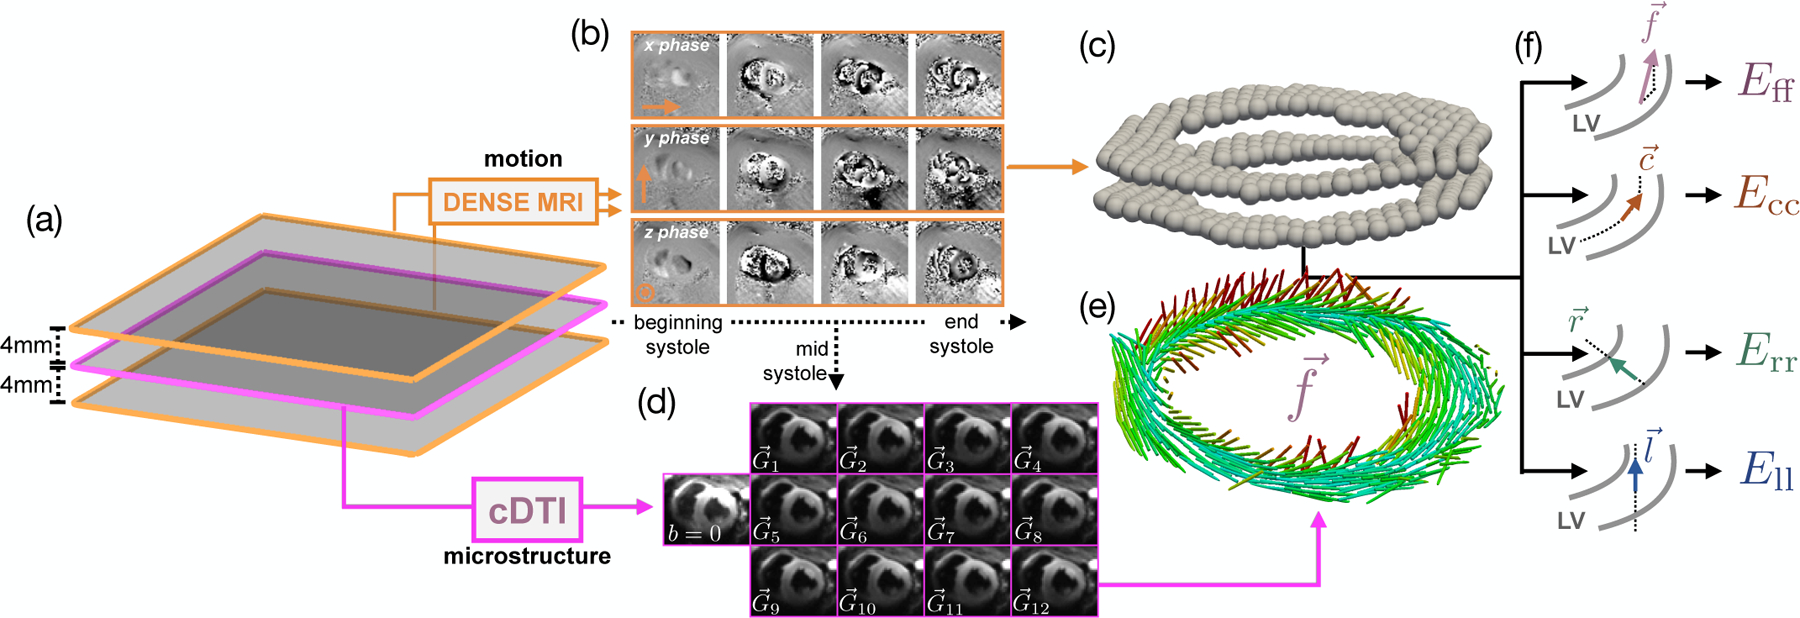
Model construction pipeline, (a) Two short-axis DENSE MR images were acquired 4mm above and below the cDTI location, (b) Example of acquired phase data in x, y, and z throughout systole, (c) Processed 3D deformation used to compute the deformation gradient tensor F at the location of the cDTI voxels, (d) Example of mid-systolic diffusion weighted images () acquired in vivo in one subject, (e) Preferential aggregate cardiomyocyte orientations for each voxel of the cDTI data, (f) Schematic demonstrating how the cardiomyocyte, circumferential, radial, and longitudinal directions are computed. The two gray curves represent the epicardial and endocardial contours of the LV.
Linear least-squares reconstruction of cDTI data yields pixel-wise symmetric rank-2 diffusion tensors (D) with eigenvectors . At each cDTI voxel, corresponds to the local aggregate cardiomyocyte orientation (). The mid-systolic diffusion weighted images (DWIs) were rigidly registered, and all registered images for the same diffusion gradient direction were averaged yielding a set of DWIs across 12 diffusion encoding directions (Fig. 7d) for reconstruction of D and (Fig. 7e).
2). DENSE Acquisition:
Time-resolved LV deformation during systole was measured at two short-axis locations spaced 4mm above and below the cDTI data (Fig. 7a) using the following DENSE protocol: 15ms view-shared temporal resolution (29–39 cardiac phases depending on RR interval), 2.5 × 2.5 × 8mm voxel size, balanced four-point phase encoding, TE/TR = 1.04/15ms, ke = 0.08cycles/mm, Navg = 3, spiral interleaves = 10. Using the same open-source Matlab tool [17] evaluated in the phantom study, the decoded x, y, and z phase data were segmented using phase-guided segmentation [23], spatiotemporally unwrapped, and temporally fit to yield voxel-wise, time-resolved Lagrangian LV deformation mapping φ (Fig. 7b,c). SNR was measured in all acquired DENSE images using the same air-myocardium based strategy outlined in previous DENSE SNR studies [15].
A sample DENSE MRI and cDTI dataset from this study can be found uploaded on IEEE DataPort (http://dx.doi.org/10.21227/2xpw-jb08).
B. Post-Processing and Strain Calculation for In Vivo Data
After image reconstruction, cDTI data were rigidly translated and rotated to register the LV with the acquired DENSE images (Matlab fitgeotrans [26]). This was aided by manually defining the right ventricular insertion points in the cDTI and mid-systolic DENSE images. The primary eignvector of D at each cDTI voxel was then rotated based on the aforementioned cDTI-DENSE registration.
After cDTI-DENSE spatial registration, the mid-systolic DENSE phase where cDTI data was acquired (the “diffusion cardiac phase”) was manually identified as the phase that best approximated the shape of the LV in the cDTI images. The LV in the cDTI images was segmented and an LV mask was generated from the contours. The center of each voxel in the mid-systolic cDTI LV mask was used to define the target locations Xq for displacement interpolation.
Up to this point, the cardiomyocyte position Xq and orientation were all measured in a mid-systolic state, while the standard reference state for cardiac strain measurements is at the beginning of systole (i.e. end diastole). Thus, the measured and Xq were mapped from mid-systole to the beginning of systole using the DENSE measured motion, i.e., φ. The use of 3D DENSE deformation mapping to temporally register cDTI data was previously validated in [25].
Xq was mapped to the beginning of systole using LME approximation functions according to:
| (10) |
where φ(Xq)|BS is the position of Xq at the beginning of systole and φα|BS is the corresponding position of DENSE node a at the beginnning of systole. As in eqn. 5, m was > 20 for each Xq and a trilinear interpolation was used to compute φ(Xq) where LME failed.
Aggregate cardiomyocte orientations for each Xq at the beginning of systole, were computed as:
| (11) |
where F(Xq) is here the deformation gradient associated with the deformation mapping from the reference mid-systolic configuration to the beginning of systole. F was computed according to eqns. 5–6. The registered was used as the aggregate cardiomyocyte orientation to compute Eff. Note that while the target for the DENSE-based registration was the beginning of systole, φ was measured at many points throughout systole. Thus, the same registration technique can be used to compute time-resolved Xq and from beginning to end systole.
After mid-systolic Xq and were mapped to the beginning of systole reference configuration, F was recomputed (eqns. 5–6) through systole using the beginning of systole as reference configuration. Strains at each Xq were computed at all imaged cardiac phases according to eqn. 7. The determinant of F computed with respect to the beginning of systole was used to evaluate tissue incompressibility in the imaged mid-ventricular slice.
The circumferential () direction was defined as a weighted linear interpolation of the reference state epicardial and endocardial contours at each Xq. The longitudinal () direction was defined as normal to the image plane. The radial vector was defined as the cross product of and (Fig. 7f). All , , , and vectors were normalized.
IV. In Vivo Results
The measured median (95%-CI) SNR in all acquired DENSE images was 64 (40,93) at the beginning of systole, and decayed to 39 (20,88) at the end of systole. This was significantly above the SNR-level of 20 determined from the phantom study as necessary to reach a strain tolerance of 0.04.
Fig. 8 shows the DENSE-based registration of and Xq from mid-systole back to the beginning of systole for a representative subject. Registration results are shown at several cardiac phases between beginning and end systole.
Fig. 8.

Results of DENSE-based registration for a representative subject. Time resolved (cylindrical bar orientation), Xq (cylindrical bar position), and cardiomyocyte elevation values (colormap) are shown. The registration target is the beginning of systole, however registration results are shown throughout systole. All times are reported with respect to the beginning of systole (t = 0ms). Note the longitudinal descent of the LV during systole.
The evolution of Eff, Ecc, Ell, and Err during the cardiac cycle is shown in Fig. 9. Median and interquartile range (IQR) strain results at peak systole across all imaged subjects were: −0.14 (−0.16, −0.14), −0.15 (−0.16, −0.14), 0.32 (0.30, 0.41) and −0.13 (−0.14, −0.12) for Eff, Ecc, Err, and Ell, respectively. Ecc showed a gradient from −0.12 at the epicardium to −0.18 at the endocardium. Err showed a gradient from 0.28 at the epicardium to 0.35 at the endocardium. Eff and Ell showed no significant transmural gradients across the three transmural layers.
Fig. 9.
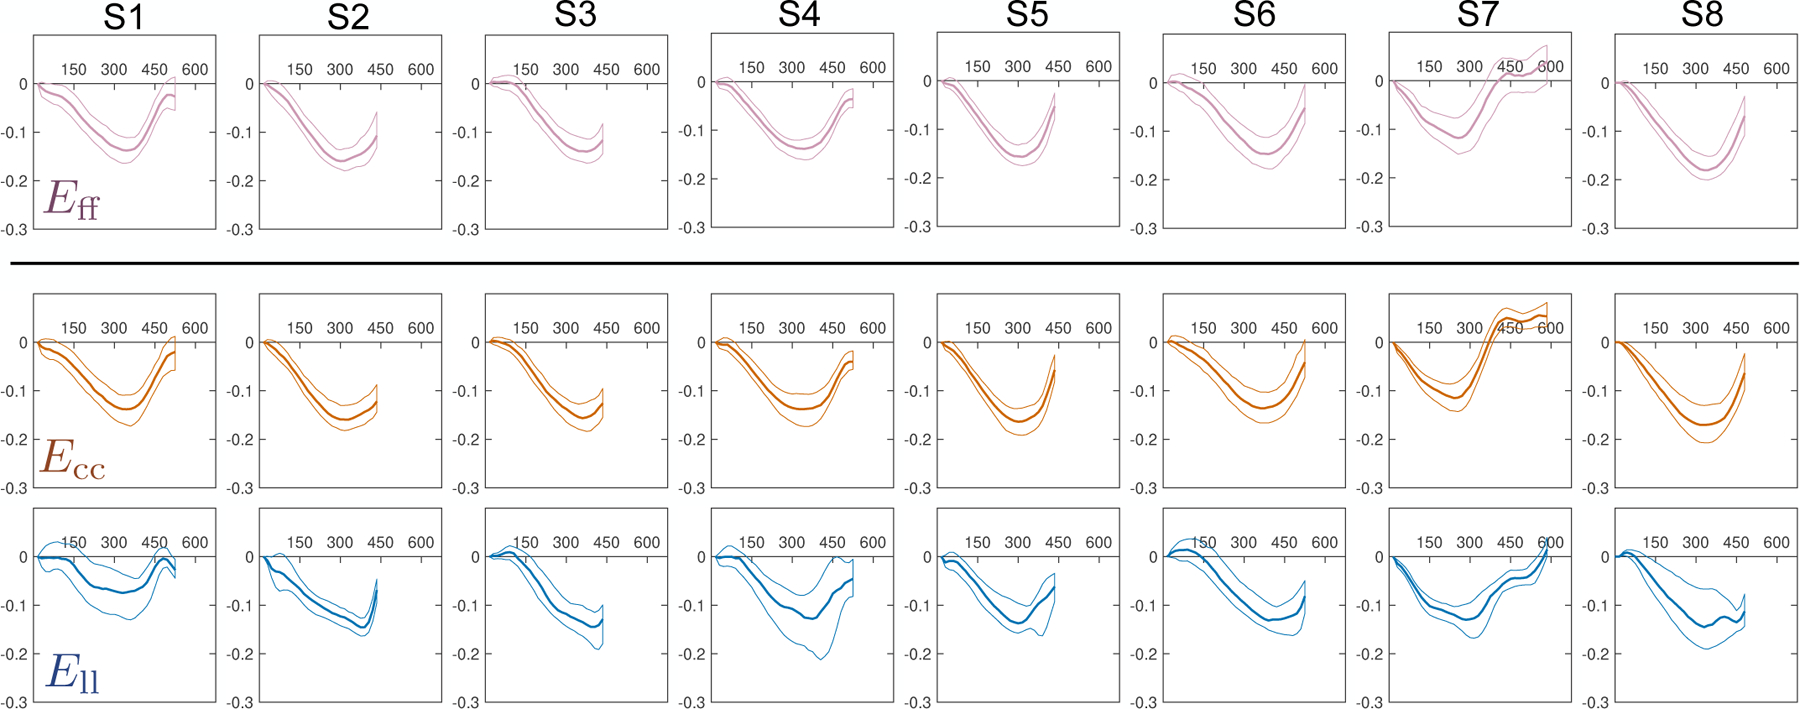
Eff, Ecc, Ell, and Err through time (horizontal axis, measured in [ms]) across all subjects (S1–S8). Solid lines represent the median at each cardiac phase, while thin lines represent the 25th and 75th quartiles. The reference state for all strains (i.e., Evv = 0) was defined as the beginning of systole (time=0ms).
Detailed epicardial to endocardial gradients of Eff and Ecc are shown for each imaged subject across ten transmural layers in Fig. 10. Importantly, the transmural variation of Eff was significantly reduced with respect to Ecc for each individual subject. Epicardial and endocardial Eff differed the most from Ecc, while midwall Eff was largely the same as midwall Ecc.
Fig. 10.
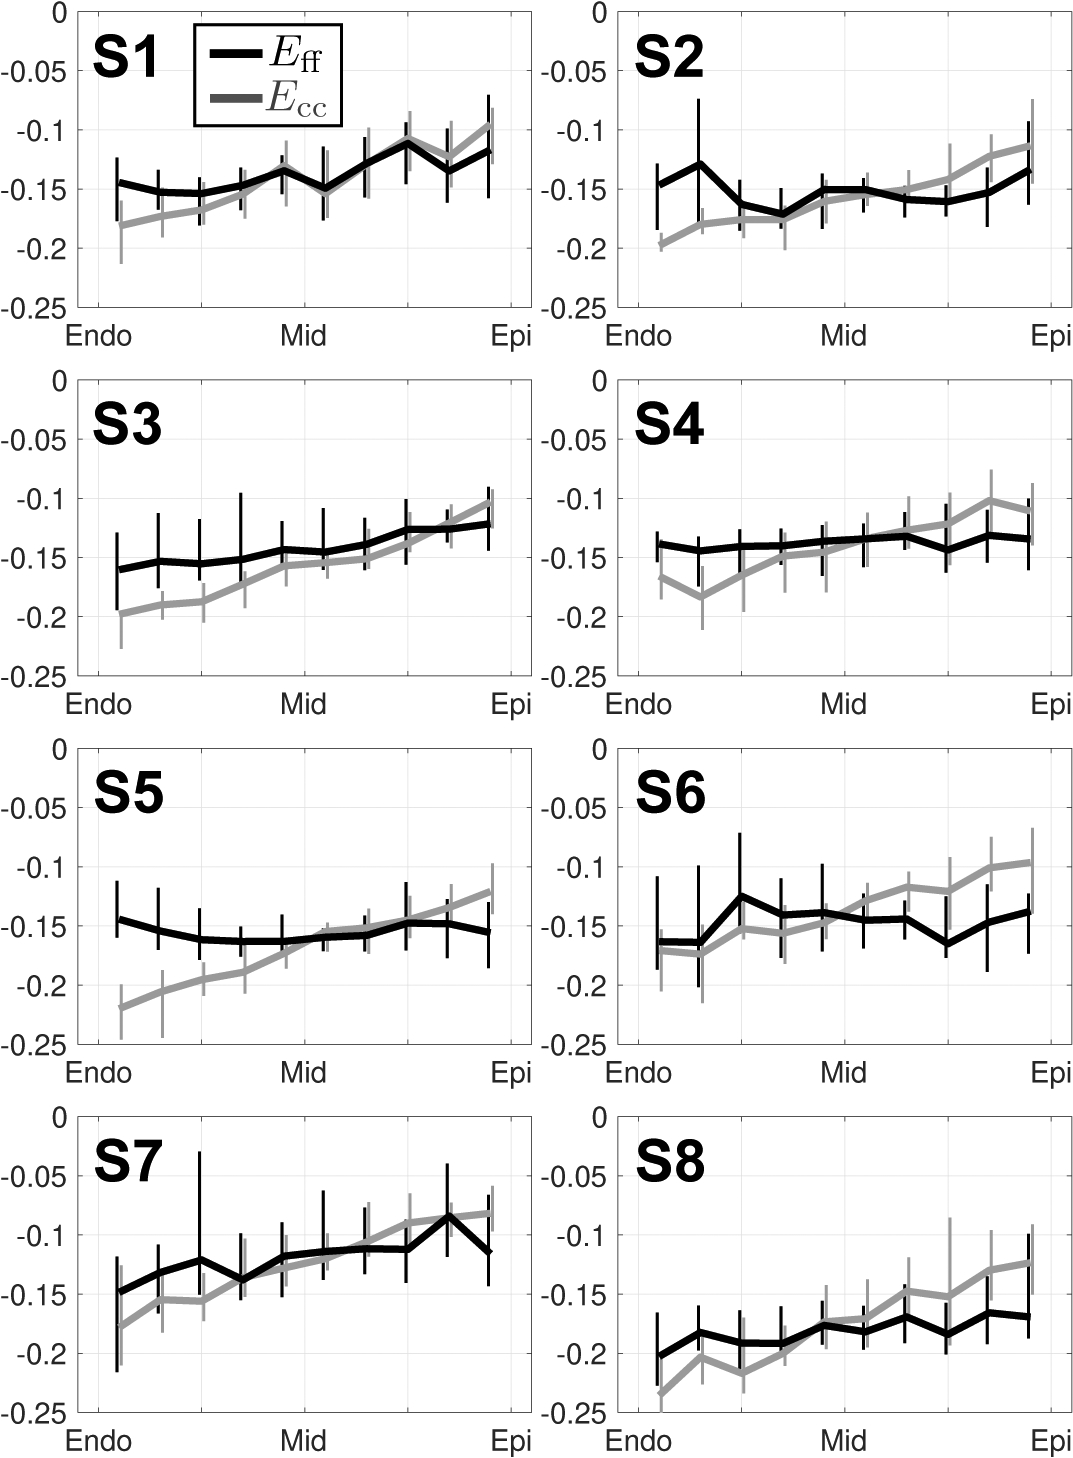
Transmural changes in Eff (black) and Ecc (grey) at peak systole in subjects S1 through S8. All strain data was placed into ten transmural bins. Medians and IQR (vertical lines) at each bin location are shown. Note the decreased transmural variability of Eff (flatter) versus Ecc (larger transmural gradient).
Median (IQR) tissue incompressibility measured from the DENSE displacement field at peak systole was 3.5% (2.6%, 6.0%) across all subjects (Supplemental Data).
V. Discussion
A. Computational Phantom Study
Phantom Ecc and Ell were computed with near-zero median bias and within a strain tolerance of 0.04 for SNR > 20. Although circumferential displacement error Δuc was still present in all segments along the phantom’s circumference — even at SNR = ∞ — the near-zero ΔEcc can be explained by the low rate of change of Δuc along the circumferential direction. All Δuv measured in the phantom were significantly less than the typical spatial resolution of DENSE MRI (2.5mm). However spatial heterogeneity in Δuv can lead to significant bias in strain estimation. The SNR results from the computational phantom study suggest that a typically achievable DENSE SNR > 20 is sufficient for reliably measuring cardiac strains along the circumferential and longitudinal directions. These phantom results correlate well with previous studies examining DENSE strains at different SNR levels. Wehner et al. [15] found no significant difference in strain measurements and displacement error between DENSE studies performed at 1.5T (SNR ≈ 25) and 3T (SNR ≈ 55).
In comparison, even without added noise (SNR = ∞), Err exhibited notable strain error at the endocardium. Unlike circumferential displacement error, median displacement error along the radius of the phantom did not show a low spatial variation, and spiked upwards going from midwall to endocardium. The pronounced error in Err at SNR = ∞ suggests that the DENSE pipeline does not adequately estimate motion at the endocardium along the radial direction and introduces a negative bias in Err estimates. Previous work examining DENSE with an analytical approach [12], [14] similarly found a wide spread and pronounced bias in DENSE-derived endocardial motion. In vivo experimental studies in humans and mice using the same DENSE pipeline have often reported Err as the most poorly reproducible strain component [27], [28].
Increasing the resolution of the simulated DENSE images decreased the magnitude of Err error (Supplemental data), but it did not eliminate the trend. The DENSE imaging pipeline employs several interpolation and smoothing steps: e.g., the interpolation from Eulerian-to-Lagrangian displacement description is achieved using radial basis functions, and the resulting trajectories are smoothed through time using a 10th- order polynomial [5]. We chose to use a 10th-order polynomial for all analysis in this work as it is the most widely used model, thereby facilitating our comparison to other in vivo DENSE studies. Further work is needed to identify which components of the DENSE imaging processing pipeline can be refined to decrease ΔErr.
Despite the pronounced error in Err at the endocardium, the transmural course of Eff was successfully estimated throughout the myocardium with near-zero median error and within the target strain tolerance of 0.04 for all SNR > 20. This is largely due to the fact that the cardiomyocyte aggregates are defined to lie parallel to the circumferential-longitudinal plane, with no radial component. If strain analysis is extended along another microstructrual axis (e.g., the cross-fiber direction), a larger contribution from Err bias is to be expected.
B. In Vivo Study
Peak systolic tissue incompressibility for all subjects showed good agreement with reported myocardium quasi-incompressibility [20], [21]. These results provide additional evidence that myocardial tissue volume changes by 2 – 4% during systole, consistent with an exchange of blood volume in the myocardial capillary bed [29].
The magnitudes of all measured geometric strains are slightly below the values reported in other other DENSE studies of 3D LV motion in humans [5]. The small discrepancies in strain magnitudes can be attributed to potential inter-species differences that exist between human and swine LV kinematics. In addition, all the measures were acquired during anesthesia, which can depress cardiac contraction. The transmural trends of Ecc and Ell agree well with [5], [16]. Compared to these studies, the magnitude of endocardial Err is underestimated, which can be explained by the negative Err bias reported at the endocardium of the analytical phantom.
Median (IQR) Eff was −0.14 (−0.16, −0.14), which is in general agreement with previous imaging and model based studies on aggregate cardiomyocyte strain [8], [30]. The measured median Eff is higher than the values reported in [31]. However, these studies separately examined ventricular motion and micro structure, using MRI tagging and histological techniques that require fixing and sectioning of the tissue. The complex registration required between these separate datasets combined with the destructive nature of tissue sectioning confounds estimates of Eff. In contrast, the measured median Eff is slightly lower than the estimate reported in [8]. However, Wang et al. estimated Eff in humans and combined in vivo with ex vivo data, which may explain the differences in the measured Eff median value.
As previously reported in [8], [32], strain through-wall gradient is significantly less steep for Eff than for Ecc, supporting the observation that aggregate cardiomycyte strain is a more spatially uniform measure of cardiac kinematics. In vitro studies of cardiomyocyte contractility [33], [34] have demonstrated minimal differences in cardiomyocyte strain at different transmural layers of the same heart. Finite element studies of left ventricular function [30] have hypothesized that the microstructure of the LV is specifically organized to achieve uniformity in cardiomyocyte strain. The results from this study provide in vivo evidence to support this hypothesis.
To our knowledge, this framework is the first to measure Eff entirely from in vivo MRI data that can be feasibly acquired in a clinical setting. All MRI data used in this study can be acquired in ~ 20 minutes (nine minute cDTI scan + ten minutes of DENSE imaging) under free-breathing conditions, which eases the framework’s applicability to studying cardiac dysfunction in heart failure patients. With respect to traditionally measured cardiac strains (Ecc, Err, and Ell), Eff provides a more reproducible, robust, and microstructurally anchored metric of cardiac function. The definition of the circumferential, radial and longitudinal directions depend heavily on the orientation and position of the images and their segmentation, whereas is directly measured from the tissue microstructure. Therefore, Eff is particularly suited for longitudinal studies examining cardiac function during the progression of LV remodelling.
C. Study Limitations
Several limitations in the phantom simulation may result in underestimation of the SNR-level required to reach near-zero strain bias and 0.04 strain tolerance. First, the phantom is constructed from idealized axial-symmetric LV geometry and displacements, which only approximates the in vivo motion and anatomy of the LV. Strain bias may be higher in different LV segments. Second, the phantom simulation assumes that a DENSE MRI acquisition occurs during the span of one heart beat. In reality, a single systolic DENSE acquisition requires consecutive readouts over many heartbeats, and inter-beat physiologic variability may lead to errors in strain estimates. Inter-beat variation is not accounted for as a source of strain bias in the current phantom simulations. Third, the phantom simulation does not account for mis-registration that can occur due to the respiratory motion of the imaged subject. Most modem DENSE sequences employ a respiratory navigator that triggers image acquisition only within a limited window of respiratory phases. While this may limit respiratory-induced misalignment, it does not eliminate it as a source of strain error. Finally, we do not simulate the complex DENSE MRI signal decay during the cardiac cycle, which would require directly solving the Bloch equations during simulated motion. Each limitation may be addressed in future studies by improving the phantom geometry, motion simulation, and the conversion of the MRI signal to the DENSE displacement field. It is also important to note that these sources of strain error may not always be reflected in image SNR.
Some aspects of the proposed pipeline augment error from in vivo MRI data. Since the 3D DENSE displacement field is differentiated, experimental noise and error are likely amplified leading to a large spread in the computed strain values. Furthermore, this study did not examine how error in in vivo cDTI data propagates to error in Eff. This motivates future work to examine how variations within the previously characterized 16° cone of uncertainty in cDTI-measured mid-systolic [35] affects Eff estimates.
VI. Conclusion
In this work, an MRI-based framework is presented to estimate LV aggregate cardiomyocyte strain (Eff) using cDTI and DENSE MRI data.
The 3D cardiac-like analytic phantom enabled examination of the DENSE processing pipeline by comparing the computed results to “ground truth” 3D analytical displacement and strain data. The flexibility of our validation pipeline allows for future assessment of the impact that other imaging parameters (e.g., resolution, encoding strength, number of encoding directions) have on measured cardiac strains. These simulations can provide a priori estimates of required DENSE protocol parameters to achieve a target strain sensitivity in clinical studies.
Application of the proposed framework to experimental MRI data demonstrated that Eff is a more spatially uniform, microstructurally-anchored metric of LV motion. While mid-wall circumferential strain has been used as a clinical surrogate for Eff, the proposed framework estimates Eff throughout the myocardium and does not rely on geometric assumptions to identify the circumferential direction and transmural location. In vivo Eff is a spatially uniform, robust, and mechanistically significant measure of LV motion, which make Eff a compelling candidate for use in longitudinal clinical studies of cardiac dysfunction and remodelling.
Supplementary Material
TABLE I.
Median (IQR) Transmural strain results for all healthy subjects at peak systole
| Endocardium | Midwall | Epicardium | |
|---|---|---|---|
| Eff | −0.15 (−0.16,−0.15) | −0.14 (−0.16,−0.14) | −0.14 (−0.16,−0.12) |
| Ecc | −0.18 (−0.20,−0.17) | −0.15 (−0.16,−0.14) | −0.12 (−0.13,−0.11) |
| Err | 0.35 (0.29,0.40) | 0.38 (0.33,0.42) | 0.28 (0.24,0.36) |
| E11 | −0.13 (−0.14,−0.12) | −0.13 (−0.13,−0.12) | −0.13 (−0.13,−0.12) |
Acknowledgments
This work was supported by NIH/NHLBI K25-HL135408, R01-HL131975, and R01-HL131823.
Contributor Information
Ilya A. Verzhbinsky, Department of Radiological Sciences, Stanford University, Stanford, CA, 94305, USA..
Luigi E. Perotti, Department of Mechanical and Aerospace Engineering, University of Central Florida, Orlando, FL, 32816, USA.
Kévin Moulin, Department of Radiological Sciences, Stanford University, Stanford, CA, 94305, USA..
Tyler E. Cork, Department of Radiological Sciences and the Department of Bioengineering, Stanford University, Stanford, CA, 94305, USA.
Michael Loecher, Department of Radiological Sciences, Stanford University, Stanford, CA, 94305, USA..
Daniel B. Ennis, Department of Radiological Sciences, Stanford University, Stanford, CA, 94305, USA..
References
- [1].Schoch S, Verzhbinsky I, Kim R, Sejnowski T, and Kurth S, “Improved automatic classification of sleep stages in infants using high-density eeg recordings,” Sleep Medicine, vol. 64, p. S339, 2019, abstracts from the 15th World Sleep Congress, September 20–25, 2019 World Sleep 2019 in Vancouver, Canada. [Online]. Available: http://www.sciencedirect.com/science/article/pii/S1389945719313103 [Google Scholar]
- [2].Luk A, Ahn E, Soor GS, and Butany J, “Dilated cardiomyopathy: a review,” Journal of clinical pathology, vol. 62, no. 3, pp. 219–225, 2009. [DOI] [PubMed] [Google Scholar]
- [3].Olivotto I, Cecchi F, Poggesi C, and Yacoub MH, “Developmental origins of hypertrophic cardiomyopathy phenotypes: a unifying hypothesis,” Nature reviews cardiology, vol. 6, no. 4, p. 317, 2009. [DOI] [PubMed] [Google Scholar]
- [4].Wang H and Amini AA, “Cardiac motion and deformation recovery from MRI: a review,” IEEE Transactions on Medical Imaging, vol. 31, no. 2, pp. 487–503, 2012. [DOI] [PubMed] [Google Scholar]
- [5].Zhong X, Spottiswoode BS, Meyer CH, Kramer CM, and Epstein FH, “Imaging three-dimensional myocardial mechanics using navigator-gated volumetric spiral cine DENSE MRI,” Magnetic resonance in medicine, vol. 64, no. 4, pp. 1089–1097, 2010. [DOI] [PMC free article] [PubMed] [Google Scholar]
- [6].Cho G-Y, Marwick TH, Kim H-S, Kim M-K, Hong K-S, and Oh DJ, “Global 2-dimensional strain as a new prognosticator in patients with heart failure,” Journal of the American College of Cardiology, vol. 54, no. 7, pp. 618–624, 2009. [DOI] [PubMed] [Google Scholar]
- [7].de Simone G, Devereux RB, Roman MJ, Ganau A, Saba PS, Alderman MH, and Laragh JH, “Assessment of left ventricular function by the midwall fractional shortening/end-systolic stress relation in human hypertension,” Journal of the American College of Cardiology, vol. 23, no. 6, pp. 1444–1451, 1994. [DOI] [PubMed] [Google Scholar]
- [8].Wang VY, Casta C, Zhu Y-M, Cowan BR, Croisille P, Young AA, Clarysse P, and Nash MP, “Image-based investigation of human in vivo myofibre strain,” IEEE transactions on medical imaging, vol. 35, no. 11, pp. 2486–2496, 2016. [DOI] [PubMed] [Google Scholar]
- [9].Aliotta E, Wu H, and Ennis D, “Convex optimized diffusion encoding (CODE) gradient waveforms for minimum echo time and bulk motion-compensated diffusion-weighted MRI,” Magn Reson Med, vol. 77, no. 2, pp. 717–729, 2017. [DOI] [PubMed] [Google Scholar]
- [10].Moulin K, Croisille P, Feiweier T, Delattre BM, Wei H, Robert B, Beuf O, and Viallon M, “In vivo free-breathing DTI and IVIM of the whole human heart using a real-time slice-followed SE-EPI navigator-based sequence: A reproducibility study in healthy volunteers,” Magnetic resonance in medicine, vol. 76, no. 1, pp. 70–82, 2016. [DOI] [PubMed] [Google Scholar]
- [11].Stoeck CT, Von Deuster C, Genet M, Atkinson D, and Kozerke S, “Second order motion compensated spin-echo diffusion tensor imaging of the human heart,” Journal of Cardiovascular Magnetic Resonance, vol. 17, no. 1, p. P81, 2015. [DOI] [PubMed] [Google Scholar]
- [12].Perotti L, Magrath P, Verzhbinsky I, Aliotta E, Moulin K, and Ennis D, “Microstructurally Anchored Cardiac Kinematics by Combining In Vivo DENSE MRI and cDTI,” in FIMH conference. Springer, 2017, pp. 381–391. [DOI] [PMC free article] [PubMed] [Google Scholar]
- [13].Zhong X, Helm PA, and Epstein FH, “Balanced multipoint displacement encoding for DENSE MRI,” Magnetic Resonance in Medicine: An Official Journal of the International Society for Magnetic Resonance in Medicine , vol. 61, no. 4, pp. 981–988, 2009. [DOI] [PMC free article] [PubMed] [Google Scholar]
- [14].Young AA, Li B, Kirton RS, and Cowan BR, “Generalized spatiotemporal myocardial strain analysis for DENSE and SPAMM imaging,” Magnetic resonance in medicine, vol. 67, no. 6, pp. 1590–1599, 2012. [DOI] [PubMed] [Google Scholar]
- [15].Wehner GJ, Suever JD, Haggerty CM, Jing L, Powell DK, Hamlet SM, Grabau JD, Mojsejenko WD, Zhong X, Epstein FH et al. , “Validation of in vivo 2D displacements from spiral cine DENSE at 3T,” Journal of cardiovascular magnetic resonance, vol. 17, no. 1, p. 5, 2015. [DOI] [PMC free article] [PubMed] [Google Scholar]
- [16].Moore CC, Lugo-Olivieri CH, McVeigh ER, and Zerhouni EA, “Three-dimensional systolic strain patterns in the normal human left ventricle: characterization with tagged MR imaging,” Radiology, vol. 214, no. 2, pp. 453–466, 2000. [DOI] [PMC free article] [PubMed] [Google Scholar]
- [17].Spottiswoode BS, Zhong X, Hess AT, Kramer C, Meintjes EM, Mayosi BM, and Epstein FH, “Tracking myocardial motion from cine DENSE images using spatiotemporal phase unwrapping and temporal fitting,” IEEE transactions on medical imaging, vol. 26, no. 1, pp. 15–30, 2007. [DOI] [PubMed] [Google Scholar]
- [18].Gilliam AD, Suever JD, and contributors, DENSEanalysis. Retrieved from https://github.com/denseanalysis/denseanalysis, 2016.
- [19].Ennis DB, Nguyen TC, Riboh JC, Wigstrom L, Harrington KB, Daughters GT, Ingels NB, and Miller DC, “Myofiber angle distributions in the ovine left ventricle do not conform to computationally optimized predictions,” Journal of biomechanics, vol. 41, no. 15, pp. 3219–3224, 2008. [DOI] [PMC free article] [PubMed] [Google Scholar]
- [20].Yin F, Chan C, and Judd RM, “Compressibility of perfused passive myocardium,” American Journal of Physiology-Heart and Circulatory Physiology, vol. 271, no. 5, pp. H1864–H1870, 1996. [DOI] [PubMed] [Google Scholar]
- [21].Rodriguez I, Ennis DB, and Wen H, “Noninvasive measurement of myocardial tissue volume change during systolic contraction and diastolic relaxation in the canine left ventricle,” Magnetic Resonance in Medicine: An Official Journal of the International Society for Magnetic Resonance in Medicine, vol. 55, no. 3, pp. 484–490, 2006. [DOI] [PMC free article] [PubMed] [Google Scholar]
- [22].Wehner GJ, Grabau JD, Suever JD, Haggerty CM, Jing L, Powell DK, Hamlet SM, Vandsburger MH, Zhong X, and Fornwalt BK, “2D cine DENSE with low encoding frequencies accurately quantifies cardiac mechanics with improved image characteristics,” Journal of cardiovascular magnetic resonance, vol. 17, no. 1, p. 93, 2015. [DOI] [PMC free article] [PubMed] [Google Scholar]
- [23].Spottiswoode BS, Zhong X, Lorenz CH, Mayosi BM, Meintjes EM, and Epstein FH, “Motion-guided segmentation for cine DENSE MRI,” Medical image analysis, vol. 13, no. 1, pp. 105–115, 2009. [DOI] [PMC free article] [PubMed] [Google Scholar]
- [24].Arroyo M and Ortiz M, “Local maximum-entropy approximation schemes: a seamless bridge between finite elements and meshfree methods,” Int J Numer Meth Eng, vol. 65, no. 13, pp. 2167–2202, 2006. [Google Scholar]
- [25].Verzhbinsky IA, Magrath P, Aliotta E, Ennis DB, and Perotti LE, “Time resolved displacement-based registration of in vivo cDTI cardiomyocyte orientations,” in Biomedical Imaging (ISBI 2018), 2018 IEEE 15th International Symposium on. IEEE, 2018, pp. 474–478. [DOI] [PMC free article] [PubMed] [Google Scholar]
- [26].MATLAB, version 9.2 (R2017a). Natick, Massachusetts: The Math-Works Inc., 2017. [Google Scholar]
- [27].Haggerty CM, Kramer SP, Binkley CM, Powell DK, Mattingly AC, Charnigo R, Epstein FH, and Fornwalt BK, “Reproducibility of cine displacement encoding with stimulated echoes (DENSE) cardiovascular magnetic resonance for measuring left ventricular strains, torsion, and synchrony in mice,” Journal of cardiovascular magnetic resonance, vol. 15, no. 1, p. 71, 2013. [DOI] [PMC free article] [PubMed] [Google Scholar]
- [28].Lin K, Meng L, Collins JD, Chowdhary V, Markl M, and Carr JC, “Reproducibility of cine displacement encoding with stimulated echoes (DENSE) in human subjects,” Magnetic resonance imaging, vol. 35, pp. 148–153, 2017. [DOI] [PMC free article] [PubMed] [Google Scholar]
- [29].Judd RM and Levy BI, “Effects of barium-induced cardiac contraction on large-and small-vessel intramyocardial blood volume.” Circulation research, vol. 68, no. 1, pp. 217–225, 1991. [DOI] [PubMed] [Google Scholar]
- [30].Kerckhoffs R, Bovendeerd P, Kotte J, Prinzen F, Smits K, and Arts T, “Homogeneity of cardiac contraction despite physiological asynchrony of depolarization: a model study,” Annals of biomedical engineering, vol. 31, no. 5, pp. 536–547, 2003. [DOI] [PubMed] [Google Scholar]
- [31].Rademakers FE, Rogers WJ, Guier WH, Hutchins GM, Siu CO, Weisfeldt ML, Weiss JL, and Shapiro EP, “Relation of regional cross-fiber shortening to wall thickening in the intact heart. Three-dimensional strain analysis by NMR tagging.” Circulation, vol. 89, no. 3, pp. 1174–1182, 1994. [DOI] [PubMed] [Google Scholar]
- [32].Tseng W-YI, Reese TG, Weisskoff RM, Brady TJ, and Wedeen VJ, “Myocardial fiber shortening in humans: initial results of MR imaging,” Radiology, vol. 216, no. 1, pp. 128–139, 2000. [DOI] [PubMed] [Google Scholar]
- [33].McCrossan ZA, Billeter R, and White E, “Transmural changes in size, contractile and electrical properties of SHR left ventricular myocytes during compensated hypertrophy,” Cardiovascular research, vol. 63, no. 2, pp. 283–292, 2004. [DOI] [PubMed] [Google Scholar]
- [34].Smail MM, Qureshi MA, Shmygol A, Oz M, Singh J, Sydorenko V, Arabi A, Howarth FC, and Al Kury L, “Regional effects of streptozotocin-induced diabetes on shortening and calcium transport in epicardial and endocardial myocytes from rat left ventricle,” Physiological reports, vol. 4, no. 22, 2016. [DOI] [PMC free article] [PubMed] [Google Scholar]
- [35].Aliotta E, Moulin K, Magrath P, and Ennis DB, “Quantifying precision in cardiac diffusion tensor imaging with second-order motion-compensated convex optimized diffusion encoding,” Magnetic resonance in medicine, vol. 80, no. 3, pp. 1074–1087, 2018. [DOI] [PMC free article] [PubMed] [Google Scholar]
Associated Data
This section collects any data citations, data availability statements, or supplementary materials included in this article.


