Abstract
Background
Growing evidence indicates an association between cerebral microhemorrhages (MHs) and amyloid β accumulation in Alzheimer disease (AD), but to the knowledge of the authors the association with tau burden is unknown.
Purpose
To investigate the association between cerebral MH load and tau pathologic structure measured in healthy older individuals and individuals along the AD spectrum, stratified by using the A (amyloid β)/T (tau)/N (neurodegeneration) biomarker classification system.
Materials and methods
In this prospective cohort study, participants from the AD Neuroimaging Initiative were included (healthy control participants, participants with mild cognitive impairment, and participants with AD dementia; data from October 2005 to January 2019). T2*-weighted gradient-echo MRI was performed to quantify MH, fluorine 18 (18F) flortaucipir (AV-1451) PET was performed to quantify tau, and 18F-florbetaben/18F- florbetapir (AV45) PET was performed to quantify amyloid β to study associations of MH with regional and global tau and amyloid β load. Associations with cerebrospinal fluid (CSF) biomarkers (amyloid β1–42, total tau, phosphorylated tau 181) were also assessed. Analysis of covariance and Spearman rank correlation test for cross-sectional analysis and Wilcoxon signed rank test for longitudinal analyses were used, controlling for multiple comparisons (Bonferroni significance threshold, P < .008).
Results
Evaluated were 343 participants (mean age, 75 years ± 7; 186 women), including 205 participants who were A−TN− (mean age, 73 years ± 7; 115 women), 80 participants who were A+TN− (mean age, 76 years ± 7; 38 women), and 58 participants who were A+TN+ (mean age, 77 ± 8; 34 women). MH count was associated with global (Spearman ρ = 0.27; P = .004) and frontal (ρ = 0.27; P = .005) amyloid β load and global tau load (ρ = 0.31; P = .001). In a longitudinal analysis, MH count increased significantly over approximately 5 years in the entire cohort (T-1, 81 [range, 0–6 participants]; T0, 214 [range, 0–58 participants]; P < .001), in A+TN+ (T-1, 20 [range, 0–5 participants]; T0, 119 [range, 1–58 participants]; P < .001), A+TN− (T-1, 31 [range, 0–6 participants]; T0, 43 [range, 0–8 participants]; P = .03), and A−TN− (T-1, 30 [range, 0–4 participants]; T0, 52 [range, 0–6 participants]; P = .007). A higher MH count was associated with higher future global (ρ = 0.29; P = .008) and parietal (ρ = 0.31; P = .005) amyloid β and parietal tau load (ρ = 0.31; P = .005).
Conclusion
Cerebral microhemorrhage load is associated spatially with tau accumulation, both cross-sectionally and longitudinally.
© RSNA, 2020
Summary
In individuals with mild cognitive impairment and early Alzheimer disease, and in healthy individuals, MRI microhemorrhage count was associated with amyloid β and tau load at PET.
Key Results
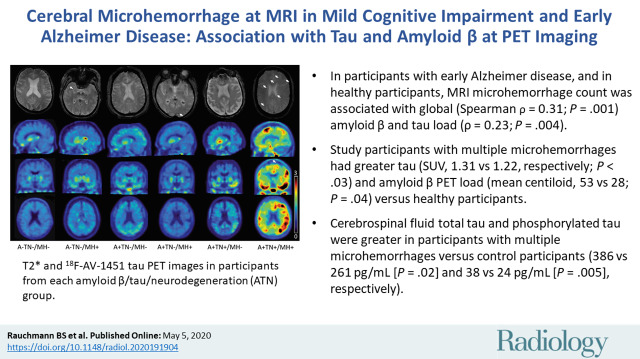
■ In participants with mild cognitive impairment, early Alzheimer disease, and in healthy participants, MRI microhemorrhage (MH) count was associated with global (Spearman ρ = 0.31; P = .001) amyloid β and tau load (ρ = 0.23; P = .004).
■ Study participants with multiple MHs had greater tau (standardized uptake value ratio, 1.31 vs 1.22, respectively; P < .03) and amyloid β PET load (mean centiloid, 53 vs 28; P = .04) versus healthy participants.
■ Cerebrospinal fluid total tau and phosphorylated tau were greater in participants with multiple MHs versus control participants (386 vs 261 pg/mL [P = .02] and 38 vs 24 pg/mL [P = .005], respectively).
Introduction
Neuropathologic (1), neuroimaging (2), and cerebrospinal fluid (CSF) protein marker findings (3) indicate that vascular changes are key determinants of cognitive decline in old age. Small-vessel disease contributes to dementia cases globally, including those predominantly attributed to Alzheimer disease (AD) (4). An increasing number of midlife vascular risk factors are associated with a higher late-life in vivo amyloid β burden, independent from APOE (5). Vascular pathophysiology in AD is linked to toxic effects of amyloid β and hypertension-accelerated amyloid β deposition by promoting β-secretase activity (6) in AD mice (overexpressing mutated human amyloid precursor and presenilin 1 proteins).
Cerebral microhemorrhage (MH) is an established marker of small-vessel disease: Lobar distribution reflects cerebral amyloid angiopathy, whereas changes in the deep white matter occur in arterial hypertension, mostly unrelated to cognitive deterioration (7). Previous studies (8–10) identified a typical topographic distribution of MH in AD with lesions located in occipital and temporoparietal structures. However, MH in hypertensive vasculopathy are predominantly located in brainstem, basal ganglia, and thalamus (11). Lobar vascular changes are also associated with CSF phosphorylated tau (hereafter, phospho-tau) levels independent from amyloid β (7).
In AD mice, amyloid β and tau accumulation may lead to an early breakdown of the blood-brain barrier (12). Human data suggest that individuals with mild cognitive impairment show hippocampal blood-brain barrier breakdown even in the absence of amyloid β and tau (13). MH is a frequent manifestation of vascular alterations in early AD (10,14) and more prevalent in APOE ε4-allele carriers (15). Individuals with mild cognitive impairment and AD dementia show a strong correlation between PET amyloid β load and MH count (9), and individuals with decreased amyloid β and increased total tau and phospho-tau CSF levels have increased cortical MHs (16,17). Findings in cerebral amyloid angiopathy suggest that MH are preferentially localized in brain regions with concentrated amyloid β (18), with evidence from case studies suggesting an association between MH and tau PET load (19) but not CSF total tau and phospho-tau (20). However, the spatial associations between MH, amyloid β, and tau load, to our knowledge, have so far not been addressed explicitly by using PET imaging in AD.
Our main aim was to investigate the spatial associations between MH and tau PET pathologic structure cross sectionally and longitudinally in cognitively normal older individuals and individuals with mild cognitive impairment and early AD dementia by considering the presence of fibrillar amyloid β. We decided to focus on MH instead of other MRI vascular abnormalities because their pathogenesis is comparable to AD and because MHs may have a role in triggering adverse reaction to anti-amyloid β immunotherapy (21).
Materials and Methods
Data used in the preparation of this study were obtained on January 25, 2019, from the database of the prospective AD Neuroimaging Initiative (ADNI) study, launched in October 2004 (http://adni.loni.usc.edu/). All procedures performed in the ADNI studies that involved human participants were in accordance with the ethical standards of the institutional research committees and with the 1964 Helsinki declaration and its later amendments. Written informed consent was obtained from all participants or their authorized representatives. The study procedures were approved by the institutional review boards of all participating ADNI sites.
Study Participants
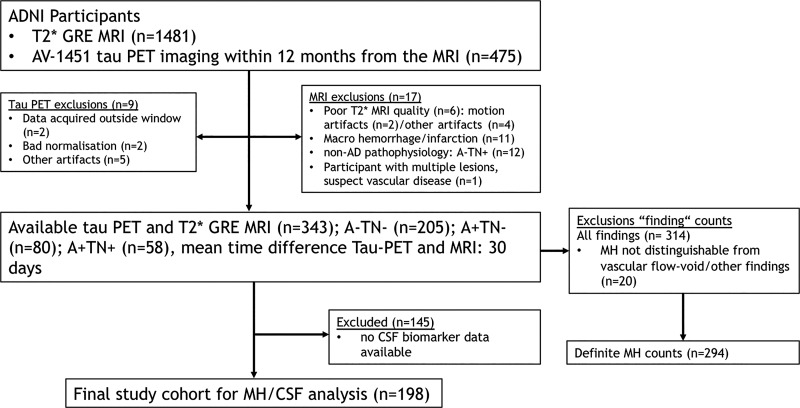
Participants included in our analyses were recruited for the prospective ADNI-2, ADNI-go, and ADNI-3 convenience cohorts (National Clinical Trial numbers NCT00106899, NCT01231971, and NCT02854033) between 2008 and 2019 and are as follows: participants aged between 55 and 90 years (inclusive), including cognitively healthy control participants and participants with mild cognitive impairment or AD dementia who underwent serial evaluations of functional, biomedical, neuropsychologic, and clinical status at various intervals. Previous publications referencing the ADNI data set used in this study are listed online (http://adni.loni.usc.edu/news-publications/publications/), as are inclusion and exclusion criteria (https://adni.loni.usc.edu/wp-content/uploads/2008/07/adni2-procedures-manual.pdf), and summarized in Appendix E1 (online). Only participants with available T2*-weighted gradient-echo MRI for MH depiction and flortaucipir (AV-1451) tau PET imaging within 12 months from the MRI assessment were considered for our study (Fig 1). Participants with insufficient imaging quality and incidental findings (eg, macrohemorrhage or infarction) were excluded.
Figure 1:
Flowchart, shows the initial number of participants and those excluded for any reason. A+ = amyloid β positive, A− = amyloid β negative, AD = Alzheimer disease, ADNI = AD Neuroimaging Initiative, AV-1451 = flortaucipir, CSF = cerebrospinal fluid, GRE = gradient echo, MH = microhemorrhage, TN+ = tau/neurodegeneration positive, TN− = tau/neurodegeneration negative.
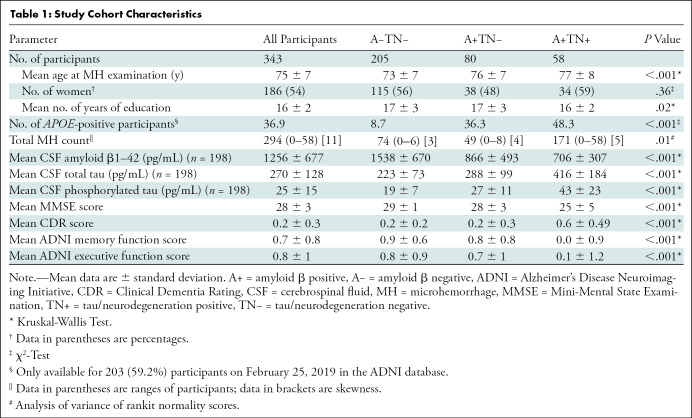
On the basis of the National Institute of Aging–Alzheimer’s Association research framework (22), each participant was assigned to a group defined by their respective PET biomarker profile according to the amyloid β/tau/neurodegeneration, known as ATN, classification system, irrespective of clinical status. Individuals with an A−TN− profile were considered to be healthy, resulting in a final set of 205 control participants (mean age, 73 years ± 7; 115 female participants). To study MH along the AD continuum, the following groups were defined: A+TN− (n = 80; mean age, 76 years ± 7; 38 female participants) and A+TN+ (n = 58; mean age, 77 years ± 8; 34 female participants). Furthermore, individuals suspected of having non-AD pathologic results were defined as A−TN+ (n = 12; mean age, 75 years ± 8; six female participants). Participants suspected of having non-AD pathologic results were excluded from our analysis because of non-AD pathophysiologic structure, resulting in a final cohort of 343 participants (mean age, 75 years ± 7; 186 female participants). This cohort included patients who were given the clinical classifications of AD dementia (n = 29) and mild cognitive impairment (n = 92) and healthy control participants (n = 222) (Fig 1, Table 1).
Table 1:
Study Cohort Characteristics
Study Design
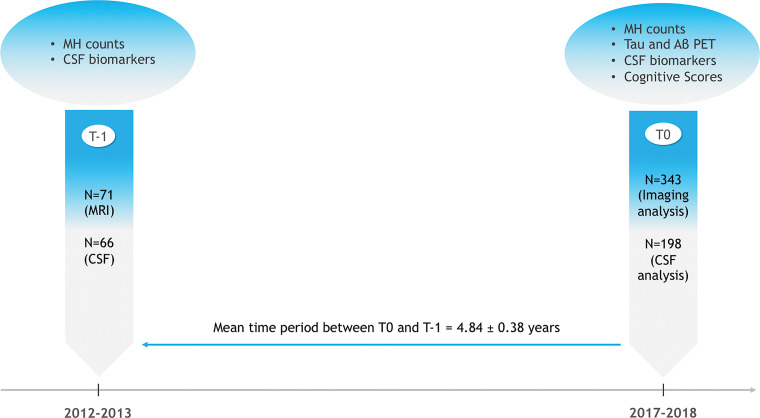
Because tau PET only recently became available, it was included as a neuroimaging measure during ADNI-3. Therefore, for the purposes of the primary analysis we chose a point at which all relevant imaging modalities were available (referred to as T0). In a cross-sectional approach, we analyzed MH count in the different diagnostic groups and the associations between MH, tau and amyloid β PET, and CSF biomarkers and cognitive scores. Additionally, we explored how MH change over time is associated with future tau and amyloid β PET load and CSF biomarkers changes. For this longitudinal approach, we calculated the MH count difference between T0 and an earlier time (referred to as T-1; mean difference, 4.84 years ± 0.38; 71 participants at T-1). This timeline represents the optimal trade-off between maximizing the time range for retrospective longitudinal analysis and the number of participants available at each point (Fig 2).
Figure 2:
Study design. CSF = cerebrospinal fluid, MH = microhemorrhage, T = time.
MRI, PET, and CSF Acquisition and Analysis
A detailed description of the image and CSF analysis protocols is provided in Appendix E1 (online). Briefly, experienced raters counted MH in T2*-weighted native space images. Each MH was spatially assigned to a T1 magnetization-prepared rapid acquisition with gradient-echo image. On the basis of a 35-region atlas, the localization and status of each finding and an estimate of tissue probability (gray matter vs white matter vs CSF) were recorded. Cerebral tau and amyloid β depositions were assessed by using fluorine 18 (18F)-labeled AV-1451 tau and 18F-florbetaben (FBB)/18F florbetapir (AV45) PET, respectively, calculating a standardized uptake value ratio (SUVR) composite score. CSF concentrations of amyloid β-42, phospho-tau 181, and total tau were available at T0 and T-1 for 198 and 66 participants, respectively.
For ATN classification purposes, amyloid β and tau PET results were dichotomized by using established cutoff values (18F-AV45 PET SUVR > 1.11; FBB PET SUVR > 1.20; 18F-AV-1451 PET SUVR > 1.27) (23–25). To obtain comparable quantification of the amyloid β burden across tracers, we used the following centiloid calculation as recommended for the ADNI pipeline: AV45 centiloid = 196.9 × SUVRFBP − 196.03, where SUVRFBP is the SUVR of AV45, and FBB centiloid = 159.08 × SUVRFBB − 151.65, where SUVRFBB is the SUVR of FBB).
Statistical Analysis
Statistical analyses were performed by using statistical software (SPSS Statistics version 20, IBM, Armonk, NY; and R version 3.5.1, the R Foundation for Statistical Computing, Vienna, Austria). For a single test, P values less than .05 were considered to indicate statistical significance. We used Bonferroni correction in all post hoc comparisons throughout the study to control for multiple comparisons and we show the corrected P value except when comparing multiple brain regions, wherein we indicated the resulting new significance level. Group differences in Table 1 were tested by using Kruskal-Wallis test, χ2 test, or analysis of covariance, as appropriate. Shapiro-Wilk test (P < .05) showed deviations from the normality distribution in MH, tau, and amyloid β PET. Nonparametric Spearman correlation adjusted for sex, age, and education was subsequently used. We transformed the imaging variables into normality scores of ranks by using the rankit method (26). To control for confounding variables (cross sectionally and longitudinally) we tested for group differences in an analysis of covariance adjusted for age, sex, and education. For the assessment of associations between MH count with amyloid β and tau PET, and CSF amyloid β1–42, phospho-tau 181, and total tau, a Spearman correlation analysis was used, adjusted for sex, age, and education. To assess retrospective longitudinal changes in MH count, a Wilcoxon signed rank test was performed.
Results
Demographics of the Cohort
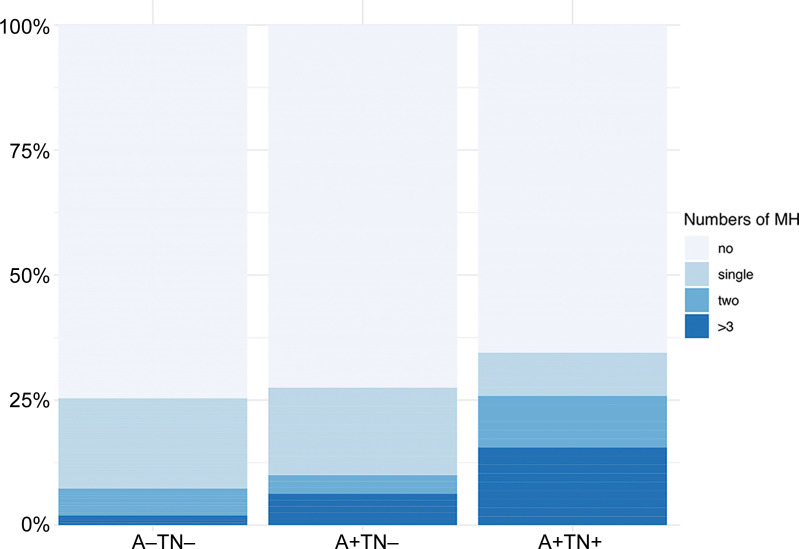
Table 1 shows the demographics of the study population. Of the included 343 participants, 205 fulfilled criteria for A−TN−, 80 participants were A+TN−, and 58 participants were A+TN+. The mean age was 75 years and 54% (186 of 343) were women. MH count differed between groups (P = .01), with a higher total MH count per group in A+TN+ (number of MHs, 171 [range, 0–58 participants; skewness, 5]) compared with A+TN− (number of MHs, 49 [range, 0–8 participants; skewness, 4]), and A−TN− (number of MHs, 74 [range, 0–6 participants; skewness, 3]) (Table 1). Post hoc comparisons showed higher MH counts (P = .01) in participants who were A+TN+ (mean [normal score of rankit formula], 0.31 ± 0.99 [standard deviation]) compared with A−TN− (mean, 0.002 ± 0.63), but not compared with A+TN− (mean, 0.07 ± 0.72; P = .14). Between A+TN− and A−TN−, no difference was found (P = .99).
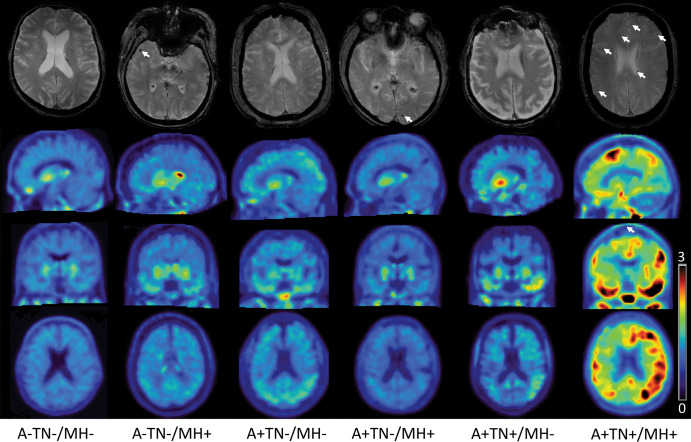
However, after adjusting for age, sex, and education, the group differences were no longer significant (P = .12). The distribution of MH load per diagnostic group is shown in Figure 3. Illustrative examples of T2*-weighted MRI for participants with and without MHs and associated tau PETs are presented for the ATN groups in Figure 4.
Figure 3:
Distribution of microhemorrhage counts by ATN study groups. A+ = amyloid β positive, A− = amyloid β negative, MH = microhemorrhage, TN + = tau/neurodegeneration positive, TN− = tau/neurodegeneration negative.
Figure 4:
Images in representative participants from each amyloid β/tau/neurodegeneration (ATN) group. The upper row shows axial T2* gradient-echo images with (arrows) and without microhemorrhage. The second, third, and fourth row show sagittal, coronal, and axial fluorine 18–labeled flortaucipir tau PET standardized uptake value ratio (SUVR) images, respectively, normalized to cerebellum gray matter in a SUVR range 3–0. A+ = amyloid β positive, A− = amyloid β negative, TN+ = tau/neurodegeneration positive, TN− = tau/neurodegeneration negative, MH− = microhemorrhages absent, MH+ = microhemorrhages present.
Association of MH Count with Tau and Amyloid β
To assess the associations of tau and amyloid β with MH, we compared participants with a single MH with participants with multiple MHs (two or more) and participants without MH. After adjustment for sex, age, and education we observed a significant main effect for the analysis of covariance group differences in both tau SUVR (P = .005) and amyloid β PET centiloid (P = .02).
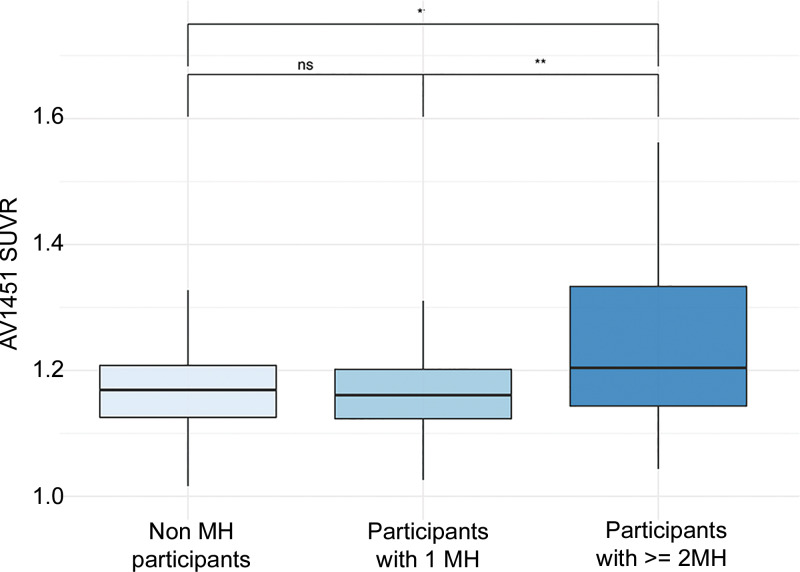
Post hoc analysis of tau group differences showed lower (P = .03) tau composite SUVR in control participants (mean, 1.22 ± 0.24) and lower tau composite SUVR (P = .004) in participants with a single MH (mean, 1.18 ± 0.17) compared with participants with multiple MHs (mean, 1.31 ± 0.27); no difference between participants without MH and participants with a single MH was found (P = .39) (Fig 5).
Figure 5:
Box plots show differences in flortaucipir (AV1451) standardized uptake value ratio (SUVR) load in relation to microhemorrhage (MH) load. * P < .05; ** P < .01. ns = nonsignificant.
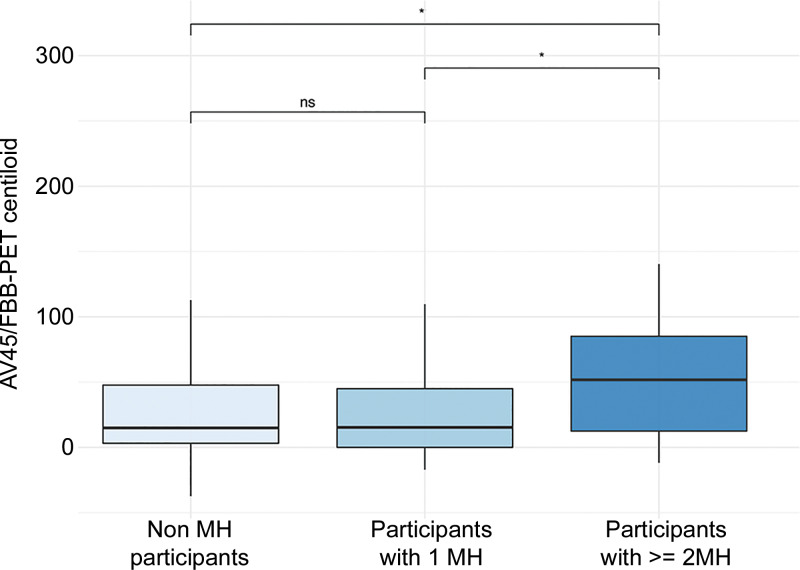
Post hoc analysis of group differences revealed lower (P = .04) amyloid β centiloid load in control participants (mean, 28 ± 37) and lower load (P = .02) in participants with a single MH (mean, 30 ± 48) compared with participants with multiple MHs (mean, 53 ± 49). Again, no difference was found when comparing control participants and participants with a single MH (P = .99) (Fig 6). In a comparison of demographic factors between the single MH and multiple MH groups, age was significantly different between groups (P < .001) but no significant group difference was revealed for education (P = .71) by using the Kruskal-Wallis test. Furthermore, sex showed a significant group difference (P = .03) by using the χ2 test.
Figure 6:
Differences in florbetapir (AV45)/ florbetaben (FBB) standardized uptake value ratio load in relation to microhemorrhage (MH) load. * P < .05. ns = nonsignificant.
An additional correlation analysis by considering the entire study cohort with MH lesions, adjusted for sex, age, and education, showed positive associations between MH and tau PET SUVR (Spearman ρ = 0.31; P = .001) and amyloid β PET centiloid (ρ = 0.27; P = .004). Furthermore, regional correlation analyses, adjusted for sex, age, and education, showed a positive association of MH count with amyloid β PET centiloid in the frontal lobe (ρ = 0.27; P = .005) after Bonferroni correction for six brain regions, resulting in a significance threshold (P < .008). Results of the regional correlation analysis are shown in Table 2.
Table 2:
Microhemorrhage Count and Correlation with Tau PET Standardized Uptake Value Ratio and Amyloid PET Centiloid
Longitudinal MH Change and Its Associations with Tau and Amyloid β
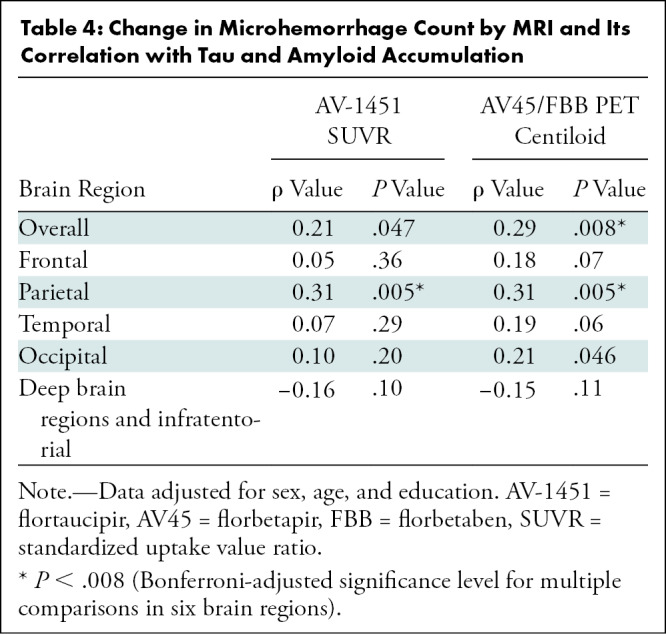
In a longitudinal analysis, an increase of MH count was found between the points T-1 and T0 by considering the entire study cohort and in an ATN-based subgroup analysis. MH counts and results of the statistical analysis are presented in Table 3. In a subsequent analysis, we explored how change in MH count during approximately 5 years from T-1 was associated with tau and amyloid β PET load at T0. We found a positive association of MH change with amyloid β PET composite centiloid on a global level and on a regional level for parietal brain regions in tau PET SUVR and amyloid β PET centiloid, adjusted for sex, age, and education (Table 4).
Table 3:
Change in Microhemorrhage Count at MRI in ATN Diagnostic Groups
Table 4:
Change in Microhemorrhage Count by MRI and Its Correlation with Tau and Amyloid Accumulation
Cross-sectional and Longitudinal Associations of MH with CSF Biomarkers
To support our PET findings, we repeated the group comparison between participants with a single MH with participants with multiple MHs (two or more) and participants with no MH by using the available CSF data. After adjustment for sex, age, and education, analysis of covariance analysis showed a significant main effect for group differences in amyloid β1–42 (P = .049), total tau (P = .02), and phospho-tau 181 (P = .005). Post hoc comparison of amyloid β1–42 group differences showed higher amyloid β1–42 CSF levels in participants without MH (mean, 1250 pg/mL ± 669) and one MH (mean, 1435 pg/mL ± 678) compared with participants with multiple MHs (mean, 924 pg/mL ± 657), but the difference did not reach statistical significance (P = .23 and .06, respectively). Moreover, no significant difference was found between participants without MH and participants with one MH (P = .53).
Post hoc group comparisons for total tau showed lower levels (P = .02 and .04, respectively) in participants without MH (mean, 261 pg/mL ± 114) and participants with one MH (mean, 261 pg/mL ± 97) compared with participants with multiple MHs (mean, 368 pg/mL ± 228). No significant difference was found between participants without MH and participants with one MH (P = .99). Post hoc group comparisons for phospho-tau 181 showed lower levels (P = .005 and .01, respectively) in participants without MH (mean, 24 pg/mL ± 13) and participants with one MH (mean, 24 pg/mL ± 10) compared with participants with multiple MHs (mean, 38 pg/mL ± 28). No statistically significant difference was found between participants without MH and participants with one MH (P = .99). In a subsequent analysis, we assessed the associations of MH counts with CSF biomarkers, in which amyloid β1–42 exhibited a negative correlation with MH (ρ = −0.40; P = .002), phospho-tau 181 showed a positive correlation with MH (ρ = 0.26; P = .04). No correlation was found for total tau (ρ = 0.22; P = .06).
In a longitudinal analysis, change in MH count over time was not associated with amyloid β1–42 (ρ = −0.29; P = .06), total tau (ρ = 0.19; P = .18), or phospho-tau 181 (ρ = 0.21; P = .14) levels at T0. Correlation of longitudinal CSF biomarker change between T-1 and T0 with change in MH revealed no significant correlations for amyloid β1–42 (ρ = −0.06; P = .39), total tau (ρ = 0.09; P = .32), and phospho-tau 181 (ρ = 0.10; P = .30). All correlations were adjusted for sex, age, and education.
Association of MH Count with Cognitive Function
We explored the association between MH count and cognitive performance or Clinical Dementia Rating by using Spearman rank correlations, adjusted for sex, age, and education. Clinical Dementia Rating showed significant positive associations with MH (ρ = 0.24; P = .01). No correlations were found for MH with Mini-Mental State Examination (Spearman ρ = −0.08; P = .22), memory function (ρ = −0.09; P = .19), or executive domain function (ρ = −0.03; P = .40).
MH Load and Subcortical Vascular Cognitive Impairment
To show whether MH count in the study cohort is related to probable subcortical vascular cognitive impairment, we explored the associations of MH with modified Hachinski score and anamnestic reports of arterial hypertension. In a group comparison, 132 participants with hypertension did not show a higher MH count (number of MHs, 100 [range, 0–18 participants; skewness, 5]; mean, 0.03 ± 0.74), compared with 211 participants without a history of hypertension (number of MHs, 194 [range, 0–58 participants; skewness, 10]; mean, 0.10 ± 0.72), adjusted for sex, age, and education (P = .42). Also, no correlation (adjusted for sex, age, and education) of MH count and modified Hachinski score was found (ρ = −0.02; P = .45).
Discussion
Microhemorrhages (MHs) are a common finding in healthy older adults and patients with cognitive decline (27). In our study, we aimed for an improved understanding of the spatial and temporal associations of MH with the two pathologic hallmarks of Alzheimer disease (AD), amyloid β and tau.
The main findings of our study were as follows: (a) MH count was positively associated with global tau PET (ρ = 0.31; P = .001; Bonferroni P < .008) and CSF phospho-tau 181 concentration (ρ = 0.26; P = .04); (b) MH was positively associated with global (ρ = 0.27; P = .004) and frontal amyloid β PET (ρ = 0.27; P = .005; Bonferroni P < .008) and negatively associated with CSF amyloid β1–42 concentration (ρ = −0.40; P = .002); (c) participants with multiple (vs a single) MHs showed increased tau load (P < .03; mean, 1.22 vs 1.31, respectively), amyloid β PET centiloid (P = .04; mean, 28 vs 53, respectively), CSF total tau (mean, 261 vs 368 pg/mL, respectively; P = .02), and phospho-tau 181 concentrations (mean, 24 vs 38 pg/mL, respectively; P = .005) compared with control participants, and MH count increased over approximately 5 years (T-1 vs T0: MH count, 81 [range, 0–6 participants] vs 214 [range, 0–58 participants]; P < .001); and (d) increasing MH load over time was associated with a higher burden of global (ρ = 0.29; P = .008) and parietal amyloid β (ρ = 0.31; P = .005) and parietal tau PET (ρ = 0.31; P = .005; Bonferroni P < .008) load.
Earlier studies showed a strong association between MH count and global amyloid β PET SUVR measured by using different PET tracers (9,28), which we confirmed in a larger cohort. Our study also highlights the brain region–specific association between MH and amyloid β pathologic structure, preferentially in the frontal and parietal lobe but not in infratentorial and deep brain regions (9). We extend the existing evidence by reporting a longitudinal correlation between the accumulation of MH count and global amyloid β load over time. These findings suggest a common pathologic mechanism linking vascular alterations to the toxic effects of amyloid β. By showing that the accumulation of MH load and overall amyloid β burden is concurrent in older individuals, our results also help clarify contradictory reports on the association between late-in-life (vs midlife) (5) risk factors and amyloid β (29,30).
To extend the knowledge about the relationship between vascular lesions and AD pathophysiologic structure, we explored the cross-sectional and longitudinal association between MH and 18F-AV-1451 tau PET SUVR. Tau was associated with MH count both globally and in the parietal lobe; an increased vascular lesion load was linked to increased tau accumulation over approximately 5 years, which is in line with previous studies that reported an association between MH count and CSF tau (16), which we replicate here, and an elevated tau PET load in cognitively normal adults with high amyloid β burden (31).
The mechanisms linking vascular alterations and tau accumulation are so far not well understood, and our observations require confirmation in subsequent studies including correlation with histopathologic findings. Hypointense MH lesions observed on images from T2*-weighted MRI derive from hemosiderin deposits in the perivascular spaces phagocytosed by macrophages; therefore, presumably heme iron plays a major role in the underlying pathophysiologic cascade. A relationship between tau accumulation and free iron was previously suggested, providing a possibly mechanistic link between MH with consecutive blood-brain barrier disruption and tau accumulation. Supporting this assumption, ex vivo studies suggest that iron induces oxidative stress and tau aggregation, and it was shown in a mouse model that overexpression of HMOX1 induces tau phosphorylation (32,33), modulated by iron via the aberrant activation of several tau kinases, including MAPK, CDK5, and GSK3-β (34). This suggests that iron may act as a cofactor for tau aggregation and the phosphorylated state of tau may induce conformational changes of the protein to mediate interactions between tau and iron.
Our study had limitations. The ADNI cohort was mainly white, educated, middle class, and without major comorbidities, and there was no postmortem verification of the clinical diagnoses and MH at MRI; however, the ADNI cohort is enriched intentionally with participants with probable predementia AD. The relatively thick T2*-weighted sections may have occasionally led to a missed MH count at visual readings during image analysis; however, the bias introduced is likely negligible. In certain cases, no differentiation between vascular flow void and MH was possible, and those cases were excluded from all further analysis. We acknowledge that there are important factors other than MH contributing to AD pathogenesis, including different types of brain lesions, environmental influences, and lifestyles, and our study was not designed to explore the added value of MRI MH assessment and tau PET in diagnosing AD. These considerations should be explored in future studies.
In conclusion, our study suggested a spatial correlation between cortical microhemorrhage and tau accumulation. After the failure of clinical trials targeting amyloid β so far, tau is increasingly recognized as a promising target for intervention. Therefore, tau PET will probably become more widely integrated in trials and consideration of vascular lesion load will become increasingly important when assessing tau burden in clinical research. Furthermore, our findings also supported the rationale of dementia prevention approaches that target systemic vascular disease burden to attenuate the progression of amyloid β–related neocortical tau pathologic structure. It was shown that tau PET and structural MRI were associated independently with cognitive decline in Alzheimer disease (35) and whether microhemorrhage assessment adds independent information relevant to the Alzheimer disease diagnostic workup should be explored.
APPENDIX
Disclosures of Conflicts of Interest: B.S.R. disclosed no relevant relationships. F.G. disclosed no relevant relationships. S.M. disclosed no relevant relationships. R.P. disclosed no relevant relationships.
Study supported as follows: Data collection and sharing for this project was funded by the Alzheimer’s Disease Neuroimaging Initiative (ADNI) (National Institutes of Health grant U01 AG024904) and DOD ADNI (W81XWH-12-2-0012). ADNI is funded by the National Institute on Aging, the National Institute of Biomedical Imaging and Bioengineering, and through contributions from the following: AbbVie, Alzheimer’s Association, Alzheimer’s Drug Discovery Foundation, Araclon Biotech, BioClinica, Biogen, Bristol-Myers Squibb, CereSpir, Cogstate, Eisai, Elan Pharmaceuticals, Eli Lilly and Company, EuroImmun, F. Hoffmann-La Roche and Genentech, Fujirebio, GE Healthcare, IXICO, Janssen Alzheimer Immunotherapy Research & Development, Johnson and Johnson Pharmaceutical Research and Development, Lumosity, Lundbeck, Merck, Meso Scale Diagnostics, NeuroRx Research, Neurotrack Technologies, Novartis Pharmaceuticals, Pfizer, Piramal Imaging, Servier, Takeda Pharmaceutical, and Transition Therapeutics. The Canadian Institutes of Health Research is providing funds to support ADNI clinical sites in Canada. Private sector contributions are facilitated by the Foundation for the National Institutes of Health (www.fnih.org). The grantee organization is the Northern California Institute for Research and Education, and the study is coordinated by the Alzheimer’s Therapeutic Research Institute at the University of Southern California. ADNI data are disseminated by the Laboratory for Neuro Imaging at the University of Southern California. The sponsors did not have any role in the design and conduct of the study; collection, management, analysis, and interpretation of the data; and preparation, review, or approval of the manuscript. Data used in preparation of this article were obtained from the Alzheimer’s Disease Neuroimaging Initiative (ADNI) database (adni.loni.usc.edu). As such, the investigators within the ADNI contributed to the design and implementation of ADNI and/or provided data but did not participate in analysis or writing of this report. A complete listing of ADNI investigators can be found at http://adni.loni.usc.edu/wp-content/uploads/how_to_apply/ADNI_Acknowledgement_List.pdf.
Abbreviations:
- AD
- Alzheimer disease
- ADNI
- AD Neuroimaging Initiative
- AV45
- florbetapir
- AV-1451
- flortaucipir
- CSF
- cerebrospinal fluid
- FBB
- florbetaben
- MH
- microhemorrhage
- SUVR
- standardized uptake value ratio
References
- 1.Arvanitakis Z, Capuano AW, Leurgans SE, Bennett DA, Schneider JA. Relation of cerebral vessel disease to Alzheimer’s disease dementia and cognitive function in elderly people: a cross-sectional study. Lancet Neurol 2016;15(9):934–943. [DOI] [PMC free article] [PubMed] [Google Scholar]
- 2.Montagne A, Barnes SR, Sweeney MD, et al. Blood-brain barrier breakdown in the aging human hippocampus. Neuron 2015;85(2):296–302. [DOI] [PMC free article] [PubMed] [Google Scholar]
- 3.Iturria-Medina Y, Sotero RC, Toussaint PJ, Mateos-Pérez JM, Evans AC; Alzheimer’s Disease Neuroimaging Initiative . Early role of vascular dysregulation on late-onset Alzheimer’s disease based on multifactorial data-driven analysis. Nat Commun 2016;7(1):11934. [DOI] [PMC free article] [PubMed] [Google Scholar]
- 4.Perneczky R, Tene O, Attems J, et al. Is the time ripe for new diagnostic criteria of cognitive impairment due to cerebrovascular disease? Consensus report of the International Congress on Vascular Dementia working group. BMC Med 2016;14(1):162. [DOI] [PMC free article] [PubMed] [Google Scholar]
- 5.Gottesman RF, Schneider AL, Zhou Y, et al. Association Between Midlife Vascular Risk Factors and Estimated Brain Amyloid Deposition. JAMA 2017;317(14):1443–1450. [DOI] [PMC free article] [PubMed] [Google Scholar]
- 6.Cifuentes D, Poittevin M, Dere E, et al. Hypertension accelerates the progression of Alzheimer-like pathology in a mouse model of the disease. Hypertension 2015;65(1):218–224. [DOI] [PubMed] [Google Scholar]
- 7.Chiang GC, Cruz Hernandez JC, Kantarci K, Jack CR, Jr, Weiner MW; Alzheimer’s Disease Neuroimaging Initiative . Cerebral Microbleeds, CSF p-Tau, and Cognitive Decline: Significance of Anatomic Distribution. AJNR Am J Neuroradiol 2015;36(9):1635–1641. [DOI] [PMC free article] [PubMed] [Google Scholar]
- 8.Pettersen JA, Sathiyamoorthy G, Gao FQ, et al. Microbleed topography, leukoaraiosis, and cognition in probable Alzheimer disease from the Sunnybrook dementia study. Arch Neurol 2008;65(6):790–795. [DOI] [PubMed] [Google Scholar]
- 9.Kantarci K, Gunter JL, Tosakulwong N, et al. Focal hemosiderin deposits and β-amyloid load in the ADNI cohort. Alzheimers Dement 2013;9(5 Suppl):S116–S123. [DOI] [PMC free article] [PubMed] [Google Scholar]
- 10.Shams S, Martola J, Granberg T, et al. Cerebral microbleeds: different prevalence, topography, and risk factors depending on dementia diagnosis—the Karolinska Imaging Dementia Study. AJNR Am J Neuroradiol 2015;36(4):661–666. [DOI] [PMC free article] [PubMed] [Google Scholar]
- 11.Greenberg SM, Vernooij MW, Cordonnier C, et al. Cerebral microbleeds: a guide to detection and interpretation. Lancet Neurol 2009;8(2):165–174. [DOI] [PMC free article] [PubMed] [Google Scholar]
- 12.Bennett RE, Robbins AB, Hu M, et al. Tau induces blood vessel abnormalities and angiogenesis-related gene expression in P301L transgenic mice and human Alzheimer’s disease. Proc Natl Acad Sci U S A 2018;115(6):E1289–E1298. [DOI] [PMC free article] [PubMed] [Google Scholar]
- 13.Nation DA, Sweeney MD, Montagne A, et al. Blood-brain barrier breakdown is an early biomarker of human cognitive dysfunction. Nat Med 2019;25(2):270–276. [DOI] [PMC free article] [PubMed] [Google Scholar]
- 14.Uetani H, Hirai T, Hashimoto M, et al. Prevalence and topography of small hypointense foci suggesting microbleeds on 3T susceptibility-weighted imaging in various types of dementia. AJNR Am J Neuroradiol 2013;34(5):984–989. [DOI] [PMC free article] [PubMed] [Google Scholar]
- 15.Yates PA, Desmond PM, Phal PM, et al. Incidence of cerebral microbleeds in preclinical Alzheimer disease. Neurology 2014;82(14):1266–1273. [DOI] [PMC free article] [PubMed] [Google Scholar]
- 16.Kester MI, Goos JD, Teunissen CE, et al. Associations between cerebral small-vessel disease and Alzheimer disease pathology as measured by cerebrospinal fluid biomarkers. JAMA Neurol 2014;71(7):855–862. [DOI] [PubMed] [Google Scholar]
- 17.Noguchi-Shinohara M, Komatsu J, Samuraki M, et al. Cerebral Amyloid Angiopathy-Related Microbleeds and Cerebrospinal Fluid Biomarkers in Alzheimer’s Disease. J Alzheimers Dis 2017;55(3):905–913. [DOI] [PubMed] [Google Scholar]
- 18.Dierksen GA, Skehan ME, Khan MA, et al. Spatial relation between microbleeds and amyloid deposits in amyloid angiopathy. Ann Neurol 2010;68(4):545–548. [DOI] [PMC free article] [PubMed] [Google Scholar]
- 19.Kim HJ, Cho H, Werring DJ, et al. 18F-AV-1451 PET Imaging in Three Patients with Probable Cerebral Amyloid Angiopathy. J Alzheimers Dis 2017;57(3):711–716. [DOI] [PubMed] [Google Scholar]
- 20.Renard D, Collombier L, Demattei C, et al. Cerebrospinal Fluid, MRI, and Florbetaben-PET in Cerebral Amyloid Angiopathy-Related Inflammation. J Alzheimers Dis 2018;61(3):1107–1117. [DOI] [PubMed] [Google Scholar]
- 21.Sperling R, Salloway S, Brooks DJ, et al. Amyloid-related imaging abnormalities in patients with Alzheimer’s disease treated with bapineuzumab: a retrospective analysis. Lancet Neurol 2012;11(3):241–249. [DOI] [PMC free article] [PubMed] [Google Scholar]
- 22.Jack CR, Jr, Bennett DA, Blennow K, et al. NIA-AA Research Framework: Toward a biological definition of Alzheimer’s disease. Alzheimers Dement 2018;14(4):535–562. [DOI] [PMC free article] [PubMed] [Google Scholar]
- 23.Landau SM, Thomas BA, Thurfjell L, et al. Amyloid PET imaging in Alzheimer’s disease: a comparison of three radiotracers. Eur J Nucl Med Mol Imaging 2014;41(7):1398–1407. [DOI] [PMC free article] [PubMed] [Google Scholar]
- 24.Maass A, Landau S, Baker SL, et al. Comparison of multiple tau-PET measures as biomarkers in aging and Alzheimer’s disease. Neuroimage 2017;157:448–463. [DOI] [PMC free article] [PubMed] [Google Scholar]
- 25.Jack CR, Jr, Wiste HJ, Weigand SD, et al. Defining imaging biomarker cut points for brain aging and Alzheimer’s disease. Alzheimers Dement 2017;13(3):205–216. [DOI] [PMC free article] [PubMed] [Google Scholar]
- 26.Reißig G. Bliss C.I.: Statistics in Biology . Statistical Methods for Research in the Natural Sciences. Vol 1. McGraw-Hill Book Company, New York: 1967. XIV + 558 S., 55 Abb., 192 Tab., Preis s 124. Biom Z 1969;11(3):215. [Google Scholar]
- 27.Akoudad S, Wolters FJ, Viswanathan A, et al. Association of Cerebral Microbleeds With Cognitive Decline and Dementia. JAMA Neurol 2016;73(8):934–943. [DOI] [PMC free article] [PubMed] [Google Scholar]
- 28.Yates PA, Sirisriro R, Villemagne VL, et al. Cerebral microhemorrhage and brain β-amyloid in aging and Alzheimer disease. Neurology 2011;77(1):48–54. [DOI] [PubMed] [Google Scholar]
- 29.Rodrigue KM, Rieck JR, Kennedy KM, Devous MD, Sr, Diaz-Arrastia R, Park DC. Risk factors for β-amyloid deposition in healthy aging: vascular and genetic effects. JAMA Neurol 2013;70(5):600–606. [DOI] [PMC free article] [PubMed] [Google Scholar]
- 30.Rabin JS, Schultz AP, Hedden T, et al. Interactive Associations of Vascular Risk and β-Amyloid Burden With Cognitive Decline in Clinically Normal Elderly Individuals: Findings From the Harvard Aging Brain Study. JAMA Neurol 2018;75(9):1124–1131. [DOI] [PMC free article] [PubMed] [Google Scholar]
- 31.Rabin JS, Yang HS, Schultz AP, et al. Vascular Risk and β-Amyloid Are Synergistically Associated with Cortical Tau. Ann Neurol 2019;85(2):272–279. [DOI] [PMC free article] [PubMed] [Google Scholar]
- 32.Hui Y, Wang D, Li W, et al. Long-term overexpression of heme oxygenase 1 promotes tau aggregation in mouse brain by inducing tau phosphorylation. J Alzheimers Dis 2011;26(2):299–313. [DOI] [PubMed] [Google Scholar]
- 33.Rao SS, Adlard PA. Untangling Tau and Iron: Exploring the Interaction Between Iron and Tau in Neurodegeneration. Front Mol Neurosci 2018;11:276. [DOI] [PMC free article] [PubMed] [Google Scholar]
- 34.Lovell MA, Xiong S, Xie C, Davies P, Markesbery WR. Induction of hyperphosphorylated tau in primary rat cortical neuron cultures mediated by oxidative stress and glycogen synthase kinase-3. J Alzheimers Dis 2004;6(6):659–671; discussion 673–681. [DOI] [PubMed] [Google Scholar]
- 35.Mattsson N, Insel PS, Donohue M, et al. Predicting diagnosis and cognition with 18F-AV-1451 tau PET and structural MRI in Alzheimer’s disease. Alzheimers Dement 2019;15(4):570–580. [DOI] [PubMed] [Google Scholar]
Associated Data
This section collects any data citations, data availability statements, or supplementary materials included in this article.


