

Abstract
The accumulation and prion‐like propagation of α‐synuclein and other amyloidogenic proteins are associated with devastating neurodegenerative diseases. Metazoan heat shock protein HSP70 and its co‐chaperones DNAJB1 and HSP110 constitute a disaggregation machinery that is able to disassemble α‐synuclein fibrils in vitro, but its physiological effects on α‐synuclein toxicity are unknown. Here, we depleted Caenorhabditis elegans HSP‐110 and monitored the consequences on α‐synuclein‐related pathological phenotypes such as misfolding, intercellular spreading, and toxicity in C. elegans in vivo models. Depletion of HSP‐110 impaired HSP70 disaggregation activity, prevented resolubilization of amorphous aggregates, and compromised the overall cellular folding capacity. At the same time, HSP‐110 depletion reduced α‐synuclein foci formation, cell‐to‐cell transmission, and toxicity. These data demonstrate that the HSP70 disaggregation activity constitutes a double‐edged sword, as it is essential for maintaining cellular proteostasis but also involved in the generation of toxic amyloid‐type protein species.
Keywords: chaperones, neurodegenerative diseases, prion‐like propagation, protein disaggregation, proteostasis
Subject Categories: Neuroscience, Protein Biosynthesis & Quality Control
Depletion of the HSP70 disaggregase cochaperone HSP110 impairs general cellular protein folding capacity, but at the same time reduces foci formation, cell‐to‐cell transmission, and toxicity of α‐synuclein in a Caenorhabditis elegans model.
Introduction
Prion proteins can adopt alternative conformations with the ability to self‐propagate. This concept of self‐templated replication of misfolded protein species was first described for pathogenic protein aggregates in mammalian prion diseases and revolutionized our understanding of infectious agents (Griffith, 1967; Prusiner, 1982). Since their discovery in humans and animals, prions have been found in diverse other organisms, including yeast and bacteria (Wickner, 1994; Yuan & Hochschild, 2017). Work on yeast prions has been instrumental to elucidate basic mechanisms underlying protein‐based inheritance (Serio et al, 2000; Sparrer et al, 2000; Wickner et al, 2013).
The prion state replicates via a mechanism described as nucleation‐dependent polymerization (Jarrett & Lansbury, 1993; Serio et al, 2000; Sparrer et al, 2000), where the rate‐limiting step is the initial formation of a seeding‐competent oligomeric nucleus consisting of misfolded conformers. This seed then templates the conversion and catalyzes the incorporation of soluble monomers, leading to growth of oligomers into larger highly ordered beta‐sheet‐rich fibrillar assemblies termed amyloids. The typical architecture of amyloids where the β‐strands of individual molecules stack on top of each other is central for their self‐templated growth. This structure allows the addition of monomers at the ends of the fibrils. Since this is an intrinsic property of any amyloid‐type aggregate, the prion concept is expandable to other amyloid forming proteins. Accordingly, also amyloidogenic proteins associated with neurodegenerative diseases are propagating like prions, including Aβ and tau in Alzheimer disease (AD), α‐synuclein (α‐Syn) in Parkinson disease (PD), or proteins containing expanded polyglutamine stretches (polyQ) in Huntington's disease (HD) and other polyglutamine diseases (Aguzzi & Rajendran, 2009; Cushman et al, 2010; Prusiner, 2012).
In addition to seeded polymerization, there is increasing evidence that fragmentation is essential for efficient prion amplification (Pezza & Serio, 2007), because it exposes more fibril ends at which new monomers are added (Jarrett & Lansbury, 1993; Collins et al, 2004). The importance of fragmentation is exemplified by in vitro techniques of prion amplification, such as real‐time quaking induced conversion (RT‐QuIC) (Atarashi et al, 2008) and protein misfolding cyclic amplification (PMCA) (Saborio et al, 2001), where fragmentation is achieved mechanically by rigorous shaking or sonication, respectively. Moreover, only mathematical models that take fibril breakage into account are able to accurately predict amyloid growth kinetics observed in vitro and in vivo (Masel et al, 1999; Knowles et al, 2009).
Evidence for an essential role of fragmentation in prion propagation in vivo comes from studies in yeast, where faithful propagation of the prion state is dependent on the activity of molecular chaperones, in particular the AAA+ disaggregase HSP104 (Chernoff et al, 1995; Tuite & Lindquist, 1996). Inactivation of HSP104 by guanidine hydrochloride (GdnHCl) or deletion of the HSP104 gene results in prion loss (Chernoff et al, 1995; Tuite & Lindquist, 1996; Grimminger et al, 2004). Importantly, HSP104 does not function in isolation, but cooperates with the HSP70 system to dissolve protein aggregates (Glover & Lindquist, 1998; Masison & Reidy, 2015; Mogk et al, 2018). Mechanistically, substrates are recognized by the HSP70‐DNAJ (HSP40) chaperone pair and then handed over to HSP104, which extrudes single polypeptides from the aggregate by threading them through the central pore of the HSP104 hexamer (Lum et al, 2004). This ATP‐dependent disaggregation activity leads to the formation of smaller prion fragments, so‐called propagons, which have an increased replication capacity and are also more efficiently transferred to daughter cells (Chernoff et al, 1995; Tuite & Lindquist, 1996; Satpute‐Krishnan et al, 2007; Tessarz et al, 2008; Winkler et al, 2012; Mogk et al, 2018). Fragmentation is therefore crucial not only for the amplification of prion conformers at the molecular level, but also at the cellular level. The life cycle of amyloid‐based prions seems to involve continuous cycles of seeded assembly and fragmentation and only a particular equilibrium of association and dissociation kinetics allow propagation of the aggregated form.
While previous work revealed that metazoan cells exhibit disaggregation activity and also contain all co‐factors required for cytosolic propagation and dissemination of an ectopically expressed amyloid‐like yeast prion (Cohen et al, 2006; Krammer et al, 2009a,b; Hofmann & Vorberg, 2013; Hofmann et al, 2013), the nature of these co‐factor(s) was still unclear, since direct homologs of HSP104 are absent from the metazoan cytosol. The recent discovery of a metazoan disaggregation machinery in which a particular HSP110‐type nucleotide exchange factor (NEF) cooperates with the human HSP70‐DNAJ system to fragment and depolymerize amyloid aggregates (Gao et al, 2015; Scior et al, 2018) has raised the question of whether this activity could prevent or promote the prion‐like propagation of amyloid‐type aggregates in metazoans and what physiological implications this would have. Although the HSP70 disaggregation machinery is mechanistically different from HSP104/HSP70‐mediated disaggregation, the resulting phenotype could still be similar. Since prion‐like amplification and intercellular spreading of disease‐linked proteins are implicated in the propagation of the pathology in neurodegenerative diseases such as AD and PD, co‐factors involved in this process might be potential therapeutic targets.
In this study, we have investigated the role of the HSP70 metazoan disaggregation machinery in aggregation and toxicity of amyloid‐type aggregates in Caenorhabditis elegans. Diminishing its activity by tissue‐specific knockdown (KD) of HSP‐110 impaired the resolubilization of amorphous aggregates such as heat shock (HS)‐induced firefly luciferase aggregates on the one hand, while mitigating the formation of toxic spreading‐competent α‐Syn species on the other hand. These results imply that the toxicity associated with amyloids may result not only from aggregate formation but also from aggregate fragmentation. Moreover, a selective impairment of chaperone‐mediated remodeling of amyloid‐type substrates might be beneficial as it interrupts the vicious circle of fragmentation and seeded polymerization.
Results
Tissue‐specific KD of HSP‐110 prevents disassembly of HS‐induced firefly luciferase aggregates
Our previous work revealed that a specific human HSP70‐DNAJ‐HSP110 network exhibits in vitro disaggregation activity toward amyloid α‐Syn fibrils and detergent insoluble α‐Syn extracted from C. elegans (Gao et al, 2015). However, its effect on aggregation and toxicity of α‐Syn in vivo has yet to be addressed. Two scenarios are conceivable. The disaggregation activity could either lead to a resolubilization and refolding of aggregated α‐Syn, which would result in reduced toxicity. Alternatively, it could contribute to the multiplication of α‐Syn aggregates by continuously generating new seeds by fragmentation, analogous to the function of HSP104 and the HSP70‐DNAJ system in yeast prion propagation, which would likely increase toxicity.
In an effort to assess the role of the metazoan disaggregation machinery in amyloid aggregate propagation in vivo, we employed C. elegans as model organism. Members of the nematode disaggregation system are highly conserved, but less redundant than in the human system (Kirstein et al, 2017). Yet, the cognate HSP70 of the cytosol and nucleus (HSP‐1) is involved in a variety of different essential processes in addition to disaggregation, including protein synthesis, clathrin‐mediated endocytosis, or chaperone‐mediated autophagy (Stricher et al, 2013). The manipulation of this core component of the HSP70 network would lead to a plethora of side effects. Importantly, cooperation of the HSP70 with particular co‐chaperones of the DNAJ‐protein family (class B‐type) and the HSP110‐type family of NEFs determines functional specificity with respect to disaggregation (Gao et al, 2015; Mogk et al, 2018). While there are several DNAJ co‐chaperones that are functionally redundant, C. elegans has only one cytosolic HSP110‐type NEF (HSP‐110), which is a key component of the HSP70 disaggregation machinery (Rampelt et al, 2012; Gao et al, 2015; Kirstein et al, 2017; Mogk et al, 2018). By manipulating HSP‐110 levels, the disaggregation activity of the HSP70 chaperone network can be specifically modulated. However, since an hsp‐110 knockout is lethal and a systemic knockdown (KD) by RNA interference (RNAi) affects growth, development, and fertility (Kamath et al, 2003), we decided to restrict the KD of HSP‐110 to the same tissue that expresses the selected substrate protein (e.g., α‐Syn). This allows us both to focus on the specific effect on the co‐expressed protein of interest and to reduce unwanted side effects in other tissues. To this end, we generated C. elegans strains expressing an RNAi hairpin (HP) construct targeting the hsp‐110 mRNA specifically in muscle cells (HPI and HPII) (Winston et al, 2002). To ensure tissue‐specific KD of hsp‐110 and to prevent systemic RNAi, all strains harbor a loss‐of‐function mutation in sid‐1, a gene coding for a double‐stranded RNA transporter, which is essential for inter‐tissue transport of dsRNA and systemic RNAi (Winston et al, 2002). To verify a tissue‐specific KD of hsp‐110, we introduced both hsp‐110 hairpin constructs into a strain with endogenously GFP‐tagged HSP‐110 (HSP‐110::GFP). Expression of both hsp‐110 hairpin constructs resulted in the loss of GFP fluorescence exclusively in muscle cells, confirming a tissue‐specific KD (Fig 1A).
Figure 1. Tissue‐specific KD of HSP‐110 prevents resolubilization of HS‐induced firefly luciferase aggregates.
-
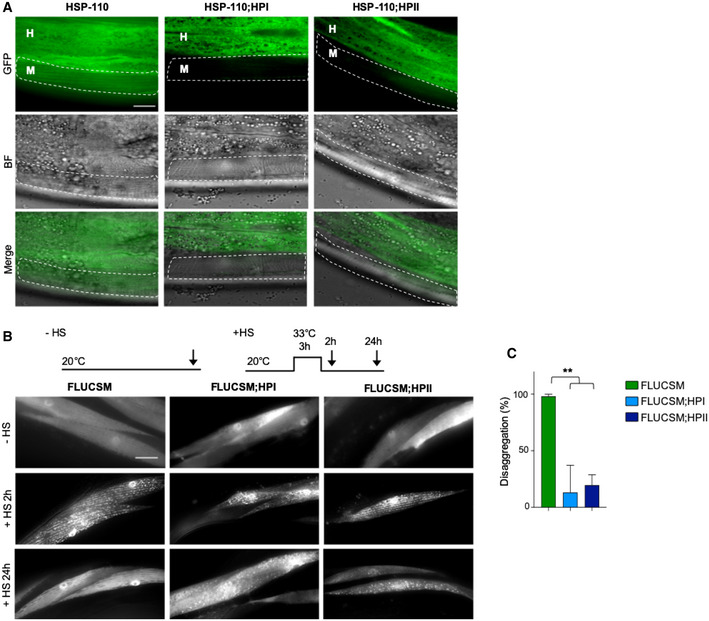
ASingle plane confocal fluorescent microscopy images of 5‐day‐old animals harboring GFP‐tagged endogenous HSP‐110 (HSP‐110::GFP). Muscle cells are outlined. M: muscle, H: hypodermis. In animals that co‐express hairpin constructs targeting hsp‐110 in muscle cells (HSP‐110;HPI and HSP‐110;HPII), GFP fluorescence is strongly reduced in muscle cells in comparison with control animals, indicating HSP‐110::GFP depletion specifically in muscle cells. Scale bar: 10 μm.
-
BExperimental set‐up: Age‐synchronized 4‐day‐old animals were subjected to heat stress for 3 h at 33°C (+HS) and then returned to 20°C or left at 20°C (−HS), respectively. Arrows indicate imaging time points. The −HS controls were imaged at the same time point as the +HS animals after 24 h at 20°C. Maximum intensity projections of fluorescent microscopy z‐stacks of animals expressing the indicated transgenes. HS‐induced FLUCSM::GFP foci are cleared after a recovery for 24 h at 20°C in the WT background, but persist in the presence of the hsp‐110 hairpin construct. Scale bar: 20 μm.
-
CQuantification of FLUCSM::GFP foci disaggregation. % disaggregation is calculated as 100—ratio of FLUCSM::GFP foci area relative to total muscle area at the +HS 24 h time point to the +HS 2 h time point. Data are displayed as mean ± SEM (in %) (N = 3). Statistical analysis was done using one‐way ANOVA with Dunnett's adjustment for multiple comparisons. **P ≤ 0.01.
We then examined whether HSP‐110 KD impairs the cellular disaggregation activity by using a well‐characterized firefly luciferase reporter (FLUCSM::EGFP) expressed in muscle cells as a model substrate (Gupta et al, 2011). FLUCSM::EGFP remained soluble under ambient growth conditions, but formed numerous aggregates upon acute heat shock (3 h 33°C) in both wild‐type (WT) and hsp‐110 hairpin expressing animals (Fig 1B). After a 24‐h recovery period, FLUCSM::EGFP foci were almost completely dissolved in the WT background, whereas a large fraction of muscle cells still harbored multiple FLUCSM::EGFP foci upon expression of hsp‐110 hairpins (Fig 1B and C). Thus, the HSP‐110 KD led to persistence of heat‐induced amorphous FLUCSM foci, suggesting that disaggregation activity is impaired (Rampelt et al, 2012).
KD of HSP‐110 reduces cytosolic α‐Syn and Q35 foci formation and toxicity
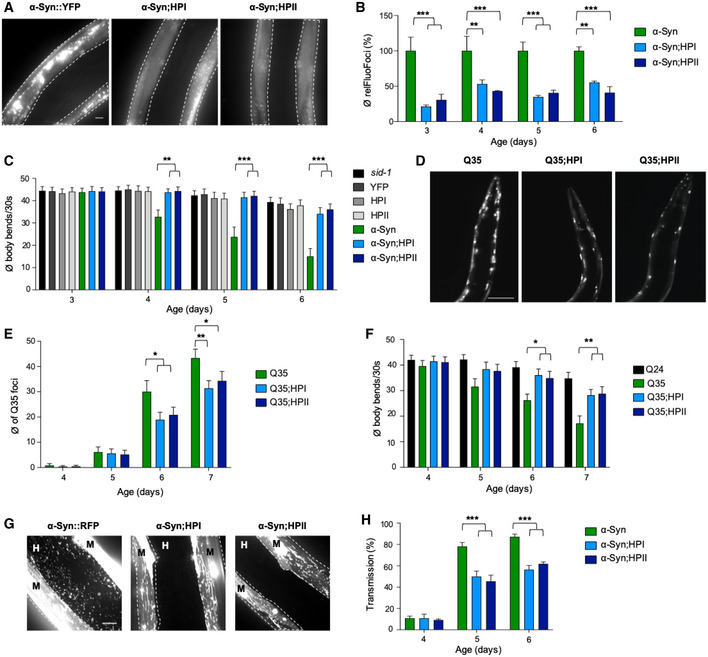
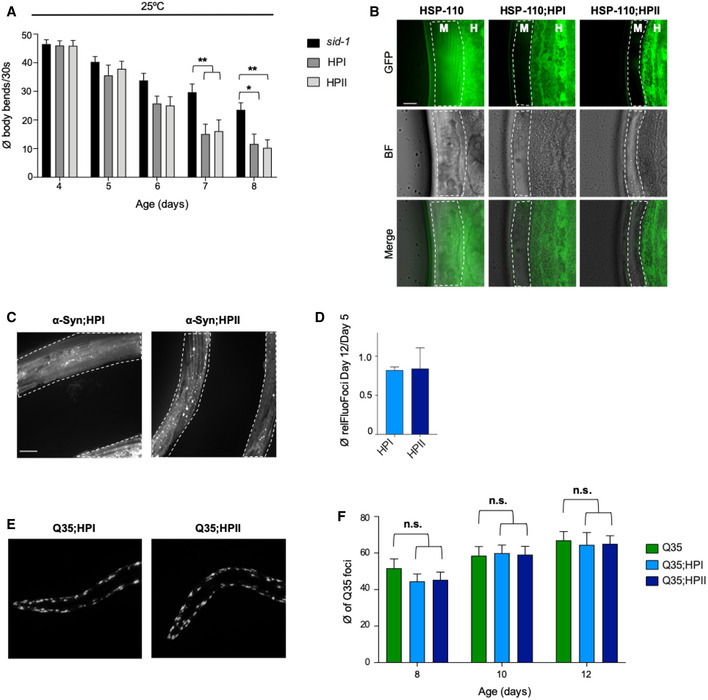
We next tested the effect of impaired disaggregation activity on an amyloidogenic substrate. After introducing the hsp‐110 hairpin constructs into animals expressing yellow fluorescent protein (YFP)‐tagged α‐Syn (α‐Syn::YFP) in muscle cells (van Ham et al, 2008), we analyzed α‐Syn::YFP aggregation and toxicity at days 3, 4, 5, and 6 of life (corresponding to the fourth larval stage, and days 1, 2, and 3 of adulthood). In line with previous reports (van Ham et al, 2008), α‐Syn::YFP accumulated into large distinct foci (Fig 2A and B, Appendix Fig S1A and B), which was associated with a progressive decline of muscle function as assessed by a motility assay (Fig 2C and Appendix Fig S1C). Remarkably, the co‐expression of hsp‐110 hairpins significantly reduced the number of foci and rescued the toxicity of α‐Syn::YFP (Fig 2A–C). This suggests that HSP‐110‐dependent disaggregation activity is required for α‐Syn::YFP foci formation and toxicity.
Figure 2. KD of HSP‐110 reduces cytosolic α‐Syn and Q35 foci formation and toxicity.
-
AMaximum intensity projections of fluorescent microscopy z‐stacks of 5‐day‐old nematodes expressing the indicated transgenes are shown. White dashed lines outline the borders of muscle cells. Scale bar: 10 μm. The co‐expression of HPI and HPII reduces the amount of α‐Syn::YFP inclusions.
-
BQuantification of α‐Syn::YFP foci in 3‐ to 6‐day‐old animals. Product of mean foci fluorescence and foci area relative to muscle area is displayed (relFluoFoci). Data are shown as mean ± SEM (in %) (N = 3). Statistical analysis was done using two‐way ANOVA with Dunnett's multiple comparison test. **P ≤ 0.01, ***P ≤ 0.001.
-
CMotility assay as a measure for transgene toxicity. Displayed is the mean number of body bends per 30 s ± SEM (N = 3). Statistical analysis was done using two‐way ANOVA with Dunnett's multiple comparison test. **P ≤ 0.01, ***P ≤ 0.001.
-
DMaximum intensity projections of fluorescent microscopy z‐stacks of 6‐day‐old animals expressing the indicated transgenes. Scale bar: 100 μm. The co‐expression of HPI and HPII reduces the amount of Q35::YFP inclusions.
-
EQuantification of Q35::YFP foci in WT and hsp‐110 hairpin background. Shown is the mean ± SEM (N = 3). Statistical analysis was done using two‐way ANOVA with Dunnett's multiple comparison test. *P ≤ 0.05, **P ≤ 0.01.
-
FMotility assay as a measure for transgene toxicity. Displayed is the mean number of body bends per 30 s ± SEM (N = 3). Statistical analysis was done using one‐way ANOVA with Dunnett's multiple comparisons test. *P ≤ 0.05, **P ≤ 0.01.
-
GMaximum intensity projections of fluorescent microscopy z‐stacks of 5‐day‐old nematodes expressing the indicated transgenes. White dashed lines outline the borders of muscle cells. Scale bar: 10 μm. M: muscle, H: hypodermis. Signal outside of muscle cells reveals spreading of α‐Syn.
-
HQuantification of animals showing α‐Syn transmission at indicated ages. Displayed is the mean ± SEM (in %) (N = 4). Statistical analysis was done using two‐way ANOVA with Dunnett's multiple comparison test. ***P ≤ 0.001.
We next asked whether this effect was specific to α‐Syn or whether the same could be observed with another amyloidogenic protein. To test this, we introduced the hsp‐110 hairpins into animals expressing 35 polyglutamine (polyQ) residues fused to YFP (Q35::YFP), another substrate that forms fibrillar aggregates in an age‐dependent manner (Morley et al, 2002). KD of HSP‐110 also reduced the number of foci and toxicity of Q35 (Fig 2D–F, Appendix Fig S1D–F). In sum, HSP‐110 activity appears to enhance α‐Syn and Q35 foci formation and toxicity.
Protein quality control pathways are typically intertwined and inhibiting one pathway sometimes results in upregulation of other components, which could indirectly prevent α‐Syn and Q35 misfolding and toxicity in the hsp‐110 KD strains. However, comparable expression levels of typical stress‐inducible chaperone genes verified that the KD of HSP‐110 did not activate the stress transcription factors HSF‐1/HSF1 or DAF‐16/FOXO (Fig EV1). Since total protein levels of α‐Syn::YFP and Q35::YFP remained largely unchanged (Appendix Fig S2), it could also be ruled out that an enhanced degradation was responsible for the observed reduction of foci formation and toxicity. Together with the observations on luciferase reactivation, these data indicate that the effect of HSP‐110 KD was specific to its role in substrate disaggregation and was not mediated by indirect compensatory mechanisms.
Figure EV1. KD of HSP‐110 does not result in a compensatory activation of the heat shock response.
-
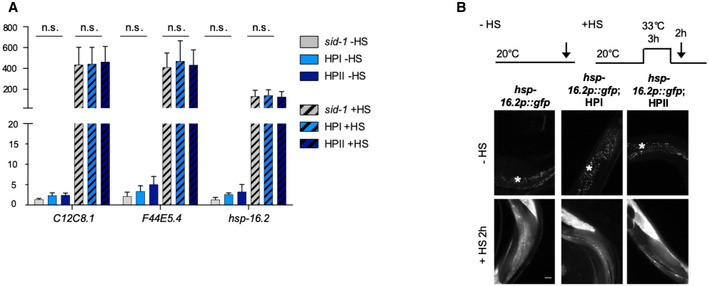
AQuantification of mRNA levels in 4‐day‐old animals expressing the indicated transgenes or harboring the indicated mutation relative to the −HS control of major HS‐inducible genes (2 HSP70s, C12C8.1 and F44E5.4, and the small HSP hsp‐16.2) by real‐time (RT)–PCR (mean ± SEM, N = 4). Statistical analysis was done using two‐way ANOVA with Bonferroni's multiple comparison test. n.s. = not significant.
-
BExperimental set‐up: Age‐synchronized 4‐day‐old animals were subjected to heat stress for 3 h at 33°C (+HS) and then returned to 20°C or left at 20°C (−HS), respectively. Arrows indicate imaging time points. The −HS controls were imaged at the same time point as the +HS animals after 2 h at 20°C. Fluorescent microscopy images of animals expressing GFP under the HS‐inducible hsp‐16.2 promoter in the control and HSP‐110 KD background. Scale bars: 25 μm. The KD of HSP‐110 did not evoke an heat shock response under ambient growth conditions (only autofluorescence of the gut granules (*) is visible in −HS strains), but animals were still able to mount an HSR under acute heat stress (+HS). All strains harbor the sid‐1(pk3321) allele.
HSP104‐dependent remodeling of yeast prion aggregates also promotes efficient segregation of seeds into daughter cells, ensuring inheritance of the prion state (Satpute‐Krishnan et al, 2007). To test whether the inhibition of HSP‐110‐dependent disaggregation equally affects α‐Syn dissemination in metazoans, we employed our recently developed α‐Syn spreading model to monitor the transmission of α‐Syn from donor muscle cells into recipient hypodermal cells (Sandhof et al, 2019). The dissemination of α‐Syn is age‐dependent and can be detected in less than 10% of the animals on day 4 and in more than 90% on day 5 and later in life (Sandhof et al, 2019). KD of HSP‐110 significantly reduced the transmission of α‐Syn particles between tissues with protein transfer being detected in only 50% of hsp‐110 hairpin animals on days 5 and 6 compared to up to 90% of WT animals (Fig 2G and H). Hence, in the absence of HSP‐110, α‐Syn is inefficiently transferred to neighboring tissues. Since polyQ proteins are not spreading to neighboring tissues in our model system (Sandhof et al, 2019), we could not assess the effect of HSP‐110 levels on Q35 spreading. Nevertheless, these findings revealed that the HSP‐110‐dependent disaggregation activity seems to remodel α‐Syn aggregates to create toxic species that can transfer between cells.
Overall, these results support the notion that the KD of HSP‐110 impairs the HSP70 disaggregation machinery, which on the one hand prevents the removal of amorphous aggregates and on the other hand abolishes the propagation and intercellular transmission of toxic amyloid‐type substrates.
WT but not NEF‐deficient yeast SSE1 can compensate the loss of Caenorhabditis elegans HSP‐110
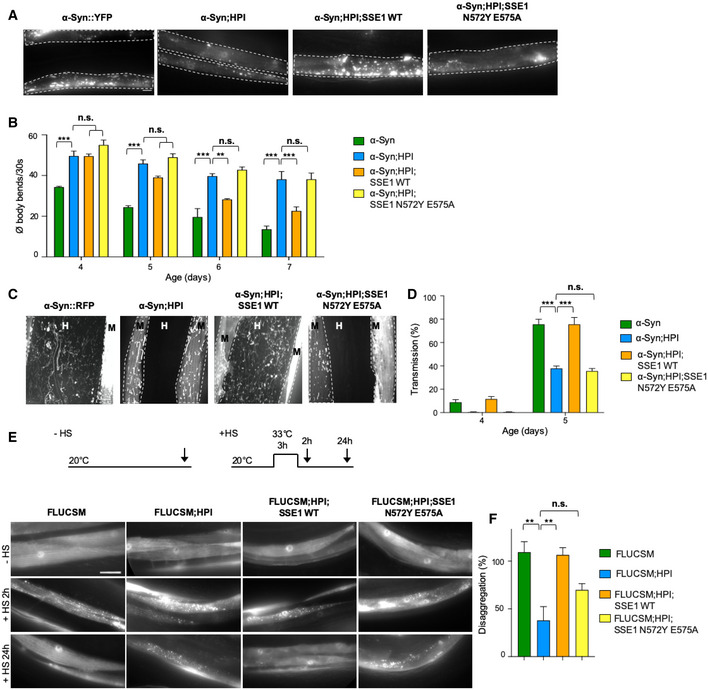
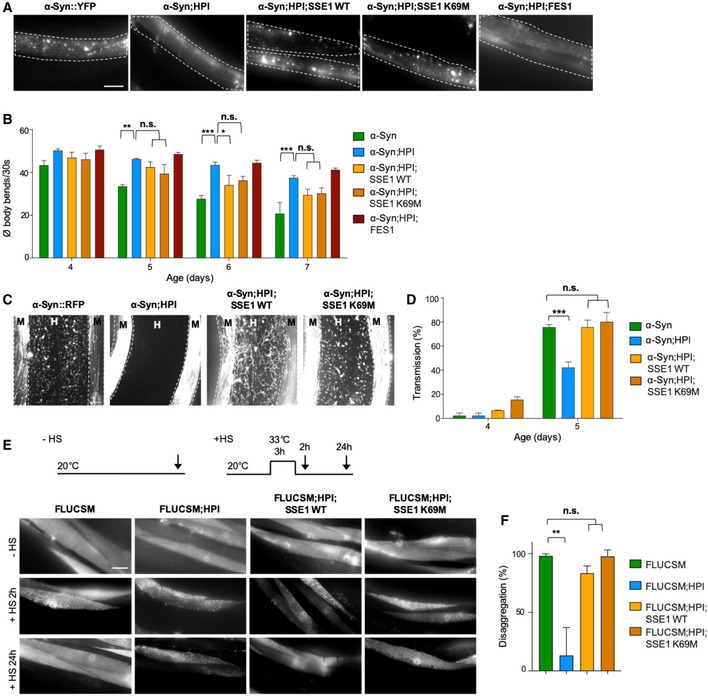
What is the specific contribution of HSP‐110 to the observed disaggregation activity in C. elegans? Previous results revealed that the nucleotide exchange activity is necessary for efficient substrate disaggregation in vitro, while its intrinsic ATPase activity is less important (Rampelt et al, 2012). Nevertheless, HSP110s have a substrate binding and a nucleotide binding domain similar to HSP70; therefore, an ATP‐driven chaperone‐like activity has been proposed for this chaperone family (Shorter, 2011; Mattoo et al, 2013). Indeed, structurally unrelated NEFs, such as Snl1ΔN (BAG‐1 homolog) or FES‐1 (HSPBP1 homolog), were not able to efficiently substitute an HSP110‐family NEF in disaggregation (Rampelt et al, 2012; Kaimal et al, 2017). To investigate this in C. elegans, we took advantage of the high conservation of the chaperones involved in disaggregation, which allows individual members to cooperate across species boundaries (Rampelt et al, 2012). Since yeast NEFs were shown to be able to replace the human HSP110‐type NEF in vitro (Rampelt et al, 2012), we introduced extrachromosomal arrays coding for WT and specific mutants of yeast SSE1 (HSP110‐type NEF) or FES1 (armadillo‐type NEF) into α‐Syn::YFP and hsp‐110 hairpin expressing animals by microinjection. We found that WT SSE1 could complement for the KD of the endogenous C. elegans HSP‐110 and restore the formation of visible α‐Syn foci (Fig 3A) and α‐Syn toxicity (Fig 3B). Since the transgenes were expressed from an extrachromosomal array, which results in variable expression levels in a variable number of cells, a full complementation was not expected. We next asked whether the interaction of SSE1 with the HSP70‐DNAJ system is necessary to mediate substrate disaggregation, which would suggest an important role for the NEF activity of HSP‐110. To test this, we employed SSE1N572Y E575A, a double mutant, which is unable to interact with HSP70 (Polier et al, 2008; Rampelt et al, 2012). This mutant did not compensate the loss of HSP‐110 and was not able to restore α‐Syn foci formation and toxicity (Fig 3A and B). In contrast, an ATPase‐deficient SSE1K69M mutant, which hydrolysis ATP 20 times slower than WT SSE1 (Raviol et al, 2006; Rampelt et al, 2012), was capable to reestablish α‐Syn foci formation and toxicity similar to WT SSE1 (Fig EV2A and B), suggesting a minor role for a WT ATPase activity in substrate disaggregation.
Figure 3. WT but not NEF‐deficient yeast SSE1 can compensate the loss of Caenorhabditis elegans HSP‐110.
-
AMaximum intensity projections of confocal microscopy z‐stacks of 5‐day‐old animals expressing the indicated transgenes. White dashed lines outline the borders of muscle cells. Scale bar: 10 μm. The expression of the yeast SSE1N572Y E575A mutant cannot reverse the reduction of α‐Syn::YFP foci in the hsp‐110 hairpin expressing animals.
-
BQuantification of motility as a measure for transgene toxicity. Displayed is the mean ± SEM (N = 3) amount of body bends/30 s of animals expressing the indicated transgenes. Statistical analysis was done using two‐way ANOVA with Dunnett's multiple comparison test. n.s. = not significant, **P ≤ 0.01, ***P ≤ 0.001. The presence of the yeast SSE1N572Y E575A mutant was not able to suppress the rescue of α‐Syn::YFP toxicity in hsp‐110 hairpin expressing animals.
-
CMaximum intensity projections of fluorescent microscopy z‐stacks of 5‐day‐old nematodes expressing the indicated transgenes. White dashed lines outline the borders of muscle cells. M: muscle, H: hypodermis. Scale bars: 10 μm. Signal outside of muscle cells reveals spreading of α‐Syn.
-
DQuantification of animals showing α‐Syn transmission into the hypodermis at indicated ages. Displayed is the mean ± SEM (in %) (N = 3). Statistical analysis was done using two‐way ANOVA with Dunnett's multiple comparison test. n.s. = not significant, ***P ≤ 0.001.
-
EExperimental set‐up: Age‐synchronized 4‐day‐old animals were subjected to heat stress for 3 h at 33°C (+HS) and then returned to 20°C or left at 20°C (−HS), respectively. Arrows indicate imaging time points. The −HS controls were imaged at the same time point as the +HS animals after 24 h at 20°C. Maximum intensity projections of fluorescent microscopy z‐stacks of animals expressing the indicated transgenes. Scale bar: 20 μm. The impaired clearance of HS‐induced FLUCSM::GFP foci in the hsp‐110 hairpin expressing cells is rescued by co‐expression of WT but not by the HSP70‐binding‐deficient SSE1N572Y E575A mutant.
-
FQuantification of FLUCSM::GFP foci disaggregation. % disaggregation is calculated as 100—ratio of FLUCSM::GFP foci area relative to total muscle area at the +HS 24 h time point to the +HS 2 h time point. Data are displayed as mean ± SEM (in %) (N = 3). Statistical analysis was done using one‐way ANOVA with Dunnett's multiple comparison test. n.s. = not significant, **P ≤ 0.01.
Figure EV2. WT and ATPase‐deficient yeast SSE1 can compensate the loss of Caenorhabditis elegans HSP‐110.
-
AMaximum intensity projections of confocal microscopy z‐stacks of 5‐day‐old animals expressing the indicated transgenes. Scale bar: 10 μm. The expression of yeast WT and K69M mutant SSE1 but not FES1 reversed the reduction of α‐Syn::YFP foci in the hsp‐110 hairpin expressing animals.
-
BQuantification of motility as a measure for transgene toxicity. Displayed is the mean ± SEM (N = 3) amount of body bends/30 s of animals expressing the indicated transgenes. Statistical analysis was done using two‐way ANOVA with Bonferroni's multiple comparison test. n.s. = not significant, *P ≤ 0.05, **P ≤ 0.01, ***P ≤ 0.001. The presence of yeast WT SSE1 and mutant SSE1K69M but not FES1 suppressed the rescue of α‐Syn::YFP toxicity in hsp‐110 hairpin expressing animals.
-
CMaximum intensity projections of fluorescent microscopy z‐stacks of 5‐day‐old nematodes expressing the indicated transgenes. White dashed lines outline the borders of muscle cells. M: muscle, H: hypodermis. Scale bars: 10 μm. Signal outside of muscle cells reveals spreading of α‐Syn.
-
DQuantification of animals showing α‐Syn transmission into the hypodermis at indicated ages. Displayed is the mean ± SEM (in %) (N = 3). Statistical analysis was done using two‐way ANOVA with Bonferroni's multiple comparison test. n.s. = not significant, ***P ≤ 0.001.
-
EExperimental set‐up: Age‐synchronized 4‐day‐old animals were subjected to heat stress for 3 h at 33°C (+HS) and then returned to 20°C or left at 20°C (−HS), respectively. Arrows indicate imaging time points. The −HS controls were imaged at the same time point as the +HS animals after 24 h at 20°C. Maximum intensity projections of fluorescent microscopy z‐stacks of animals expressing the indicated transgenes. Scale bar: 20 μm. The impaired clearance of HS‐induced FLUCSM::GFP foci in the hsp‐110 hairpin expressing cells is rescued by co‐expression of WT SSE1 and SSE1K69M.
-
FQuantification of FLUCSM::GFP foci disaggregation. % disaggregation is calculated as 100—ratio of FLUCSM::GFP foci area relative to total muscle area at the +HS 24 h time point to the +HS 2 h time point. Data are displayed as mean ± SEM (in %) (N = 3). Statistical analysis was done using one‐way ANOVA with Dunnett's multiple comparison test. n.s. = not significant, **P ≤ 0.01.
Expression of FES1 had no obvious impact on α‐Syn foci formation (Fig EV2A) and did not abrogate the suppression of α‐Syn toxicity in the HSP‐110 KD background (Fig EV2B). Only an HSP110‐type NEF seems to be able to reestablish the α‐Syn phenotype as in WT; however, we cannot rule out that yeast FES1 is not able to cooperate with the C. elegans HSP70 system. Therefore, we focused only on the SSE1 variants in the subsequent assays.
We then tested the impact of the SSE1 variants on α‐Syn spreading in our α‐Syn::RFP model. With the introduction of WT and K69M mutant SSE1 into the hsp‐110 hairpin animals, the intercellular transmission of α‐Syn was also restored, while co‐expression of mutant SSE1N572Y E575A had no effect (Figs 3C and D, and EV2C and D).
To verify whether the observed effects with the SSE1 variants could be attributed to a reestablishment of disaggregation activity, the FLUCSM::EGFP reporter was used as an amorphous substrate. As before, FLUCSM::EGFP remained soluble in all strains under non‐HS conditions, but readily formed multiple distinct foci after being subjected to heat stress (Fig 3E and F). Again, HSP‐110 KD animals were not able to resolubilize aggregated FLUCSM::EGFP during the 24‐h recovery period and numerous aggregates could still be observed in each cell (Fig 3E and F). Additional expression of either WT or ATPase‐deficient SSE1 led to the removal of almost all visible foci during the recovery period and muscle cells showed diffuse FLUCSM::EGFP fluorescence with only sporadic foci in a small number of cells, whereas expression of SSE1N572Y E575A did not significantly increase the removal of heat shock‐induced FLUCSM::EGFP compared to HPI animals (Figs 3E and F, and EV2E and F).
Taken together, these observations show that the yeast HSP‐110 homolog SSE1 can cooperate with the C. elegans Hsp70‐DNAJ system in vivo and compensate the loss of endogenous HSP‐110, leading to an increase of α‐Syn foci formation, spreading and toxicity as well as the solubilization of HS‐induced FLUCSM::EGFP foci. Moreover, in line with previous in vitro data, the NEF activity of HSP110 is most important to promote disaggregation, whereas the intrinsic ATPase activity of HSP110 seems less relevant (Rampelt et al, 2012). This argues against a specific chaperone‐like contribution of HSP‐110 to disaggregation.
KD of HSP‐110 impairs cellular protein folding homeostasis
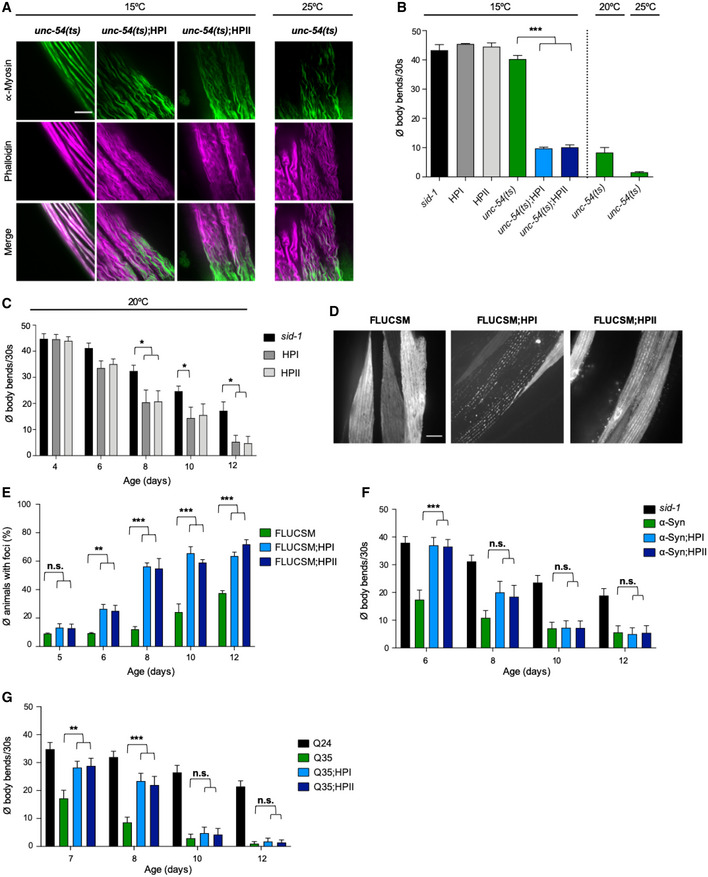
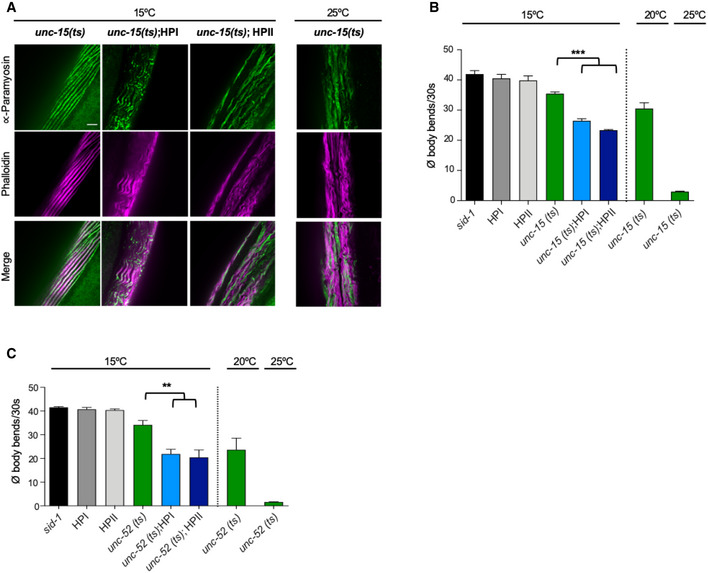
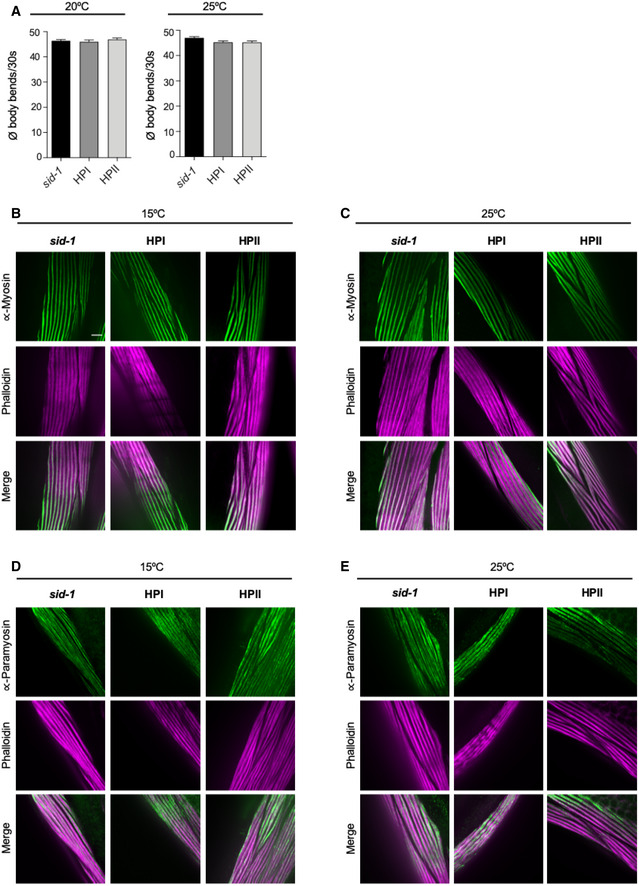
We further investigated whether the KD of HSP‐110 might cause more general cellular defects that impair functionality of the affected tissue. The loss of HSP‐110 could negatively affect cellular HSP70 capacity, as HSP70 is not efficiently released from its substrates in the absence of a NEF. This would reduce the pool of HSP70 available for its other functions and therefore, as a negative side effect, KD of HSP‐110 might interfere with the cellular folding environment. To test this, the hsp‐110 hairpins were introduced into strains each containing an endogenous protein variant with a temperature‐sensitive (ts) mutation leading to folding defects (Gidalevitz et al, 2006; Ben‐Zvi et al, 2009). Strains harboring either paramyosin(ts) [unc‐15(e1402)], myosin(ts) [unc‐54(e1301)], or perlecan(ts) [unc‐52(e669, su250)] have been established as sensors that provide information about the folding capacity of the proteostasis network (Gidalevitz et al, 2006; Ben‐Zvi et al, 2009). These animals behave as superficially WT at permissive temperatures (15°C), but exhibit severe movement defects due to disrupted muscle filaments resulting from the aggregation of the ts mutant proteins at restrictive temperatures (25°C) or under conditions that impair the cellular folding environment (Gidalevitz et al, 2006; Ben‐Zvi et al, 2009).
The respective ts phenotypes were confirmed at 25°C, while the control and hsp‐110 hairpin animals with WT unc alleles showed no abnormalities (Figs 4A and B, EV3 and EV4). At the permissive temperature of 15°C, control, hsp‐110 hairpin and ts mutant animals were almost indistinguishable and did not exhibit any obvious phenotypes (Figs 4A and B, and EV3 and EV4). In contrast, movement defects were readily evident in ts mutant strains with reduced HSP‐110 levels (Figs 4B, and EV3B and C). The decline in motility in the latter animals correlated with distorted muscle filaments caused by the misfolding and misassembly of the respective ts mutant proteins (Figs 4A and EV3A). Thus, endogenous metastable protein variants, which are continuously misfolding even at low ambient growth temperatures, are no longer correctly (re‐)folded upon HSP‐110 KD, leading to exposure of the ts mutant phenotype at permissive temperatures.
Figure 4. HSP‐110 HP expression impairs cellular protein folding homeostasis.
-
AMaximum intensity projections of confocal z‐stacks of 4‐day‐old animals expressing the indicated transgenes or harboring the indicated temperature‐sensitive (ts) mutations. Muscle cells were stained with anti‐myosin (green) and Alexa Fluor 647‐phalloidin (purple). Scale bar: 5 μm. Myosin misfolding reflects the exposure of the ts mutant phenotype of myosin(ts) [unc‐54(e1301)] at the permissive temperate of 15°C by co‐expression of the hsp‐110 hairpins.
-
BQuantification of motility as a measure for toxicity. Displayed is the mean ± SEM (N = 4) of body bends/30 s of animals expressing the indicated transgenes or harboring the indicated mutations. Statistical analysis was done using one‐way ANOVA with Dunnett's multiple comparison test. ***P ≤ 0.001. Co‐expression of the hsp‐110 hairpins exposed the ts mutant phenotype at the permissive temperate of 15°C, resulting in a significant increase in movement defects.
-
CQuantification of motility as a measure for transgene toxicity. Displayed is the mean ± SEM (N = 4) amount of body bends/30 s of animals expressing the indicated transgenes or harboring the indicated mutations. Statistical analysis was done using two‐way ANOVA with Tukey's multiple comparison test. *P ≤ 0.05. Expression of the hsp‐110 hairpins caused movement defects with increasing age.
-
DMaximum intensity projections of confocal z‐stacks of 12‐day‐old animals expressing the indicated transgenes. Scale bar: 10 μm. FLUCSM forms foci with increasing age, which is markedly accelerated upon hsp‐110 KD.
-
EQuantification of animals with FLUCSM::GFP foci at indicated days of life. Data are displayed as mean ± SEM (in %) (N = 3). Statistical analysis was done using two‐way ANOVA with Dunnett's multiple comparison test. n.s. = not significant, **P ≤ 0.01, ***P ≤ 0.001.
-
FQuantification of motility as a measure for transgene toxicity. Displayed is the mean ± SEM (N = 3) amount of body bends/30 s of animals expressing the indicated transgenes or harboring the indicated mutations. Statistical analysis was done using two‐way ANOVA with Dunnett's multiple comparison test. n.s. = not significant, ***P ≤ 0.001. Expression of the hsp‐110 hairpins caused movement defects with increasing age. The beneficial effects of HSP‐110 KD on amyloid toxicity are masked in older animals.
-
GQuantification of motility as a measure for transgene toxicity. Displayed is the mean ± SEM (N = 3) amount of body bends/30 s of animals expressing the indicated transgenes or harboring the indicated mutations. Statistical analysis was done using two‐way ANOVA with Dunnett's multiple comparison test. n.s. = not significant, **P ≤ 0.01, ***P ≤ 0.001. Expression of the hsp‐110 hairpins caused movement defects with increasing age. The beneficial effects of HSP‐110 KD on amyloid toxicity are masked in older animals.
Figure EV3. HSP‐110 HP expression impairs cellular protein folding homeostasis.
-
AMaximum intensity projections of confocal z‐stacks of 4‐day‐old animals expressing the indicated transgenes or harboring the indicated temperature‐sensitive (ts) mutations. Muscle cells were stained with anti‐paramyosin (green) and Alexa Fluor 647‐phalloidin (purple). Scale bar: 5 μm. Paramyosin misfolding revealed that co‐expression of the hsp‐110 hairpins exposed the ts mutant phenotype of paramyosin(ts) [unc‐15(e1402)] at the permissive temperate of 15°C.
-
B, CQuantification of motility as a measure for toxicity. Displayed is the mean ± SEM (N = 3) of body bends/30 s of animals expressing the indicated transgenes or harboring the indicated mutations. Statistical analysis was done using one‐way ANOVA with Dunnett's multiple comparison test. **P ≤ 0.01, ***P ≤ 0.001. Co‐expression of the hsp‐110 hairpins exposed the ts mutant phenotypes already at the permissive temperate of 15°C, resulting in a significant increase in movement defects. All strains harbor the sid‐1(pk3321) allele.
Figure EV4. HSP‐110 HP expression does not affect WT myosin or paramyosin folding.
-
AQuantification of motility as a measure for transgene toxicity. Displayed is the mean ± SEM (N = 3) of body bends/30 s of animals expressing the indicated transgenes or harboring the indicated mutations. Statistical analysis was done using one‐way ANOVA with Dunnett's multiple comparison test. Animals that express the hsp‐110 hairpins show normal movement at 15 and 25°C.
-
B–EMaximum intensity projections of confocal z‐stacks of 4‐day‐old animals expressing the indicated transgenes or harboring the indicated mutations. Muscle cells were stained with (B) and (C) anti‐myosin (green) or (D) and (E) anti‐paramyosin (green), and Alexa Fluor 647‐phalloidin (purple). Scale bar: 5 μm. Animals expressing the hsp‐110 hairpins exhibited a normal myosin and paramyosin structure at 15 and 25°C. All strains harbor the sid‐1(pk3321) allele.
These results suggest that the KD of HSP‐110 impairs not only HSP70 disaggregation activity but also HSP70 (re‐)folding activity, which negatively impacts the cellular folding environment.
KD of HSP‐110 impairs muscle function with increasing age
We asked whether an impairment of the disaggregation machinery affects muscle cell function during aging since there is stronger demand on the proteostasis network with the cumulative amount of misfolding proteins (David et al, 2010; Walther et al, 2015). To investigate muscle function of animals with a compromised disaggregation machinery, animals were subjected to a motility assay under both normal (20°C) and elevated ambient temperature (25°C) to slightly challenge the proteostasis network. At both 20 and 25°C growth conditions, there is no difference between control and hsp‐110 hairpin strains in young animals (Figs 2C and 4C, and EV4A and EV5A). However, during aging there is a faster decline in motility in hsp‐110 hairpin animals compared to the control strains (Figs 4C and EV5A). This is likely due to an accelerated collapse of proteostasis when the disaggregation system is compromised. Accordingly, also the age‐dependent FLUCSM foci formation is accelerated in the hsp‐110 KD background (Fig 4D and E). As a result, the rescue of α‐Syn and Q35 toxicity by the KD of HSP‐110 observed in younger animals is lost in older animals (Fig 4F and G). This cannot be attributed to a restoration of disaggregation activity, since the levels of HSP‐110 are still significantly reduced in the hsp‐110 hairpin strains (Fig EV5B). While the number of α‐Syn foci remained low in HPI and HPII animals, the number of Q35 foci was restored up to WT levels in older animals (Fig EV5C–F).
Figure EV5. HSP‐110 HP expression impairs cellular protein folding homeostasis during aging.
-
AQuantification of motility as a measure for transgene toxicity. Displayed is the mean ± SEM (N = 3) amount of body bends/30 s of animals expressing the indicated transgenes or harboring the indicated mutations. Statistical analysis was done using two‐way ANOVA with Tukey's multiple comparison test. *P ≤ 0.05, **P ≤ 0.01. Expression of the hsp‐110 hairpins causes movement defects with increasing age at 25°C.
-
BSingle plane confocal fluorescent microscopy images of 10‐day‐old animals harboring the indicated transgenes or endogenously tagged proteins. Muscle cells are outlined. Muscle cell‐specific HSP‐110::GFP depletion persisted during aging in HP animals. M: muscle, H: hypodermis. Scale bars: 10 μm.
-
CMaximum intensity projections of confocal z‐stacks of 12‐day‐old animals expressing the indicated transgenes or mutations. White dashed lines outline the borders of muscle cells. Scale bar: 10 μm. α‐Syn::YFP foci number remained low and did not increase in old HPI and HPII animals.
-
DQuantification of the ratio of α‐Syn::YFP foci in 12‐day‐old animals to 5‐day‐old animals. The ratio of the product of mean foci fluorescence and foci area relative to muscle area from 12‐day‐old to 5‐day‐old animals is displayed (relFluoFoci). Data are shown as mean ± SEM (N = 3). All strains harbor the sid‐1(pk3321) allele.
-
ESingle plane fluorescent microscopy images of 12‐day‐old animals harboring the indicated transgenes.
-
FQuantification of Q35::YFP foci in WT and hsp‐110 hairpin background. Shown is the mean for each strain and age ± SEM (N = 3). Statistical analysis was done using two‐way ANOVA with Dunnett's multiple comparison test. n.s. = not significant.
These data suggest that in young animals, the low level of misfolded endogenous proteins does not overwhelm cellular protein folding capacity where other members of the proteostasis network can still buffer the impaired HSP‐110 activity. At this age, only the expression of amyloidogenic proteins poses a significant challenge for the proteostasis network since the protective effect of KD of HSP‐110 in α‐Syn and Q35 transgenic animals is revealed despite impairment of the essential disaggregation activity. In contrast, in older, post‐reproductive, animals the increasing load of endogenous misfolded proteins represents an additional burden on the disaggregation system that eventually masks the positive effects on α‐Syn and Q35 toxicity and might in turn enhance Q35 aggregation as previously described (Gidalevitz et al, 2006). These results illustrate that the phenotype resulting from the impairment of the disaggregation system depends on the nature of the predominant substrate(s) at a given time.
Discussion
There is growing evidence that many amyloidogenic aggregates associated with prevalent neurodegenerative diseases such as AD and PD can propagate like prions and spread from cell to cell, which might accelerate disease progression. However, the mechanisms that drive these processes are still largely unknown. The yeast prion model system paved the way to identify and understand cellular factors of prion propagation, leading to the seminal discovery that efficient prion propagation is inevitably linked to amyloid fragmentation by the AAA+ disaggregase HSP104 (Chernoff et al, 1995). It remained a major open question whether similarly acting cellular chaperones exist in metazoa, which lack HSP104, and how this activity affects amyloid toxicity in post‐mitotic cells, since prion‐like propagation in yeast and mammalian cell culture models rarely exhibits toxicity.
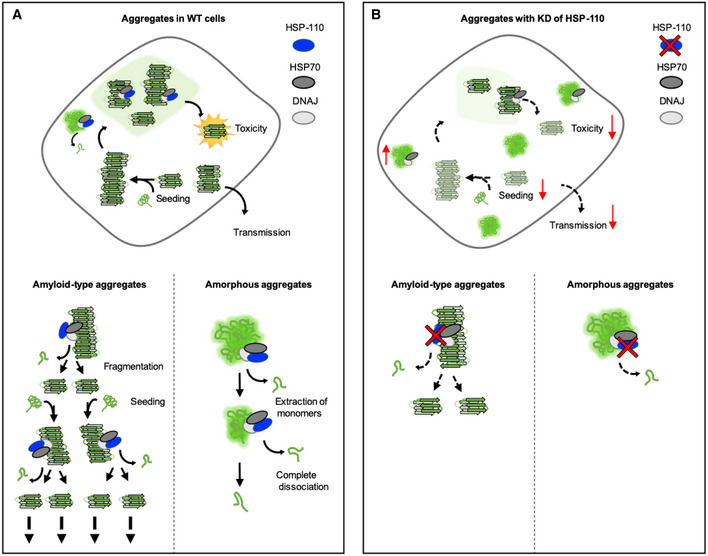
The present study reveals that the HSP70 disaggregation machinery is required for the prion‐like propagation of disease‐associated amyloidogenic proteins in metazoa (Fig 5A). Moreover, the chaperone‐mediated disaggregation appears to be a major determinant of amyloid‐associated toxicity. Blocking the disaggregation activity by knocking down HSP‐110 interfered with the formation of toxic α‐Syn and Q35 conformers in C. elegans (Fig 5B). The visible cytosolic foci in WT animals likely constitute a reservoir, from which propagons are continuously released by the HSP70 disaggregase (Fig 5A). KD of HSP70 also reduced α‐Syn spreading in C. elegans, indicating that particles generated by disaggregation are preferred substrates for intercellular transfer. Indeed, smaller subfibrillar prion species are most infectious and more efficiently transported between cells than larger assemblies (Silveira et al, 2005; Bett et al, 2017).
Figure 5. Model of the effect of disaggregation activity on aggregation and toxicity of amyloid‐like and amorphous aggregates.
-
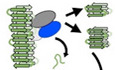
Aα‐Syn foci in WT cells might constitute active sites for propagon formation. Disaggregation in these sites generates smaller α‐Syn fragments that are more toxic and more readily transferred to adjacent tissues. As they are also more seeding‐competent, this leads to an amplification of the aggregated material. The disaggregation of amyloid‐type aggregates by the HSP70 system is an important part of a propagation cycle involving repeated fragmentation of larger fibrils to generate and amplify toxic seeding‐competent particles. In contrast, the disaggregation of amorphous aggregates leads to the formation of smaller seeding‐incompetent fragments, which are eventually completely dissociated.
-
BIn HSP‐110 KD animals, the disaggregation activity is impaired. Impaired fragmentation of amyloid‐type aggregates leads to reduced foci formation, toxicity, and spreading. In contrast, amorphous aggregates persist and increase over time.
The KD of HSP‐110 in C. elegans resembles in several aspects an impairment of HSP104 in yeast. For example, HSP‐110 depletion in C. elegans resulted in the persistence of heat‐induced luciferase aggregates. Likewise, inhibition of HSP104 activity by GdnHCl also suppresses resolubilization of aggregated luciferase in heat shocked yeast cells (Ness et al, 2002). Impairing HSP‐110 activity in C. elegans ameliorated the aggregation and toxicity of α‐Syn and Q35. Similarly, the inhibition of HSP104 reduces aggregation and toxicity of other disease‐associated amyloidogenic proteins, such as polyQ in yeast (Krobitsch & Lindquist, 2000). In addition, the HSP‐110‐dependent disaggregation activity seems to affect α‐Syn aggregates similarly to how HSP104 remodels yeast prion complexes, leading to the amplification of conformers that have an increased potential to transfer to neighboring or daughter cells (Chernoff et al, 1995; Tuite & Lindquist, 1996). Since the HSP104‐HSP70 system is known to fragment prion aggregates, it is tempting to speculate that the HSP70 disaggregase also fragments amyloidogenic substrates in C. elegans.
Recent work showed that the overexpression of an HSP110‐type NEF extended the survival of mice expressing G85R mutant superoxide dismutase 1 (SOD1), which is linked to amyotrophic lateral sclerosis (ALS) (Nagy et al, 2016). The authors concluded that this is likely boosting the function of the disaggregation machinery, but without providing evidence for an increased activity. These results seem to contradict the present study at first, as SOD1 is a presumably amyloidogenic protein such as α‐Syn. However, our previous work in vitro (Rampelt et al, 2012) and observations of others in vivo (Nollen et al, 2000; Kampinga & Craig, 2010) imply that not only too low but also too high HSP‐110 levels poison the HSP70 disaggregation reaction. This can be explained by too slow and too fast nucleotide release from HSP70, hampering the HSP70 ATPase cycle. Therefore, HSP‐110 overexpression might rather interfere with disaggregation activity, leading to less SOD1 aggregation and toxicity according to our model.
Given the opposite effects on amorphous vs. amyloid substrates, it is not surprising that KD of HSP‐110 can lead to contradictory results, even in the context of the same model system. HSP‐110 has been previously identified in a genome‐wide screen for proteostasis regulators in C. elegans, in which an organism‐wide KD of HSP‐110 reduced Q35 aggregation (Silva et al, 2011). In contrast, the same systemic KD resulted in increased Q35 aggregation in another study (Scior et al, 2018). The respective outcome is likely to depend on the timing and strength of the KD, and to what extent it affects the folding of proteins other than Q35, both in the same tissue and in neighboring tissues, which may also influence muscle cell proteostasis through non‐autonomous mechanisms (Gidalevitz et al, 2006; Shai et al, 2014; Morimoto, 2019). Our results clearly show that the impairment of the disaggregation machinery rescues the aggregation and toxicity of amyloid‐like substrates, but at the same time negatively impacts the removal of amorphous aggregates or folding of metastable proteins. These side effects may ultimately override the positive effect on amyloidogenic proteins, especially during aging.
The HSP70 system has several functions besides substrate disaggregation, including the uncoating of clathrin vesicles during endocytosis (Sousa & Lafer, 2015), that could influence the prion‐like propagation of α‐Syn. Nevertheless, an influence on α‐Syn transmission due to HSP70's role in endocytosis can be excluded, since in our experimental set‐up we specifically knock down HSP‐110 only in the “donor” muscle cells and not in the “receiving” tissue. Moreover, recent publications suggest that the HSP70 machinery may be involved in the unconventional secretion of misfolded cytosolic proteins (Fontaine et al, 2016; Jung et al, 2016), and since both α‐Syn and the hairpin construct are co‐expressed in the “donor” muscle cells, an effect on α‐Syn secretion is theoretically possible. However, if the KD of HSP‐110 would block the release of misfolded α‐Syn, we would expect α‐Syn to accumulate in the “donor” muscle cells and eventually form more foci. Instead, we observe the opposite, namely a reduction of α‐Syn foci upon HSP‐110 KD. We therefore consider it unlikely that HSP‐110 could affect α‐Syn secretion. The degradative pathways, such as the ubiquitin‐proteasome system or autophagy, which are also interconnected with the HSP70 system, might further contribute to α‐Syn spreading, and our folding sensors only monitor the cellular protein folding capacity and do not address the functionality of these degradation pathways. Therefore, future experiments should investigate whether low levels of HSP‐110 also impact the capacity of degradation systems that might influence α‐Syn propagation.
Although chaperones are generally beneficial and indispensable, the ability of prions to exploit the disaggregation machinery in order to propagate in cells ranging from yeast to metazoan as shown here renders this activity a double‐edged sword in disease and aging (Jones & Tuite, 2005; True, 2006; Wentink et al, 2019). Overall, our results show that caution is advised when attempting to influence disaggregation activity for disease intervention, as boosting the activity could produce more toxic seeds, while inhibiting it could adversely affect the removal of amorphous aggregates and cell function. The higher redundancy of HSP110‐type co‐chaperones with three isoforms (HSP105 (HSPH1), APG2 (HSPH2), and APG1 (HSPH3)) in humans could be advantageous here, as only one member could be targeted, which would likely lead to fewer side effects, but could still be sufficient to shift the balance of amyloid propagation toward resolubilization or degradation. Another promising approach could be to specifically abolish the disaggregation of amyloids while leaving the (re‐)folding and disaggregation of other substrates unaffected, which may be achievable by targeting substrate‐specific Hsp70 co‐chaperones. Furthermore, the tissue‐specific promoter used in our model system mediated an early and continuous KD of HSP‐110 parallel to substrate expression. Transient inhibition of disaggregation activity by a temporary drug administration could reduce amyloid aggregate load to levels that can be managed by cells while minimizing negative side effects. Therefore, the development of small molecules for pharmacological modulation of specific components of the disaggregation machinery could be a promising way to combat diseases caused by amyloidogenic proteins.
Materials and Methods
Maintenance of Caenorhabditis elegans and age synchronization
All animals were cultured using standard methods (Brenner, 1974). If not otherwise indicated, worms were grown on nematode growth medium (NGM) plates seeded with Escherichia coli strain OP50 at 20°C. Animals were age‐synchronized by bleaching or egg laying (Sandhof et al, 2019). For bleach synchronization, gravid adults were dissolved in 20% sodium hypochlorite solution. The surviving C. elegans embryos were washed with M9 buffer 2 times and let hatch with gentle rocking in M9 buffer at 20°C overnight. The next day, L1 larvae were distributed onto NGM plates seeded with OP50 and grown at 20°C. Alternatively, animals were age synchronization by egg laying; adult animals were allowed to lay eggs for 2–3 h and removed again from the plates. Embryos were grown at 20°C and assayed at the indicated days of life. Temperature‐sensitive strains were maintained at 15°C. All age synchronization was done by egg laying at 15°C, and embryos were then moved to the indicated temperature and allowed to develop.
Since the age of onset of transgene aggregation or toxicity depends on the intrinsic properties of the respective model protein or experimental design, slightly different age ranges were chosen in each experiment. Where experiments on younger and older animals were conducted separately and did not originate from a single experiment, the age ranges were chosen so that they overlapped with the corresponding data sets on at least 1 day. Nevertheless, each model protein was examined on several days during aging to verify the results and ensure experimental reproducibility.
Cloning of Caenorhabditis elegans expression constructs and generation of transgenic animals
The cDNA sequence of hsp‐110 was amplified using primers with appropriate restriction sites by PCR from a L4440 plasmid (Vidal C. elegans ORF‐RNAi library, Source BioScience) and cloned into a pCR‐Blunt vector in sense and antisense direction separated by an unrelated 68 bp spacer sequence. The inverted repeat sequence was then subcloned by restriction digestion into the pPD30_38 C. elegans expression vector containing the unc‐54 promoter and 3′UTR sequences. The pPD30_38_hsp‐110 hairpin construct was injected together with a pharyngeal co‐expression marker (myo‐2p::CFP) into young adult N2 hermaphrodites to generate transgenic lines carrying an extrachromosomal array, which was subsequently integrated by gamma irradiation. Successfully integrated lines were backcrossed at least five times into the WT N2 background.
For constructing the following C. elegans expression constructs, the MultiSite Gateway Three‐Fragment Vector Construction Kit (Thermo Fisher Scientific) was used. To generate the expression plasmids for sse1 and sse1 K69M, their cDNA flanked by recombination sites suitable for gateway cloning was amplified from yeast expression plasmids pCA568 and pCA573 (Andreasson et al, 2008) by PCR. The fes1 ORF was amplified from a pCA528 expression plasmid. The fragments were inserted into the gateway cloning entry vector pDONR221 according to manufacturer's protocol. pDONR P4‐P1R myo‐3 promoter region and pDONR P2R‐P3 unc‐54 3ʹUTR entry vectors were generated previously (Nussbaum‐Krammer et al, 2013). The final myo‐3p::sse1/sse1 K69M ::unc‐54 3′UTR and myo‐3p::fes1::unc‐54 3′UTR were assembled by recombining the entry clones into the pDEST R4‐R3 II vector (Thermo Fisher Scientific) according to the manufacturer's protocol and sequenced after transformation. The myo‐3p::sse1N572Y E575A::unc‐54 3′ UTR expression plasmid was generated by site‐directed mutagenesis as described by Huanting Liu and James Naismith (Liu & Naismith, 2008) using the myo‐3p::sse1::unc‐54 3′ UTR plasmid as template. The expression plasmids (5 ng/μl) together with a pharyngeal co‐expression marker myo‐2p::RFP (Addgene) were injected into young adult α‐Syn::YFP;HPI or HPI only hermaphrodites to generate transgenic lines carrying an extrachromosomal array. The FLUCSM::GFP;HPI;SSE1/SSE1K69M strains as well as the strains co‐expressing α‐Syn::YFP, α‐Syn::RFP or FLUCSM::GFP and HPI; SSE1N572Y E575A were generated by genetic crossing.
The endogenous hsp‐110 locus was tagged with GFP as described in Dickinson et al (2015). In short, the N20 sequence targeting the 3′ end of the hsp‐110 gene (5′‐TCTATCACTTTTCGTATCAA‐3′) was inserted into the Cas9–sgRNA vector pDD162 (Addgene) by site‐directed mutagenesis. Approx. 500 bp hsp‐110 homology arms were amplified from genomic DNA by PCR and inserted into the AvrII and SpeI double digested FP‐SEC Vector pDD282 (Addgene). N2 animals were injected with a mix containing the Cas9‐sgRNA vector, the hsp‐110::GFP template, and co‐injection markers, screened for positive knock‐in events, before the selection cassette was removed according to the published protocol (Dickinson et al, 2015).
The quality of all constructs was validated by Sanger sequencing. Strains used in this study are listed in Table EV1.
Heat shock experiments
To induce the heat shock response (HSR), age‐synchronized animals were subjected to heat stress for 3 h at 33°C (+HS) in a water bath and then returned to 20°C or left at 20°C (−HS). Images were taken after 2 and 24 h. The −HS controls were imaged at the same time point as the +HS animals after 24 h at 20°C.
For quantitative real‐time (qRT)–PCR experiments, WT N2 or transgenic animals (sid‐1(pk3321) ± HSP‐110 hairpins (HP I + II)) were synchronized by bleaching and grown at 20°C until the first day of adulthood. Animals were subjected to a 1 h HS at 33°C and returned to 20°C for 1 h (+HS) or left at 20°C (−HS) prior to RNA extraction.
RNA extraction and cDNA synthesis
Animals were washed off + and −HS plates with M9, transferred into 15‐ml Falcon tubes, and washed three times to remove bacteria and larvae. Worm pellets were transferred to 2‐ml screw cap tubes (MP Biomedicals), and total RNA was extracted with TRIzol reagent (Invitrogen). 250 μl reagent and a similar volume of zirconia beads (0.7 mm, BioSpec Products; Carl Roth) were added to each worm pellet and mechanically lysed using a FastPrep‐24 homogenizer (MP Biomedicals; 6 m/s, 45 s at 4°C). The lysate was transferred to Eppendorf tubes containing 250 μl TRIzol, and 100 μl chloroform was added. The tubes were vortexed and incubated at RT for 3 min followed by a centrifugation for 15 min, 11,200 × g at 4°C. The aqueous top layer was transferred to fresh Eppendorf tubes, and an equal volume of 70% ethanol was added. The containing RNA was purified using the RNeasy Mini Kit (QUIAGEN) according to the manufacturer's protocol. RNA quality was assessed on a spectrophotometer. 1 μg RNA was cleared from gDNA by DNase I digestion (First Strand cDNA Synthesis Kit, Thermo Fisher Scientific). 200 ng DNase I digested RNA was used to generate cDNA with the SuperScript III First‐Strand Synthesis System (Thermo Fisher Scientific) according to the manufacturer's protocol using the supplied random hexamer primers.
Real‐time PCR
qRT–PCR was performed with SYBR™ Green PCR Master Mix (Thermo Fisher Scientific), a primer concentration of 5 μM, and 2 ng cDNA as template in a 10 μl reaction volume in a LightCycler 480 II (Roche). Each primer pair condition combination was run in triplicate, and the whole assay was performed four times. C t values were obtained from the LightCycler 480 Software (Roche, ver. 1.5.0.39) and relative quantification of gene expression levels calculated according to Livak and Schmittgen (2001) with cdc‐42 serving as the reference gene and C t values of N2 −HS samples as calibrator samples.
Immunostaining
Immunostaining was performed as previously described (Gidalevitz et al, 2006; Ben‐Zvi et al, 2009; Duerr, 2013). Shortly, animals were freeze‐cracked using polylysine‐coated slides (Thermo Fisher Scientific) and fixed in acetone. After fixation, samples were moved to filter baskets as described by Bolkova and Lanctot (2016). Nematodes were stained with Alexa Fluor™ 647‐phalloidin (Thermo Fisher Scientific) and with either anti‐paramyosin [5–23] or anti‐myosin heavy chain A [5–6] antibodies (Ardizzi & Epstein, 1987; Gidalevitz et al, 2006; Ben‐Zvi et al, 2009). Secondary antibodies were IgG goat anti‐mouse Alexa Fluor 488 (Thermo Fisher Scientific). Animals were imaged as described using 488 and 640 nm for excitation.
Fluorescence microscopy
For imaging, age‐synchronized animals were mounted on 5–10% agarose (VWR Chemicals) pads and immobilized in a solution containing 2.5 mM levamisole (Applichem) and nanosphere size standards (100 nm polystyrene beads, Thermo Fisher Scientific).
High‐sensitivity microscopy was performed using a Leica DMi8SD AF spinning disk microscope (Leica Microsystems) equipped with 488 nm (50 mW), 561 nm (50 mW), and 640 nm lasers (100 mW), an Hamamatsu Orca Flash 4.0 LT (C11440‐42U) camera and the MetaMorph Advanced Acquisition software (Molecular Devices) (Figs 1A, 2G, 3C, 4A, D and EV1B, EV2C, EV3A, EV4B–E, EV5B, C). Z‐stacks (0.2 μm steps) and single plane images were taken using a HC PL APO 63×/1.40–0.60 oil or 100×/1.40 Oil CS2 objective. For Figs 1B and 2A, and EV2A and E, Appendix Fig S1A, a widefield imaging system (Xcellence IX81, Olympus, Japan) equipped with an UPlanSApo 40×/0.95 and an Apo N 60×/1.49 oil objective was employed. Z‐stacks (0.2 μm steps) or single plane images were recorded with an Orca‐R2 EMCCD camera (Hamamatsu, Japan) using Xcellence software (Olympus, Japan). For Fig 3A and E, a widefield imaging system (CellSens Dimension, Olympus, Japan) equipped with an Apo N 60×/1.49 oil objective and Lumencor Spectra X was employed. Z‐stacks (0.2 μm steps) were recorded with an Orca‐R2 EMCCD camera (Hamamatsu, Japan) using CellSens Dimension software (Olympus, Japan). For Figs 2D and EV5E, Appendix Fig S1D, a Leica M205 FA microscope with a Leica DFC310FX camera and the Leica DFC Twain Software were used (Leica Microsystems). All further processing of acquired images was performed with ImageJ software (NIH). If not otherwise indicated, maximum projections of z‐stacks are shown.
Quantification of foci
Heat shock‐induced FLUCSM and α‐Syn::YFP foci were quantified using the widefield imaging system (Xcellence IX81 or CellSens Dimension, Olympus) and an Apo N 60×/1.49 oil objective. Total ROIs (region of interests) were defined by manually selecting muscle cells in maximum intensity projections of deconvolved z‐stacks (Wiener filter, Xcellence software). All original maximum intensity projections were processed by applying the same thresholding. For the FLUCSM quantification, the “analyze particles” tool in ImageJ (NIH) was used to determine the FLUCSM::GFP foci area relative to total ROI: Percent disaggregation was calculated as follows: . For the quantification of α‐Syn::YFP foci, the “analyze particles” function was also employed to calculate the mean foci fluorescence and foci area relative to the total ROI muscle area. Relative fluorescence of foci (relFluoFoci) was defined as the product of mean fluorescence intensity of foci area and foci area size divided through total ROI size: . Quantification of the number of Q35 foci was performed using a Leica M205 FA stereomicroscope (Leica Microsystems). The total number of Q35::YFP foci of all muscle cells was counted manually in age‐synchronized worms. Quantification of the number of FLUCSM foci during aging was performed using a Leica DMi8SD AF spinning disk microscope (Leica Microsystems). The number of animals that were positive for FLUCSM foci was counted manually.
Worm lysis, Western blot, and signal quantification
Worm lysis was performed as described (Sandhof et al, 2019). In short, worms were mechanically lysed using a FastPrep‐24 homogenizer (MP Biomedicals; 6.5 m/s, 60 s at 4°C) in lysis buffer (20 mM Tris, pH 7.5; 10 mM β‐mercaptoethanol; 1% Triton X‐100; supplemented with complete protease inhibitor cocktail (Roche)) with an appropriate amount of zirconia beads (0.7 mm, BioSpec Products; Carl Roth). The lysates were transferred into fresh Eppendorf tubes to remove beads and centrifuged (1,000 × g for 2 min at 4°C) in a tabletop centrifuge to remove carcasses. The protein concentration was determined using protein assay dye reagent concentrate (Bio‐Rad). Proteins were separated under denaturing conditions by SDS–PAGE and transferred onto a PVDF membrane (Carl Roth) by semi‐dry or wet blotting using standard protocols. For transgene detection, mouse monoclonal anti‐α‐Syn antibody (211, Santa Cruz Biotechnology) or anti‐GFP antibody (clone B34, BioLegend) was used. Anti‐actin antibody (clone C4, Sigma‐Aldrich) was used as loading control. Alkaline phosphatase (AP)‐conjugated anti‐mouse IgG secondary antibodies (Vector Laboratories) were used for subsequent ECF‐based detection (GE Healthcare). Western blot signal intensity was analyzed using the Image Studio Lite software (version 5.2.5, LI‐COR Biosciences) on results from 3 to 5 independent experiments.
Thrashing assay
In order to evaluate the physiological consequences of the knockdown of HSP‐110 by expression of the hairpin construct in temperature‐sensitive mutants and in combination with the expression of alpha synuclein or polyglutamine, the function of muscle cells was assessed by a thrashing assay as previously described (Sandhof et al, 2019). Briefly, age‐synchronized animals were transferred into M9 buffer from NGM plates and were given 1 min to adapt to the new environment. The number of swimming movements (thrashes) within 30 s was counted to determine the swimming speed. One thrash was defined as the entire motion from one side to the other. 10–15 worms were examined for each strain in three biological replicates.
Statistical analysis
For all experiments, at least three biological replicates were obtained for each strain tested. GraphPad Prism software was used to create graphs and to analyze the data. Data are presented as mean ± standard error of the mean (SEM). To determine whether there are statistically significant differences between strains or treatments, the following statistical tests were performed (following the recommendations of GraphPad Prism software). The two‐way analysis of variance (ANOVA) with Bonferroni, Sidak's, Dunnett's, or Tukey's multiple comparison post‐tests was used to compare two variables (strains and age) with each another. The one‐way ANOVA together with a Dunnett's or Tukey's multiple comparison test was used to compare every mean to a control mean.
Author contributions
Conceptualization—CN‐K; Data curation—JT, CAS, HMR, and CN‐K; Formal analysis—JT, CAS, and HMR; Funding acquisition—BB, AM, and CN‐K; Investigation—JT, CAS, HMR, and SD‐A; Methodology—JT, CAS, HMR, SD‐A, and CN‐K; Project administration—CN‐K; Resources—JT, CAS, HMR, SD‐A, AM, BB, and CN‐K; Software—JT and HMR; Supervision—AM, BB, and CN‐K; Validation—JT, CAS, HMR, and SD‐A; Visualization—JT, CAS, HMR, and CN‐K; Writing—original draft—CN‐K; and Writing—review & editing—JT, CAS, HMR, AM, BB, and CN‐K.
Conflict of interest
The authors declare that they have no conflict of interest.
Supporting information
Appendix
Expanded View Figures PDF
Table EV1
Source Data for Figure 4
Review Process File
Source Data for Figure 1
Source Data for Figure 2
Source Data for Figure 3
Acknowledgements
We thank Cindy Voisine, Sabine Gilch, Hermann Schätzl, and all members of the Nussbaum Lab for their helpful discussion and constructive comments on the manuscript. We also thank Prasad Kasturi and Ulrich Hartl for providing the FLUCSM::GFP strain. This study is part of the PROTEST‐70 project within the EU Joint Programme—Neurodegenerative Disease Research (JPND) project. This project is supported through the following funding organizations under the aegis of JPND—www.jpnd.eu: Germany, Bundesministerium für Bildung und Forschung (BMBF, 01ED1807A to B.B. and 01ED1807B to C.N.‐K.). This work was also funded by the Deutsche Forschungsgemeinschaft (DFG, German Research Foundation)—Project‐ID 201348542—SFB 1036 (TP20 to C.N.‐K. and TP08 to A.M. and B.B.) and the AMPro program of the Helmholtz Gemeinschaft (to B.B.).
EMBO Journal (2020) 39: e103954
Data availability
No datasets have been submitted to public repositories.
References
- Aguzzi A, Rajendran L (2009) The transcellular spread of cytosolic amyloids, prions, and prionoids. Neuron 64: 783–790 [DOI] [PubMed] [Google Scholar]
- Andreasson C, Fiaux J, Rampelt H, Mayer MP, Bukau B (2008) Hsp110 is a nucleotide‐activated exchange factor for Hsp70. J Biol Chem 283: 8877–8884 [DOI] [PubMed] [Google Scholar]
- Ardizzi JP, Epstein HF (1987) Immunochemical localization of myosin heavy chain isoforms and paramyosin in developmentally and structurally diverse muscle cell types of the nematode Caenorhabditis elegans . J Cell Biol 105: 2763–2770 [DOI] [PMC free article] [PubMed] [Google Scholar]
- Atarashi R, Wilham JM, Christensen L, Hughson AG, Moore RA, Johnson LM, Onwubiko HA, Priola SA, Caughey B (2008) Simplified ultrasensitive prion detection by recombinant PrP conversion with shaking. Nat Methods 5: 211–212 [DOI] [PubMed] [Google Scholar]
- Ben‐Zvi A, Miller EA, Morimoto RI (2009) Collapse of proteostasis represents an early molecular event in Caenorhabditis elegans aging. Proc Natl Acad Sci USA 106: 14914–14919 [DOI] [PMC free article] [PubMed] [Google Scholar]
- Bett C, Lawrence J, Kurt TD, Orru C, Aguilar‐Calvo P, Kincaid AE, Surewicz WK, Caughey B, Wu C, Sigurdson CJ (2017) Enhanced neuroinvasion by smaller, soluble prions. Acta Neuropathol Commun 5: 32 [DOI] [PMC free article] [PubMed] [Google Scholar]
- Bolkova J, Lanctot C (2016) Quantitative gene expression analysis in Caenorhabditis elegans using single molecule RNA FISH. Methods 98: 42–49 [DOI] [PubMed] [Google Scholar]
- Brenner S (1974) The genetics of Caenorhabditis elegans . Genetics 77: 71–94 [DOI] [PMC free article] [PubMed] [Google Scholar]
- Chernoff YO, Lindquist SL, Ono B, Inge‐Vechtomov SG, Liebman SW (1995) Role of the chaperone protein Hsp104 in propagation of the yeast prion‐like factor [psi+]. Science 268: 880–884 [DOI] [PubMed] [Google Scholar]
- Cohen E, Bieschke J, Perciavalle RM, Kelly JW, Dillin A (2006) Opposing activities protect against age‐onset proteotoxicity. Science 313: 1604–1610 [DOI] [PubMed] [Google Scholar]
- Collins SR, Douglass A, Vale RD, Weissman JS (2004) Mechanism of prion propagation: amyloid growth occurs by monomer addition. PLoS Biol 2: e321 [DOI] [PMC free article] [PubMed] [Google Scholar]
- Cushman M, Johnson BS, King OD, Gitler AD, Shorter J (2010) Prion‐like disorders: blurring the divide between transmissibility and infectivity. J Cell Sci 123: 1191–1201 [DOI] [PMC free article] [PubMed] [Google Scholar]
- David DC, Ollikainen N, Trinidad JC, Cary MP, Burlingame AL, Kenyon C (2010) Widespread protein aggregation as an inherent part of aging in C. elegans . PLoS Biol 8: e1000450 [DOI] [PMC free article] [PubMed] [Google Scholar]
- Dickinson DJ, Pani AM, Heppert JK, Higgins CD, Goldstein B (2015) Streamlined genome engineering with a self‐excising drug selection cassette. Genetics 200: 1035–1049 [DOI] [PMC free article] [PubMed] [Google Scholar]
- Duerr JS (2013) Antibody staining in C. elegans using “freeze‐cracking”. J Vis Exp 80: e50664 [DOI] [PMC free article] [PubMed] [Google Scholar]
- Fontaine SN, Zheng D, Sabbagh JJ, Martin MD, Chaput D, Darling A, Trotter JH, Stothert AR, Nordhues BA, Lussier A et al (2016) DnaJ/Hsc70 chaperone complexes control the extracellular release of neurodegenerative‐associated proteins. EMBO J 35: 1537–1549 [DOI] [PMC free article] [PubMed] [Google Scholar]
- Gao X, Carroni M, Nussbaum‐Krammer C, Mogk A, Nillegoda NB, Szlachcic A, Guilbride DL, Saibil HR, Mayer MP, Bukau B (2015) Human Hsp70 disaggregase reverses Parkinson's‐linked alpha‐synuclein amyloid fibrils. Mol Cell 59: 781–793 [DOI] [PMC free article] [PubMed] [Google Scholar]
- Gidalevitz T, Ben‐Zvi A, Ho KH, Brignull HR, Morimoto RI (2006) Progressive disruption of cellular protein folding in models of polyglutamine diseases. Science 311: 1471–1474 [DOI] [PubMed] [Google Scholar]
- Glover JR, Lindquist S (1998) Hsp104, Hsp70, and Hsp40: a novel chaperone system that rescues previously aggregated proteins. Cell 94: 73–82 [DOI] [PubMed] [Google Scholar]
- Griffith JS (1967) Self‐replication and scrapie. Nature 215: 1043–1044 [DOI] [PubMed] [Google Scholar]
- Grimminger V, Richter K, Imhof A, Buchner J, Walter S (2004) The prion curing agent guanidinium chloride specifically inhibits ATP hydrolysis by Hsp104. J Biol Chem 279: 7378–7383 [DOI] [PubMed] [Google Scholar]
- Gupta R, Kasturi P, Bracher A, Loew C, Zheng M, Villella A, Garza D, Hartl FU, Raychaudhuri S (2011) Firefly luciferase mutants as sensors of proteome stress. Nat Methods 8: 879–884 [DOI] [PubMed] [Google Scholar]
- van Ham TJ, Thijssen KL, Breitling R, Hofstra RM, Plasterk RH, Nollen EA (2008) C. elegans model identifies genetic modifiers of alpha‐synuclein inclusion formation during aging. PLoS Genet 4: e1000027 [DOI] [PMC free article] [PubMed] [Google Scholar]
- Hofmann J, Vorberg I (2013) Life cycle of cytosolic prions. Prion 7: 369–377 [DOI] [PMC free article] [PubMed] [Google Scholar]
- Hofmann JP, Denner P, Nussbaum‐Krammer C, Kuhn PH, Suhre MH, Scheibel T, Lichtenthaler SF, Schatzl HM, Bano D, Vorberg IM (2013) Cell‐to‐cell propagation of infectious cytosolic protein aggregates. Proc Natl Acad Sci USA 110: 5951–5956 [DOI] [PMC free article] [PubMed] [Google Scholar]
- Jarrett JT, Lansbury PT Jr (1993) Seeding “one‐dimensional crystallization” of amyloid: a pathogenic mechanism in Alzheimer's disease and scrapie? Cell 73: 1055–1058 [DOI] [PubMed] [Google Scholar]
- Jones GW, Tuite MF (2005) Chaperoning prions: the cellular machinery for propagating an infectious protein? BioEssays 27: 823–832 [DOI] [PubMed] [Google Scholar]
- Jung J, Kim J, Roh SH, Jun I, Sampson RD, Gee HY, Choi JY, Lee MG (2016) The HSP70 co‐chaperone DNAJC14 targets misfolded pendrin for unconventional protein secretion. Nat Commun 7: 11386 [DOI] [PMC free article] [PubMed] [Google Scholar]
- Kaimal JM, Kandasamy G, Gasser F, Andreasson C (2017) Coordinated Hsp110 and Hsp104 activities power protein disaggregation in Saccharomyces cerevisiae . Mol Cell Biol 37: e00027‐17 [DOI] [PMC free article] [PubMed] [Google Scholar]
- Kamath RS, Fraser AG, Dong Y, Poulin G, Durbin R, Gotta M, Kanapin A, Le Bot N, Moreno S, Sohrmann M et al (2003) Systematic functional analysis of the Caenorhabditis elegans genome using RNAi. Nature 421: 231–237 [DOI] [PubMed] [Google Scholar]
- Kampinga HH, Craig EA (2010) The HSP70 chaperone machinery: J proteins as drivers of functional specificity. Nat Rev Mol Cell Biol 11: 579–592 [DOI] [PMC free article] [PubMed] [Google Scholar]
- Kirstein J, Arnsburg K, Scior A, Szlachcic A, Guilbride DL, Morimoto RI, Bukau B, Nillegoda NB (2017) In vivo properties of the disaggregase function of J‐proteins and Hsc70 in Caenorhabditis elegans stress and aging. Aging Cell 16: 1414–1424 [DOI] [PMC free article] [PubMed] [Google Scholar]
- Knowles TP, Waudby CA, Devlin GL, Cohen SI, Aguzzi A, Vendruscolo M, Terentjev EM, Welland ME, Dobson CM (2009) An analytical solution to the kinetics of breakable filament assembly. Science 326: 1533–1537 [DOI] [PubMed] [Google Scholar]
- Krammer C, Kryndushkin D, Suhre MH, Kremmer E, Hofmann A, Pfeifer A, Scheibel T, Wickner RB, Schatzl HM, Vorberg I (2009a) The yeast Sup35NM domain propagates as a prion in mammalian cells. Proc Natl Acad Sci USA 106: 462–467 [DOI] [PMC free article] [PubMed] [Google Scholar]
- Krammer C, Schatzl HM, Vorberg I (2009b) Prion‐like propagation of cytosolic protein aggregates: insights from cell culture models. Prion 3: 206–212 [DOI] [PMC free article] [PubMed] [Google Scholar]
- Krobitsch S, Lindquist S (2000) Aggregation of huntingtin in yeast varies with the length of the polyglutamine expansion and the expression of chaperone proteins. Proc Natl Acad Sci USA 97: 1589–1594 [DOI] [PMC free article] [PubMed] [Google Scholar]
- Liu H, Naismith JH (2008) An efficient one‐step site‐directed deletion, insertion, single and multiple‐site plasmid mutagenesis protocol. BMC Biotechnol 8: 91 [DOI] [PMC free article] [PubMed] [Google Scholar]
- Livak KJ, Schmittgen TD (2001) Analysis of relative gene expression data using real‐time quantitative PCR and the 2(‐Delta Delta C(T)) Method. Methods 25: 402–408 [DOI] [PubMed] [Google Scholar]
- Lum R, Tkach JM, Vierling E, Glover JR (2004) Evidence for an unfolding/threading mechanism for protein disaggregation by Saccharomyces cerevisiae Hsp104. J Biol Chem 279: 29139–29146 [DOI] [PubMed] [Google Scholar]
- Masel J, Jansen VA, Nowak MA (1999) Quantifying the kinetic parameters of prion replication. Biophys Chem 77: 139–152 [DOI] [PubMed] [Google Scholar]
- Masison DC, Reidy M (2015) Yeast prions are useful for studying protein chaperones and protein quality control. Prion 9: 174–183 [DOI] [PMC free article] [PubMed] [Google Scholar]
- Mattoo RU, Sharma SK, Priya S, Finka A, Goloubinoff P (2013) Hsp110 is a bona fide chaperone using ATP to unfold stable misfolded polypeptides and reciprocally collaborate with Hsp70 to solubilize protein aggregates. J Biol Chem 288: 21399–21411 [DOI] [PMC free article] [PubMed] [Google Scholar]
- Mogk A, Bukau B, Kampinga HH (2018) Cellular handling of protein aggregates by disaggregation machines. Mol Cell 69: 214–226 [DOI] [PubMed] [Google Scholar]
- Morimoto RI (2019) Cell‐nonautonomous regulation of proteostasis in aging and disease. Cold Spring Harb Perspect Biol 12: a034074 [DOI] [PMC free article] [PubMed] [Google Scholar]
- Morley JF, Brignull HR, Weyers JJ, Morimoto RI (2002) The threshold for polyglutamine‐expansion protein aggregation and cellular toxicity is dynamic and influenced by aging in Caenorhabditis elegans . Proc Natl Acad Sci USA 99: 10417–10422 [DOI] [PMC free article] [PubMed] [Google Scholar]
- Nagy M, Fenton WA, Li D, Furtak K, Horwich AL (2016) Extended survival of misfolded G85R SOD1‐linked ALS mice by transgenic expression of chaperone Hsp110. Proc Natl Acad Sci USA 113: 5424–5428 [DOI] [PMC free article] [PubMed] [Google Scholar]
- Ness F, Ferreira P, Cox BS, Tuite MF (2002) Guanidine hydrochloride inhibits the generation of prion “seeds” but not prion protein aggregation in yeast. Mol Cell Biol 22: 5593–5605 [DOI] [PMC free article] [PubMed] [Google Scholar]
- Nollen EA, Brunsting JF, Song J, Kampinga HH, Morimoto RI (2000) Bag1 functions in vivo as a negative regulator of Hsp70 chaperone activity. Mol Cell Biol 20: 1083–1088 [DOI] [PMC free article] [PubMed] [Google Scholar]
- Nussbaum‐Krammer CI, Park KW, Li L, Melki R, Morimoto RI (2013) Spreading of a prion domain from cell‐to‐cell by vesicular transport in Caenorhabditis elegans . PLoS Genet 9: e1003351 [DOI] [PMC free article] [PubMed] [Google Scholar]
- Pezza JA, Serio TR (2007) Prion propagation: the role of protein dynamics. Prion 1: 36–43 [DOI] [PMC free article] [PubMed] [Google Scholar]
- Polier S, Dragovic Z, Hartl FU, Bracher A (2008) Structural basis for the cooperation of Hsp70 and Hsp110 chaperones in protein folding. Cell 133: 1068–1079 [DOI] [PubMed] [Google Scholar]
- Prusiner SB (1982) Novel proteinaceous infectious particles cause scrapie. Science 216: 136–144 [DOI] [PubMed] [Google Scholar]
- Prusiner SB (2012) Cell biology. A unifying role for prions in neurodegenerative diseases. Science 336: 1511–1513 [DOI] [PMC free article] [PubMed] [Google Scholar]
- Rampelt H, Kirstein‐Miles J, Nillegoda NB, Chi K, Scholz SR, Morimoto RI, Bukau B (2012) Metazoan Hsp70 machines use Hsp110 to power protein disaggregation. EMBO J 31: 4221–4235 [DOI] [PMC free article] [PubMed] [Google Scholar]
- Raviol H, Bukau B, Mayer MP (2006) Human and yeast Hsp110 chaperones exhibit functional differences. FEBS Lett 580: 168–174 [DOI] [PubMed] [Google Scholar]
- Saborio GP, Permanne B, Soto C (2001) Sensitive detection of pathological prion protein by cyclic amplification of protein misfolding. Nature 411: 810–813 [DOI] [PubMed] [Google Scholar]
- Sandhof CA, Hoppe SO, Druffel‐Augustin S, Gallrein C, Kirstein J, Voisine C, Nussbaum‐Krammer C (2019) Reducing INS‐IGF1 signaling protects against non‐cell autonomous vesicle rupture caused by SNCA spreading. Autophagy 16: 878–899 [DOI] [PMC free article] [PubMed] [Google Scholar]
- Satpute‐Krishnan P, Langseth SX, Serio TR (2007) Hsp104‐dependent remodeling of prion complexes mediates protein‐only inheritance. PLoS Biol 5: e24 [DOI] [PMC free article] [PubMed] [Google Scholar]
- Scior A, Buntru A, Arnsburg K, Ast A, Iburg M, Juenemann K, Pigazzini ML, Mlody B, Puchkov D, Priller J et al (2018) Complete suppression of Htt fibrilization and disaggregation of Htt fibrils by a trimeric chaperone complex. EMBO J 37: 282–299 [DOI] [PMC free article] [PubMed] [Google Scholar]
- Serio TR, Cashikar AG, Kowal AS, Sawicki GJ, Moslehi JJ, Serpell L, Arnsdorf MF, Lindquist SL (2000) Nucleated conformational conversion and the replication of conformational information by a prion determinant. Science 289: 1317–1321 [DOI] [PubMed] [Google Scholar]
- Shai N, Shemesh N, Ben‐Zvi A (2014) Remodeling of proteostasis upon transition to adulthood is linked to reproduction onset. Curr Genomics 15: 122–129 [DOI] [PMC free article] [PubMed] [Google Scholar]
- Shorter J (2011) The mammalian disaggregase machinery: Hsp110 synergizes with Hsp70 and Hsp40 to catalyze protein disaggregation and reactivation in a cell‐free system. PLoS ONE 6: e26319 [DOI] [PMC free article] [PubMed] [Google Scholar]
- Silva MC, Fox S, Beam M, Thakkar H, Amaral MD, Morimoto RI (2011) A genetic screening strategy identifies novel regulators of the proteostasis network. PLoS Genet 7: e1002438 [DOI] [PMC free article] [PubMed] [Google Scholar]
- Silveira JR, Raymond GJ, Hughson AG, Race RE, Sim VL, Hayes SF, Caughey B (2005) The most infectious prion protein particles. Nature 437: 257–261 [DOI] [PMC free article] [PubMed] [Google Scholar]
- Sousa R, Lafer EM (2015) The role of molecular chaperones in clathrin mediated vesicular trafficking. Front Mol Biosci 2: 26 [DOI] [PMC free article] [PubMed] [Google Scholar]
- Sparrer HE, Santoso A, Szoka FC Jr, Weissman JS (2000) Evidence for the prion hypothesis: induction of the yeast [PSI+] factor by in vitro‐ converted Sup35 protein. Science 289: 595–599 [DOI] [PubMed] [Google Scholar]
- Stricher F, Macri C, Ruff M, Muller S (2013) HSPA8/HSC70 chaperone protein: structure, function, and chemical targeting. Autophagy 9: 1937–1954 [DOI] [PubMed] [Google Scholar]
- Tessarz P, Mogk A, Bukau B (2008) Substrate threading through the central pore of the Hsp104 chaperone as a common mechanism for protein disaggregation and prion propagation. Mol Microbiol 68: 87–97 [DOI] [PubMed] [Google Scholar]
- True HL (2006) The battle of the fold: chaperones take on prions. Trends Genet 22: 110–117 [DOI] [PubMed] [Google Scholar]
- Tuite MF, Lindquist SL (1996) Maintenance and inheritance of yeast prions. Trends Genet 12: 467–471 [DOI] [PubMed] [Google Scholar]
- Walther DM, Kasturi P, Zheng M, Pinkert S, Vecchi G, Ciryam P, Morimoto RI, Dobson CM, Vendruscolo M, Mann M et al (2015) Widespread proteome remodeling and aggregation in aging C. elegans . Cell 161: 919–932 [DOI] [PMC free article] [PubMed] [Google Scholar]
- Wentink A, Nussbaum‐Krammer C, Bukau B (2019) Modulation of amyloid states by molecular chaperones. Cold Spring Harb Perspect Biol 11: a033969 [DOI] [PMC free article] [PubMed] [Google Scholar]
- Wickner RB (1994) [URE3] as an altered URE2 protein: evidence for a prion analog in Saccharomyces cerevisiae . Science 264: 566–569 [DOI] [PubMed] [Google Scholar]
- Wickner RB, Edskes HK, Bateman DA, Kelly AC, Gorkovskiy A, Dayani Y, Zhou A (2013) Amyloids and yeast prion biology. Biochemistry 52: 1514–1527 [DOI] [PMC free article] [PubMed] [Google Scholar]
- Winkler J, Tyedmers J, Bukau B, Mogk A (2012) Chaperone networks in protein disaggregation and prion propagation. J Struct Biol 179: 152–160 [DOI] [PubMed] [Google Scholar]
- Winston WM, Molodowitch C, Hunter CP (2002) Systemic RNAi in C. elegans requires the putative transmembrane protein SID‐1. Science 295: 2456–2459 [DOI] [PubMed] [Google Scholar]
- Yuan AH, Hochschild A (2017) A bacterial global regulator forms a prion. Science 355: 198–201 [DOI] [PMC free article] [PubMed] [Google Scholar]
Associated Data
This section collects any data citations, data availability statements, or supplementary materials included in this article.
Supplementary Materials
Appendix
Expanded View Figures PDF
Table EV1
Source Data for Figure 4
Review Process File
Source Data for Figure 1
Source Data for Figure 2
Source Data for Figure 3
Data Availability Statement
No datasets have been submitted to public repositories.